Abstract
Nuclear organelles, unlike many cytoplasmic organelles, lack investing membranes and are thus in direct contact with the surrounding nucleoplasm. Because the properties of the nucleoplasm and nuclear organelles influence the exchange of molecules from one compartment to another, it is important to understand their physical structure. We studied the density of the nucleoplasm and the density and permeability of nucleoli, Cajal bodies (CBs), and speckles in the Xenopus oocyte nucleus or germinal vesicle (GV). Refractive indices were measured by interferometry within intact GVs isolated in oil. The refractive indices were used to estimate protein concentrations for nucleoplasm (0.106 g/cm3), CBs (0.136 g/cm3), speckles (0.162 g/cm3), and the dense fibrillar region of nucleoli (0.215 g/cm3). We determined similar protein concentrations for nuclear organelles isolated in aqueous media, where they are no longer surrounded by nucleoplasm. To examine the permeability of nuclear organelles, we injected fluorescent dextrans of various molecular masses (3–2000 kDa) into the cytoplasm or directly into the GV and measured the extent to which they penetrated the organelles. Together, the interferometry and dextran penetration data show that organelles in the Xenopus GV have a low-density, sponge-like structure that provides access to macromolecules from the nucleoplasm.
INTRODUCTION
The interphase nucleus contains chromosomes, nucleoli, and a variety of smaller organelles or bodies revealed by immunostaining and in situ hybridization. Two of the smaller bodies, Cajal bodies (CBs) and speckles or interchromatin granule clusters, are found in numerous cell types in both animals and plants, and undoubtedly play important roles in transcription and RNA processing within the nucleus (Gall, 2000; Gall, 2003; Lamond and Spector, 2003). Others, such as PML bodies (Maul et al., 2000; Ruggero et al., 2000), the perinucleolar compartment (Huang, 2000), and paraspeckles (Fox et al., 2002), also may occur widely, but so far have been studied primarily in cultured mammalian cells.
Green fluorescent protein (GFP)-labeled proteins and fluorescently tagged RNAs now permit identification and study of nuclear components within living cells. Among the important facts to emerge from such studies is that many proteins and RNAs move by diffusion within the nucleus and exchange between nuclear bodies and the surrounding nucleoplasm with half-times ranging from a few seconds to several minutes (Phair and Misteli, 2000; Carmo-Fonseca et al., 2002; Dundr et al., 2002, 2004; Handwerger et al., 2003; Deryusheva and Gall, 2004; Shav-Tal et al., 2004). In addition, nuclear bodies themselves sometimes move around inside the nucleus in ways that are not expected from simple diffusion (Boudonck et al., 1999; Platani et al., 2000; Muratani et al., 2002; Platani et al., 2002; Sleeman et al., 2003).
Despite these advances, there is a surprising lack of information about the basic physical parameters of the nucleoplasm and nuclear organelles. Microscopical measurements are hampered by the small size of nuclei in cultured cells, with consequent physical crowding of subnuclear structures, as well as the small dimensions of the nuclear organelles themselves. Some of the technical problems can be overcome by use of larger nuclei, particularly the amphibian oocyte nucleus or germinal vesicle (GV), which reaches a diameter of ∼400 μm and a volume of ∼40 nl. The potential of these large nuclei for physical studies was appreciated many years ago (Duryee, 1937), and useful information was obtained from GVs isolated in aqueous solutions. It was soon realized, however, that dramatic changes occur shortly after GVs are removed from the oocyte, including swelling, massive loss of nucleoplasm (Battin, 1959; Macgregor, 1962), and gelation due to actin polymerization (Clark and Rosenbaum, 1979). For these reasons, GVs isolated in aqueous media are not suitable for many types of study.
Paine and his coworkers developed a different approach, based on isolation of GVs in mineral oil (Lund and Paine, 1990; Paine et al., 1992). GVs isolated in oil retain their normal morphology as well as their full complement of solutes and macromolecules. Remarkably, they continue to transcribe RNA for many hours and can be induced to undergo meiotic breakdown when placed in contact with cytoplasm from progesterone-stimulated oocytes. We used oil-isolated GVs to study the movement of molecules between CBs and the nucleoplasm (Handwerger et al., 2003; Deryusheva and Gall, 2004). However, the physical properties of oil-isolated nuclei and their organelles have not been extensively investigated. Here, we report measurements made with an interferometer microscope on the density of the nucleoplasm and nuclear organelles in oil-isolated GVs of Xenopus laevis. Our data show that the nucleoplasm has a relatively low protein concentration, ∼0.11 g/cm3 and that nuclear organelles are only slightly denser, ranging from ∼0.14 to 0.22 g/cm3 for CBs, speckles, and nucleoli. Finally, by observing oil-isolated GVs that had been injected with fluorescent dextran, we found that nuclear organelles have a highly porous structure that presents a minimal barrier to penetration by macromolecules.
MATERIALS AND METHODS
Animals and Oocytes
Adult female X. laevis (Xenopus 1, Ann Arbor, MI) were anesthetized in 0.1% methanesulfonate salt of 3-aminobenzoic acid ethyl ester (MS222; Sigma-Aldrich, St. Louis, MO) for ∼20 min, and a piece of ovary was surgically removed. Oocytes were stored in OR2 saline (Wallace et al., 1973) at 18°C until used. OR2 consists of 82.5 mM NaCl, 2.5 mM KCl, 1.0 mM CaCl2, 1.0 mM MgCl2, 1.0 mM Na2HPO4, 5.0 mM HEPES, pH 7.8; ampicillin (100 mg/l) and streptomycin (100 mg/l) were added to retard bacterial growth.
Saline-isolated GVs
Single GVs were isolated in a Ca2+-free saline solution (isolation medium) consisting of 83.0 mM KCl, 17.0 mM NaCl, 6.5 mM Na2HPO4, 3.5 mM KH2PO4, 1.0 mM MgCl2, 1.0 mM dithiothreitol. They were transferred to a more dilute solution (spreading solution) consisting of 20.7 mM KCl, 4.3 mM NaCl, 1.6 mM Na2HPO4, 0.9 mM KH2PO4, 1.0 mM MgCl2, 1.0 mM dithiothreitol, 0.1% formaldehyde. The nuclear envelope was removed, and the contents of the GV were allowed to settle onto a glass slide. The slide was then centrifuged (5000 × g) for 30 min to attach the nuclear organelles to the glass. For interferometric measurements, the preparation was returned to isolation medium. Details of the isolation procedure are given in Gall (1998).
Oil-isolated GVs
Single oocytes were transferred from OR2 saline to a piece of Whatman #1 filter paper (Whatman, Maidstone, England). Most of the aqueous medium surrounding the oocyte was absorbed by the filter paper. The oocyte was then transferred to a 35-mm plastic Petri dish containing mineral oil (EC no 232-455-8; Sigma-Aldrich) or perfluorocarbon + chlorofluorocarbon oil (Series AAA refractive index oil; Cargille Laboratories, Cedar Grove, NJ). The GV was removed manually with jeweler's forceps (Lund and Paine, 1990; Paine et al., 1992). Individual GVs were transferred to a standard 3 × 1-in. glass microscope slide in 5 μl of oil and gently squashed under a 22-mm2 glass coverslip (thickness #1). After the oil had spread to the edges of the coverslip, the sample was observed in the microscope.
Dextran Injections
Needles were pulled from capillary tubing (0.5-mm inner diameter, 1.2-mm outer diameter) with a vertical pipette puller (David Kopf Instruments, Tujunga, CA). Fluorescein-labeled dextrans of various molecular masses from 3 to 2000 kDa were purchased from Molecular Probes (Eugene, OR). They were dissolved at a concentration of 0.1–10 mg/ml in phosphate-buffered saline (135 mM NaCl, 2.5 mM KCl, 4.3 mM Na2HPO4, 1.5 mM KH2PO4, pH 7.2). Then, 23 nl of solution was injected into the cytoplasm or 9.2 nl into the nucleus of ∼1-mm-diameter oocytes, by using a dissecting microscope in combination with a Nanoject microinjection apparatus (Drummond Scientific, Broomall, PA). Oocytes were held overnight at 18°C in OR2 medium before GVs were isolated in oil.
Microscopy
We used a Zeiss double beam interferometer microscope based on the design of Jamin and Lebedeff (Piller, 1962). In this instrument, a beam splitter in the condenser produces two widely separated beams that pass through the specimen plane and are reunited by a second beam splitter in the objective. The specimen beam passes through the object under investigation, whereas the reference beam passes through an unobstructed area some distance away (56 μm in the 100×, numerical aperture 1.0 objective used in our studies). Initial alignment of the microscope was made with “white” light from a tungsten lamp; for quantitative measurements, a 546-nm interference filter was placed in the light path. The OPD between the specimen and reference beams was measured by the method of deSénarmont, which uses a quarter wave plate and a graduated rotating analyzer (Murphy, 2001). To determine the refractive index of the specimen (no) from the OPD, one must know both the specimen thickness and the refractive index of the medium surrounding the specimen. For the nuclear organelles involved in this study, we measured the diameter and used this as a substitute for the thickness, on the assumption that the object was spherical. The refractive indices of saline solutions, sucrose solutions, and oils were measured with an Abbe refractometer (model 3L; Bausch and Lomb, Rochester, NY). The refractive index of nucleoplasm was determined experimentally. For measurement of dextran concentrations, we examined oil-isolated GVs with a laser scanning confocal microscope (TCS SP2; Leica Microsystems, Exton, PA).
RESULTS
A primary aim of the current study was to determine the protein concentration of the nucleoplasm and several nuclear organelles. We began with measurements on oil-isolated GVs, whose properties should be close to those of GVs within the living cell (Figure 1, A and B). We then examined nuclear organelles that had been isolated in an amphibian Ringer's solution according to a commonly used protocol. These isolated organelles look normal morphologically (Figure 1C), and they retain many specific proteins. However, the possible loss of mass during isolation has never been evaluated. In all experiments, we measured the optical path difference (OPD) between individual nuclear organelles and the medium in which they resided. From the OPD, we calculated the refractive index of the organelle and from the refractive index we estimated the protein concentration (see “Theory”).
Figure 1.
Nucleoli (N), CBs, and speckles (S) from the GV of X. laevis. (A and B) Phase contrast and DIC images of the same region from an oil-isolated GV. Note the low contrast of the three nuclear organelles, especially the CBs. Contrast in both types of microscope depends on the OPD between specimen and surrounding medium. Both images were taken with a Micromax charge-coupled device camera (Princeton Instruments, Trenton, NJ) and digitally enhanced to bring out details using IPLab Spectrum software (Scanalytics, Fairfax, VA). (C) Organelles isolated in an aqueous medium and centrifuged onto a microscope slide. In this case, the nucleoplasm has been replaced by saline solution. The objects referred to here as speckles were called B-snurposomes in our earlier publications. They consist of small particles (Figure 8), whose size and composition are similar to those of the interchromatin granules that constitute the speckles of somatic nuclei (Lamond and Spector, 2003).
Nucleoplasm
When a Xenopus GV is isolated in mineral oil and squashed gently under a 22-mm2 coverslip (#1 thickness), it spreads until it covers an area of ∼4 mm2 with an estimated thickness of ∼10 μm. The nucleoli and speckles are relatively easy to find within the GV by phase contrast or differential interference contrast (DIC) microscopy, but CBs are barely detectable and the lampbrush chromosomes are invisible (Figure 1, A and B). In principle, there could be other invisible structures. However, no other abundant organelles have been identified in the GV by conventional fixation and staining, immunofluorescence, or isolation of organelles in aqueous media. Regardless, measurement of the refractive index of the nucleoplasm is not influenced by the presence of structures with the same refractive index.
At first, we tried to measure the refractive index of the nucleoplasm by comparison with that of the mineral oil (n = 1.465) in which the GV was squashed. Such a measurement requires simultaneous evaluation of the sample thickness and the OPD between nucleoplasm and oil. The OPD was measured with the interferometer microscope and found to be approximately three wavelengths of green light (3 fringes at the edge of the GV). However, the OPD varied around the perimeter of the GV by 20–30%, implying that we could not assume a constant thickness, even in a relatively local area.
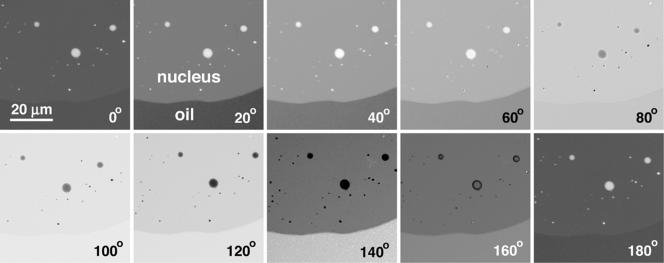
Consequently we adopted the simpler and more sensitive method of mounting GVs in oils of different refractive index, until we found one in which the nucleoplasm became invisible. Figure 2 shows a GV mounted in oil of n = 1.3512 ± 0.0002. In this case, the GV has a slightly higher refractive index than the oil. As the compensator on the interferometer microscope is rotated through 180°, the intensities of the oil and nucleoplasm trace out sine curves that are slightly out of phase with respect to each other. In contrast, when a GV was mounted in oil of n = 1.3544 ± 0.0002, there was no intensity difference between the nucleoplasm and oil at any setting of the compensator. Thus, under our conditions of measurement, the nucleoplasm has a refractive index of 1.3544, and we have used this value in subsequent calculations.
Figure 2.
Small portion of a GV isolated in oil. A Xenopus GV was isolated and gently squashed in oil of refractive index = 1.3512. It was then observed in the interferometer microscope. A small part of the nucleus, which contains nucleoli and speckles, occupies the upper portion of the images. The boundary between the nucleus and oil runs horizontally across the lower part of the images. Charge-coupled device images were taken at 20° intervals, as the compensator was rotated through 180° (= 1 wavelength of retardation). Quantitative analysis showed that in this sample the nucleoplasm was retarded by 3.8° relative to the oil. That is, the intensity of the nucleoplasm at n° was equal to the intensity of the oil at (n + 3.8)°. When a GV is mounted in oil of refractive index = 1.3544, the nucleoplasm and oil have identical intensities at all settings of the compensator.
To estimate protein concentration from refractive index, we must make the simplifying assumption that the nucleoplasm consists only of water, protein, and small solutes at ∼0.1 M concentration (see Discussion). If this is the case, the protein concentration of the nucleoplasm can be estimated as (1.3544–1.3347)/0.185 cm3/g = 0.106 g/cm3, where 1.3347 is the measured refractive index of a 0.1 M salt solution and 0.185 cm3/g is the specific refractive increment of an average protein (see “Theory”). The validity of these assumptions and an estimate of the error in our measurements are considered in Discussion.
Nuclear Organelles within the GV
As mentioned, the nucleoli, speckles, and especially the CBs have low contrast when viewed inside an oil-isolated GV by phase contrast or DIC microscopy (Figure 1, A and B). Because contrast in both types of microscope depends on optical path differences between the specimen and the medium surrounding it, we know a priori that the refractive indices and hence the protein concentrations of the nuclear organelles are close to that of the nucleoplasm.
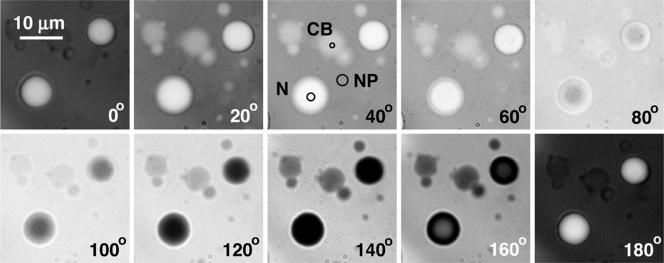
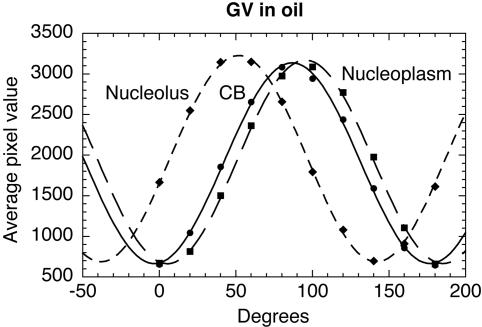
The interferometer microscope provides quantitative evidence for this conclusion. GV squash preparations were made in mineral oil, and various fields were selected for further analysis. Digital images of each field were taken at 20° intervals, as the analyzer was rotated from 0 to 180°, corresponding to one wavelength of retardation (Figure 3). Average pixel values through the centers of organelles were determined, and the values were plotted as a function of the analyzer position (Figure 4). The same was done for an area of surrounding nucleoplasm. By fitting the data to sine curves, one obtains highly precise determinations of the OPD (phase shift) between an organelle and the nucleoplasm.
Figure 3.
Nucleoli, CBs, and speckles in an oil-isolated GV. Images were taken with a Micromax charge-coupled device camera at 20° intervals of the compensator on the interferometer microscope. For quantitative analysis, a small spot was chosen in the center of a nucleolus and a CB, and in a blank region of nucleoplasm (see small circles labeled N, CB, and NP in the 40° image). The intensities of these spots were measured in all the images.
Figure 4.
Quantitative analysis of organelles in an oil-isolated GV. Intensities through the centers of the organelles in Figure 3 were plotted as a function of the compensator setting. The experimental values were then fitted to sine curves using the KaleidaGraph analysis program (Synergy Software, Reading, PA). The OPD of each organelle is given by the shift of its sine curve relative to that of the nucleoplasm (shifts to the left correspond to increases in OPD). For example, the OPD of the nucleolus is 43.5°, which can be expressed as 43.5/180 = 0.242 wavelength of green light (0.546 μm) or 0.132 μm.
To obtain a refractive index estimate from the OPD, one must know the thickness of the measured organelles (OPD = nt, where n is the refractive index of an object and t is its thickness). Fortunately, the three organelles in which we are interested tend to be nearly spherical (Figure 3), so we can use diameter as a measure of thickness. The major caveat is that the larger nucleoli may be somewhat asym-metrical and have diameters greater than the thickness of the preparation (∼10 μm). Therefore, we limited our measurements to smaller nucleoli that look round as viewed in the field of the microscope.
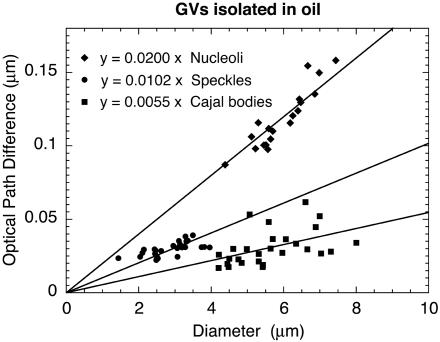
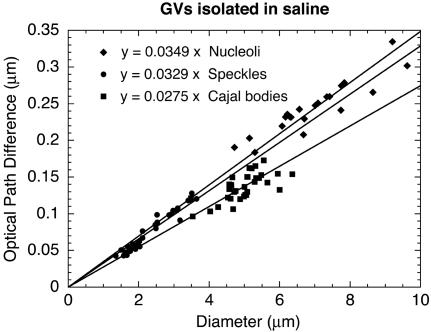
All data for nucleoli, CBs, and speckles are presented in Figure 5, where the OPD for each measured organelle is plotted against its diameter (thickness). The data for the three organelles were then fitted to straight lines passing through the origin. The slope of each of these lines is the difference in refractive index between the organelle and the nucleoplasm: OPD = t(no - 1.3544).
Figure 5.
OPD as a function of organelle diameter (GV in oil). The OPD of a homogeneous organelle relative to the nucleoplasm should increase linearly with its thickness (t) in the z-axis. Because there is no easy way to measure the thickness, we assumed that organelles are spherical and plotted OPD as a function of diameter measured in the x,y plane. The data for each organelle were fitted to a straight line passing through the origin. The slope of each line (OPD/t) can be used to estimate the refractive index of the organelle.
CBs had the lowest refractive index, 1.3599, followed by speckles, 1.3646, and nucleoli, 1.3744. These refractive indices correspond to protein concentrations of 0.136, 0.162, and 0.215 g/cm3, respectively, compared with 0.106 g/cm3 for the nucleoplasm. These estimates refer to the total protein concentration inside the organelle, which will include organelle-restricted proteins plus any nucleoplasmic proteins that have penetrated the organelle.
Isolated Nuclear Organelles
For in situ hybridization, immunofluorescence, and other cytological procedures, GVs are usually removed from the cytoplasm in 0.1 M isolation medium and transferred to 0.025 M spreading medium with 0.1% formaldehyde (Gall, 1998). Under these conditions, the nucleoplasm disperses, and the preparation can be centrifuged, so as to attach the organelles to a conventional microscope slide. To determine the protein concentration of isolated organelles, we measured the OPD of nucleoli, CBs, and speckles in centrifuged preparations mounted in isolation medium (without formaldehyde). The central fibrillar and peripheral granular regions of the nucleoli are often distinguishable in these preparations, the granular region being less dense than the fibrillar. For measurement we chose smaller nucleoli in which the fibrillar region predominates. The diameter of each organelle was measured and used as an estimate of its thickness in the z-direction.
The data for CBs, speckles, and nucleoli were fitted separately to straight lines passing through the origin (Figure 6). As before, the slopes of these lines are the differences in refractive index between the organelles and the isolation medium (n = 1.3347): OPD = t(no - 1.3347).
Figure 6.
OPD as a function of organelle diameter (organelles in saline). GVs were isolated in a saline solution (isolation medium), the nuclear envelope was removed, and organelles were centrifuged onto a glass slide. The OPDs of organelles were measured relative to the surrounding saline solution. As in Figure 5, OPDs were plotted as a function of organelle diameter, and the data were fitted to a straight line passing through the origin. Refractive indices estimated for these isolated organelles are similar to those measured within intact GVs.
The calculated refractive indices for isolated CBs, speckles, and nucleoli were 1.3622, 1.3676, and 1.3696, respectively, which correspond to 0.149, 0.178, and 0.189 g/cm3 protein. For CBs and speckles, these values are slightly higher and for nucleoli slightly lower than those obtained for organelles in the intact GV. We can conclude that nuclear organelles isolated in our standard medium have roughly the same density as those in the living nucleus, suggesting that they retain most of their mass during isolation.
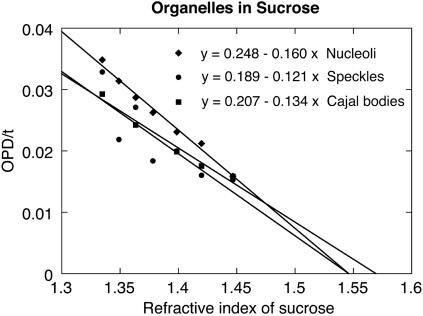
We also measured the three isolated organelles in sucrose solutions of different concentration and hence of different refractive index. The advantage of this procedure (compared with a single measurement in isolation medium) is that the concentration of protein can be estimated directly without any assumption about the specific refractive increment (see “Theory”). In practice, standard GV spreads were made in isolation medium, and the medium was then replaced with a solution of 0, 20, 45, 60, or 80% sucrose in isolation medium (wt/vol). The OPD of individual CBs, speckles, and nucleoli was measured and plotted as before as a function of organelle diameter. The data for each sucrose concentration were fitted to straight lines passing through the origin, whose slope (OPD/t) is the difference in refractive index between the object and the solution. These values were then plotted against refractive index of the sucrose solution (Figure 7). For an impermeable object, the data will fall on a straight line with a slope of –1, the x- and y-intercepts both being equal to the refractive index of the object. For an object that is freely permeable to the solute (and does not change in volume), the plot of OPD/t versus refractive index is also a straight line, but the slope will be less than –1. In the ideal case, the absolute value of the slope will equal the volume fraction occupied by macromolecules and the x-intercept will be the refractive index of the dry macromolecules (see “Theory”).
Figure 7.
OPD/t as a function of refractive index of the medium. GVs were isolated in saline solution (isolation medium), the nuclear envelope was removed, and organelles were centrifuged onto a glass slide. They were then mounted in sucrose solutions of different refractive indices, and OPDs of the organelles were measured. The average OPD/t was estimated for each organelle for each sucrose concentration (as in Figures 5 and 6). OPD/t was then plotted as a function of refractive index of the sucrose solutions. The slope of this line is a measure of the volume fraction occupied by macromolecules in the organelle, and the x-intercept gives an estimate of the refractive index of the dry macromolecules.
The data for nucleoli, speckles, and CBs are summarized in Table 1. Column 1 gives the volume fraction occupied by macromolecules in each organelle. Column 2 converts this volume fraction to protein concentration on the assumption that the entire organelle mass consists of protein with an anhydrous density of 1.27 g/cm3 (Barer and Joseph, 1954). The protein concentrations determined by this method agree well with those made from single measurements in isolation medium without sucrose. Finally, Column 3 gives the x-intercept of the plot of OPD/t versus refractive index. This intercept is the refractive index of a solution that would exactly match the refractive index of the dry organelle contents. The experimental values are 1.57, 1.55, and 1.55 for CBs, speckles, and nucleoli, respectively, close to the range of measured refractive indices for dry proteins (∼1.54–1.58) (Hale, 1958).
Table 1.
Summary of data for nuclear organelles measured in sucrose solutions
| Volume fraction | Protein concn (g/cm3) | Dry refractive index | |
|---|---|---|---|
| Cajal bodies | 0.121 | 0.154 | 1.57 |
| Speckles | 0.134 | 0.170 | 1.55 |
| Nucleoli | 0.160 | 0.203 | 1.55 |
Column 1 gives the volume fraction occupied by macromolecules in each organelle (slope of OPD/t against refractive index; Figure 7). Column 2 converts this volume fraction to protein concentration on the assumption that each organelle consists entirely of protein with a dry density of 1.27 g/cm3 (Barer and Joseph, 1954). Column 3 gives the refractive index of a solution that would match the refractive index of the dry organelle contents (the x-intercept in Fig. 7).
Permeability of Nuclear Organelles
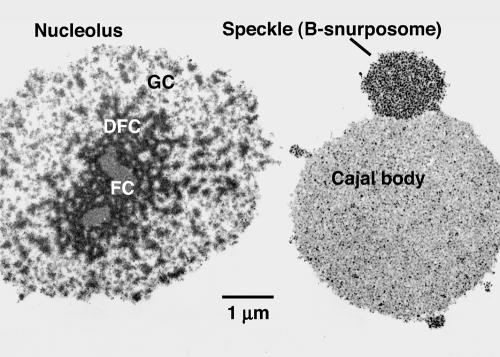
Observations with the electron microscope show that there are no membranes surrounding the nuclear organelles. Figure 8 is a thin section through a nucleolus, a speckle, and a CB that were centrifuged onto a glass slide before embedding. There are no membranes associated with these isolated organelles, and the same is true of organelles examined in sections of intact GVs.
Figure 8.
Electron micrograph of organelles from the GV. Organelles from a Xenopus GV were centrifuged onto a microscope slide, fixed, embedded, and sectioned for electron microscopy. The thin section shows that there are no membranes around the three major organelles: nucleoli, speckles, and CBs. Thus, the interior of the organelles seems to be accessible to the external medium. Injection experiments show that dextran does, in fact, penetrate the organelles in unfixed GVs (Figure 9). FC, DFC, and GC refer to the fibrillar center, dense fibrillar component, and granular component of the nucleolus, respectively.
To assess whether the lack of enveloping membranes means that these organelles are easily penetrated by macromolecules, we carried out a series of experiments with fluorescent dextrans. FITC-dextrans ranging in mass from 3 to 2000 kDa were injected into Xenopus oocytes. The smaller dextrans (3, 10, and 40 kDa) were injected into the cytoplasm, from which they readily diffused into the GV. The larger dextrans (70, 500, and 2000 kDa) were injected directly into the GV, because they are too large to pass through the nuclear pores (Paine et al., 1992). After the injected oocytes had incubated overnight, GVs were isolated in oil, gently squashed under a coverslip, and observed by confocal microscopy.
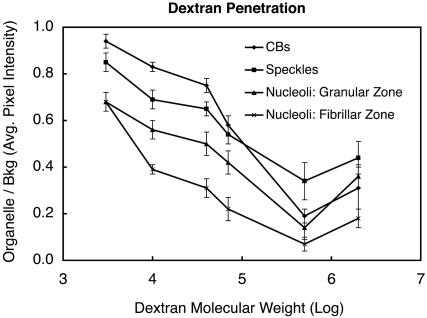
In the confocal images (Figure 9, top row), regions of high fluorescent dextran concentration are bright, and regions of low concentration are dark. All the dextrans penetrated into the three nuclear organelles to a certain extent. In no case, however, was the concentration of dextran within an organelle higher than in the nucleoplasm. The extent of penetration was measured by comparing the average fluorescence intensity within an organelle to that in the nucleoplasm. The ratio of intensities was then plotted as a function of molecular weight of the dextran (Figure 10). In general, the ratio fell off as the molecular weight increased. The ratio was very high for 3-kDa dextran, reaching values of ∼0.95, 0.85, and 0.68 for CBs, speckles, and nucleoli, respectively. However, even 2000-kDa dextran gave ratios of 0.18–0.44 for these organelles, suggesting that they all have a highly porous structure. It is unclear why 500-kDa dextran consistently penetrated less well than 2000-kDa dextran, even though we carried out size exclusion purification to remove higher molecular weight contaminants.
Figure 9.
Dextran penetration into nuclear organelles. Fluorescent dextrans of different sizes were injected into the cytoplasm (3, 10, and 40 kDa) or directly into the GV (70, 500, and 2000 kDa). After overnight equilibration, GVs were isolated in oil and squashed under a coverslip. Single optical sections of nuclear organelles were taken by confocal microscopy. Bright regions of the images correspond to high fluorescent dextran concentration. In every case, some fluorescence is seen inside the organelles, confirming that dextran has penetrated. Arrowheads point to CBs.
Figure 10.
Quantitative analysis of dextran penetration. Images similar to those in Figure 9 were used for quantitation of dextran penetration. Fluorescence intensity within the CBs, speckles, and the granular and dense fibrillar compartments of the nucleoli was compared with the intensity of the nucleoplasm. The ratio was plotted as a function of dextran size. In general, the extent of penetration fell off as a function of dextran size, except for the unexplained greater penetration of 2000-kDa dextran compared with 500-kDa. The extent of penetration varied inversely with the physical density of the organelle (CBs > speckles > nucleoli).
When an exogenously supplied molecule reaches a higher concentration inside a nuclear organelle than in the nucleoplasm, we can be confident that it preferentially binds to some component of the organelle. On the other hand, when the concentration is lower within the organelle, as in our dextran experiments, it is still possible that true binding has occurred but that saturation of binding sites has been achieved. To assess this latter possibility, we injected oocytes with 70-kDa dextran at three different concentrations: 0.1, 1.0, and 10 mg/ml. The intensity of fluorescence inside the organelles was then measured relative to that of the nucleoplasm. As shown in Table 2, the ratio for each organelle was the same regardless of the concentration of dextran in the nucleoplasm. These data show that there is no selective binding of 70-kDa dextran over a 100-fold range in concentration, and they permit us to use fluorescence intensity as a measure of the internal volume available to the dextran.
Table 2.
Penetration of 70-kDa dextran into nuclear organelles
| Dextran concn | Cajal bodies | Speckles | Nucleoli (fibrillar) | Nucleoli (granular) |
|---|---|---|---|---|
| 10 | 0.80 ± 0.04 | 0.60 ± 0.06 | 0.39 ± 0.08 | 0.53 ± 0.04 |
| 1.0 | 0.86 ± 0.02 | 0.76 ± 0.04 | 0.41 ± 0.08 | 0.62 ± 0.10 |
| 0.1 | 0.80 ± 0.03 | 0.70 ± 0.06 | 0.48 ± 0.06 | 0.64 ± 0.05 |
Twenty-three nanoliters of fluorescent dextran was injected into the cytoplasm of Xenopus oocytes at three concentrations (10, 1.0, and 0.1 mg/ml). After overnight equilibration, GVs were isolated in oil and the penetration of dextran into nuclear organelles was measured as in Figure 9. The extent of penetration is similar for all three concentrations of dextran. These data show that there is no selective binding of dextran over a 100-fold range of concentrations and validate the use of fluorescence intensity as a measure of internal volume available to the dextran.
DISCUSSION
Nucleoplasm
Nucleoplasm is generally defined as the medium that occupies the space between the chromosomes and other nuclear organelles. This definition is difficult to apply to most somatic nuclei, either theoretically or practically, because the chromosomes and nucleoli take up such a large fraction of the nuclear volume. The situation is very different in GVs, where the nuclear organelles occupy a relatively small volume, despite their gigantic size. For this reason, the GV provides a convenient object for studying the physical and chemical properties of nucleoplasm. Here, we concentrated on a simple parameter, the refractive index. Using the interferometer microscope and what is essentially an “immersion” method, we found that the refractive index of nucleoplasm in the Xenopus GV is 1.3544.
The accuracy of this determination depends on two factors: the accuracy with which we know the refractive index of the oil, and the sensitivity of the interferometry measurement. The refractive index of the oil can be measured to an accuracy of ±0.0002 with a standard Abbe refractometer. With the interferometer microscope it is easy to detect by eye and to measure an OPD between oil and nucleoplasm of ∼1°, where 180° = 1 wavelength of green light, or 0.546 μm (Figure 4). If we assume that a squashed GV is ∼10 μm in thickness, then an OPD of 1° corresponds to a refractive index difference of ∼0.0003 between the oil and nucleoplasm. Thus, we know the refractive index of the nucleoplasm to about the same accuracy as we know the refractive index of the oil used for a standard.
The refractive index of a solution is determined by the solvent (in this case H2O = 1.3325 at 25°C), plus contributions from all the solutes, including ions, small organic molecules, and macromolecules. We know from earlier measurements of newt GVs that the total concentration of Na+ and K+ ions is ∼0.1 M (Whitley and Muir, 1974). Our standard 0.1 M nuclear isolation medium has a measured refractive index of 1.3347. If we assume that all the remaining refractive index is contributed by protein with a specific refractive increment of 0.185 cm3/g, we can calculate that the protein concentration of the Xenopus nucleoplasm is about (1.3544–1.3347)/0.185 = 0.106 g/cm3. This estimate of protein concentration is based on two measured refractive indices and the assumed value for specific refractive increment. As discussed, the experimental error in the refractive index measurements is very small, ±0.02%. Measured values for the specific refractive increment of a variety of proteins fall within ∼2% of the mean value (Barer and Joseph, 1954), leading to a possible error of ∼ 0.002 g/cm3 in the estimated protein concentration.
We know that the total concentration of RNA (Edstrom and Gall, 1963) and DNA (Gall, 1969) in amphibian GVs is trivial relative to protein, but we do not know about possible contributions from small molecules other than ions. Thus, our estimate of protein concentration could be slightly high. Considering all sources of error, both experimental and assumptions about composition, we suggest that the protein concentration in the Xenopus GV is almost certainly between 0.10 and 0.11 g/cm3, our best estimate being 0.106 ± 0.002 g/cm3.
Sponge Model
As already mentioned, organelles within the nucleus lack investing membranes (Figure 8). Our studies with dextrans of different molecular weight show that these organelles are readily permeable to macromolecules up to 2000 kDa, the higher molecular mass dextrans being excluded more efficiently than the lower. Regardless of molecular weight, each of the dextrans becomes uniformly distributed within the speckles and CBs, with the exception that speckles inside CBs exclude dextran, as do free speckles or those on the surface of CBs. Nucleoli are very different. Within each nucleolus, there is at least one and sometimes several regions that exclude dextran more completely than the surrounding region, and this is true for all sizes of dextran. The denser and less dense regions clearly correspond to the dense fibrillar and granular zones respectively, which are often detectable by phase contrast or DIC microscopy (Figure 1C). Nucleoli sometimes contain spherical regions of lower refractive index than either the granular or fibrillar regions. After dextran injection, these regions acquire the same fluorescence intensity as the nucleoplasm, suggesting that they are more or less structureless vacuoles filled with nucleoplasm (Figure 9, panel 4).
The exclusion of dextran varies directly with the physical density of the organelles; that is, dextran penetrates most completely into the least dense organelle, the CB, and is excluded most completely from the fibrillar region of the nucleoli, which has the highest density. Thus, dextran exclusion depends on at least two factors: the size of the dextran molecule and the physical density of the organelle. These correlations suggest a simple “sponge” model of the nuclear organelles, according to which the interior of each organelle (or subcompartment in the case of the nucleoli) is penetrated by an anastomosing network of channels of different sizes. The channels might be larger in the case of the less dense organelles, or they might simply occupy a larger fraction of the internal space (or both). Regardless, the interiors of CBs, speckles, and nucleoli are accessible to very large molecules. Even though the boundary between organelle and nucleoplasm looks sharp at the light microscopic level, our studies provide direct evidence that there is no sharp boundary at the molecular level.
Implications for Kinetic Studies
In recent years, numerous studies have dealt with the movement of macromolecules within the nucleus, particularly movement in and out of the nucleolus and other organelles (Phair and Misteli, 2000; Carmo-Fonseca et al., 2002; Dundr et al., 2002, 2004; Handwerger et al., 2003; Deryusheva and Gall, 2004). In such cases, the concentration of a macromolecule is generally higher within the organelle than in the surrounding nucleoplasm, providing prima facie evidence that binding must play a determining role in the kinetics of movement. For a macromolecule to bind, it must gain access to the interior of an organelle, so in principle, the physical structure of the organelle might present a barrier to free diffusion. Nuclear organelles lack any membrane that could be a barrier. Furthermore, our studies show that nuclear organelles, at least in the GV, are freely permeable to dextrans up to 2000 kDa. The low physical density of GV organelles that we have demonstrated implies that diffusion of molecules into their interior should be little affected by “molecular crowding.” On the other hand, our data do not shed light on the fluid viscosity within the organelles, which could in principle affect the diffusion of molecules within them.
Implications for Study of Isolated Organelles and Extracted Nuclei
For many years, the most popular way to study GV organelles has been a “spread” preparation (Gall, 1998). One isolates a GV manually from the oocyte, strips off the nuclear envelope, and allows the contents to disperse in a small well on a glass slide. The whole slide is then centrifuged, so as to attach the organelles to the glass. During this process, most of the nucleoplasm is washed away. This procedure gives very clean organelles, which can be immunostained or subjected to in situ hybridization. The extremely low background signal in such preparations has always been deemed a positive feature, allowing the detection of minor components in the organelles. However, the studies reported here suggest that a substantial fraction of the mass of isolated organelles may consist of trapped nucleoplasm. This conclusion follows from the fact that the densities of isolated organelles are similar to the densities of the same organelles inside the nucleus. Our dextran experiments show that organelles inside the nucleus are extensively permeated by the surrounding medium; in other words, that a substantial fraction of their measured mass may be nucleoplasm. If this nucleoplasm were lost during isolation in an aqueous medium (and there were no compensating decrease in volume), then isolated organelles would have lower densities than the corresponding organelles inside the nucleus. Retention of nucleoplasm in the organelles also may be favored by the fact that the standard dispersal medium contains 0.1% formaldehyde (in the absence of formaldehyde the nuclear contents form an actin-based gel that will not disperse; Clark and Rosenbaum, 1979). It is entirely possible that some macromolecules that we and others have reported as minor organelle components in spread preparations are present because of trapped nucleoplasm.
We suggest that a distinction now be made between components that are at higher concentration within an organelle than in the nucleoplasm, and those that are at the same or lower concentration. Components can reach a higher concentration only by some selective mechanism, whereas those at lower concentration may have no specific relationship to the organelle. This distinction can best be made in fixed and sectioned GVs or in GVs isolated in oil, whereas it cannot be made unequivocally in spread preparations that lack nucleoplasm.
Our findings in this study suggest that care must be taken in evaluating the distribution of macromolecules within nuclei that have been fixed and stained by standard immunofluorescence procedures. A nearly universal step in these procedures is “permeabilization,” meaning extraction with a detergent such as Triton X-100 either during or after fixation. The purpose of this step is to increase the intensity of stain, presumably by allowing greater access of the primary and/or secondary antibodies. Nuclear organelles certainly seem more clear in permeabilized than in nonpermeabilized preparations. However, if a component under study occurs in both the nucleoplasm and an organelle, and if detergent extraction removes much of the nucleoplasm, then the increased clarity of the organelle may result from increased contrast as well as increased intensity of stain. If nuclear organelles in cultured cells are as readily penetrated by nucleoplasm as those in the GV, care must be taken in assessing the bona fide components of the organelles. In both somatic nuclei and the GV, the best evidence probably comes from the distribution of fluorescently labeled components in the living cell.
Shape of Nuclear Organelles
The protein concentration of CBs is not much greater than that of the nucleoplasm in which they are suspended (0.136 vs. 0.106 g/cm3). The consistency of such protein solutions will depend on the polymer length and degree of intermolecular associations or cross-linking, but protein solutions of these concentrations can be very fluid. For instance, both Xenopus egg extract (0.118 g/cm3) and the white of a hen's egg (0.121 g/cm3) fall in this range, based on our refractive index measurements (our unpublished data). We suggest that the remarkably spherical shape of CBs in the oocyte may be due simply to their low density and lack of a supporting fibrous skeleton. In other words, they are semifluid spheres suspended in semifluid nucleoplasm, their shape being determined largely by surface tension and internal cohesion. The same may well be true of speckles, which in the oocyte also tend to be spherical. The nucleoli in some Xenopus oocytes are roughly spherical, but in others they assume highly irregular shapes, including tori with multiple subunits. Just exactly what gives nucleoli their higher rigidity is not clear, although their internal structure is more complex than that of CBs and speckles (Figure 8).
Theory
The refractive index of an aqueous protein solution varies linearly with its concentration according to the relationship no = nw + αC, where no is the refractive index of the solution, nw is the refractive index of the medium in which the protein is dissolved, C is the concentration of the protein (grams per cubic centimeter), and α is the specific refractive increment of the protein. The specific refractive increment has been determined experimentally for a number of proteins; its value is close to 0.185 cm3/g for typical proteins. Thus, the relationship becomes no = 1.334 + 0.185C for a “typical” protein in a Ringer's solution of refractive index = 1.334 (Hale, 1958).
Because the specific refractive increment does not vary much for different proteins, the total protein concentration in a homogeneous cellular compartment can be estimated from its refractive index. For practical reasons, it is often difficult or impossible to measure the refractive index directly. In these cases, one can measure the OPD between the object and the medium in which it resides and calculate the refractive index of the object: OPD = (no - nm)t, where no and nm are the refractive indices of the object and the medium, respectively, and t is the thickness of the object. By measuring the same object in media of different refractive indices, one obtains additional information about the object.
The practical application of this simple theory may be thwarted by interactions between the object and the medium. In general, the object must not swell or shrink due to osmotic or other effects of the medium and the object must not lose mass. Two simple cases can be considered.
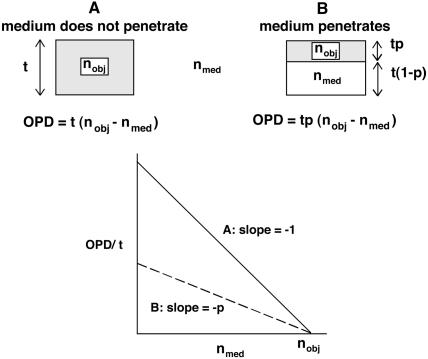
The medium does not penetrate the object and there is no change in the internal composition. In this case (Figure 11A) the plot of OPD/t as a function of the refractive index of the medium will be a straight line with a slope of –1, where both the x- and y-intercepts equal the refractive index of the object. This would be the case for a glass bead in oil or water.
The medium penetrates the object but does not cause changes in its volume or macromolecular composition. In the simplest case (Figure 11B), the measured object consists of two compartments, an excluded or impenetrable volume, consisting of “dry” macromolecules, and a penetrated volume, consisting essentially of the external medium. The plot of OPD/t versus refractive index of the medium will still be a straight line, but the slope is now –p, where p is the volume fraction occupied by macromolecules (excluded volume) and 1 - p is the volume fraction occupied by medium (penetrated volume). The x intercept equals the refractive index of the dry macromolecules of which the object is composed. In our study, isolated nuclear organelles approximated this second case.
Figure 11.
Relationship between OPD of an object and the refractive index of the medium in which it is observed. (A) For the case in which the medium does not penetrate the object. (B) For the case in which the medium penetrates the object, but there is no loss of mass or change in total volume.
Acknowledgments
We thank Christine Murphy for technical assistance. Zheng'an Wu and Michael Sepanski carried out the electron microscopy.
Article published online ahead of print. Mol. Biol. Cell 10.1091/mbc.E04–08–0742. Article and publication date are available at www.molbiolcell.org/cgi/doi/10.1091/mbc.E04-08-0742.
References
- Barer, R., and Joseph, S. (1954). Q. J. Microsc. Sci. 95, 399-423. [Google Scholar]
- Battin, W. T. (1959). The osmotic properties of nuclei isolated from amphibian oocytes. Exp. Cell Res. 17, 59-75. [DOI] [PubMed] [Google Scholar]
- Boudonck, K., Dolan, L., and Shaw, P. J. (1999). The movement of coiled bodies visualized in living plant cells by the green fluorescent protein. Mol. Biol. Cell 10, 2297-2307. [DOI] [PMC free article] [PubMed] [Google Scholar]
- Carmo-Fonseca, M., Platani, M., and Swedlow, J. R. (2002). Macromolecular mobility inside the cell nucleus. Trends Cell Biol. 12, 491-495. [DOI] [PubMed] [Google Scholar]
- Clark, T. G., and Rosenbaum, J. L. (1979). An actin filament matrix in handisolated nuclei of X. laevis oocytes. Cell 18, 1101-1108. [DOI] [PubMed] [Google Scholar]
- Deryusheva, S., and Gall, J. G. (2004). Dynamics of coilin in Cajal bodies of the Xenopus germinal vesicle. Proc. Natl. Acad. Sci. USA 101, 4810-4814. [DOI] [PMC free article] [PubMed] [Google Scholar]
- Dundr, M., Hebert, M. D., Karpova, T. S., Stanek, D., Xu, H., Shpargel, K. B., Meier, U. T., Neugebauer, K. M., Matera, A. G., and Misteli, T. (2004). In vivo kinetics of Cajal body components. J. Cell Biol. 164, 831-842. [DOI] [PMC free article] [PubMed] [Google Scholar]
- Dundr, M., Hoffmann-Rohrer, U., Hu, Q., Grummt, I., Rothblum, L. I., Phair, R. D., and Misteli, T. (2002). A kinetic framework for a mammalian RNA polymerase in vivo. Science 298, 1623-1626. [DOI] [PubMed] [Google Scholar]
- Duryee, W. R. (1937). Isolation of nuclei and non-mitotic chromosome pairs from frog eggs. Arch. Exp. Zellforsch. 19, 171-176. [Google Scholar]
- Edstrom, J.-E., and Gall, J. G. (1963). The base composition of ribonucleic acid in lampbrush chromosomes, nucleoli, nuclear sap, and cytoplasm of Triturus oocytes. J. Cell Biol. 19, 279-284. [DOI] [PMC free article] [PubMed] [Google Scholar]
- Fox, A. H., Lam, Y. W., Leung, A.K.L., Lyon, C. E., Andersen, J., Mann, M., and Lamond, A. I. (2002). Paraspeckles: a novel nuclear domain. Curr. Biol. 12, 13-25. [DOI] [PubMed] [Google Scholar]
- Gall, J. G. (1969). The genes for ribosomal RNA during oogenesis. Genetics 61 (suppl), 121-132. [PubMed] [Google Scholar]
- Gall, J. G. (1998). Spread preparation of Xenopus germinal vesicle contents. In: Cells: A Laboratory Manual, vol. 1, ed. D. L. Spector, R. D. Goldman, and L. A. Leinwand, Cold Spring Harbor, NY: Cold Spring Harbor Laboratory Press, 52.51-52.54. [Google Scholar]
- Gall, J. G. (2000). Cajal bodies: the first 100 years. Annu. Rev. Cell Dev. Biol. 16, 273-300. [DOI] [PubMed] [Google Scholar]
- Gall, J. G. (2003). The centennial of the Cajal body. Nature Rev. Mol. Cell. Biol. 4, 975-980. [DOI] [PubMed] [Google Scholar]
- Hale, A. J. (1958). The Interference Microscope in Biological Research, Edinburght: E & S Livingstone.
- Handwerger, K. E., Murphy, C., and Gall, J. G. (2003). Steady-state dynamics of Cajal body components in the Xenopus germinal vesicle. J. Cell Biol. 160, 495-504. [DOI] [PMC free article] [PubMed] [Google Scholar]
- Huang, S. (2000). Review: perinucleolar structures. J. Struct. Biol. 129, 233-240. [DOI] [PubMed] [Google Scholar]
- Lamond, A. I., and Spector, D. L. (2003). Nuclear speckles: a model for nuclear organelles. Nature Rev. Mol. Cell. Biol. 4, 604-612. [DOI] [PubMed] [Google Scholar]
- Lund, E., and Paine, P. (1990). Nonaqueous isolation of transcriptionally active nuclei from Xenopus oocytes. Methods Enzymol. 181, 36-43. [DOI] [PubMed] [Google Scholar]
- Macgregor, H. C. (1962). The behavior of isolated nuclei. Exp. Cell Res. 26, 520-525. [Google Scholar]
- Maul, G. G., Negorev, D., Bell, P., and Ishov, A. M. (2000). Review: properties and assembly mechanisms of ND10, PML bodies, or PODs. J. Struct. Biol. 129, 278-287. [DOI] [PubMed] [Google Scholar]
- Muratani, M., Gerlich, D., Janicki, S. M., Gebhard, M., Eils, R., and Spector, D. L. (2002). Metabolic-energy-dependent movement of PML bodies within the mammalian cell nucleus. Nat. Cell Biol. 4, 106-110. [DOI] [PubMed] [Google Scholar]
- Murphy, D. B. (2001). Fundamentals of light microscopy and electronic imaging. Wiley-Liss: New York, New York.
- Paine, P. L., Johnson, M. E., Lau, Y.-T., Tluczek, L.J.M., and Miller, D. S. (1992). The oocyte nucleus isolated in oil retains in vivo structure and functions. Biotechniques 13, 238-245. [PubMed] [Google Scholar]
- Phair, R. D., and Misteli, T. (2000). High mobility of proteins in the mammalian cell nucleus. Nature 404, 604-609. [DOI] [PubMed] [Google Scholar]
- Piller, H. (1962). Transmitted light interference microscopy after Jamin-Lebedeff. Zeiss Mitteilungen 2, 309 [Google Scholar]
- Platani, M., Goldberg, I., Lamond, A. I., and Swedlow, J. R. (2002). Cajal body dynamics and association with chromatin are ATP-dependent. Nat. Cell Biol. 4, 502-508. [DOI] [PubMed] [Google Scholar]
- Platani, M., Goldberg, I., Swedlow, J. R., and Lamond, A. (2000). In vivo analysis of Cajal body movement, separation, and joining in live human cells. J. Cell Biol. 151, 1561-1574. [DOI] [PMC free article] [PubMed] [Google Scholar]
- Ruggero, D., Wang, Z.-G., and Pandolfi, P. P. (2000). The puzzling multiple lives of PML and its role in the genesis of cancer. Bioessays 22, 827-835. [DOI] [PubMed] [Google Scholar]
- Shav-Tal, Y., Darzacq, X., Shenoy, S. M., Fusco, D., Janicki, S. M., Spector, D. L., and Singer, R. H. (2004). Dynamics of single mRNPs in nuclei of living cells. Science 304, 1797-1800. [DOI] [PMC free article] [PubMed] [Google Scholar]
- Sleeman, J. E., Trinkle-Mulcahy, L., Prescott, A. R., Ogg, S. C., and Lamond, A. I. (2003). Cajal body proteins SMN and coilin show differential dynamic behaviour in vivo. J. Cell Sci. 116, 2039-2050. [DOI] [PubMed] [Google Scholar]
- Wallace, R. A., Jared, D. W., Dumont, J. N., and Sega, M. W. (1973). Protein incorporation by isolated amphibian oocytes: III. Optimum incubation conditions. J. Exp. Zool. 184, 321-333. [DOI] [PubMed] [Google Scholar]
- Whitley, J. E., and Muir, C. (1974). Determination of sodium and potassium in the nuclei of single newt oocytes. J. Radioanal. Chem. 19, 257-262. [Google Scholar]


