Abstract
Human pluripotent stem cells (hPSCs) are a promising cell source for regenerative medicine, but their derivatives need to be rigorously evaluated for residual stem cells to prevent teratoma formation. Here, we report the development of novel surface-enhanced Raman scattering (SERS)-based assays that can detect trace numbers of undifferentiated hPSCs in mixed cell populations in a highly specific, ultra-sensitive, and time-efficient manner. By targeting stem cell surface markers SSEA-5 and TRA-1-60 individually or simultaneously, these SERS assays were able to identify as few as 1 stem cell in 106 cells, a sensitivity (0.0001%) which was ~2,000 to 15,000-fold higher than that of flow cytometry assays. Using the SERS assay, we demonstrate that the aggregation of hPSC-based cardiomyocyte differentiation cultures into 3D spheres significantly reduced SSEA-5+ and TRA-1-60+ cells compared with parallel 2D cultures. Thus, SERS may provide a powerful new technology for quality control of hPSC-derived products for preclinical and clinical applications.
Keywords: human pluripotent stem cell, differentiation, flow cytometry, nanoparticle, SERS assay
1. Introduction
Owing to their distinct self-renewal and differentiation properties, human pluripotent stem cells (hPSCs), either human embryonic stem cells (hESCs) or human induced pluripotent stem cells (iPSCs), hold great potential as a cell source for regenerative medicine. However, these properties also make them potentially tumorigenic—even a small number of undifferentiated hPSCs are sufficient to generate teratomas when transplanted in vivo [1, 2]. Hence, the risk of tumorigenesis is a major concern for the clinical translation of all hPSC-derived products [3]. Animal studies documenting the risk of teratoma formation following transplantation of hPSC-derivatives have spurred efforts to evaluate and enhance the safety of hPSC-based therapies [4–10]. For clinical safety, a highly sensitive and specific quality control assay is required to determine the number of undifferentiated cells in hPSC-derived products.
In current practice, cell-based assays such as flow cytometry can detect undifferentiated cells when present at ~0.1% or higher in a mixed cell population [11], which is insufficient sensitivity to ascertain that a cell preparation for transplantation contains a number of hPSCs below the threshold for teratoma formation. A study in mice reported that 104 undifferentiated cells were sufficient to produce tumors in vivo [2]. Accordingly, if an estimated 109 cells are required for a single transplantation for heart failure [12], the sensitivity of assays used to detect residual undifferentiated cells needs to be 1 stem cell in a background of 105 cells (0.001%), which is unachievable via flow cytometry.
A prevailing method to evaluate the risk of teratoma formation is to inject cell products into SCID mice and evaluate tumor formation after at least 3 months [3, 13–15]. While this method may provide a direct assessment of tumorigenicity, it is highly impractical as a quality-control assay due to its non-quantitative, non-scalable, costly, and time-consuming nature. Therefore, an assay that is fast, highly sensitive, and efficient in detecting a trace number of undifferentiated cells is imperative for assessing the safety of hPSC-derived products.
Nanoparticle-based surface-enhanced Raman scattering (SERS) technology is gaining momentum in biomedical applications such as molecular multiplex detection, pathogen and cell detection, and in situ imaging [16–21]. When conjugated with biomolecular targeting ligands, Raman reporter-labelled gold (Au) nanoparticles can be used to detect specific molecules with high specificity and sensitivity [19, 21–23]. SERS detection produces a sharp, fingerprint-like spectral pattern that is distinct from other interference patterns in a complex biological environment. This is uniquely advantageous when detecting a low number of cells, since conventional fluorescence signals may be masked by the scattering signals of background cells [20, 21]. In this study, we developed SERS-based assays targeting the hPSC surface markers stage-specific embryonic antigen-5 (SSEA-5) and TRA-1-60 to detect residual undifferentiated hPSCs with high specificity and sensitivity. Using our newly developed assays, we efficiently detected SSEA-5+ and TRA-1-60+ cells at sensitivities several orders of magnitude higher than flow cytometry assays. As such, these assays represent a rapid, efficient, and economic method for assessing the safety of hPSC-based products for pre-clinical and clinical applications.
2. Materials and Methods
2.1. Materials
Ultrapure water (18 MΩ cm−1) was used to prepare all aqueous solutions. The following chemicals were used without further purification: 60 nm citrate-stabilized gold nanoparticles (2.6×10¹⁰ particles/mL) (Ted Pella Inc.), black hole quencher (BHQ) (Biosearch Technologies), PEG-SH (MW = 5,000 and 20,000 Da) (Rapp Polymere, Germany), SSEA-5 IgG1 antibody (Stemcell Technologies), and TRA-1-60 IgM antibody (Millipore). All other reagents were obtained from Sigma-Aldrich at the highest purity available.
2.2. BIDI Reporter Molecule
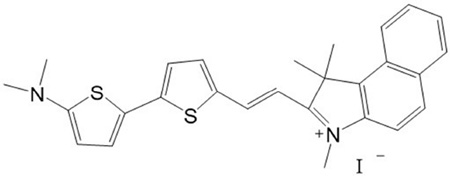
The molecular structure of (E)-2-(2-(5'-(dimethylamino)-2, 2’-bithiophen-5-yl) vinyl)-1, 1, 3-trimethyl-1H-benzo[e]indol-3-ium iodide (BIDI) is shown here. The synthesis of BIDI will be reported later in another work.
BIDI 1HNMR (DMSO, 500MHz): δ = 8.61–8.64(d, 1H, C10H6), 8.36–8.38 (d, 1H, C10H6), 8.21–8.23(d, 1H, C2H2), 8.15–8.17(d, 1H, C10H6), 8.04–8.05 (d, 1H, C4H2S), 7.97–7.99(1, H, C2H2), 7.74–7.77(m, 1H, C10H6), 7.63–7.66 (m, 1H, C10H6), 7.56–7.57(d, 1H, C4H2S), 7.37–7.38 (d, 1H, C4H2S), 6.84–6.87 (d, 1H, C10H6), 6.16–6.17 (d, 1H, C4H2S), 4.05(s, 3H, CH3), 3.08(s, 6H, CH3), 1.98(s, 6H, CH3).MALDI-TOF-MS: m/z433.0 (M-I−).
2.3. Preparation of SSEA-5-conjugated and TRA-1-60-conjugated nanoparticles
Au nanoparticles were labelled with Raman reporters as described previously [24], conjugated with SSEA-5 (IgG1) or TRA-1-60 (IgM) antibodies, and then coated with polyethylene-glycol (PEG). Amine function group of TRA-1-60 IgM antibody was modified to couple with a streptavidin linker for 3 h at room temperature. Excess glycine was used to quench the un-reacted linker. The bioconjugation of SSEA-5 or TRA-1-60 antibodies with nanoparticles was carried out using previously reported procedures [24]. Briefly, the 60 nm citrate-stabilized Au nanoparticles were labelled with BHQ reporter molecules via adsorption to the negatively charged Au nanoparticle surface through electrostatic interaction.
To prepare Au nanoparticles conjugated with SSEA-5 or TRA-1-60 antibodies, Au-BHQ nanoparticles first were reacted with varying quantities of antibodies (10, 25, 50, 100 antibodies/ligands per particle). The reaction was performed at room temperature with shaking for 2 h and the mixture was incubated at 4°C overnight. Complete PEGylation of the unreacted gold surface required the introduction of excess 10 µM PEG-SH into the reaction mixture and was performed at room temperature with shaking for 1 h. The reaction mixture was centrifuged at 4,000 × g for 20 min, followed by removal of the supernatant fraction that contained unreacted antibodies and PEG-SH. Antibody-conjugated nanoparticles formed a pellet at the bottom of the reaction vial. The pellet was washed three times with 1 mL of 1× PBS and repetitive centrifugation. The final concentration of the bio-conjugated Au nanoparticles was determined by the measurement of UV-Vis absorption spectrum using a Raman detection system. For the multiplexing assay, SSEA-5 antibodies were conjugated with Au nanoparticles labelled with the BIDI reporter and TRA-1-60 antibodies with Au nanoparticles labelled with the BHQ reporter.
Antibody-conjugated nanoparticles were characterized as described previously [24] with minor modification. UV-Vis absorption spectra were recorded on a Shimadzu (UV-2401) spectrometer using disposable polyacryl cuvettes. Transmission electron micrographs (TEM) were taken with a Hitachi H7500 high-magnification electron microscope. For the preparation of samples for TEM, nanoparticle samples (5 µL each) were dropped onto copper 200 mesh grids that were pre-treated with UV light to reduce static electricity. After 30 min, the solvent was drained with a filter paper.
SERS spectra were recorded on a compact Raman system (Sierra, Snowy Range Instruments) using 785 nm (70 mW) excitation. The scanning laser beam has a footprint of 1.7 mm diameter with 25 µm focal size. SERS intensities were normalized to the Raman spectra of cyclohexane and polystyrene to correct for variations in optical alignment and instrument response. The spectral resolution was approximately 4 cm−1. Typical spectrum acquisition time is 1 sec.
2.4. Cell culture
Human induced pluripotent stem cells (IMR-90 iPSCs, WiCellResearch Institute) and human embryonic stem cells (H7 hESCs [25], NIH registration no. 0061) were maintained in Essential 8™ (E8) medium (Life Technologies) on growth factor-reduced Matrigel™ (1:60, v/v, Fisher Scientific Inc.). NIH3T3 fibroblasts were maintained in DMEM medium supplemented with 10% FBS. Primary rat cardiomyocytes were isolated as described previously [26]. All cultures were under standard culture conditions (5% CO2, 37°C).
2.5. Specificity of SSEA-5-conjugated and TRA-1-60-conjugated nanoparticles
For the evaluation of the specificity of SSEA-5-conjugated and TRA-1-60-conjugated nanoparticles, 500,000 cells were prepared for each cell type (IMR-90 iPSCs, H7 hESCs, primary rat cardiomyocytes and NIH3T3 fibroblasts). These samples were fixed with 2% paraformaldehyde (PFA) and pretreated with an endogenous biotin-blocking reagent (cat No. E-21390, Life Technologies) and then incubated with 5 pM SSEA-5-conjugated nanoparticles or TRA-1-60-conjugated nanoparticles in 2% BSA for 30 min at room temperature, followed by three washes with PBS containing 0.1% BSA and 0.1% Tween® 20 (PBST). The cells were centrifuged and the entire cell pellet was analyzed using a Raman system for each ensemble measurement (Excitation wavelength: 785 nm; laser power: 70 mW; integration time: 1 sec) [27].
For the evaluation of the specificity of SSEA-5-conjugated and TRA-1-60-conjugated nanoparticles in multiplex labeling, 500,000 cells were prepared for each cell type (IMR-90 iPSCs, H7 hESCs, primary rat cardiomyocytes and NIH3T3 fibroblasts). Upon blocking endogenous biotin, samples were incubated with 5 pM SSEA-5-conjugated nanoparticles and 5 pM TRA-1-60-conjugated nanoparticles. The SERS spectra from each sample were measured using a Raman system (785 nm laser excitation,) and analyzed as described [27].
2.6. Sensitivity of SSEA-5-conjugated and TRA-1-60-conjugated nanoparticles
For the determination of the sensitivity of SSEA-5-conjugated and TRA-1-60-conjugated nanoparticles, samples containing varying numbers of stem cells were prepared by mixing hPSCs (IMR-90 iPSCs or H7 hESCs) with 1×10⁶ NIH3T3 fibroblasts. Final cell preparations contained 1×10⁶ NIH3T3 fibroblasts mixed with 0, 10, 50, 500, 1,000, 10,000, 100,000 hPSCs (3 replicates each). Following fixation with 2% PFA and a treatment with the endogenous biotin-blocking reagent, these samples were incubated with 2.5 pM SSEA-5-conjugated nanoparticles or TRA-1-60-conjugated nanoparticles for 30 min. After washing 3 times, the SERS spectra of each sample were measured in cell pellets of 10 uL with 785 nm laser excitation using a compact Raman system (Sierra, Snowy Range Instruments). The limit of detection LOD was defined as the lowest concentration of stem cells that can be distinguished from background cell populations without stem cells (e. g., NIH3T3 cells). For the determination of the LOD for each assay, the mean of SERS intensity (y-axis) was plotted against the concentration of stem cells (x-axis). A linear standard curve was then drawn between the SERS intensity and the concentration of stem cells. Next, a horizontal line was drawn at the SERS intensity value that equals to the mean plus 3 standard deviations of the measurements of NIH3T3 cells. The LOD was then determined as the concentration of stem cells at the intersection between the horizontal line and the standard curve.
Determination of the sensitivity of the multiplexing assays was performed similarly using cell preparations containing various numbers of stem cells. These cells were then co-incubated with both 2.5 pM SSEA-5-conjugated nanoparticles and 2.5 pM TRA-1-60-conjugated nanoparticles followed by the measurement and analysis of the SERS spectra. SERS signals were examined and plotted as standard curves based on their fingerprint signatures of SERS spectra contributed by SSEA-5-conjugated and TRA-1-60-conjugated nanoparticles, respectively. The LOD was then determined as aforementioned for single marker detection.
2.7. In vitro cardiomyocyte differentiation
Directed cardiomyocyte differentiation was achieved by a serial application of growth factors, activin A and BMP4 as described previously [28]. Briefly, confluent undifferentiated IMR-90 iPSCs were treated with 100 ng/mL activin A for a day and then BMP4 for 4 days in serum-free Roswell Park Memorial Institute (RPMI) 1640 medium supplemented with insulin-free B27 (day 0). After 24 h treatment, the cultures were treated with 10 ng/mL BMP4 in RPMI/insulin-free B27 medium for 4 days. After differentiation day 5, cells were maintained in the serum-free medium RPMI/B27 containing insulin, and medium was replenished every other day. To initiate 3D sphere culture, cells at differentiation day 4 were dissociated and forced to form cell aggregates in microwell plates as described previously [28]. The spheres were transferred to suspension culture and maintained in low-attachment plates.
2.8. Flow cytometry
For flow cytometry analysis of SSEA-5+ and TRA-1-60+ cells, samples were stained using 1:100 mouse monoclonal SSEA-5 IgG1 (Stemcell Technologies, 60063) and/or 1:200 mouse monoclonal TRA-1-60 IgM (Millipore, MAB4360) for 30 min at room temperature [29]. Isotype controls used were mouse IgG1 (BD Biosciences, 554121) and mouse IgM (BD Biosciences, 557275). Secondary antibody staining was performed with 1:1000 Alexa Fluor® 488 goat anti-mouse IgG1 (Life Technologies) and/or Alexa Fluor® 594 goat anti-mouse IgM (Life Technologies) for 25 min at room temperature. Cardiomyocyte purity was analyzed by flow cytometry analysis of α-actinin, a cardiomyocyte-associated marker, as described previously [30]. Samples were analyzed using a FACS LSRII flow cytometer (BD Biosciences) and FACSDiva software. At least 2×10⁴ events were recorded and data were analyzed using FlowJo (TreeStar).
2.9. Detection of SSEA-5+ and TRA-1-60+ stem cells in differentiation cultures by SERS assay
Test samples from differentiation cultures and standard samples (cell preparations containing various numbers of hPSCs mixed with NIH3T3 fibroblasts) were fixed with 2% PFA and pretreated with the endogenous biotin-blocking reagent and incubated with SSEA-5-conjugated and TRA-1-60-conjugated nanoparticles with distinct Raman spectral patterns as described in the section 2.5 for the multiplexing assay. Upon a thrice washing, cells were recorded for SERS spectra, and SERS signals from SSEA-5-conjugated and TRA-1-60-conjugated nanoparticles were analyzed by their unique SERS spectrum fingerprints. Linear standard curves were constructed from standard samples: the intensities of SERS signals from SSEA-5-conjugated and TRA-1-60-conjugated nanoparticles were plotted against the concentrations of stem cells. Levels of residual SSEA-5+ and TRA-1-60+ cells in the test samples were determined according to the standard curves. Data are presented as mean ± standard deviation of 3 measurements.
3. Results
3.1. Optimization of SSEA-5-conjugated and TRA-1-60-conjugated nanoparticles
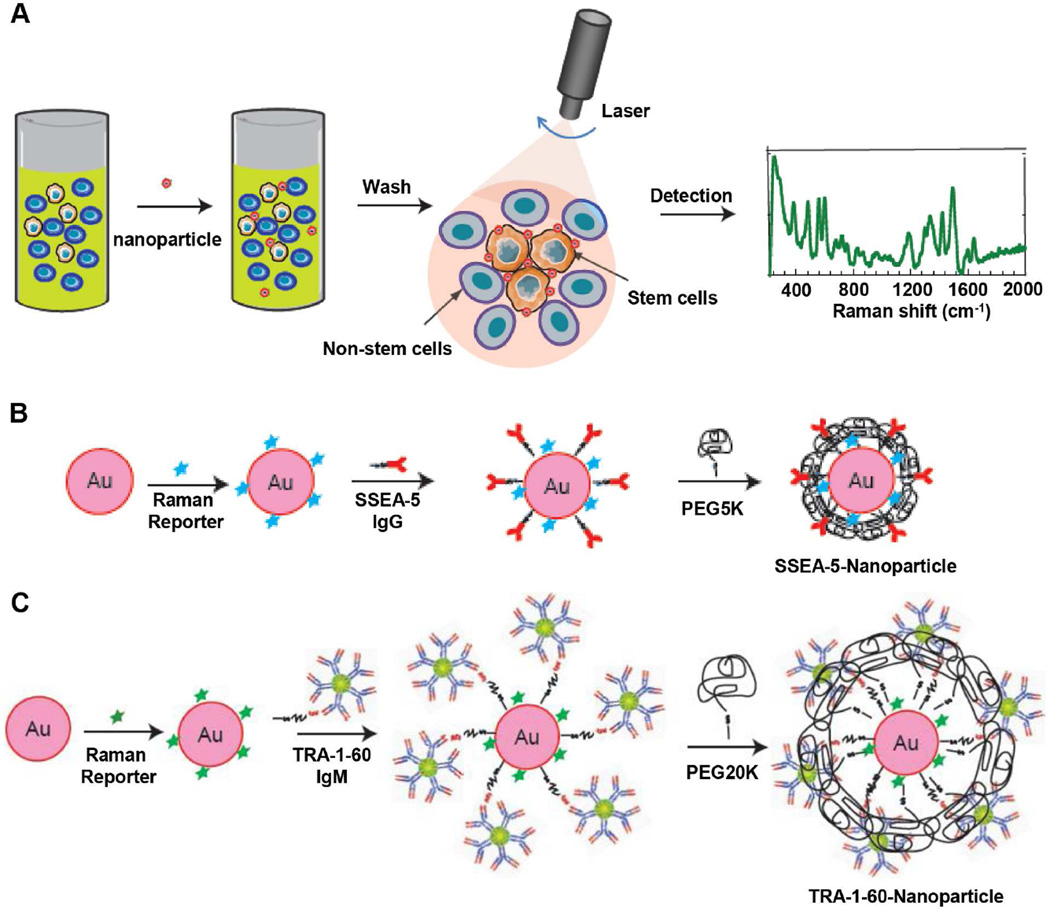
In order to specifically detect residual stem cells, we developed two SERS assays by functionalizing Au nanoparticles with antibodies targeting stem cell surface markers, SSEA-5 and TRA-1-60. Both markers are specific to pluripotent stem cells and could be used to delineate undifferentiated cells from differentiated cells [25, 31]. Figure 1A illustrates the SERS assay principle in labeling and detecting rare stem cells. Upon staining and washing steps, the level of stem cells bonded with nanoparticles was detected by a Raman detection system.
Figure 1.
Schematic of the SERS assay principle and design of SSEA-5-conjugated and TRA-1-60-conjugated nanoparticles. (A) The assay principle using SSEA-5-conjugated and/or TRA-1-60-conjugated nanoparticles to detect pluripotent stem cells. Cells were incubated with SSEA-5- and/or TRA-1-60-conjugated nanoparticles. After washing, SERS signals from cell pellets were detected by laser and SERS spectra were analyzed. (B) Schematic diagram showing the preparation of Raman-encoded, PEG-stabilized, and SSEA-5-functionalized Au nanoparticles. (C) Preparation of Raman-encoded, PEG-stabilized, and TRA-1-60-functionalized Au nanoparticles.
SSEA-5 (IgG1)-conjugated and TRA-1-60 (IgM)-conjugated nanoparticles were prepared through several steps including Raman encoding, antibody conjugation, and polyethylene-glycol (PEG) stabilization (Fig. 1B and 1C). As examined by transmission electron microscopy (TEM), the nanoparticles had a relative uniform size with a diameter of ~60 nm (Supplementary Fig. 1A). These nanoparticles had optical absorption peaked at a wavelength of 524 nm, a typical profile for Au nanoparticles (Supplementary Fig. 1B). The number of reporter molecules per Au nanoparticle was optimized and carefully titrated to achieve maximal SERS signals and minimal colloid aggregation. A ratio of ~12,000 Raman reporter molecules per nanoparticle produced the highest SERS intensity with minimal colloid aggregation and therefore was used throughout the experiments (Supplementary Fig. 1).
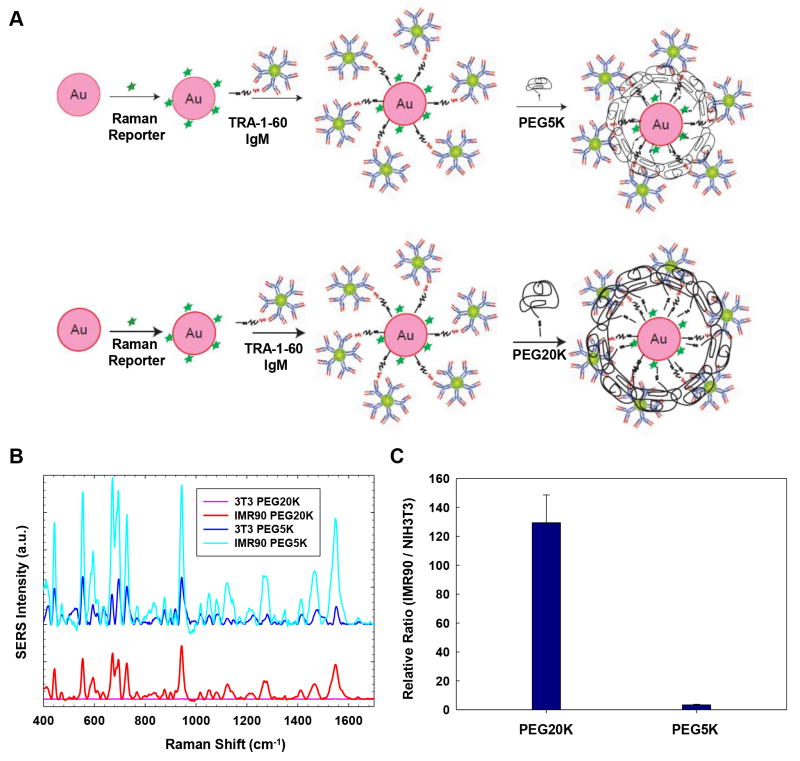
We optimized the nanoparticles in order to obtain high relative SERS signal ratio, i.e., the SERS signal ratio of positive cells (hPSCs) vs. negative cells (NIH3T3 cells). Due to significant differences in the size and structure of SSEA-5 (IgG1) and TRA-1-60 (IgM) antibodies, we applied a two-step approach to optimize the antibody-conjugated nanoparticles by first modifying the PEG stabilizing layer and then titrating the ligand density. In the first step, we evaluated the effect of the length of PEG layers on relative SERS signal ratios of IMR-90 iPSCs (positive cells) and NIH3T3 fibroblasts (negative cells). For TRA-1-60 (IgM)-conjugated nanoparticles, we hypothesized that the length of the PEG-SH needs to be increased to reduce the non-specific binding from IgM (Fig. 2A). As expected, we observed high background signal from NIH3T3 fibroblasts using TRA-1-60-conjugated nanoparticles prepared with PEG-SH with molecular weight of 5,000 Da (PEG5K) as protective layer (Fig. 2B, dark blue spectra), indicating PEG5K was not sufficient to prevent non-specific binding of the large pentamer structure of IgM. In contrast, nanoparticles stabilized with PEG-SH with molecular weight of 20,000 Da (PEG20K) gave negligible SERS signals for non-stem cells (Fig. 2B, pink spectra) and generated the highest relative SERS signal ratio of hPSCs vs. NIH3T3 fibroblasts at ~130, which was ~26-fold higher compared with those detected by the nanoparticles coated with PEG5K (Fig. 2C).
Figure 2.
Effect of the PEG-SH layer of TRA-1-60-conjugated nanoparticles on relative SERS signals. (A) Schematic of applying PEG-SH layers with a molecular weight of 5,000 Da (PEG5K) or 20,000 Da (PEG20K) onto TRA-1-60-conjugated nanoparticles. (B) SERS signals from PEG20K- and PEG5K-stabilized nanoparticles in IMR-90 iPSCs or NIH3T3 fibroblasts (3T3). Note: PEG20K-stabilized nanoparticles produced negligible SERS signals from NIH3T3 fibroblasts (pink spectra), while PEG5K-stabilized nanoparticles produced high background signals from NIH3T3 fibroblasts (dark blue spectra). (C) The relative SERS signals from PEG20K-stabilized and PEG5K-stabilized nanoparticles targeting IMR-90 iPSCs vs. NIH3T3 fibroblasts.
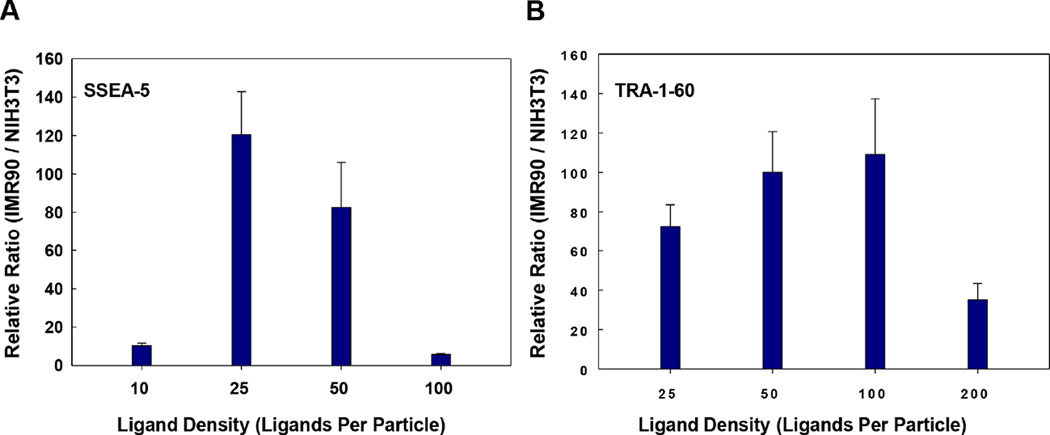
In the second step, we examined the effect of antibody/ligand density on the relative SERS signals. It has been well documented that the binding affinity of nanoparticles increases with higher ligand density [32]; however, too many ligands per particle could also cause higher non-specific binding due to higher charge and more exposed hydrophobic pockets. Therefore, optimizing ligand density per particle is one of the critical steps to achieve high specificity of the assay. To this end, we prepared nanoparticles with various ligand densities and compared the relative SERS signals of these nanoparticles. The highest relative SERS signal ratio of hPSCs vs. NIH3T3 fibroblasts was observed when the nanoparticles were prepared with a ligand density of 25 SSEA-5 antibodies per particle (Fig. 3A) and 100 TRA-1-60 antibodies per particle (Fig. 3B), respectively. Thus, these ligand densities were selected for the preparation of nanoparticles in further experiments.
Figure 3.
Effect of antibody/ligand density on relative SERS signals. Nanoparticles were conjugated with various amounts of antibodies and compared for their relative SERS signals targeting IMR-90 iPSCs vs. NIH3T3 fibroblasts. (A) Effect of the ligand density on the relative SERS signals from SSEA-5-conjugated nanoparticles targeting IMR-90 iPSCs vs. NIH3T3 fibroblasts. Note: A ligand density of 25 ligands per particle in SSEA-5-conjugated nanoparticles produced the highest signal ratio. (B) Effect of the ligand density on the relative SERS signals from TRA-1-60-conjugated nanoparticles targeting IMR-90 iPSCs vs. NIH3T3 fibroblasts. Note: A ligand density of 100 ligands per particle in TRA-1-60-conjugated nanoparticles produced the highest signal ratio.
3.2. Development of SERS assays targeting individual surface markers: specificity and sensitivity
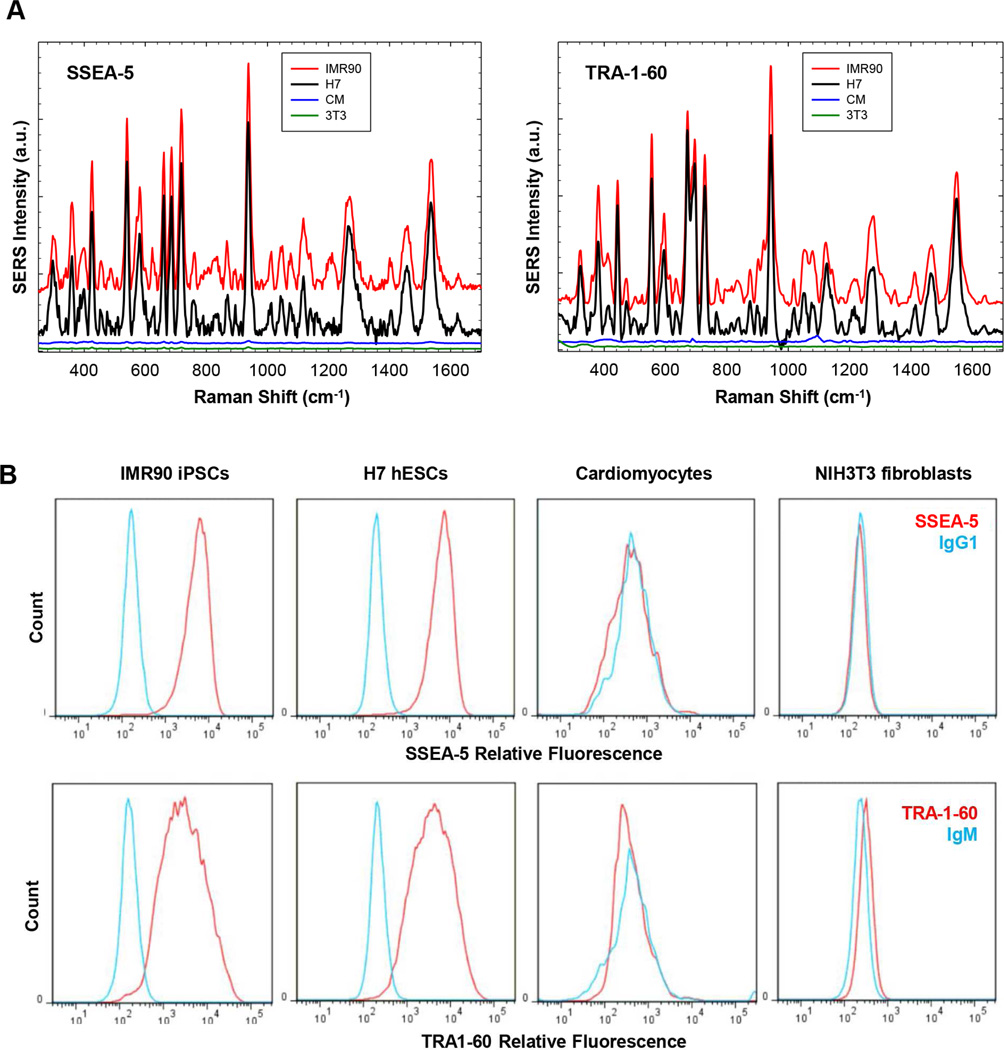
We next assessed the specificity of SSEA-5-conjugated and TRA-1-60-conjugated nanoparticles using cells with (IMR-90 iPSCs and H7 hESCs) or without (primary cardiomyocytes and NIH3T3 fibroblasts) these specific surface markers. After cells were incubated with SSEA-5-conjugated nanoparticles or TRA-1-60-conjugated nanoparticles, strong SERS signals were detected only in pluripotent stem cells with these surface markers (Fig. 4A), suggesting specific bindings of these two nanoparticles to pluripotent stem cells. Nanoparticles conjugated with corresponding isotype controls (IgG1 or IgM) also displayed negligible SERS signals for all cell lines (data not shown). As expected, flow cytometry analysis indicated that SSEA-5 and TRA-1-60 were specifically expressed on IMR-90 iPSCs and H7 hESCs, but not on cardiomyocytes or fibroblasts (Fig. 4B). Therefore, both SSEA-5-conjugated and TRA-1-60-conjugated nanoparticles specifically detected pluripotent stem cells.
Figure 4.
Specificity of SSEA-5-conjugated and TRA-1-60-conjugated nanoparticles for the detection of hPSCs. (A) Cells (500,000 cells/test) were pretreated with an endogenous biotin-blocking reagent and then incubated with nanoparticles for 30 min. Following washing, the cells were centrifuged and the cell pellet was analyzed using a Raman system for each ensemble measurement. Excitation wavelength: 785 nm; laser power: 70 mW; integration time: 1 sec. Note: SERS signals from SSEA-5-conjugated and TRA-1-60-conjugated nanoparticles were detected in pluripotent stem cells, IMR-90 iPSCs (red) and H7 hESCs (black), but not in non-stem cells, primary rat cardiomyocytes (CM, blue) or NIH3T3 fibroblasts (3T3, green). (B) Flow cytometry analysis of pluripotent stem cell surface markers. SSEA-5+ cells and TRA-1-60+ cells were detected in IMR-90 iPSCs and H7 hESCs, but not in cardiomyocytes or NIH3T3 fibroblasts.
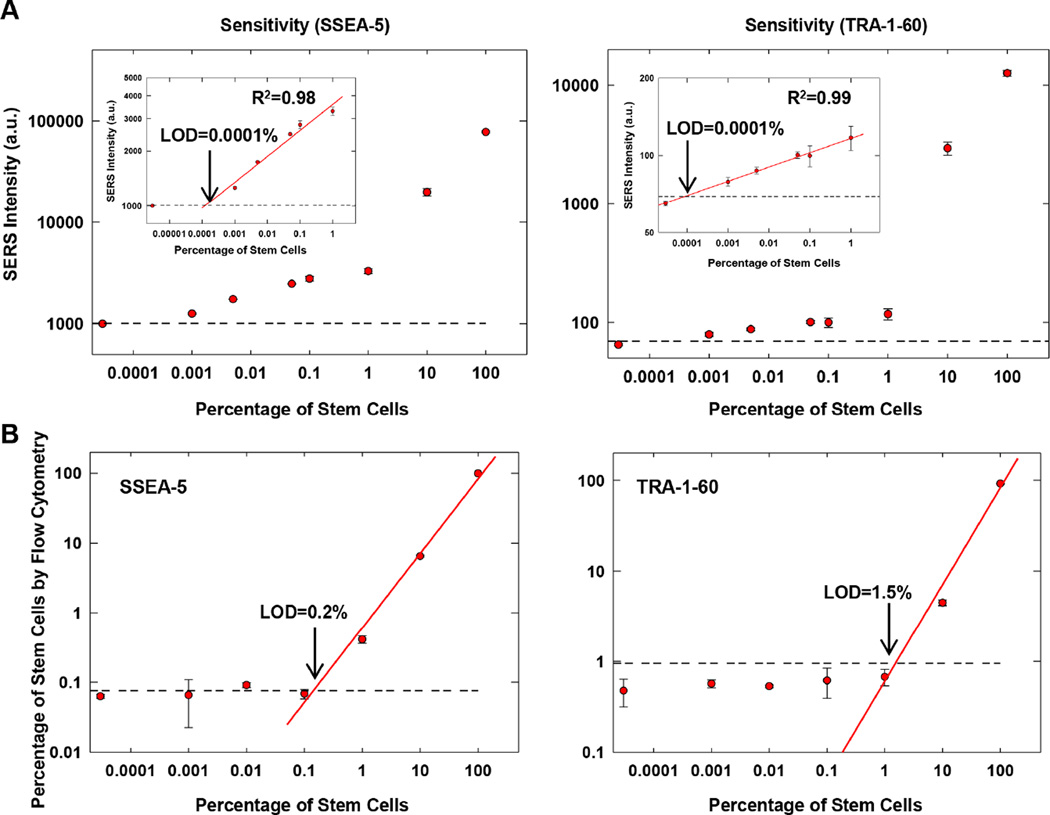
To determine the sensitivity of these SERS assays, we first generated cell preparations containing various amounts of hPSCs by mixing hPSCs with NIH3T3 fibroblasts. Each cell preparation was then analyzed with SSEA-5-conjugated nanoparticles or TRA-1-60-conjugated nanoparticles. The SERS signal intensity detected by both SSEA-5- and TRA-1-60-SERS assays was positively correlated with the number of stem cells (Fig. 5A). For samples containing ≤ 1% stem cells, the SERS signal intensity displayed linear correlation with the number of hPSCs (R2 = 0.98–0.99, Fig. 5A, insets). The limit of detection (LOD) was 0.0001% SSEA-5+ or 0.0001% TRA-1-60+ stem cells (i.e. 1 stem cell in a background of 106 cells). In contrast, the estimated LOD for flow cytometry analysis was 0.2% SSEA-5+ or 1.5% TRA-1-60+ stem cells (i.e. 2000 or 15,000 stem cells in a background of 106 cells) (Fig. 5B). Therefore, the sensitivity of the SERS assays was ~2,000 to 15,000-fold higher than that of flow cytometry assays.
Figure 5.
Sensitivity of SSEA-5-conjugated and TRA-1-60-conjugated nanoparticles for the detection of hPSCs. (A) Correlation between the relative SERS intensity from SSEA-5-conjugated nanoparticles or TRA-1-60-conjugated nanoparticles and the amount of stem cells in mixed cell preparations of hPSCs and NIH3T3 fibroblasts. SERS signals from nanoparticles bounded with cells were recorded and plotted against the concentration of stem cells. The horizontal line indicates the SERS intensity value that equals to the mean plus 3 standard deviations of the measurements of NIH3T3 cells. The LOD was determined as the concentration of stem cells at the intersection between the horizontal line and the standard curve. (B) Correlation between the percentage of SSEA-5+ or TRA-1-60+ cells detected by flow cytometry and the amount of stem cells in mixed cell preparations of hPSCs and NIH3T3 fibroblasts. The horizontal line indicates the value that equals to the mean plus 3 standard deviations of the measurements of NIH3T3 cells by flow cytometry.
3.3. Development of a multiplexing SERS assay: specificity and sensitivity
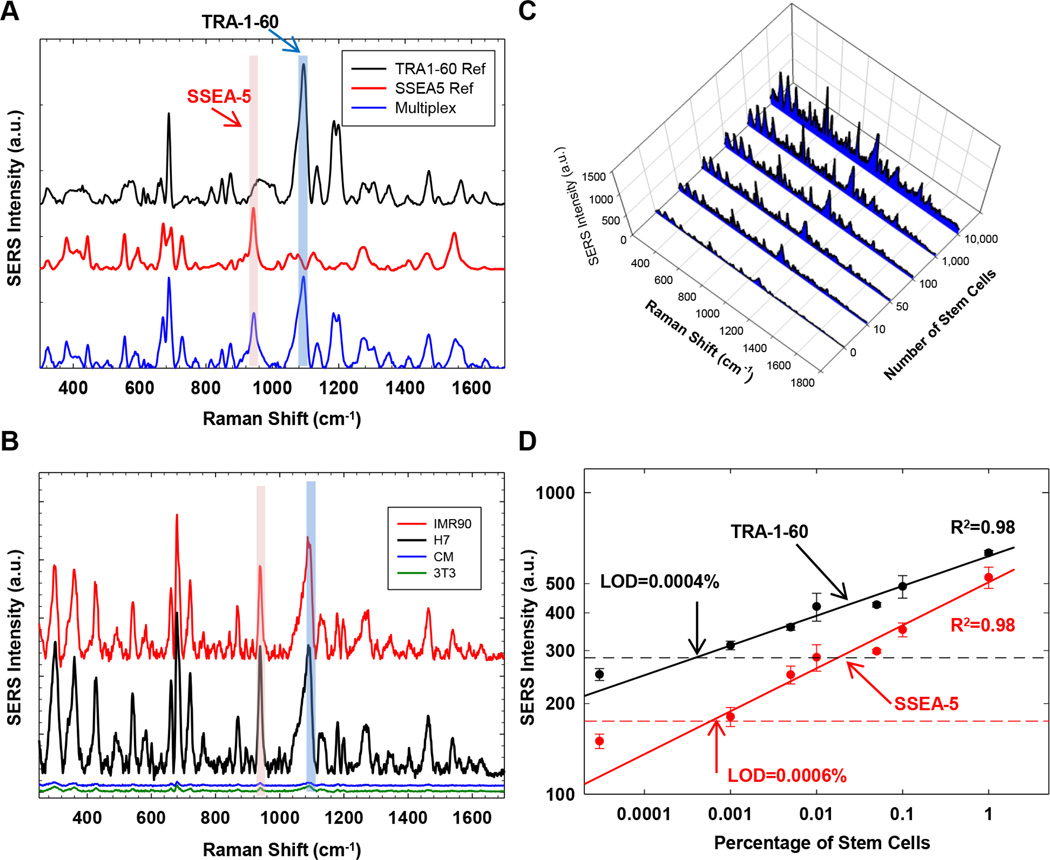
We also examined whether SSEA-5+ and TRA-1-60+ cells could be detected simultaneously in a multiplexing assay using nanoparticles with distinct SERS spectral patterns. SSEA-5 antibodies were conjugated with Au nanoparticles labelled with the BIDI reporter and TRA-1-60 antibodies with Au nanoparticles labelled with the black hole quencher dye (BHQ) reporter. These nanoparticles emitted SERS signals at the same spectral region of 200–1,800 cm−1 when they were simultaneously excited with a single laser bean at 785 nm [21] (Fig. 6A). After stem cells were labeled with these nanoparticles, the final SERS spectra detected in the multiplexing assay was a combination of two distinct SERS spectral patterns (Fig. 6A). Signals from SSEA-5-conjugated and TRA-1-60-conjugated nanoparticles were distinguished using their unique SERS signals at different spectral regions (marked in pink and blue, respectively, Fig. 6A).
Figure 6.
Specificity and sensitivity of multiplexing SSEA-5-conjugated and TRA-1-60-conjugated nanoparticles for the detection of hPSCs. (A) Principle of the multiplexing SERS assay. SSEA-5-conjugated and TRA-1-60-conjugated nanoparticles with distinct SERS spectrum patterns were applied to the same cell preparation. SERS signals from these nanoparticles were detected simultaneously and distinguished by their unique SERS signals at specific spectral regions (pink: SSEA-5-conjugated nanoparticles; blue: TRA-1-60-conjugated nanoparticles). (B) Specificity of the multiplexing SERS assay. SERS signals were detected in IMR-90 iPSCs (red) and H7 hESCs (black) but not in primary rat cardiomyocytes (CM, blue) or NIH3T3 fibroblasts (3T3, green). (C) SERS spectra obtained from cell preparations containing various numbers of stem cells. (D) Sensitivity of the multiplexing SERS assay. Linear standard curves for SERS signals from the nanoparticles were plotted against the concentration of stem cells. The horizontal line indicates the SERS intensity value that equals to the mean plus 3 standard deviations of the measurements of NIH3T3 cells. The LOD was determined as the concentration of stem cells at the intersection between the horizontal line and the standard curve.
We then assessed the specificity and sensitivity of these SSEA-5-conjugated and TRA-1-60-conjugated nanoparticles in the multiplexing assay. Similar to the SERS assays for single surface markers, the multiplexing assay detected strong SERS signals from SSEA-5-conjugated and TRA-1-60-conjugated nanoparticles in IMR-90 iPSCs and H7 hESCs (Fig. 6B), but only negligible SERS signals in cardiomyocytes and fibroblasts (Fig. 6B), suggesting specific bindings of SSEA-5-conjugated and TRA-1-60-conjugated nanoparticles to stem cells. When these nanoparticles were used to detect SSEA-5+ and TRA-1-60+ cells in mixed cell preparations containing varying numbers of stem cells, the SERS signal intensity detected by both SSEA-5-conjugated and TRA-1-60-conjugated nanoparticles was positively correlated with the number of stem cells (R2 = 0.98) with LOD estimated at 0.0006% for SSEA-5+ cells and 0.0004% for TRA-1-60+ cells (Fig. 6C and 6D).
3.4. Detection of SSEA-5+and TRA-1-60+ cells in cardiomyocyte differentiation cultures
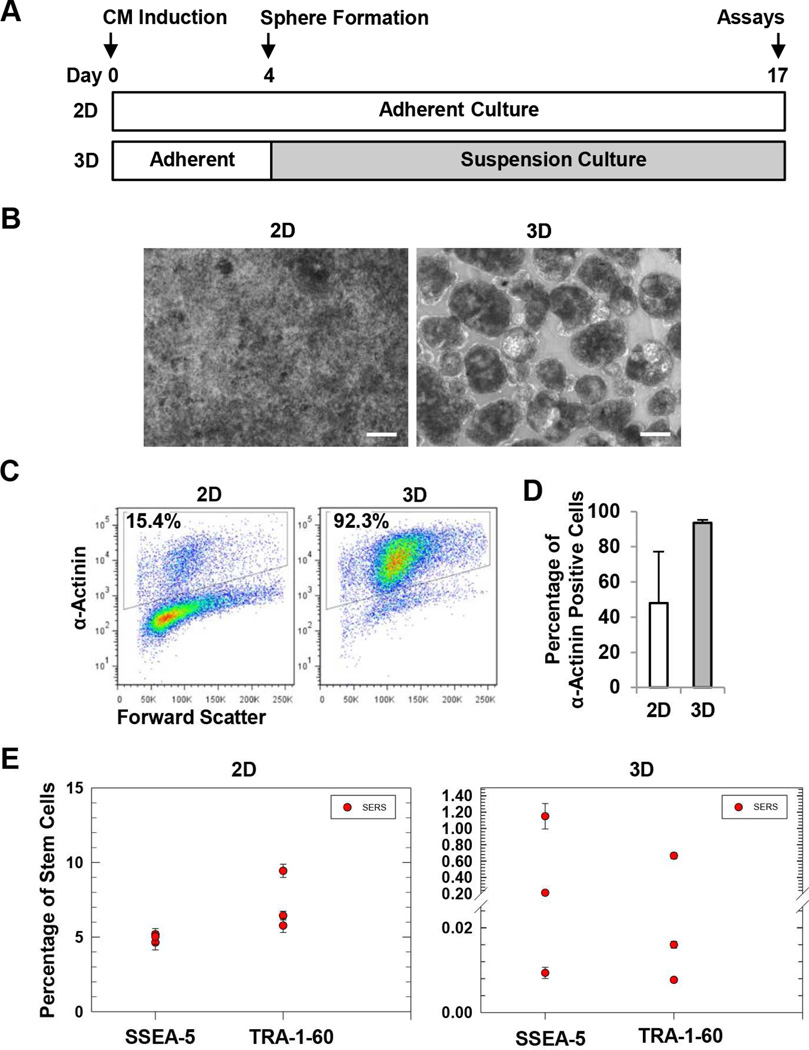
We next applied the multiplexing SERS assays to analyze residual SSEA-5+ and TRA-1-60+ cells in cardiomyocyte differentiation cultures. We previously reported that the formation of 3D cardiac spheres using a microscale, forced aggregation technology efficiently enriched hPSC-derived cardiomyocytes, possibly through homophilic association of cardiomyocytes during sphere formation [28]. We speculated that the 3D sphere culture method could also reduce the number of residual SSEA-5+ and TRA-1-60+ cells. To test this hypothesis, we induced cardiomyocyte differentiation from hPSCs by growth factors [30] and generated 3D spheres at differentiation day 4 (Fig. 7A). After 24 h, the cells formed 3D spheres which were then transferred to suspension culture and maintained until differentiation day 17, while the parallel 2D cultures remained as densely packed adherent cells (Fig. 7B). In both 2D and 3D cultures, beating cells were detected first at day 10 and continued to beat until harvesting. At day 17, cardiomyocyte purity was higher in 3D cultures (average of ~94%) than 2D cultures (average of ~48%) as detected by flow cytometry analysis of α-actinin, a cardiomyocyte-associated marker (Fig. 7C and 7D). We then assessed the amount of residual SSEA-5+ or TRA-1-60+ cells in 2D and 3D cultures. Using the multiplexing SERS assay, we detected 4.64 to 5.18% SSEA-5+ and 5.77 to 9.44% TRA-1-60+ cells for 2D culture, but only 0.009 to 1.15% SSEA-5+ and 0.008 to 0.665% TRA-1-60+ cells were detected in 3D cultures (Fig. 7E). These results suggest that 3D sphere culture reduced residual SSEA-5+ and TRA-1-60+ cells and that the SERS assay can be used to detect the residual SSEA-5+ and TRA-1-60+ cells in cardiomyocyte differentiation cultures.
Figure 7.
Detection of residual SSEA-5+ and TRA-1-60+ cells in CM differentiation cultures. (A) Experimental design. Cardiomyocyte differentiation was induced by the treatment of activin A and BMP4. At differentiation day 4, cells were dissociated and forced to form 3D spheres using a microscale technology. After 24 h, the spheres were transferred and maintained in suspension culture. At differentiation day 17, both 3D cells and the parallel 2D cultures were harvested and analyzed for cardiomyocyte purity and levels of residual SSEA-5+ and TRA-1-60+ cells. (B) Cell morphology of 2D and 3D cultures. Scale bar = 100 µm. (C) Representative flow cytometry analysis of α-actinin, a cardiomyocyte-associated marker. (D) Summary of cardiomyocyte purity determined by flow cytometry analysis of α-actinin. (E) Levels of residual SSEA-5+ and TRA-1-60+ cells in 2D and 3D cardiomyocyte differentiation cultures. Test samples from differentiation cultures and standard samples (cell preparations containing various amounts of hPSCs mixed with NIH3T3 fibroblasts) were analyzed by the multiplexing SERS assay. Levels of residual SSEA-5+ and TRA-1-60+ cells in the test samples were determined according to standard curves.
4. Discussion
In this study, we developed nanoparticles targeting two stem cell surface markers, SSEA-5 and TRA-1-60. These assays demonstrated high specificity for hPSCs, and their sensitivity was several orders of magnitude higher than that of flow cytometry assays (0.0001% to 0.0006% vs. ~0.2% to 1.5%). The sensitivity of these SERS assays is 10-fold higher than what is expected for a quality-control assay for stem cell products. Using the SERS assay, we found that 3D sphere cardiomyocyte differentiation cultures had reduced numbers of residual SSEA-5+ and TRA-1-60+ cells compared to the parallel 2D cultures.
Compared with current detection technologies for residual stem cells such as flow cytometry and teratoma testing, the SERS assays we have developed have several attributes that are highly desired for the quality-control of hPSC-derived products. Because of their remarkable sensitivity, these SERS assays may facilitate safety assessment of cell preparations for transplantations that require a large quantity of cells, which is unachievable using flow cytometry or the teratoma assay in mice. In addition, these assays are cost-effective, easy to use, and can be done within an hour, which is much faster than the traditional teratoma assay.
Successfully establishing SERS assays with ultra-high sensitivity requires fine tuning several elements during the preparation of nanoparticles and overall assay design. As exemplified in this study, the PEG layer and ligand density could significantly affect the relative SERS signal. Strikingly, the sensitivity of the SERS assays established in this study was 10- to 50-fold higher than the SERS assay we developed previously for detecting circulating tumor cells [27]. Although this could be contributed by many factors, including differences in target cell types, background cells, targeting ligands, and the affinity of ligand binding, the increased SERS assay sensitivity was likely resulted from our recent improvement in SERS assay development. In nanoparticle designs, PEG coatings are used to protect the Raman reporter from the biological environment and keep the reporter locked to the nanoparticle surface in order to preserve SERS intensities and stability [20, 21]. Notably, we demonstrated that a PEG-SH with higher molecular weight was optimal for TRA-1-60 (IgM)-conjugated nanoparticles; the nanoparticles with PEG20K had 26-fold increased relative SERS signals compared with those with PEG5K.
The SERS assays we developed in this study enable labeling and detection of a trace number of cells that express stem cell markers either SSEA-5 or TRA-1-60 pluripotency markers. SSEA-5 is a recently-identified antigen which is highly and specifically expressed on hPSCs [31]. Immunodepletion with antibodies against SSEA-5 greatly reduced the potential of teratoma formation from partially differentiated cultures [31]. TRA-1-60 is another surface marker characteristic of undifferentiated hPSCs, and antibodies against TRA-1-60 can also detect undifferentiated stem cells from heterogeneous cell population [11, 33]. It is possible that monitoring multiple markers is required in order to assure the safety of hPSC-derived products, since tumor formation from these cell products can be more complex than anticipated. In general, tumors can be derived from residual undifferentiated cells, but hypothetically may also be caused by malignant transformation of differentiated or partially differentiated cells [3]. Correspondingly, the strategy to increase safety is to assure the absence of undifferentiated cells or other partially differentiated cell that could initiate tumor formation [3], and develop methods to selectively eliminate residual stem cells [34–40]. It was reported that qRT-PCR analysis of LIN28 can detect residual undifferentiated hPSCs with a high sensitivity, although other stem cell markers including OCT3/4 and NANOG are not suitable for PCR-based assays to detect low amount of stem cells in a mixed population [11]. With the anticipation that measurements of multiple markers are needed to accurately predict the tumorigenic potential of hPSC-derived products, the SERS assays and PCR method may be used together, given that the technologies detect different molecular characteristics (i.e. the SERS assays detect proteins, glycoproteins, and other epitopes, while the PCR method detects mRNA). In conjunction with other methods, SERS technology will enable the development of assays targeting a multitude of markers characteristic of pluripotent cells or their early differentiated progeny with tumorigenic potential. Assays such as these should be applicable for the detection of stem cells in differentiation cultures of other lineages such as neural, endodermal, or hematopoietic cells.
5. Conclusion
Development of a rapid, economic, and accurate assay for the detection of undifferentiated stem cells is highly desirable to meet the expanding demand for stem cells in clinical applications, where safety concerns due to tumorigenic potential of undifferentiated stem cells are a critical issue. Here, we have developed highly sensitive SERS assays based on a comprehensively-engineered nanoparticle design to specifically detect trace numbers of SSEA-5+ and TRA-1-60+ stem cells. These assays are able to identify as few as 1 stem cell out of 1 million differentiated cells, a sensitivity (0.0001%) that is 3–4 orders of magnitude better than flow cytometry assays and 10-fold higher than the requirement for putative quality-control assays. Using the multiplexing SERS assay, we also demonstrated that the formation of 3D spheres from hPSC-based cardiomyocyte differentiation cultures significantly reduces the number of residual stem cells compared with parallel 2D cultures. Given their speed and cost-effectiveness, these assays could facilitate the accurate and efficient assessment of hPSC-based products for pre-clinical and clinical applications by addressing safety concerns that are common to all stem cell-based therapies.
Supplementary Material
Acknowledgments
We thank Dr. Joshua T. Maxwell for kindly providing the primary rat cardiomyocytes and Ms. Marcela Preininger for carefully reviewing and editing the manuscript. We thank the Children’s Healthcare of Atlanta and Emory University Pediatric Flow Cytometry Core and Animal Physiology Core. This project was supported in part by the Center for Pediatric Nanomedicine at the Emory Children’s GT Pediatric Research Alliance, the NIH grant R21HL123928 to C.X, a grant No. 51373024 to Z. Y. fromthe National Natural Science Foundation of China, and a seed grant to C.X. from the National Center for Advancing Translational Sciences of the NIH under Award Number UL1TR000454. The content is solely the responsibility of the authors and does not necessarily represent the official views of the NIH. Images from Servier Medical Art were used in Fig. 1A.
Footnotes
Publisher's Disclaimer: This is a PDF file of an unedited manuscript that has been accepted for publication. As a service to our customers we are providing this early version of the manuscript. The manuscript will undergo copyediting, typesetting, and review of the resulting proof before it is published in its final citable form. Please note that during the production process errors may be discovered which could affect the content, and all legal disclaimers that apply to the journal pertain.
Disclosure of potential conflicts of interest
The authors indicated no potential conflicts of interest.
References
- 1.Hentze H, Soong PL, Wang ST, Phillips BW, Putti TC, Dunn NR. Teratoma formation by human embryonic stem cells: evaluation of essential parameters for future safety studies. Stem Cell Res. 2009;2:198–210. doi: 10.1016/j.scr.2009.02.002. [DOI] [PubMed] [Google Scholar]
- 2.Lee AS, Tang C, Cao F, Xie X, van der Bogt K, Hwang A, et al. Effects of cell number on teratoma formation by human embryonic stem cells. Cell Cycle. 2009;8:2608–2612. doi: 10.4161/cc.8.16.9353. [DOI] [PMC free article] [PubMed] [Google Scholar]
- 3.Cunningham JJ, Ulbright TM, Pera MF, Looijenga LH. Lessons from human teratomas to guide development of safe stem cell therapies. Nat Biotechnol. 2012;30:849–857. doi: 10.1038/nbt.2329. [DOI] [PubMed] [Google Scholar]
- 4.Leor J, Gerecht S, Cohen S, Miller L, Holbova R, Ziskind A, et al. Human embryonic stem cell transplantation to repair the infarcted myocardium. Heart. 2007;93:1278–1284. doi: 10.1136/hrt.2006.093161. [DOI] [PMC free article] [PubMed] [Google Scholar]
- 5.Seminatore C, Polentes J, Ellman D, Kozubenko N, Itier V, Tine S, et al. The postischemic environment differentially impacts teratoma or tumor formation after transplantation of human embryonic stem cell-derived neural progenitors. Stroke. 2010;41:153–159. doi: 10.1161/STROKEAHA.109.563015. [DOI] [PubMed] [Google Scholar]
- 6.Doi D, Morizane A, Kikuchi T, Onoe H, Hayashi T, Kawasaki T, et al. Prolonged maturation culture favors a reduction in the tumorigenicity and the dopaminergic function of human ESC-derived neural cells in a primate model of Parkinson's disease. Stem Cells. 2012;30:935–945. doi: 10.1002/stem.1060. [DOI] [PubMed] [Google Scholar]
- 7.Cui L, Guan Y, Qu Z, Zhang J, Liao B, Ma B, et al. WNT signaling determines tumorigenicity and function of ESC-derived retinal progenitors. J Clin Invest. 2013;123:1647–1661. doi: 10.1172/JCI65048. [DOI] [PMC free article] [PubMed] [Google Scholar]
- 8.Roy NS, Cleren C, Singh SK, Yang L, Beal MF, Goldman SA. Functional engraftment of human ES cell-derived dopaminergic neurons enriched by coculture with telomerase-immortalized midbrain astrocytes. Nat Med. 2006;12:1259–1268. doi: 10.1038/nm1495. [DOI] [PubMed] [Google Scholar]
- 9.Riegler J, Ebert A, Qin X, Shen Q, Wang M, Ameen M, et al. Comparison of Magnetic Resonance Imaging and Serum Biomarkers for Detection of Human Pluripotent Stem Cell-Derived Teratomas. Stem Cell Reports. 2016;6:176–187. doi: 10.1016/j.stemcr.2015.12.008. [DOI] [PMC free article] [PubMed] [Google Scholar]
- 10.Fuhrmann T, Tam RY, Ballarin B, Coles B, Elliott Donaghue I, van der Kooy D, et al. Injectable hydrogel promotes early survival of induced pluripotent stem cell-derived oligodendrocytes and attenuates longterm teratoma formation in a spinal cord injury model. Biomaterials. 2016;83:23–36. doi: 10.1016/j.biomaterials.2015.12.032. [DOI] [PubMed] [Google Scholar]
- 11.Kuroda T, Yasuda S, Kusakawa S, Hirata N, Kanda Y, Suzuki K, et al. Highly sensitive in vitro methods for detection of residual undifferentiated cells in retinal pigment epithelial cells derived from human iPS cells. PLoS One. 2012;7:e37342. doi: 10.1371/journal.pone.0037342. [DOI] [PMC free article] [PubMed] [Google Scholar]
- 12.Smits PC, van Geuns RJ, Poldermans D, Bountioukos M, Onderwater EE, Lee CH, et al. Catheter-based intramyocardial injection of autologous skeletal myoblasts as a primary treatment of ischemic heart failure: clinical experience with six-month follow-up. J Am Coll Cardiol. 2003;42:2063–2069. doi: 10.1016/j.jacc.2003.06.017. [DOI] [PubMed] [Google Scholar]
- 13.Okano H, Nakamura M, Yoshida K, Okada Y, Tsuji O, Nori S, et al. Steps toward safe cell therapy using induced pluripotent stem cells. Circ Res. 2013;112:523–533. doi: 10.1161/CIRCRESAHA.111.256149. [DOI] [PubMed] [Google Scholar]
- 14.Laflamme MA, Chen KY, Naumova AV, Muskheli V, Fugate JA, Dupras SK, et al. Cardiomyocytes derived from human embryonic stem cells in pro-survival factors enhance function of infarcted rat hearts. Nat Biotechnol. 2007;25:1015–1024. doi: 10.1038/nbt1327. [DOI] [PubMed] [Google Scholar]
- 15.Lu B, Malcuit C, Wang S, Girman S, Francis P, Lemieux L, et al. Long-term safety and function of RPE from human embryonic stem cells in preclinical models of macular degeneration. Stem Cells. 2009;27:2126–2135. doi: 10.1002/stem.149. [DOI] [PubMed] [Google Scholar]
- 16.Vo-Dinh T, Liu Y, Fales AM, Ngo H, Wang HN, Register JK, et al. SERS nanosensors and nanoreporters: golden opportunities in biomedical applications. Wiley Interdiscip Rev Nanomed Nanobiotechnol. 2015;7:17–33. doi: 10.1002/wnan.1283. [DOI] [PubMed] [Google Scholar]
- 17.Sathuluri RR, Yoshikawa H, Shimizu E, Saito M, Tamiya E. Gold nanoparticle-based surface-enhanced Raman scattering for noninvasive molecular probing of embryonic stem cell differentiation. PLoS One. 2011;6:e22802. doi: 10.1371/journal.pone.0022802. [DOI] [PMC free article] [PubMed] [Google Scholar]
- 18.Smith E, Dent G. Modern Raman Spectroscopy - A Practical Approach. Hoboken, NJ: John Wiley & Sons, Inc; 2005. [Google Scholar]
- 19.Nie S, Emory SR. Probing Single Molecules and Single Nanoparticles by Surface-Enhanced Raman Scattering. Science. 1997;275:1102–1106. doi: 10.1126/science.275.5303.1102. [DOI] [PubMed] [Google Scholar]
- 20.Qian X, Peng XH, Ansari DO, Yin-Goen Q, Chen GZ, Shin DM, et al. In vivo tumor targeting and spectroscopic detection with surface-enhanced Raman nanoparticle tags. Nat Biotechnol. 2008;26:83–90. doi: 10.1038/nbt1377. [DOI] [PubMed] [Google Scholar]
- 21.Lane LA, Qian X, Nie S. SERS Nanoparticles in Medicine: From Label-Free Detection to Spectroscopic Tagging. Chem Rev. 2015;115:10489–10529. doi: 10.1021/acs.chemrev.5b00265. [DOI] [PubMed] [Google Scholar]
- 22.Qian XM, Nie SM. Single-molecule and single-nanoparticle SERS: from fundamental mechanisms to biomedical applications. Chem Soc Rev. 2008;37:912–920. doi: 10.1039/b708839f. [DOI] [PubMed] [Google Scholar]
- 23.Jabbari E. Stem-cell nanoengineering. Hoboken, NJ: Hohn Wiley & Sons, Inc; 2015. [Google Scholar]
- 24.Wang X, Qian X, Beitler JJ, Chen ZG, Khuri FR, Lewis MM, et al. Detection of circulating tumor cells in human peripheral blood using surface-enhanced Raman scattering nanoparticles. Cancer Res. 2011;71:1526–1532. doi: 10.1158/0008-5472.CAN-10-3069. [DOI] [PMC free article] [PubMed] [Google Scholar]
- 25.Thomson JA, Itskovitz-Eldor J, Shapiro SS, Waknitz MA, Swiergiel JJ, Marshall VS, et al. Embryonic stem cell lines derived from human blastocysts. Science. 1998;282:1145–1147. doi: 10.1126/science.282.5391.1145. [DOI] [PubMed] [Google Scholar]
- 26.Maxwell JT, Somasuntharam I, Gray WD, Shen M, Singer JM, Wang B, et al. Bioactive nanoparticles improve calcium handling in failing cardiac myocytes. Nanomedicine (Lond) 2015;10:3343–3357. doi: 10.2217/nnm.15.126. [DOI] [PMC free article] [PubMed] [Google Scholar]
- 27.Wang X, Qian X, Beitler JJ, Chen ZG, Khuri FR, Lewis MM, et al. Detection of circulating tumor cells in human peripheral blood using surface-enhanced Raman scattering nanoparticles. Cancer Res. 2011;71:1526–1532. doi: 10.1158/0008-5472.CAN-10-3069. [DOI] [PMC free article] [PubMed] [Google Scholar]
- 28.Nguyen DC, Hookway TA, Wu Q, Jha R, Preininger MK, Chen X, et al. Microscale generation of cardiospheres promotes robust enrichment of cardiomyocytes derived from human pluripotent stem cells. Stem Cell Reports. 2014;3:260–268. doi: 10.1016/j.stemcr.2014.06.002. [DOI] [PMC free article] [PubMed] [Google Scholar]
- 29.Han J, Wu Q, Xia Y, Wagner MB, Xu C. Cell alignment induced by anisotropic electrospun fibrous scaffolds alone has limited effect on cardiomyocyte maturation. Stem Cell Res. 2016;16:740–750. doi: 10.1016/j.scr.2016.04.014. [DOI] [PMC free article] [PubMed] [Google Scholar]
- 30.Jha R, Xu RH, Xu C. Efficient differentiation of cardiomyocytes from human pluripotent stem cells with growth factors. Methods Mol Biol. 2015;1299:115–131. doi: 10.1007/978-1-4939-2572-8_9. [DOI] [PMC free article] [PubMed] [Google Scholar]
- 31.Tang C, Lee AS, Volkmer J-P, Sahoo D, Nag D, Mosley AR, et al. An antibody against SSEA-5 glycan on human pluripotent stem cells enables removal of teratoma-forming cells. Nat Biotech. 2011;29:829–834. doi: 10.1038/nbt.1947. [DOI] [PMC free article] [PubMed] [Google Scholar]
- 32.Choi CH, Alabi CA, Webster P, Davis ME. Mechanism of active targeting in solid tumors with transferrin-containing gold nanoparticles. Proc Natl Acad Sci U S A. 2010;107:1235–1240. doi: 10.1073/pnas.0914140107. [DOI] [PMC free article] [PubMed] [Google Scholar]
- 33.Fong CY, Peh GS, Gauthaman K, Bongso A. Separation of SSEA-4 and TRA-1-60 labelled undifferentiated human embryonic stem cells from a heterogeneous cell population using magnetic-activated cell sorting (MACS) and fluorescence-activated cell sorting (FACS) Stem Cell Rev. 2009;5:72–80. doi: 10.1007/s12015-009-9054-4. [DOI] [PubMed] [Google Scholar]
- 34.Shiraki N, Shiraki Y, Tsuyama T, Obata F, Miura M, Nagae G, et al. Methionine metabolism regulates maintenance and differentiation of human pluripotent stem cells. Cell Metab. 2014;19:780–794. doi: 10.1016/j.cmet.2014.03.017. [DOI] [PubMed] [Google Scholar]
- 35.Tateno H, Onuma Y, Ito Y, Minoshima F, Saito S, Shimizu M, et al. Elimination of tumorigenic human pluripotent stem cells by a recombinant lectin-toxin fusion protein. Stem Cell Reports. 2015;4:811–820. doi: 10.1016/j.stemcr.2015.02.016. [DOI] [PMC free article] [PubMed] [Google Scholar]
- 36.Matsuura K, Seta H, Haraguchi Y, Alsayegh K, Sekine H, Shimizu T, et al. TRPV-1-mediated elimination of residual iPS cells in bioengineered cardiac cell sheet tissues. Sci Rep. 2016;6:21747. doi: 10.1038/srep21747. [DOI] [PMC free article] [PubMed] [Google Scholar]
- 37.Ben-David U, Gan QF, Golan-Lev T, Arora P, Yanuka O, Oren YS, et al. Selective elimination of human pluripotent stem cells by an oleate synthesis inhibitor discovered in a high-throughput screen. Cell Stem Cell. 2013;12:167–179. doi: 10.1016/j.stem.2012.11.015. [DOI] [PubMed] [Google Scholar]
- 38.Lee MO, Moon SH, Jeong HC, Yi JY, Lee TH, Shim SH, et al. Inhibition of pluripotent stem cell-derived teratoma formation by small molecules. Proc Natl Acad Sci U S A. 2013;110:E3281–E3290. doi: 10.1073/pnas.1303669110. [DOI] [PMC free article] [PubMed] [Google Scholar]
- 39.Ben-David U, Nudel N, Benvenisty N. Immunologic and chemical targeting of the tight-junction protein Claudin-6 eliminates tumorigenic human pluripotent stem cells. Nat Commun. 2013;4 doi: 10.1038/ncomms2992. [DOI] [PubMed] [Google Scholar]
- 40.Huskey NE, Guo T, Evason KJ, Momcilovic O, Pardo D, Creasman KJ, et al. CDK1 inhibition targets the p53-NOXA-MCL1 axis, selectively kills embryonic stem cells, and prevents teratoma formation. Stem Cell Reports. 2015;4:374–389. doi: 10.1016/j.stemcr.2015.01.019. [DOI] [PMC free article] [PubMed] [Google Scholar]
Associated Data
This section collects any data citations, data availability statements, or supplementary materials included in this article.


