

ABSTRACT
Alginate beads represent a simple and highly reproducible in vitro model system for diffusion-limited bacterial growth. In this study, alginate beads were inoculated with Pseudomonas aeruginosa and followed for up to 72 h. Confocal microscopy revealed that P. aeruginosa formed dense clusters similar in size to in vivo aggregates observed ex vivo in cystic fibrosis lungs and chronic wounds. Bacterial aggregates primarily grew in the bead periphery and decreased in size and abundance toward the center of the bead. Microsensor measurements showed that the O2 concentration decreased rapidly and reached anoxia ∼100 μm below the alginate bead surface. This gradient was relieved in beads supplemented with NO3− as an alternative electron acceptor allowing for deeper growth into the beads. A comparison of gene expression profiles between planktonic and alginate-encapsulated P. aeruginosa confirmed that the bacteria experienced hypoxic and anoxic growth conditions. Furthermore, alginate-encapsulated P. aeruginosa exhibited a lower respiration rate than the planktonic counterpart and showed a high tolerance toward antibiotics. The inoculation and growth of P. aeruginosa in alginate beads represent a simple and flexible in vivo-like biofilm model system, wherein bacterial growth exhibits central features of in vivo biofilms. This was observed by the formation of small cell aggregates in a secondary matrix with O2-limited growth, which was alleviated by the addition of NO3− as an alternative electron acceptor, and by reduced respiration rates, as well as an enhanced tolerance to antibiotic treatment.
IMPORTANCE Pseudomonas aeruginosa has been studied intensively for decades due to its involvement in chronic infections, such as cystic fibrosis and chronic wounds, where it forms biofilms. Much research has been dedicated to biofilm formation on surfaces; however, in chronic infections, most biofilms form small aggregates of cells not attached to a surface, but embedded in host material. In this study, bacteria were encapsulated in small alginate beads and formed aggregates similar to what is observed in chronic bacterial infections. Our findings show that aggregates are exposed to steep oxygen gradients, with zones of oxygen depletion, and that nitrate may serve as an alternative to oxygen, enabling growth in oxygen-depleted zones. This is important, as slow growth under low-oxygen conditions may render the bacteria tolerant toward antibiotics. This model provides an alternative to surface biofilm models and adds to the comprehension that biofilms do not depend on a surface for formation.
KEYWORDS: Pseudomonas aeruginosa, biofilm, spatial structure, chronic infection, antibiotics, growth, respiration, model system
INTRODUCTION
Bacteria associated with humans, both in health and in disease, are predominantly organized in aggregated cell consortia, also known as biofilms. Biofilm aggregates are characteristic of chronic bacterial infections but their in vivo function, metabolism, and growth remain largely unknown due to the lack of suitable in vitro models (1, 2). In this study, we employed the opportunistic pathogen Pseudomonas aeruginosa, which plays a major role in chronic infections and is a key model organism for studying biofilm formation and persistence in chronic infections. P. aeruginosa is capable of causing acute and chronic infections in wounds (3) and in the lungs of cystic fibrosis (CF) patients (4, 5). The ability to persist in chronic infections is ascribed to the biofilm-forming capability of P. aeruginosa, which enables it to survive antibiotic treatment and evade host defenses (6, 7). This persistence is governed by a high adaptability of P. aeruginosa to environmental changes thought to be a result of its highly flexible metabolism (8).
Most knowledge on medically relevant bacterial biofilms is based on the application of in vitro continuous-flow cell systems and 96-well plates, where biofilms are grown on surfaces and form a variety of structures, including the characteristic mushroom structure (9), albeit these structures have never been observed in vivo (1). Nevertheless, such surface-associated biofilms can exhibit in vivo-like characteristics with regard to diffusion-limited bacterial growth and differential tolerance across the biofilm depth to antibiotics and host immune responses (10). While this in vitro model may be well suited for studying some infections, including urinary tract or catheter biofilm formation, the opportunistic pathogen P. aeruginosa has never been observed in biofilms colonizing the epithelial cell surface in CF airways or in chronic wounds (7, 11). Instead, these chronic infections are characterized by the presence of nonattached relatively small (<50- to 100-μm wide) cell aggregates embedded in host material, such as wound bed slough or CF lung mucus constituting what we now term the secondary matrix. In the secondary matrix, bacterial aggregates are often surrounded by dense aggregations of host immune cells, such as polymorphonuclear leukocytes (PMNs), which contribute to a chronic state of inflammation (12, 13). The intense O2 consumption by the respiratory burst of activated PMNs (14) facilitates strong local O2 depletion (15), which may render bacterial cell aggregates surrounded by PMNs largely anoxic (16, 17).
Under low-O2 conditions in biofilm cell aggregates and in endobronchial secretions in CF airways (18), P. aeruginosa can grow anaerobically by utilizing the alternative electron acceptors, NO3− and NO2−, which are present in appropriate amounts (19, 20). In chronic wounds, P. aeruginosa is observed colonizing deep wound regions, 50 to 60 μm from the wound surface (21), which may also be attributed to its capability for anaerobic respiration.
The physiochemical conditions, such as hypoxia and anoxia, and the embedment of aggregates in a secondary matrix are hard to mimic in present in vitro model systems. The O2 status of biofilm aggregates is thought to have a strong impact on the antibiotic tolerance of pathogenic bacteria (22). Low growth rates under hypoxia or anoxia in biofilms associated with chronic infections can have serious implications, as antibacterial treatment strategies are usually developed for aerobic fast-growing planktonic bacteria but have little impact on biofilm infections (23). To study the persistence of pathogenic bacteria such as P. aeruginosa in chronic infections, there is a need for better in vitro biofilm models mimicking the central traits of the in vivo biofilm. This would enable us to gain new knowledge of the central aspect of biofilm infections, as well as to improve diagnostics and testing of new strategies for antimicrobial treatment under in vivo-like conditions. In this study, we demonstrate a simple, reproducible in vitro biofilm system enabling P. aeruginosa to grow as spatially structured aggregates with size and growth characteristics similar to those seen in CF lungs (17) and chronic wounds (1).
RESULTS
Bacterial growth and organization in alginate beads.
When grown in alginate beads, P. aeruginosa formed micrometer-sized (∼100 to 200 μm3) heterogeneously distributed dense aggregates similar to those observed in the CF lung (Fig. 1). The aggregates formed primarily at the periphery of the beads, but this tendency was alleviated by the addition of the alternative electron acceptor NO3− (Fig. 2). We found that P. aeruginosa colonies grew deeper into the alginate beads when supplemented with NO3− (mean depth, 155.1 μm with NO3− versus 33.6 μm without NO3−, P < 0.001) (Fig. 3). The apparent growth rates of alginate-encapsulated P. aeruginosa were estimated by quantitative peptide nucleic acid fluorescence in situ hybridization (PNA-FISH), based on a previously described linear correlation between relative fluorescence of PNA-FISH-stained rRNA molecules in P. aeruginosa and the growth rate (17). We found no significant correlation between growth depth and apparent growth rate in the presence of NO3−. By contrast, we found a significant negative correlation between growth depth and apparent growth rate without added NO3− (P = 0.040). Interestingly, P. aeruginosa growing without NO3− showed a higher growth rate during the initial 12 h of growth than with NO3− (P < 0.001). After 24 h, the apparent growth rate was highest for the NO3− group (P < 0.001), while there was no significant difference between the two groups after 48 h, and after 72 h, the apparent growth rate was again the highest for the NO3− group (P < 0.001). There was a negative correlation between time and apparent growth rate for beads without NO3− (P = 0.005) but not for beads with NO3−; this difference in effect was significant (P = 0.003). Peripheral colonies directly on the surface of the bead (depth, 0 μm) were excluded from the statistical analysis as these colonies had an ample supply of O2.
FIG 1.
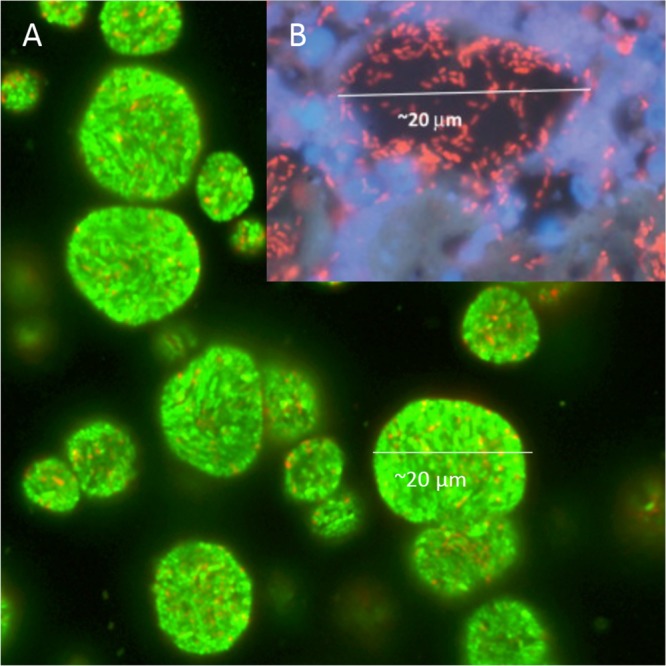
In vitro and in vivo aggregates of P. aerugionsa. (A) Confocal laser scanning microscopy (CLSM) image of alginate-encapsulated green fluorescent protein (GFP)-tagged P. aeruginosa PAO1 (green) grown in vitro for 24 h. (B) CLSM image of in vivo aggregate of P. aeruginosa (red) from chronic infected cystic fibrosis (CF) lung visualized with a peptide nucleic acid (PNA) fluorescence in situ hybridization (FISH) probe. The polymorphonuclear leukocytes surrounding the aggregate are stained with DAPI (4′,6-diamidino-2-phenylindole; blue). Reprinted from Bjarnsholt et al. (1) with permission.
FIG 2.
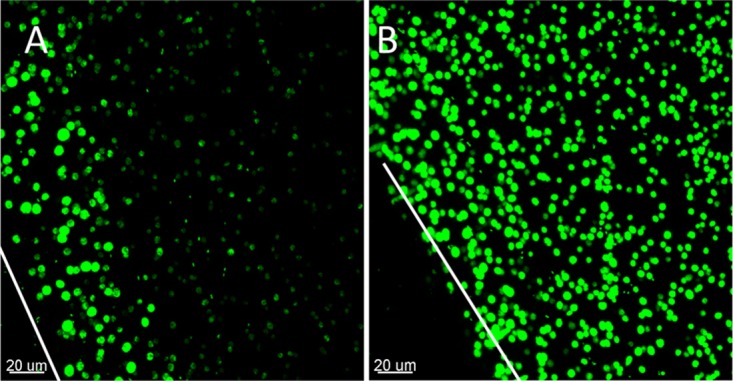
Alginate-encapsulated GFP-tagged P. aeruginosa PAO1 after 24 h of growth. CLSM images are of controls without (A) and those with (B) NO3−. The white lines correspond to the edge of the alginate beads (z lines), which are cut in half and imaged from the cut surface.
FIG 3.

Growth rates expressed as relative fluorescence in arbitrary units (a.u.) as a function of depth within the alginate beads, grown with and without NO3− and at different growth stages. P. aeruginosa was fluorescently labeled with a Texas Red-conjugated PNA-FISH probe and imaged by CLSM, and the fluorescence intensities were quantified in ImageJ.
Size and spatial structure of aggregates in alginate beads.
When considering total aggregate volume in the beads, we generally found an average aggregate volume that was higher in beads supplemented with NO3− (Fig. 4A), but this difference was only significant after 48 h (P = 0.0059). The same pattern applied to the total biomass (Fig. 4B), but here, the difference was only significant after 24 h (P = 0.0012). To assess the suitability of the alginate bead model for mimicking aggregate size as observed in chronic infections, we used area measurements (rather than volume) as data on CF lung tissue and chronic wound samples are only available in two dimensions (2D). The average (± standard deviation [SD]) cross-sectional areas of P. aeruginosa aggregates in the bead model after 24 h of growth were 77 μm2 ± 59 μm2 and 175 μm2 ± 100 μm2 in the absence and presence of NO3−, respectively. To determine the spatial structures of aggregates in the beads, we looked at the aggregates closest to the bead surface (T [top]) and compared them with aggregates deeper in the beads (B [bottom]). Our results revealed that significantly more biomass was situated in the bead periphery at each time point without nitrate (Fig. 5A) (P = 0.0394, 0.0213, and 0.0362 at 24, 48, and 72 h, respectively), but in the NO3−-supplemented beads, the differences disappeared after 24 h, resulting in an almost equal distribution of biomass after 72 h. Furthermore, we observed significantly larger aggregates in the bead periphery after 48 and 72 h of growth (P = 0.0028 and P = 0.0412, respectively) in beads without NO3− (Fig. 5B). In the NO3−-supplemented beads, aggregate sizes were more evenly distributed throughout the beads over time, except at 48 h (P = 0.0058) (Fig. 5B).
FIG 4.
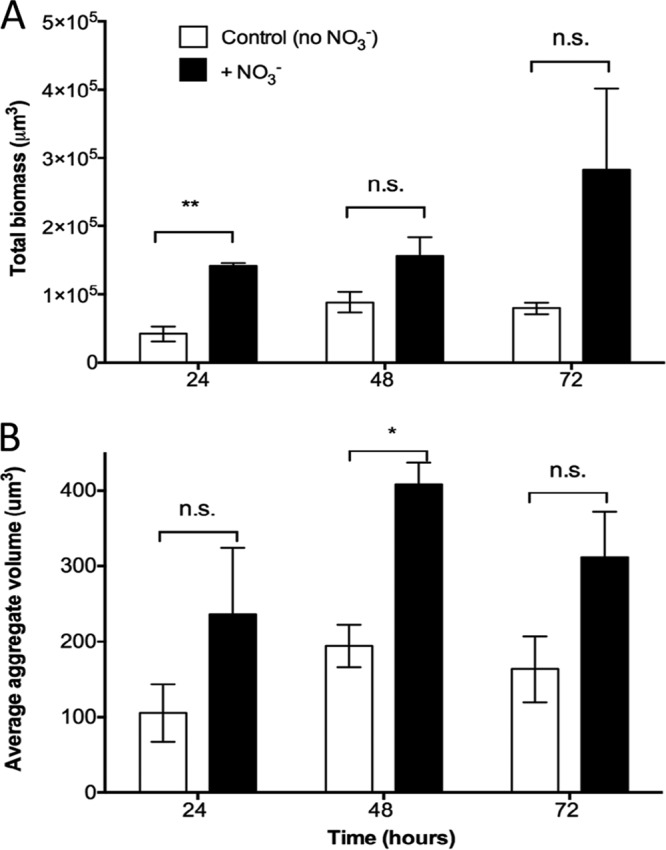
(A) Growth of alginate-encapsulated GFP-tagged P. aeruginosa as determined by quantification of total biomass in control beads (no NO3−) and NO3−-supplemented beads over time. Total biomass was quantified as the number of green fluorescent voxels. (B) Average P. aeruginosa aggregate volumes in alginate beads over time. Bars represent averages ± standard errors of the means from three replicates. In each group, >1,000 aggregates were analyzed. n.s., not significant; *, P < 0.05; **, P < 0.001.
FIG 5.
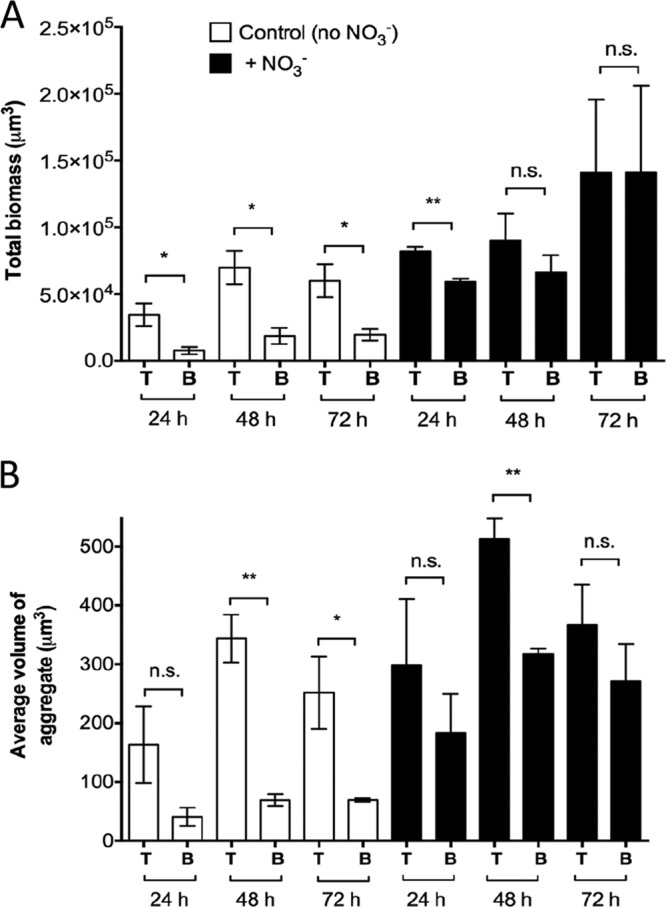
Spatial structure of alginate-encapsulated GFP-tagged P. aeruginosa PAO1. (A) Total biomass in the top (T) part, near the surface of the bead, and bottom (B) part of the image representing deeper parts of the beads. (B) Average aggregate volumes in the top (T) and bottom (B) parts of the images. The images were split in half at approximately 106 μm from the surface of the bead across the x axis. Bars represent averages ± standard errors of the means from three replicates. n.s., not significant, *, P < 0.05; **, P < 0.001.
Respiration rates and O2 distribution.
O2 measurements showed a linear decrease in O2 concentration over time (Fig. 6A) (r2 = 0.99, P < 0.0001). Respiration rates of P. aeruginosa grown planktonically at 100 and 180 rpm were significantly higher (ρ = 0.46 ± 0.21 nmol O2 cell−1 s−1, P < 0.001 and ρ = 0.29 ± 0.21 nmol O2 cell−1 s−1, P = 0.012, respectively) than the volumetric respiration rate of alginate-encapsulated P. aeruginosa grown at 100 rpm (Fig. 6B). There was no significant difference between P. aeruginosa grown planktonically at 100 rpm and 180 rpm. Beads were not grown at 180 rpm due to mechanical rupture.
FIG 6.

Respiration rate of P. aeruginosa PAO1. (A) Linear decrease in O2 concentration over time exemplified by the respiration rate of alginate-encapsulated P. aeruginosa after 4 h 50 min growth (r2 = 0.998; P < 0.0001). (B) Volumetric respiration rates, R, for alginate-encapsulated and planktonic P. aeruginosa calculated from the change in O2 concentrations at different time points during the experiment. Bars represent averages ± standard errors of the means from three or four replicates. ***, P < 0.0001.
We estimated an average O2 penetration depth of ∼50 μm in the alginate beads during 5 to 24 h of growth (Fig. 7A). To verify our calculated O2 penetration depth based on the respiration rate measurements, we conducted fiber-optic O2 microsensor profiling in similar beads, which confirmed that O2 was depleted within 50 to 100 μm from the surface of the bead (Fig. 7B).
FIG 7.
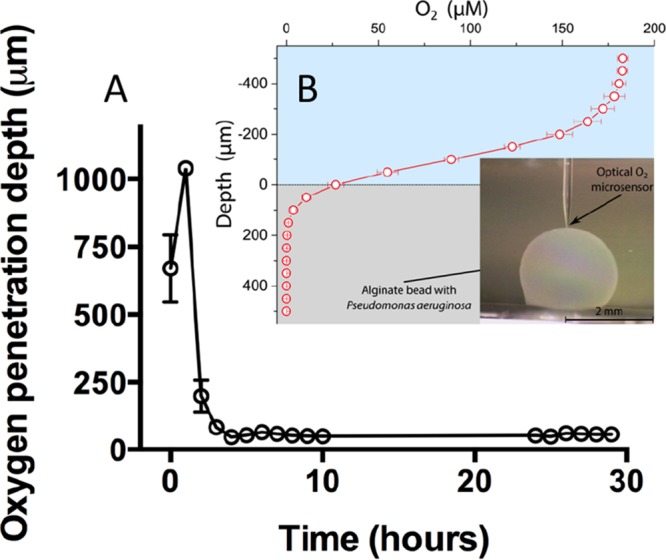
Oxygen penetration depth in alginate beads with P. aeruginosa. (A) Calculated O2 penetration depth (μm) during the time course of the experiment. Bars represent averages ± standard errors of the means from four replicates. Calculations were performed on the background of respiration rate measurements. (B) O2 microsensor profiles of P. aeruginosa grown in alginate beads for 24 h. The depicted profile is an average from six profiles obtained on three independent beads. Bars represent averages ± standard deviations. The inset shows the optical O2 microsensor touching the surface of the bead. All measurements were performed at 37°C.
Expression profiles.
In support of the fact that alginate-encapsulated bacteria display a significantly lower volumetric respiration rate than their planktonic counterpart and physiological zonations are present in the beads due to steep O2 gradients, we performed transcriptional profiling. Profiles were obtained from planktonic P. aeruginosa and alginate-encapsulated P. aeruginosa grown in culture flasks shaken at 100 rpm for 24 h at 37°C with and without NO3− supplementation. When comparing expressional profiles of alginate-encapsulated P. aeruginosa to a planktonic reference, 170 genes exhibited a >3-fold change in expression (see Table S2 in the supplemental material), with 17 upregulated and 153 downregulated genes. Some of the most notable upregulated genes were ibpA and the Anr-regulated genes arcDABC, uspK, and uspN (see Table S2 for roles and descriptions). When comparing alginate-encapsulated P. aeruginosa to an alginate-encapsulated reference with NO3− supplementation, 141 genes were >3-fold differentially expressed, with 29 exhibiting upregulation and 112 showing downregulation. Besides the previously mentioned upregulated genes, we found oprG and the ccON2-encoded gene to be >3-fold induced (data not shown).
Among the 141 genes, a total of 104 genes (underlined in Table S2) were identical to the 170 genes from the first comparison (Fig. 8A). Accordingly, when comparing the profiles of the two previously employed references (alginate-encapsulated P. aeruginosa supplemented with NO3− versus planktonic culture) we found similar genetic expressions between the two (Fig. 8A and B), as only 24 genes were differentially expressed >3-fold. Two genes with >3-fold downregulation were shared among all three comparison subsets, namely, PA0456 (probable cold shock protein) and PA1869 (probable acyl carrier protein) (Fig. 8A) (highlighted in gray in Table S2).
FIG 8.

Differentially regulated genes, including those >3-fold up- and downregulated, in comparisons among the three in vitro conditions investigated with microarray. (A) Venn diagram comparing the genetic expressions of alginate-encapsulated P. aeruginosa (beads) with those of a planktonic reference culture of P. aeruginosa (dotted), where 170 genes showed >3-fold differential expression. When comparing alginate-encapsulated P. aeruginosa with and without NO3− (white), 141 genes were >3-fold differentially expressed, and 104 of the genes were identical with those differentially regulated when comparing beads to planktonic culture. When comparing alginate-encapsulated P. aeruginosa with NO3− with a planktonic reference culture (gray), just 24 genes showed differential expression of >3-fold. The differential expression of 2 genes (PA0456 and PA1869) was shared between all three subsets of comparisons (see Table S2, highlighted in gray). (B) Heat map of microarray data from alginate-encapsulated P. aeruginosa with and without NO3− and a planktonic culture. The relative gene expressions are depicted according to the color scale shown in the top right corner.
None of the genes related to denitrification were induced >3-fold when comparing alginate-encapsulated P. aeruginosa supplemented with NO3− to any of the other conditions, but we did find a moderate induction of narK1 and narI (∼2-fold) when comparing the NO3−-supplemented beads to the reference without NO3−, and likewise, when comparing to the planktonic reference, we found an ∼2.5-fold induction of narK1 and narI and an ∼2-fold induction of norB.
The downregulated genes were involved in translation, posttranslation, and degradation, predominantly genes encoding ribosomal proteins in the 30S and 50S subunits of the 70S ribosome (rpm, rpl, and rps) (framed in Table S2). Furthermore, we found a broad repression of genes associated with iron regulation. The following genes, all regulated by the ferric uptake regulator (Fur), were repressed in alginate-encapsulated P. aeruginosa in comparison to the planktonic reference: sigma factor PvdS PA2426 (PvdS), ferri-siderophore receptor genes PO2398 (fpvA) and PA4221 (fptA), siderophore (pyochelin) biosynthesis genes PA4226 (pchE) and PA4228 to PA4231 (pchDCBA), and siderophore (pyoverdine) system-related genes PA2386 (pvdA), PA2394 (pvdN), PA2396 to PA2399 (pvdFEAD), and PA2401 (pvdJ) (see Table S2).
Antibiotic tolerance.
Observation by confocal laser scanning microscopy (CLSM) and viability staining with Syto9 and propidium iodide (PI) revealed that alginate-encapsulated P. aeruginosa cells were susceptible to tobramycin at 100× the MIC (100 μg ml−1) immediately after encapsulation, when the bacteria were still in a planktonic state (Fig. 9D). However, when allowed first to grow for 24 or 48 h, P. aeruginosa prevailed for 24 h in the presence of tobramycin at 100× the MIC (100 μg ml−1) (Fig. 9E and F).
FIG 9.
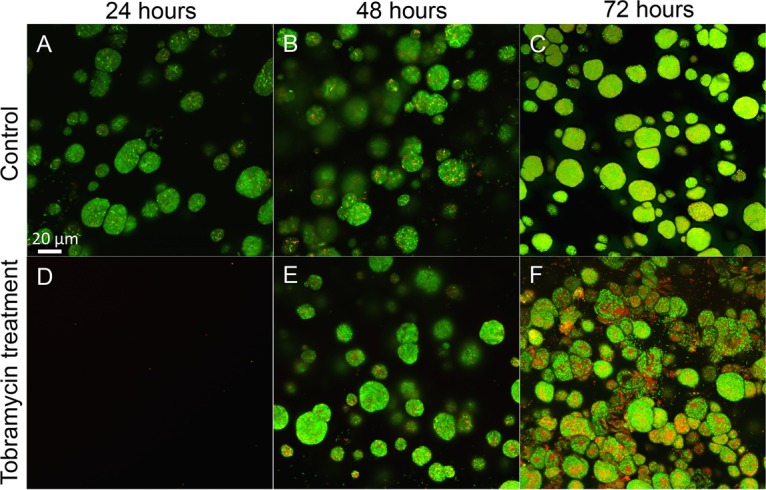
Antibiotic tolerance of alginate-encapsulated P. aeruginosa PAO1. (A to C) CLSM images of nontreated control beads with P. aeruginosa grown for 24, 48, and 72 h. (D to F) CLSM images of alginate-encapsulated P. aeruginosa treated with 100 μg/ml tobramycin for 24 h. (D) P. aeruginosa exposed to tobramycin just after encapsulation (when still in single-cell planktonic state). P. aeruginosa was allowed to form aggregates for 24 h (E) or 48 h (F) before the exposure to tobramycin. Tobramycin exposure lasted for 24 h. Notice how the majority of the bacteria are green (alive) in spite of 24-h antibiotic treatment. Viability staining was with Syto9 and PI. Green bacteria are alive and red/yellow bacteria are dead. Bar, 20 μm.
DISCUSSION
The goal of this study was to develop an in vitro model system that recapitulates the physical aspects of nonattached aggregate growth observed in chronic infections and provides a versatile platform for studying bacterial aggregates. The model uses alginate-encapsulated (24, 25) P. aeruginosa, mimicking growth conditions under diffusion limitation through the secondary matrix as seen in chronic infections (26). By incorporating the alternative electron acceptor NO3− into the beads, we mimicked and studied the anaerobic growth patterns in P. aeruginosa. To establish the relevance of the model, we compared the observed aggregate sizes to previous measurements of P. aeruginosa aggregates in CF lungs and chronic wounds. Kragh et al. (17) analyzed 59 biofilms from 20 ex vivo lung tissue samples from three CF patients and found the areas of biofilm aggregates ranged from 4 to 3,227 μm2, and we found the areas of aggregates to range from 23 to 342 μm2 (24 to 438 μm2 when supplemented with NO3−), which is within the same range. In a review by Bjarnsholt et al. (1), the diameters of aggregates in a range of chronic infections were measured and were found to be within 5 and 50 μm for the smallest and largest biofilms, respectively (∼20 to 2,000 μm2, respectively, when assuming the aggregates were spherical). Thus, alginate-encapsulated P. aeruginosa had an aggregate size (Fig. 4A) within the same range found in CF lungs (17) and other chronic infections (1). In addition, the aggregates were separated by a secondary matrix similar to what is observed in the lungs of CF patients (Fig. 1B), and there was no attachment to a surface.
We found steep O2 concentration gradients in the alginate beads (Fig. 7A and B), which is also a recognized feature in chronic infections (18, 27–29). The aggregates formed primarily in the outermost ∼100 μm of the beads (Fig. 2A), corresponding to the oxygenated zone where larger aggregates and, hence, a larger proportion of the biomass, are situated in comparison to deeper sites (Fig. 5A and B). This, together with the diffusion-limited supply of O2, led to a strong depletion of this preferred electron acceptor in the periphery of the alginate beads (30). A comparable O2 distribution was reported by Walters et al. (31), who found an O2 penetration depth of 50 to 90 μm into dense bacterial colonies, while Pabst et al. (32) found a similar heterogeneous bacterial distribution when studying gel-entrapped Staphylococcus aureus. In the CF lung, P. aeruginosa can grow in hypoxic/anaerobic mucus (18), which may be supported by the alternative electron acceptor NO3− (33). We alleviated electron acceptor limitation by adding 100 mM NO3− to the system, which resulted in a more homogenous growth and extended distribution of bacterial aggregates within the beads (Fig. 2B). After 72 h of growth with the NO3− supplement (Fig. 5A), the observed difference between the total biomasses in the top and bottom halves disappeared, indicating that peripheral growth was indeed a result of O2 limitation in the absence of NO3−, and supplying NO3− as an alternative electron acceptor reduced P. aeruginosa's need to be positioned in oxygenated zones. The use of 100 mM NO3− in the experiments is based on previous studies, where 100 mM NO3− was shown to yield high cell densities (34, 35). The concentrations of NO3− reported from CF sputum rarely exceed 1 mM (20, 33); however, the use of 100 mM NO3− may be argued against as measurements of NO3− concentrations in CF lungs are based on bulk measurements or homogenates of sputum, meaning that niches containing high concentrations of NO3− may exist.
The estimated apparent growth rates of P. aeruginosa in alginate beads decreased with time and with increasing depth into the beads (Fig. 3), but such growth limitation due to O2 depletion was alleviated by NO3− supplementation. These observations in the alginate bead model support previous speculations that the availability of NO3− contributes to the apparent lack of internal gradients of growth in P. aeruginosa biofilm aggregates in the endobronchial mucus of CF patients with chronic lung infections (18), where O2 is restricted by the intensive oxygen consumption by activated PMNs (14, 33). Furthermore, our finding that NO3− supplementation sustained the growth of P. aeruginosa microcolonies under O2 depletion may explain in vivo findings of P. aeruginosa residing deeper within wound beds of patients suffering from chronic wounds (11). In this respect, the lower concentrations of NO3− and NO2− observed in infected wounds compared with those in noninfected wounds (36) suggest consumption via bacterial denitrification. The respiration rate of alginate-encapsulated P. aeruginosa was significantly lower than in their planktonic growth mode; respiration rates were of similar magnitude as those observed in other studies of planktonic bacteria (37, 38). Alginate-encapsulated bacteria were less metabolically active due to steep O2 gradients within the alginate beads, a fact that was supported by our transcriptional analysis. The upregulation of the Anr-controlled genes PA3309 (uspK), PA4352 (uspN), PA5170 to PA5173 (arcDABC), PA4067 (oprG), and PA1557 (ccON2-encoded gene) in alginate beads corresponds to results from previous studies showing that these genes were highly expressed in P. aeruginosa biofilms (39, 40) and were predominantly associated with metabolism, O2 limitation, anaerobic survival, and stationary-phase growth (34, 41). Anr is a key regulator that induces the expression of genes during hypoxia and can be regarded as a marker for hypoxic or anaerobic growth (41). However, the Anr regulon itself was not upregulated, in line with the finding of Alvarez-Orgeta et al. (34) that a change in the transcriptional level of the Anr regulon is not in itself an essential component in the response to low O2. The 10-fold induced gene PA3126 (ibpA) (42–45) encodes a protein with high similarity to the Escherichia coli heat shock protein IbpA, which is usually not induced during anaerobiosis in E. coli (41, 46), but is recognized as a responder to low oxygen in other bacterial species (47). In the absence of O2 and in the presence of NO3− or NO2−, P. aeruginosa can grow by denitrification (48). Thus, we expected an induction of the nitrate reductase genes (narGHJI) (20) when comparing genetic expression profiles from NO3−-supplemented beads to profiles from beads without NO3−. Surprisingly, nitrate reductase genes were not induced >3-fold in the NO3−-supplemented beads, but according to Alvarez-Ortega et al. (34), the elevation of nitrate reductase genes is not indicative of anaerobic denitrification. In fact, P. aeruginosa may upregulate denitrification genes as a response to low oxygen irrespective of NO3− availability. Furthermore, P. aeruginosa can sustain moderate anaerobic growth by arginine (49) and pyruvate fermentations, which do not support growth but facilitate long-term survival (50). We found that the alcohol dehydrogenase gene adhA was induced, which is indicative of fermentation (41), another important adaptation to a microanaerobic or anaerobic environment. The overall downregulation of genes involved in translation, posttranslational modification, and degradation is in concordance with the findings of Trunk et al. (41). Metabolically active and fast-growing cells synthesize ribosomes, and so a higher expression of ribosomes in a planktonic culture is expected. Williamson et al. (45) found the ribosomal proteins to be expressed >2-fold at the top of an in vitro biofilm compared with at the bottom, again supporting the idea that the alginate-encapsulated bacteria become O2 limited. The downregulation of stationary-phase sigma factor rpoS (45, 51) and quorum-sensing (QS) regulators lasR (∼2-fold) and rhlR (45) indicates low metabolic activity, which is further supported by the downregulation of PA4853 (fis) (43), a gene associated with early exponential growth. One of the most notable findings was the broad repression of genes associated with iron regulation, which is concordant with findings by Chang et al. (52) and James et al. (29). The general repression of iron regulation genes may be due to the iron-binding properties of alginate, thus concentrating iron from the growth medium in the alginate beads over time (53). PA4468 (sodM) and PA4470 (fumC) were also downregulated, which is concordant with the general repression of genes related to iron limitation, as sodM (34) and fumC (54) are only activated in cases of iron deprivation. All in all, this is supportive of our findings that alginate-encapsulated P. aeruginosa experiences a lower respiration rate than its planktonic counterpart due to O2 limitation, resulting in the expression of genes associated with hypoxia stress and low metabolic activity.
The alginate bead model displayed a characteristic biofilm-associated tolerance toward tobramycin. Newly embedded active P. aeruginosa in the “planktonic state” was susceptible to tobramycin and eradicated upon treatment (Fig. 9D). This confirmed that tobramycin is capable of penetrating the alginate beads (55) and that the effect of tobramycin is dependent on the physiological growth stage of P. aeruginosa rather than on transport limitation. While the underlying reasons remain elusive, one hypothesis could be that the hypoxic conditions and low respiration rate of alginate-encapsulated bacteria antagonize the effect of tobramycin (31), and thus, the increased tolerance toward antibiotics is in part due to the differences in physiological and metabolic growth stages (56). We found that the genetic expression profiles of planktonic bacteria and those of alginate-encapsulated bacteria supplemented with NO3− were highly similar, as depicted graphically in a Venn diagram and heat map (Fig. 8A and B). This suggests that genetic expression in the latter case was not affected by the aggregated state but rather by alleviating the electron acceptor limitation with NO3−. Furthermore, antibiotic tolerance is a reversible state, as the antibiotic susceptibility can be restored if bacteria are released from biofilms (31) or are reoxygenated (57).
Collectively, the results provide insight into the physiochemical environment of nonattached aggregates and an alternative to surface attachment models. The model recapitulates the physical aspects of microbial biofilms in terms of antibiotic tolerance, heterogeneous growth, which was alleviated by adding NO3−, and hypoxia, as confirmed by microsensor measurements and transcriptional analysis. With the alginate bead model, it is thus possible to mimic in vivo chronic infections, thereby helping to bridge the gap between in vitro and in vivo biofilms.
MATERIALS AND METHODS
Bacterial strains and media.
The P. aeruginosa strain PAO1 was obtained from the Pseudomonas Genetic Stock Center at East Carolina University and was used in all experiments. A stable green fluorescent protein (GFP) constitutively expressed by plasmid pMRP9 (58) was used to tag the bacteria. Overnight (ON) cultures were propagated from −80°C frozen culture stocks and grown overnight in lysogeny broth (LB) for ∼18 h at 37°C under continuous shaking at 180 rpm. The LB ON culture was subsequently used for inoculation in low-nutrition R2A broth (Lab M Ltd, UK) supplemented with 0.05 M Tris-HCl buffer (pH 7.6) and 0.5% glucose (abbreviated R2A), and was left to acclimatize ON until further use. The medium-to-volume ratio was 1:2.5.
Bead preparation.
The encapsulation of P. aeruginosa in alginate beads was performed using a modification of the methods by Pedersen et al. (59) and Behrendt et al. (24). Autoclaved seaweed alginate (2% [wt/vol]) (Protanal LF 10/60 FT; FMC Biopolymer, Norway) was dissolved in milli-Q water with or without the addition of 100 mM potassium nitrate (KNO3) (P8394; Sigma-Aldrich, USA) (34, 35). An ON culture of P. aeruginosa in R2A was adjusted to a final optical density at 450 nm (OD450) of 0.1 in alginate. Droplets of the alginate with bacteria were dispensed via a 21-gauge needle placed 3 cm above the surface of a stirred 0.25 M CaCl2 solution, wherein the beads were hardened for 1 h. This procedure was previously reported to yield spherical and stable beads (60). We produced nearly uniform spherical beads of 2.4 ± 0.1 mm (mean ± SD) with this procedure. Hardened beads were rinsed in 0.9% NaCl before being transferred to prewarmed R2A media. In all experiments, beads were incubated in R2A at 100 rpm at 37°C, unless otherwise mentioned.
Viable cell counts.
To release the bacteria, beads were dissolved using a solution of Na2CO3 and citric acid (61), which were mixed in equal amounts before use to yield final concentrations of 0.05 and 0.02 M, respectively. Solubilized beads or planktonic cultures were degassed and sonicated for 5 min, serially diluted, and plated on LB plates for the enumeration of cells by colony formation.
Microscopy and image analysis.
For image analysis of the spatial organization and growth of bacterial aggregates, alginate-encapsulated P. aeruginosa was grown with and without NO3− supplementation and was sampled in triplicates after 24, 48, and 72 h of growth. Beads were cut in half, and images were acquired with CLSM (Zeiss.Z2; LSM 710, Germany) of the cut surface with an emphasis on visualizing the edge of the bead and as much of the bead interior as possible. Images were recorded as z-stacks in 1-μm increments with a 40×/1.3 numerical aperture (NA) oil immersion objective. Image analysis was performed using Imaris v8.3.1 (Bitplane, Switzerland). To calculate 2-dimensional cross-sectional areas of aggregates in the beads after 24 h of growth with and without NO3−, we excluded aggregates <10 μm2 and aggregates touching the edge of the image to avoid planktonic bacteria and incomplete aggregates. To elucidate whether the ability to grow anaerobically impacted the spatial structure and distribution of the bacterial aggregates in beads with and without NO3−, the images were split in half ∼106 μm from the surface of the bead across the x axis to separate the top (T) half from the bottom (B) half of the image, and T and B were compared statistically. Total biomass (all voxels detected), average aggregate volume (object volume), and z positions were calculated with the ImarisVantage module. The total biomass was calculated by first subtracting background fluorescence from all 3-dimensional image stacks. The background fluorescence in the green channel was calculated by creating histograms of three different areas of the edge of the image, and the highest voxel value was determined. The three values were then averaged and a value of 92 voxels was determined as the background fluorescence. Isosurfaces were created of the remaining voxels and the sum of all individual objects was used to calculate the total biomass. The average aggregate volume was also calculated.
Imaging of the alginate bead sections for quantitative PNA-FISH was performed with the same settings used for acquiring all the pictures. Fluorescence images were recorded as 1-μm z-stacks at a resolution of 4,096 by 4,096 pixels, with an averaging of 2 at 16-bit color depth, using a 63×/1.4 NA oil immersion objective and 594 nm laser excitation. Microcolony fluorescence was quantified using ImageJ (National Institutes of Health, USA) using a previously described procedure (17). Colony distances from the periphery of alginate beads were determined with the measuring tool in the microscope image analysis software (Zen2010, version 6.0; Zeiss, Germany).
Quantitative PNA-FISH.
Alginate-encapsulated P. aeruginosa was grown with and without NO3−-supplemented alginate and medium, was sampled chronologically after 12, 24, 48, and 72 h, and was stored at 4°C in 4% formalin (Hounisen, Denmark) with 0.25 M CaCl2 for stabilization. The beads were embedded in paraffin, cut in 4-μm sections with a standard microtome, fixed on glass slides, and kept in the dark at 4°C until further treatment. The sections were deparaffinized and stained with a Texas Red-conjugated 16S rRNA probe (AdvanDx, USA) specific for P. aeruginosa as previously described (17). To stabilize the samples prior to staining, one drop of GN fixation solution (AdvanDx, USA) was applied to each sample and left for incubation at 65°C for 20 min. The slides with alginate bead sections were washed in wash solution (AdvanDx, USA) at 55°C for 30 min, air dried briefly, and then one drop of ProLong Gold antifade reagent (Life Technologies, USA) and a coverslip were applied.
Respiration rate measurements.
Molecular oxygen concentrations were measured with O2-sensitive optode sensor spots (37, 62) mounted with silicon glue on the inside of air-tight cuvettes (35 mm by 12 mm culture tubes; schuett-Biotec, Germany) and monitored through the transparent cuvette wall with a 2-mm fiber-optic cable connected to a fiber-optic O2 meter (Fibox 3; PreSens GmbH, Germany). The optodes were calibrated (in units of μmol O2 liter−1) by a two-point calibration procedure before each experiment using measurements in air-saturated and O2-free R2A at the experimental temperature (37°C) and pH (7.6).
For respiration rate measurements on alginate-encapsulated bacteria, beads were drawn with a transfer pipette from the culture flask, rinsed 3 times with prewarmed 0.9% NaCl, and then transferred to a cuvette filled with prewarmed (37°C) sterile R2A and a glass coated magnet. The cuvette was closed air tight, mounted on a magnetic stirrer, and fitted with the fiber-optic readout cable. Each measurement followed the O2 depletion in the cuvette over time, and the total respiration rate of the beads was calculated from linear parts of the declining O2 concentration versus time curve (in units of μmol O2 liter−1 h−1). Respiration rates of planktonic bacteria were measured in a similar way using planktonic bacteria grown at two different flow speeds, namely, 100 rpm (similar to the beads) and 180 rpm (standard for planktonic cultures). If active cells do not exhibit a homogenous distribution in the beads, the respiration rate (R) will be underestimated. We compensated for the heterogeneous distribution of bacterial cells due to the clustering of bacterial aggregates in the periphery of the beads by using the calculated values of r (radial distance encompassing the bacterial growth band) at the different time intervals to recalculate R as the volumetric respiration rate (see section S1, equation 10, in the supplemental material). The O2 penetration depth in the alginate beads, r, was calculated from the measured cell density and concentration of O2 at the surface of the beads, C0 (see section S1, equation 14).
Respiration measurements were performed hourly during the first 8 h and the experiments lasted ∼30 h. The respiration rate experiments were conducted on 4 biological replicates, and bacterial cell counts within each experiment were performed in duplicates. Total respiration rates were combined with quantifications of bacterial numbers and growth zonations to estimate cell-specific, Rcell, and bead volume-specific, R, respiration rates by using simple diffusion-reaction relations for a spherical geometry as outlined in the supplemental material.
Microsensor measurements.
A single bead was submerged in a petri dish filled with R2A after 24 h of growth in a culture flask. The petri dish was placed on a heated plate (set to 37°C) and gently aerated by a fine air stream directed toward the surface via a Pasteur pipette connected to an air pump. A fiber-optic O2 microsensor (OXR50-HS; tip diameter, 50 μm) was mounted on a motorized micromanipulator (MU1) and connected to an O2 meter (FireStingO2); all components were obtained from Pyro-Science GmbH, Germany. Calibration of the microsensor was performed as specified by the manufacturer via measurements in air-saturated and O2-free medium. The position where the sensor touched the bead (depth, 0) was determined visually with the help of a USB microscope (model AM7515MZTL; Dino-Lite). Microsensor positioning and data acquisition were performed with dedicated profiling software (Profix; Pyro Science GmbH, Germany). Data were analyzed in Origin Pro 9.0.
Microarray analysis.
RNA was isolated from stationary-phase planktonic and alginate-encapsulated P. aeruginosa after 24 h of growth with and without NO3−. For alginate bead cultures, the beads were harvested and rinsed three times in sterile, prewarmed 0.9% NaCl to remove planktonic bacteria before mixing with two volumes of RNAlater (Ambion, USA). The samples were stored ON at 4°C before freezing at −80°C until further use. To dissolve the alginate beads before RNA isolation, the frozen beads were thawed at 4°C and ultrasound (Sonoca Söring GmbH, Germany) was administered at the lowest intensity until the alginate beads appeared completely dissolved. Cells were harvested by centrifugation at 7,000 × g for 15 min at 4°C. The supernatant was removed, and the cell pellet lysed with 100 μl 1 mg ml−1 lysozyme (Sigma-Aldrich, USA) at room temperature for 13 min. RNA isolation was performed with an RNeasy mini purification kit (Qiagen, Netherlands), and contaminating chromosomal DNA was removed by RQ1 RNase-free DNase treatment (Promega, USA). RNA quality and quantity were detected with a NanoDrop spectrophotometer (Fischer Thermo Scientific, USA). cDNA synthesis and hybridization were performed by the Microarray Center at the Copenhagen University Hospital (Denmark), and the arrays were scanned in the Affymetrix GeneArray 3000 7G scanner. Cell intensity files (CEL files) were generated in the GeneChip Command Console software (AGCC) (Affymetrix, USA). Gene expressions were analyzed using the software Arraystar (version 3.0; DNAstar, USA).
Antibiotic tolerance.
Antibiotic tolerance of alginate-encapsulated P. aeruginosa was investigated by challenging the beads with 100× the MIC of tobramycin for P. aeruginosa (100 μg ml−1 tobramycin) (6, 10) in the growth medium at different growth stages, at 0, 24, and 48 h after alginate encapsulation. Beads were incubated with antibiotics for 24 h and subjected to live/dead staining with Syto9 (Life Technologies, Waltham, MA, USA) and propidium iodine (PI) (Sigma-Aldrich, USA) to evaluate the antibiotic effect visually by CLSM (Zeiss.Z2 LSM 710).
Statistical analysis.
Data were analyzed for statistical significance with SPSS 22 software (IBM, USA) and illustrated in GraphPad Prism 6 software (GraphPad software, USA) and Origin Pro 9.0 (Origin Lab, USA). Respiration rate data were analyzed by linear mixed models. Quantitative PNA-FISH data were compared by a linear regression analysis, a Mann-Whitney U test, and an independent t test. Aggregate volumes and biomass were analyzed by multiple t tests. A P value of <0.05 was considered significant.
Supplementary Material
ACKNOWLEDGMENTS
We thank Lars Rickelt for technical assistance with setting up the optode measurements, Theis Lange for statistical guidance in the respiration rate study, Karl Bang Christensen for statistical guidance in the PNA-FISH study, Heidi Marie Paulsen for cutting alginate beads for PNA-FISH, and AdvanDx for generously supplying PNA-FISH probes.
This study was supported by grants from The Lundbeck foundation and the Human Frontiers in Science Program (to T.B.), and grants from the Danish Council for Independent Research, Natural Sciences (FNU), and Technology and Production Sciences (FTP) (to M.K.).
We declare no conflicts of interest.
Footnotes
Supplemental material for this article may be found at https://doi.org/10.1128/AEM.00113-17.
REFERENCES
- 1.Bjarnsholt T, Alhede M, Alhede M, Eickhardt-Sørensen SR, Moser C, Kühl M, Jensen PØ, Høiby N. 2013. The in vivo biofilm. Trends Microbiol 21:466–474. doi: 10.1016/j.tim.2013.06.002. [DOI] [PubMed] [Google Scholar]
- 2.Roberts AE, Kragh KN, Bjarnsholt T, Diggle SP. 2015. The limitations of in vitro experimentation in understanding biofilms and chronic infection. J Mol Biol 427:3646–3661. doi: 10.1016/j.jmb.2015.09.002. [DOI] [PubMed] [Google Scholar]
- 3.Siddiqui AR, Bernstein JM. 2010. Chronic wound infection: facts and controversies. Clin Dermatol 28:519–526. doi: 10.1016/j.clindermatol.2010.03.009. [DOI] [PubMed] [Google Scholar]
- 4.Hoiby N. 1977. Pseudomonas aeruginosa infection in cystic fibrosis. Diagnostic and prognostic significance of pseudomonas aeruginosa precipitins determined by means of crossed immunoelectrophoresis. A survey. Acta Pathol Microbiol Scand Suppl 262:1–96. [PubMed] [Google Scholar]
- 5.Parsek MR, Singh PK. 2003. Bacterial biofilms: an emerging link to disease pathogenesis. Annu Rev Microbiol 57:677–701. doi: 10.1146/annurev.micro.57.030502.090720. [DOI] [PubMed] [Google Scholar]
- 6.Bjarnsholt T, Jensen PØ, Burmølle M, Hentzer M, Haagensen JA, Hougen HP, Calum H, Madsen KG, Moser C, Molin S, Høiby N, Givskov M. 2005. Pseudomonas aeruginosa tolerance to tobramycin, hydrogen peroxide and polymorphonuclear leukocytes is quorum-sensing dependent. Microbiology 151:373–383. doi: 10.1099/mic.0.27463-0. [DOI] [PubMed] [Google Scholar]
- 7.Bjarnsholt T, Jenson PO, Fiandaca MJ, Pedersen J, Hansen CR, Andersen CB, Pressler T, Givskov M, Hoiby N. 2009. Pseudomonas aeruginosa biofilms in the respiratory tract of cystic fibrosis patients. Pediatr Pulmonol 44:547–558. doi: 10.1002/ppul.21011. [DOI] [PubMed] [Google Scholar]
- 8.Arai H. 2011. Regulation and function of versatile aerobic and anaerobic respiratory metabolism in Pseudomonas aeruginosa. Front Microbiol 2:103. doi: 10.3389/fmicb.2011.00103. [DOI] [PMC free article] [PubMed] [Google Scholar]
- 9.Klausen M, Aaes-Jorgensen A, Molin S, Tolker-Nielsen T. 2003. Involvement of bacterial migration in the development of complex multicellular structures in Pseudomonas aeruginosa biofilms. Mol Microbiol 50:61–68. doi: 10.1046/j.1365-2958.2003.03677.x. [DOI] [PubMed] [Google Scholar]
- 10.Alhede M, Kragh KN, Qvortrup K, Allesen-Holm M, van Gennip M, Christensen LD, Jensen PØ, Nielsen AK, Parsek M, Wozniak D, Molin S, Tolker-Nielsen T, Høiby N, Givskov M, Bjarnsholt T. 2011. Phenotypes of non-attached Pseudomonas aeruginosa aggregates resemble surface attached biofilm. PLoS One 6:e27943. doi: 10.1371/journal.pone.0027943. [DOI] [PMC free article] [PubMed] [Google Scholar]
- 11.Kirketerp-Moller K, Jensen PØ, Fazli M, Madsen KG, Pedersen J, Moser C, Tolker-Nielsen T, Høiby N, Givskov M, Bjarnsholt T. 2008. Distribution, organization, and ecology of bacteria in chronic wounds. J Clin Microbiol 46:2717–2722. doi: 10.1128/JCM.00501-08. [DOI] [PMC free article] [PubMed] [Google Scholar]
- 12.Gibson RL, Burns JL, Ramsey BW. 2003. Pathophysiology and management of pulmonary infections in cystic fibrosis. Am J Respir Crit Care Med 168:918–951. doi: 10.1164/rccm.200304-505SO. [DOI] [PubMed] [Google Scholar]
- 13.Koch C, Hoiby N. 1993. Pathogenesis of cystic fibrosis. Lancet 341:1065–1069. doi: 10.1016/0140-6736(93)92422-P. [DOI] [PubMed] [Google Scholar]
- 14.Kolpen M, Hansen CR, Bjarnsholt T, Moser C, Christensen LD, van Gennip M, Ciofu O, Mandsberg L, Kharazmi A, Döring G, Givskov M, Høiby N, Jensen PØ. 2010. Polymorphonuclear leucocytes consume oxygen in sputum from chronic Pseudomonas aeruginosa pneumonia in cystic fibrosis. Thorax 65:57–62. doi: 10.1136/thx.2009.114512. [DOI] [PubMed] [Google Scholar]
- 15.Campbell EL, Bruyninckx WJ, Kelly CJ, Glover LE, McNamee EN, Bowers BE, Bayless AJ, Scully M, Saeedi BJ, Golden-Mason L, Ehrentraut SF, Curtis VF, Burgess A, Garvey JF, Sorensen A, Nemenoff R, Jedlicka P, Taylor CT, Kominsky DJ, Colgan SP. 2014. Transmigrating neutrophils shape the mucosal microenvironment through localized oxygen depletion to influence resolution of inflammation. Immunity 40:66–77. doi: 10.1016/j.immuni.2013.11.020. [DOI] [PMC free article] [PubMed] [Google Scholar]
- 16.Jesaitis AJ, Franklin MJ, Berglund D, Sasaki M, Lord CI, Bleazard JB, Duffy JE, Beyenal H, Lewandowski Z. 2003. Compromised host defense on Pseudomonas aeruginosa biofilms: characterization of neutrophil and biofilm interactions. J Immunol 171:4329–4339. doi: 10.4049/jimmunol.171.8.4329. [DOI] [PubMed] [Google Scholar]
- 17.Kragh KN, Alhede M, Jensen PØ, Moser C, Scheike T, Jacobsen CS, Seier Poulsen S, Eickhardt-Sørensen SR, Trøstrup H, Christoffersen L, Hougen HP, Rickelt LF, Kühl M, Høiby N, Bjarnsholt T. 2014. Polymorphonuclear leukocytes restrict growth of Pseudomonas aeruginosa in the lungs of cystic fibrosis patients. Infect Immun 82:4477–4486. doi: 10.1128/IAI.01969-14. [DOI] [PMC free article] [PubMed] [Google Scholar]
- 18.Worlitzsch D, Tarran R, Ulrich M, Schwab U, Cekici A, Meyer KC, Birrer P, Bellon G, Berger J, Weiss T, Botzenhart K, Yankaskas JR, Randell S, Boucher RC, Döring G. 2002. Effects of reduced mucus oxygen concentration in airway Pseudomonas infections of cystic fibrosis patients. J Clin Invest 109:317–325. doi: 10.1172/JCI0213870. [DOI] [PMC free article] [PubMed] [Google Scholar]
- 19.Line L, Alhede M, Kolpen M, Kühl M, Ciofu O, Bjarnsholt T, Moser C, Toyofuku M, Nomura N, Høiby N, Jensen PØ. 2014. Physiological levels of nitrate support anoxic growth by denitrification of Pseudomonas aeruginosa at growth rates reported in cystic fibrosis lungs and sputum. Front Microbiol 5:554. doi: 10.3389/fmicb.2014.00554. [DOI] [PMC free article] [PubMed] [Google Scholar]
- 20.Palmer KL, Brown SA, Whiteley M. 2007. Membrane-bound nitrate reductase is required for anaerobic growth in cystic fibrosis sputum. J Bacteriol 189:4449–4455. doi: 10.1128/JB.00162-07. [DOI] [PMC free article] [PubMed] [Google Scholar]
- 21.Fazli M, Bjarnsholt T, Kirketerp-Møller K, Jørgensen B, Andersen AS, Krogfelt KA, Givskov M, Tolker-Nielsen T. 2009. Nonrandom distribution of Pseudomonas aeruginosa and Staphylococcus aureus in chronic wounds. J Clin Microbiol 47:4084–4089. doi: 10.1128/JCM.01395-09. [DOI] [PMC free article] [PubMed] [Google Scholar]
- 22.Borriello G, Werner E, Roe F, Kim AM, Ehrlich GD, Stewart PS. 2004. Oxygen limitation contributes to antibiotic tolerance of Pseudomonas aeruginosa in biofilms. Antimicrob Agents Chemother 48:2659–2664. doi: 10.1128/AAC.48.7.2659-2664.2004. [DOI] [PMC free article] [PubMed] [Google Scholar]
- 23.Hill D, Rose B, Pajkos A, Robinson M, Bye P, Bell S, Elkins M, Thompson B, Macleod C, Aaron SD, Harbour C. 2005. Antibiotic susceptibilities of Pseudomonas aeruginosa isolates derived from patients with cystic fibrosis under aerobic, anaerobic, and biofilm conditions. J Clin Microbiol 43:5085–5090. doi: 10.1128/JCM.43.10.5085-5090.2005. [DOI] [PMC free article] [PubMed] [Google Scholar]
- 24.Behrendt L, Schrameyer V, Qvortrup K, Lundin L, Sørensen SJ, Larkum AW, Kühl M. 2012. Biofilm growth and near-infrared radiation-driven photosynthesis of the chlorophyll d-containing cyanobacterium Acaryochloris marina. Appl Environ Microbiol 78:3896–3904. doi: 10.1128/AEM.00397-12. [DOI] [PMC free article] [PubMed] [Google Scholar]
- 25.Christophersen LJ, Trøstrup H, Malling Damlund DS, Bjarnsholt T, Thomsen K, Jensen PØ, Hougen HP, Høiby N, Moser C. 2012. Bead-size directed distribution of Pseudomonas aeruginosa results in distinct inflammatory response in a mouse model of chronic lung infection. Clin Exp Immunol 170:222–230. doi: 10.1111/j.1365-2249.2012.04652.x. [DOI] [PMC free article] [PubMed] [Google Scholar]
- 26.Staudinger BJ, Muller JF, Halldórsson S, Boles B, Angermeyer A, Nguyen D, Rosen H, Baldursson O, Gottfreðsson M, Guðmundsson GH, Singh PK. 2014. Conditions associated with the cystic fibrosis defect promote chronic Pseudomonas aeruginosa infection. Am J Respir Crit Care Med 189:812–824. doi: 10.1164/rccm.201312-2142OC. [DOI] [PMC free article] [PubMed] [Google Scholar]
- 27.Cowley ES, Kopf SH, LaRiviere A, Ziebis W, Newman DK. 2015. Pediatric cystic fibrosis sputum can be chemically dynamic, anoxic, and extremely reduced due to hydrogen sulfide formation. mBio 6:e00767-15. doi: 10.1128/mBio.00767-15. [DOI] [PMC free article] [PubMed] [Google Scholar]
- 28.Hassett DJ, Sutton MD, Schurr MJ, Herr AB, Caldwell CC, Matu JO. 2009. Pseudomonas aeruginosa hypoxic or anaerobic biofilm infections within cystic fibrosis airways. Trends Microbiol 17:130–138. doi: 10.1016/j.tim.2008.12.003. [DOI] [PubMed] [Google Scholar]
- 29.James GA, Ge Zhao A, Usui M, Underwood RA, Nguyen H, Beyenal H, deLancey Pulcini E, Agostinho Hunt A, Bernstein HC, Fleckman P, Olerud J, Williamson KS, Franklin MJ, Stewart PS. 2016. Microsensor and transcriptomic signatures of oxygen depletion in biofilms associated with chronic wounds. Wound Repair Regen 24:373–383. doi: 10.1111/wrr.12401. [DOI] [PMC free article] [PubMed] [Google Scholar]
- 30.Gosmann B, Rehm HJ. 1986. Oxygen uptake of microorganisms entrapped in Ca-alginate. Appl Microbiol Biotechnol 23:163–167. doi: 10.1007/BF00261907. [DOI] [Google Scholar]
- 31.Walters MC, Roe F, Bugnicourt A, Franklin MJ, Stewart PS. 2003. Contributions of antibiotic penetration, oxygen limitation, and low metabolic activity to tolerance of Pseudomonas aeruginosa biofilms to ciprofloxacin and tobramycin. Antimicrob Agents Chemother 47:317–323. doi: 10.1128/AAC.47.1.317-323.2003. [DOI] [PMC free article] [PubMed] [Google Scholar]
- 32.Pabst B, Pitts B, Lauchnor E, Stewart PS. 2016. Gel-entrapped Staphylococcus aureus bacteria as models of biofilm infection exhibit growth in dense aggregates, oxygen limitation, antibiotic tolerance, and heterogeneous gene expression. Antimicrob Agents Chemother 60:6294–6301. doi: 10.1128/AAC.01336-16. [DOI] [PMC free article] [PubMed] [Google Scholar]
- 33.Kolpen M, Kühl M, Bjarnsholt T, Moser C, Hansen CR, Liengaard L, Kharazmi A, Pressler T, Høiby N, Jensen PØ. 2014. Nitrous oxide production in sputum from cystic fibrosis patients with chronic Pseudomonas aeruginosa lung infection. PLoS One 9:e84353. doi: 10.1371/journal.pone.0084353. [DOI] [PMC free article] [PubMed] [Google Scholar]
- 34.Alvarez-Ortega C, Harwood CS. 2007. Responses of Pseudomonas aeruginosa to low oxygen indicate that growth in the cystic fibrosis lung is by aerobic respiration. Mol Microbiol 65:153–165. doi: 10.1111/j.1365-2958.2007.05772.x. [DOI] [PMC free article] [PubMed] [Google Scholar]
- 35.Filiatrault MJ, Picardo KF, Ngai H, Passador L, Iglewski BH. 2006. Identification of Pseudomonas aeruginosa genes involved in virulence and anaerobic growth. Infect Immun 74:4237–4245. doi: 10.1128/IAI.02014-05. [DOI] [PMC free article] [PubMed] [Google Scholar]
- 36.Debats IB, Booi D, Deutz NE, Buurman WA, Boeckx WD, van der Hulst RR. 2006. Infected chronic wounds show different local and systemic arginine conversion compared with acute wounds. J Surg Res 134:205–214. doi: 10.1016/j.jss.2006.03.005. [DOI] [PubMed] [Google Scholar]
- 37.Warkentin M, Freese HM, Karsten U, Schumann R. 2007. New and fast method to quantify respiration rates of bacterial and plankton communities in freshwater ecosystems by using optical oxygen sensor spots. Appl Environ Microbiol 73:6722–6729. doi: 10.1128/AEM.00405-07. [DOI] [PMC free article] [PubMed] [Google Scholar]
- 38.Wagner BA, Venkataraman S, Buettner GR. 2011. The rate of oxygen utilization by cells. Free Radic Biol Med 51:700–712. doi: 10.1016/j.freeradbiomed.2011.05.024. [DOI] [PMC free article] [PubMed] [Google Scholar]
- 39.Patrauchan MA, Sarkisova SA, Franklin MJ. 2007. Strain-specific proteome responses of Pseudomonas aeruginosa to biofilm-associated growth and to calcium. Microbiology 153:3838–3851. doi: 10.1099/mic.0.2007/010371-0. [DOI] [PubMed] [Google Scholar]
- 40.Schreiber K, Boes N, Eschbach M, Jaensch L, Wehland J, Bjarnsholt T, Givskov M, Hentzer M, Schobert M. 2006. Anaerobic survival of Pseudomonas aeruginosa by pyruvate fermentation requires an Usp-type stress protein. J Bacteriol 188:659–668. doi: 10.1128/JB.188.2.659-668.2006. [DOI] [PMC free article] [PubMed] [Google Scholar]
- 41.Trunk K, Benkert B, Quäck N, Münch R, Scheer M, Garbe J, Jänsch L, Trost M, Wehland J, Buer J, Jahn M, Schobert M, Jahn D. 2010. Anaerobic adaptation in Pseudomonas aeruginosa: definition of the Anr and Dnr regulons. Environ Microbiol 12:1719–1733. doi: 10.1111/j.1462-2920.2010.02252.x. [DOI] [PubMed] [Google Scholar]
- 42.Winsor GL, Griffiths EJ, Lo R, Dhillon BK, Shay JA, Brinkman FS. 2016. Enhanced annotations and features for comparing thousands of Pseudomonas genomes in the Pseudomonas genome database. Nucleic Acids Res 44:D646–D653. doi: 10.1093/nar/gkv1227. [DOI] [PMC free article] [PubMed] [Google Scholar]
- 43.Folsom JP, Richards L, Pitts B, Roe F, Ehrlich GD, Parker A, Mazurie A, Stewart PS. 2010. Physiology of Pseudomonas aeruginosa in biofilms as revealed by transcriptome analysis. BMC Microbiol 10:294. doi: 10.1186/1471-2180-10-294. [DOI] [PMC free article] [PubMed] [Google Scholar]
- 44.Stewart PS, Franklin MJ, Williamson KS, Folsom JP, Boegli L, James GA. 2015. Contribution of stress responses to antibiotic tolerance in Pseudomonas aeruginosa biofilms. Antimicrob Agents Chemother 59:3838–3847. doi: 10.1128/AAC.00433-15. [DOI] [PMC free article] [PubMed] [Google Scholar]
- 45.Williamson KS, Richards LA, Perez-Osorio AC, Pitts B, McInnerney K, Stewart PS, Franklin MJ. 2012. Heterogeneity in Pseudomonas aeruginosa biofilms includes expression of ribosome hibernation factors in the antibiotic-tolerant subpopulation and hypoxia-induced stress response in the metabolically active population. J Bacteriol 194:2062–2073. doi: 10.1128/JB.00022-12. [DOI] [PMC free article] [PubMed] [Google Scholar]
- 46.Neidhardt FC, VanBogelen RA, Vaughn V. 1984. The genetics and regulation of heat-shock proteins. Annu Rev Genet 18:295–329. doi: 10.1146/annurev.ge.18.120184.001455. [DOI] [PubMed] [Google Scholar]
- 47.Hecker M, Schumann W, Volker U. 1996. Heat-shock and general stress response in Bacillus subtilis. Mol Microbiol 19:417–428. doi: 10.1046/j.1365-2958.1996.396932.x. [DOI] [PubMed] [Google Scholar]
- 48.Zumft WG. 1997. Cell biology and molecular basis of denitrification. Microbiol Mol Biol Rev 61:533–616. [DOI] [PMC free article] [PubMed] [Google Scholar]
- 49.Vander Wauven C, Pierard A, Kley-Raymann M, Haas D. 1984. Pseudomonas aeruginosa mutants affected in anaerobic growth on arginine: evidence for a four-gene cluster encoding the arginine deiminase pathway. J Bacteriol 160:928–934. [DOI] [PMC free article] [PubMed] [Google Scholar]
- 50.Eschbach M, Schreiber K, Trunk K, Buer J, Jahn D, Schobert M. 2004. Long-term anaerobic survival of the opportunistic pathogen Pseudomonas aeruginosa via pyruvate fermentation. J Bacteriol 186:4596–4604. doi: 10.1128/JB.186.14.4596-4604.2004. [DOI] [PMC free article] [PubMed] [Google Scholar]
- 51.Bielecki P, Komor U, Bielecka A, Müsken M, Puchałka J, Pletz MW, Ballmann M, Martins dos Santos VA, Weiss S, Häussler S. 2013. Ex vivo transcriptional profiling reveals a common set of genes important for the adaptation of Pseudomonas aeruginosa to chronically infected host sites. Environ Microbiol 15:570–587. doi: 10.1111/1462-2920.12024. [DOI] [PubMed] [Google Scholar]
- 52.Chang W, Small DA, Toghrol F, Bentley WE. 2005. Microarray analysis of Pseudomonas aeruginosa reveals induction of pyocin genes in response to hydrogen peroxide. BMC Genomics 6:115. doi: 10.1186/1471-2164-6-115. [DOI] [PMC free article] [PubMed] [Google Scholar]
- 53.Horniblow RD, Dowle M, Iqbal TH, Latunde-Dada GO, Palmer RE, Pikramenou Z, Tselepis C. 2015. Alginate-iron speciation and its effect on in vitro cellular iron metabolism. PLoS One 10:e0138240. doi: 10.1371/journal.pone.0138240. [DOI] [PMC free article] [PubMed] [Google Scholar]
- 54.Hassett DJ, Howell ML, Sokol PA, Vasil ML, Dean GE. 1997. Fumarase C activity is elevated in response to iron deprivation and in mucoid, alginate-producing Pseudomonas aeruginosa: cloning and characterization of fumC and purification of native fumC. J Bacteriol 179:1442–1451. doi: 10.1128/jb.179.5.1442-1451.1997. [DOI] [PMC free article] [PubMed] [Google Scholar]
- 55.Cao B, Christophersen L, Thomsen K, Sønderholm M, Bjarnsholt T, Jensen PØ, Høiby N, Moser C. 2015. Antibiotic penetration and bacterial killing in a Pseudomonas aeruginosa biofilm model. J Antimicrob Chemother 70:2057–2063. [DOI] [PubMed] [Google Scholar]
- 56.Spoering AL, Lewis K. 2001. Biofilms and planktonic cells of Pseudomonas aeruginosa have similar resistance to killing by antimicrobials. J Bacteriol 183:6746–6751. doi: 10.1128/JB.183.23.6746-6751.2001. [DOI] [PMC free article] [PubMed] [Google Scholar]
- 57.Kolpen M, Mousavi N, Sams T, Bjarnsholt T, Ciofu O, Moser C, Kühl M, Høiby N, Jensen PØ. 2016. Reinforcement of the bactericidal effect of ciprofloxacin on Pseudomonas aeruginosa biofilm by hyperbaric oxygen treatment. Int J Antimicrob Agents 47:163–167. doi: 10.1016/j.ijantimicag.2015.12.005. [DOI] [PubMed] [Google Scholar]
- 58.Davies DG, Parsek MR, Pearson JP, Iglewski BH, Costerton JW, Greenberg EP. 1998. The involvement of cell-to-cell signals in the development of a bacterial biofilm. Science 280:295–298. doi: 10.1126/science.280.5361.295. [DOI] [PubMed] [Google Scholar]
- 59.Pedersen SS, Shand GH, Hansen BL, Hansen GN. 1990. Induction of experimental chronic Pseudomonas aeruginosa lung infection with P. aeruginosa entrapped in alginate microspheres. APMIS 98:203–211. doi: 10.1111/j.1699-0463.1990.tb01023.x. [DOI] [PubMed] [Google Scholar]
- 60.Srinivasulu B, Adinarayana K, Ellaiah P. 2003. Investigations on neomycin production with immobilized cells of Streptomyces marinensis NUV-5 in calcium alginate matrix. AAPS PharmSciTech 4:E57. doi: 10.1208/pt040457. [DOI] [PMC free article] [PubMed] [Google Scholar]
- 61.Mater DDG, Barbotin JN, Saucedo JEN, Truffaut N, Thomas D. 1995. Effect of gelation temperature and gel-dissolving solution on cell viability and recovery of two Pseudomonas putida strains co-immobilized within calcium alginate or k-carrageenan gel beads. Biotechnol Tech 9:747–752. doi: 10.1007/BF00159242. [DOI] [Google Scholar]
- 62.Rickelt LF, Askaer L, Walpersdorf E, Elberling B, Glud RN, Kuhl M. 2013. An optode sensor array for long-term in situ oxygen measurements in soil and sediment. J Environ Qual 42:1267–1273. doi: 10.2134/jeq2012.0334. [DOI] [PubMed] [Google Scholar]
Associated Data
This section collects any data citations, data availability statements, or supplementary materials included in this article.