

Abstract
Objective
To examine the heterogeneity of global transcriptome patterns in systemic sclerosis (SSc) skin in a large sample of patients with SSc and control subjects.
Methods
Skin biopsy specimens obtained from 61 patients enrolled in the Genetics versus Environment in Scleroderma Outcome Study (GENISOS) cohort and 36 unaffected control subjects with a similar demographic background were examined by Illumina HumanHT-12 bead arrays. Followup experiments using quantitative polymerase chain reaction and immunohistochemical analysis were also performed.
Results
We identified 2,754 differentially expressed transcripts in SSc patients compared with controls. Clustering analysis revealed 2 prominent transcriptomes in SSc patients: the keratin and fibroinflammatory signatures. Higher keratin transcript scores were associated with shorter disease duration and interstitial lung disease, while higher fibroinflammatory scores were associated with diffuse cutaneous involvement, a higher skin score at the biopsy site, and a higher modified Rodnan skin thickness score. A subgroup of patients with significantly longer disease duration had a normal-like transcript pattern. Analysis of cell type–specific signature scores revealed remarkable heterogeneity across patients. Significantly higher scores were calculated for fibroblasts (72% of patients), microvascular cells (61%), macrophages (54%), and dendritic cells (DCs) (49%). The majority of samples with significantly higher fibroblast scores (35 of 44 [80%]) had significantly increased macrophage and/or DC scores. Further analysis and immunohistochemical staining indicated that the keratin signature was not a general marker of keratinocyte activation but was in fact associated with an activation pattern in hair and adnexal structures.
Conclusion
Prominent fibroinflammatory and keratin signatures are present in SSc skin. Expression profiles of SSc skin show significant heterogeneity, and this finding might be useful for stratifying patients for targeted therapies or predicting the response to immunosuppression.
Systemic sclerosis (SSc; scleroderma) is a multi-system autoimmune disease associated with high morbidity and mortality (1). Global gene expression profiling with microarrays allows an unbiased genome-wide assessment of the transcript dysregulation in a given tissue. This technology is now increasingly used to fingerprint pathologic processes, stratify diseases at the molecular level, and predict disease outcome (2–6). Development of effective treatment options in SSc has been hampered by a lack of sufficient understanding of its pathophysiology. Global gene expression studies in SSc at the end-organ level (7–10) or in peripheral blood cells (11–15) have indicated the presence of distinct transcript patterns in the majority of patients.
Skin is a prominently affected and easily accessible end-organ in SSc. Previous global gene expression studies have shown that SSc skin has a distinct gene expression profile, with inflammatory as well as fibrotic signatures (7,10). In a larger study involving 24 patients with SSc, the subgroup of patients with diffuse cutaneous SSc (dcSSc) could be divided into 3 distinct groups and the patients with limited cutaneous SSc (lcSSc) into 2 groups based on the intrinsic gene expression profiles observed in their skin biopsy specimens. A subgroup of patients including those with dcSSc and those with lcSSc showed an inflammatory pattern. Another subgroup of SSc patients with diffuse skin involvement showed a proliferative gene expression profile. A third subgroup of patients had a “normal-like” gene expression signature (9). Two other studies by the same group of investigators confirmed the presence of these 3 intrinsic subsets in independent samples (inflammatory, proliferative, and normal-like) (16,17).
In the present study, we investigated the heterogeneity of SSc transcript profiles in a large, well-characterized sample using a comprehensive gene expression profiling platform. First, we examined the impact of skin status (affected versus unaffected) on the SSc gene expression profile. Second, we identified 2 gene expression signatures in our large data set and examined the relationship between these signatures and SSc clinical features and previously described intrinsic transcript signatures (9). Last, we investigated the specific contribution of different cell types present in the skin (e.g., fibroblasts or macrophages) to the observed transcript heterogeneity in SSc skin.
PATIENTS AND METHODS
Patients and control subjects
Sixty-one patients were recruited from the Genetics versus Environment in Scleroderma Outcome Study (GENISOS) (18) or at the baseline visit in an investigator-initiated, open-label phase I/IIa study of imatinib (19). In addition to samples obtained at baseline, followup samples were also obtained from 5 of the 61 patients enrolled in the GENISOS cohort. All patients fulfilled the American College of Rheumatology/European League Against Rheumatism classification criteria for SSc (20). We also investigated 36 control subjects who had a similar demographic background. The study protocol was approved by the institutional review boards of the participating institutions, and all participants provided fully informed, voluntary consent.
Disease type was defined based on the extent of skin involvement (21). Patients who had diffuse skin involvement at any time during their disease course were categorized as having dcSSc. The modified Rodnan skin thickness score (MRSS) (22) was used to assess skin involvement, and the skin score at the biopsy site was also recorded (0–3 scale, where 0 = not involved and 3 = severe thickening). The presence of moderate to severe interstitial lung disease (ILD) was defined as a forced vital capacity of <70% predicted and findings indicative of pulmonary fibrosis on high-resolution computed tomography of the chest. Patients were considered as being treated with immunosuppressive agents if they had received immunosuppressive medication within 4 weeks of skin biopsy (with the exception of prednisone at a dose of ≤5 mg or hydroxychloroquine).
Skin biopsy and quantitative reverse transcription–polymerase chain reaction (qRT-PCR) analysis
Three-millimeter punch biopsy samples of skin were obtained from the arms of the study subjects and were immediately immersed in RNA-later solution (Qiagen) and stored at −80°C. RNA was extracted using RNeasy Fibrous Tissue kits (Qiagen). Global gene expression was assessed using Illumina HumanHT-12 bead arrays. All microarray experiments were performed in a single batch (see Supplementary Methods, available on the Arthritis & Rheumatology web site at http://onlinelibrary.wiley.com/doi/10.1002/art.39289/abstract). Microarray data from this study are available from NCBI GEO (http://www.ncbi.nlm.nih.gov/geo/) using accession no. GSE58095. There is overlap with accession no. GSE47162, but the previous data set does not include any control samples.
Quantitative RT-PCR was also performed for 2 prominently overexpressed keratin transcripts, keratin 25 (type I keratin) and keratin 85 (type II keratin) to confirm the micro-array results. In these experiments, the expression values were normalized to those of GAPDH. Relative quantification was performed using the Ct method, where ΔΔCt values were calculated based on GAPDH and transcript levels in controls.
Immunohistochemical analysis
Immunohistochemical analysis for 2 general markers of epidermis activation (keratin 6 and keratin 16) and keratin 85 (which was prominently over-expressed in our samples) was performed in skin biopsy samples obtained from 5 SSc patients with the keratin transcript signature and from unaffected control subjects (matched for age, sex, and ethnicity), as well as in a biopsy sample from psoriatic skin (positive control) (see Supplementary Methods, available on the Arthritis & Rheumatology web site at http://onlinelibrary.wiley.com/doi/10.1002/art.39289/abstract).
Microarray data analysis
Raw data were analyzed with BRB ArrayTools (http://linus.nci.nih.gov/BRB-ArrayTools.html). Data were normalized according to the quantile method. Genes whose log intensity variance was in the bottom 75th percentile were filtered out, and 11,819 transcripts met this criterion. Differentially expressed genes were detected using Significance Analysis of Microarrays (SAM), at a false discovery rate of <5% (23). The sets of differentially expressed genes were also modeled using Ingenuity Pathways Analysis (IPA) software, and upstream regulators were identified. The goal of Upstream Regulator Analysis in IPA is to identify upstream regulators and predict whether they are activated or inhibited, given the observed gene expression changes in the experimental data set. IPA uses a Z score algorithm to make predictions. The Z score algorithm is designed to reduce the chance that random data will generate significant predictions. Upstream Regulator Analysis is based on expected causal effects between upstream regulators and targets; the expected causal effects are derived from the literature compiled in Ingenuity Knowledge Base.
Composite transcript scores for the keratin and fibroinflammatory signatures were also calculated. For this purpose, we normalized each transcript included in the profiles to mean = 0 and variance = 1. To derive the composite score, we averaged the expression values of the positively correlated genes with the inverse values of the negatively correlated genes. We also calculated a composite score for predicted activation of the Wnt/β-catenin pathway based on a previously published data set, using the above algorithm (24). The statistical methods used to examine the relationship between these transcript composite scores and clinical outcomes depended on the distribution of composite scores (dependent variable). The distribution of the keratin scores was right skewed. Therefore, nonparametric methods were used for analysis of the keratin scores. Specifically, Spearman’s rho was used if the independent variable was continuous, and Wilcoxon’s rank sum test was used if the independent variable was categorical. Parametric tests were used for analysis of the composite fibroinflammatory scores (Pearson’s correlation and linear regression).
Analysis of cell type–specific expression
Skin consists of a complex set of cell types, each of which contributes to the aggregate expression data generated from a given biopsy. We performed cell type–specific expression analysis according to the approach previously described by our group (25), to investigate the potential contribution of these cell types to the SSc skin transcript profile (see Supplementary Methods, available on the Arthritis & Rheumatology web site at http://onlinelibrary.wiley.com/doi/10.1002/art.39289/abstract).
RESULTS
Sixty-one patients with SSc and 36 control subjects were assessed in this study. The demographic and clinical characteristics of the study population are shown in Supplementary Table 1, available on the Arthritis & Rheumatology web site at http://onlinelibrary.wiley.com/doi/10.1002/art.39289/abstract.
Skin thickening at the biopsy site is a prominent source of heterogeneity
The transcriptome of the majority of SSc patients differed from that of control subjects. There were 2,754 differentially expressed genes in SSc patients compared with controls (see Additional Tables 1 and 2, available on the Arthritis & Rheumatology web site at http://onlinelibrary.wiley.com/doi/10.1002/art.39289/abstract). IPA revealed that the top 3 represented canonical pathways belonged to hepatic fibrosis, agranulocyte adhesion/diapedesis, and granulocyte adhesion/diapedesis. The top significantly activated upstream transcription regulators were interferon (IFN) regulatory factor 7 (IRF-7), NF-κβ, IRF-1, STAT-1, and tumor protein 53, while the top upstream activated cytokines/growth factors were transforming growth factor β1 (TGFβ1), IFNα, oncostatin M, IFNα2, and IFNγ (see also Supplementary Figure 1 and Additional Table, available on the Arthritis & Rheumatology web site at http://onlinelibrary.wiley.com/doi/10.1002/art.39289/abstract). Next, we examined the SSc gene profile based on the status of skin involvement at the biopsy site (Figure 1); a complete list of differentially expressed transcripts in all comparison groups is shown in Additional Table 1 (available on the Arthritis & Rheumatology web site at http://onlinelibrary.wiley.com/doi/10.1002/art.39289/abstract).
Table 1.
Clinical correlates of keratin, fibroinflammatory, and normal-like signatures*
| Keratin score
|
Fibroinflammatory score
|
Clustering with controls
|
|||||
|---|---|---|---|---|---|---|---|
| Clinical variable | rs | P† | r | b (95% CI) | P | b or OR (95% CI) | P |
| Male sex | NA | 0.658 | NA | 0.15 (−0.15, 0.46) | 0.319 | 1.22 (0.34, 4.37) | 0.820 |
| Diffuse cutaneous involvement | NA | 0.179 | NA | 0.39 (0.12, 0.67) | 0.006 | 0.46 (0.14, 1.54)‡ | 0.212 |
| Immunosuppressive agents | NA | 0.902 | NA | 0.11 (−0.41, 0.2) | 0.488 | 0.68 (0.18, 2.62)‡ | 0.513 |
| Interstitial lung disease | NA | 0.017 | NA | 0.14 (−0.14, 0.41) | 0.33 | 0.43 (0.11, 1.65)‡ | 0.183 |
| Affected skin at biopsy site | NA | 0.658 | NA | 0.54 (0.29, 0.78) | <0.001 | 0.46 (0.14, 1.51)‡ | 0.197 |
| Disease duration | −0.32 | 0.02 | −0.19 | −0.02 (−0.05, 0.01) | 0.165 | 3.22 (0.11, 6.34)‡ | 0.043 |
| Concurrent MRSS | 0.03 | 0.85 | 0.66 | 0.03 (0.02, 0.04) | <0.001 | −5.02 (−11.28, 1.24) | 0.114 |
| Skin score at biopsy site | 0.01 | 0.98 | 0.55 | 0.31 (0.18, 0.43) | <0.001 | −0.47 (−1.02, 0.09) | 0.1 |
95% CI = 95% confidence interval; NA = not applicable; MRSS = modified Rodnan skin thickness score.
Calculated using Wilcoxon’s rank sum test, because the keratin transcript scores were strongly right skewed.
Odds ratio (OR).
Figure 1.

Numbers of differentially expressed (DE) genes in systemic sclerosis (SSc) patients with affected skin at the biopsy site compared with those with unaffected skin at the biopsy site and control subjects (A) and in patients with diffuse SSc compared with those with limited SSc and control subjects (B).
A comparison of patients with clinically affected skin at the biopsy site and control subjects revealed 4,184 differentially expressed transcripts belonging to hepatic fibrosis, agranulocyte adhesion/diapedesis, and dendritic cell (DC) maturation, while a comparison of SSc patients with clinically unaffected skin at the biopsy site and controls resulted in only 24 differentially expressed genes (the small number of differentially expressed transcripts in this comparison precluded a meaningful pathway analysis). Furthermore, we detected prominent gene expression differences between SSc patients with clinically affected skin at the biopsy site and those with unaffected skin at the biopsy site. This comparison resulted in 142 differentially expressed transcripts belonging to the top 3 overrepresented canonical pathways.
We also performed a parallel analysis in order to investigate whether the heterogeneity based on the status of skin at the biopsy site is driven by disease type. In a comparison between patients with dcSSc and controls, there were 3,983 differentially expressed transcripts belonging to hepatic fibrosis, DC maturation, and graft-versus-host signaling, while 71 differentially expressed transcripts were detected in a comparison between patients with lcSSc and controls, with overrepresentation of the hepatic fibrosis pathway. Of note, there were no differentially expressed transcripts when patients with dcSSc were compared with those with lcSSc, indicating that the status of skin at the biopsy site is a more prominent source of heterogeneity than is disease type. Of note, a pairwise comparison between affected and unaffected skin within the same individual SSc patients, as previously performed (9,10,16,17), could not be conducted in our study, because biopsy samples obtained from other typically uninvolved anatomic areas such as the buttock area were not performed.
Differentially expressed gene expression profiles in SSc patients
Figure 2 shows the unsupervised hierarchical clustering of 2,754 differentially expressed genes identified in the comparison between SSc samples and controls (for additional information see Supplementary Figure 2, available on the Arthritis & Rheumatology web site at http://onlinelibrary.wiley.com/doi/10.1002/art.39289/abstract). Two partially overlapping gene clusters were overexpressed in SSc patients (Figure 2). The first gene cluster was highly enriched with keratins and keratin-associated proteins (mainly hair and adnexal structure keratins), with 77 of 93 transcripts (82.8%) being keratin-related (see Additional Table, available on the Arthritis & Rheumatology web site at http://onlinelibrary.wiley.com/doi/10.1002/art.39289/abstract). Thirty-four patients (57.6%), including those with clinically affected skin and those with unaffected skin (see Supplementary Figure 3, available on the Arthritis & Rheumatology web site at http://onlinelibrary.wiley.com/doi/10.1002/art.39289/abstract), as well as both patients with lcSSc and patients with dcSSc, clustered in the group with overexpression of the keratin signature (data not shown). The keratin signature was significantly less common among control subjects (present in only 8 controls [22.2%]; P = 0.002). We also investigated levels of 2 representative keratin transcripts, keratin 25 and keratin 85, by qRT-PCR. As shown in Supplementary Figure 4 (available on the Arthritis & Rheumatology web site at http://onlinelibrary.wiley.com/doi/10.1002/art.39289/abstract), levels of both keratin 25 (type I keratin) and keratin 85 (type II keratin) were significantly higher in patients compared with controls (median fold changes 21.1 [P = 0.015] and 15.7 [P = 0.003], respectively).
Figure 2.

Unsupervised hierarchical clustering of skin samples based on the 2,754 transcripts that were differentially expressed in clinically affected systemic sclerosis (SSc) skin, unaffected SSc skin, and control skin. The orange bars and purple bars on the left indicate keratin and fibroinflammatory gene clusters, respectively.
The second overexpressed cluster was enriched with genes involving inflammatory (including IFN-inducible genes) and fibrotic pathways, such as THY1, COL1A1, COMP, OAS1, and CCL2 (Figure 2; see also Additional Table, available on the Arthritis & Rheumatology web site at http://onlinelibrary.wiley.com/doi/10.1002/art.39289/abstract). As shown in Supplementary Figure 5 (available on the Arthritis & Rheumatology web site at http://onlinelibrary.wiley.com/doi/10.1002/art.39289/abstract), this fibroinflammatory signature was present in 44 patients (74.6%), while only 5 control subjects had this signature (P < 0.001). IPA of this cluster revealed that the top 3 overrepresented canonical pathways were hepatic fibrosis, agranulocyte adhesion/diapedesis, and DC maturation. In this cluster, genes belonging to inflammatory and fibrotic pathways were coexpressed. As shown in Figure 2, this gene cluster partially overlapped with the keratin signature. Similar to previously published data (9), 14 SSc samples (23.7%) clustered with control samples (Figure 2; see also Supplementary Figure 2, available on the Arthritis & Rheumatology web site at http://onlinelibrary.wiley.com/doi/10.1002/art.39289/abstract).
Cross comparison with the inflammatory and proliferative intrinsic subsets
We mapped the inflammatory intrinsic subset (60 genes corresponding to 93 probes) and the proliferative intrinsic subset (56 genes corresponding to 86 probes) previously described by Milano et al (9) to probes present on Illumina HumanHT-12 arrays. As shown in Supplementary Figure 6 (available on the Arthritis & Rheumatology web site at http://onlinelibrary.wiley.com/doi/10.1002/art.39289/abstract), some patient samples showed increased coexpression of transcripts in the inflammatory intrinsic subset, but we did not observe homogeneous overexpression of proliferative intrinsic genes among patient samples (see Supplementary Figure 7, available on the Arthritis & Rheumatology web site at http://onlinelibrary.wiley.com/doi/10.1002/art.39289/abstract). We also investigated the overlap between the above-mentioned fibroinflammatory cluster and these 2 intrinsic gene subsets. Twenty inflammatory intrinsic genes (23 probes) were also present in our fibroinflammatory cluster, whereas only 5 genes were in common between the proliferative intrinsic gene subset and our fibroinflammatory gene cluster.
We also performed a hierarchical clustering analysis using unbiased selection of genes that deviated at least 2-fold from the mean in at least 5 samples in order to parallel the analytic approach described in previous SSc skin gene expression studies (9,10). Following this approach, 1,870 genes were identified. As shown in Supplementary Figure 8 (available on the Arthritis & Rheumatology web site at http://onlinelibrary.wiley.com/doi/10.1002/art.39289/abstract), unsupervised hierarchical clustering using this gene list demonstrated that a subgroup of SSc samples (especially those from patients with affected skin) clustered together. Furthermore, there were clusters of genes that corresponded to the samples with an intrinsic inflammatory signature (9) and the above-described keratin signature, but samples with a prominent intrinsic proliferative signature (9) and their corresponding genes could not be detected. Furthermore, 13 of 58 genes in the inflammatory intrinsic signature overlapped with our list of 1,870 transcripts (P < 0.001, odds ratio [OR] 3.48, 95% confidence interval [95% CI] 1.89–6.41), while only 1 of 55 genes in the proliferative intrinsic signature overlapped with this gene list (P = 0.127, OR 0.32, 95% CI 0.06–1.61). This indicates that the previously described inflammatory intrinsic signature (9) had significant overlap with our list of 1,870 genes, while the proliferative intrinsic genes did not show a significant overlap with the genes that have highly varying levels in our data set.
Correlates of keratin and fibroinflammatory signatures
Next, we calculated composite scores for the keratin and fibroinflammatory clusters. As shown in Supplementary Figure 9 (available on the Arthritis & Rheumatology web site at http://onlinelibrary.wiley.com/doi/10.1002/art.39289/abstract), both clusters showed higher composite scores in patients compared with controls (P < 0.001 for the keratin cluster and P < 0.001 for the fibroinflammatory clusters).
Table 1 shows clinical correlates of these 2 composite transcript scores. A higher composite keratin score was associated with shorter disease duration and the presence of ILD, while a higher composite fibroinflammatory score was associated with a higher MRSS, local skin score, and diffuse cutaneous involvement. Composite scores were not associated with SSc-related antibodies (data not shown) or treatment with immunosuppressive agents.
Examination of clinical correlates in the 14 SSc patients with a “normal-like signature” revealed that they had a significantly longer disease duration. In addition, a composite score for predicted activation of the Wnt/β-catenin pathway in our data set based on a previously published gene list (24) was calculated. Both the keratin and fibroinflammatory composite scores were significantly correlated with the Wnt/β-catenin composite scores (rs = 0.29 [P = 0.004] and r = 0.56 [P < 0.001], respectively).
Analysis of cell type signature scores
As shown in Figure 3, the 1,604 overexpressed transcripts in SSc skin were enriched in genes specifically expressed in fibroblasts, macrophages, microvascular tissue, and DCs. Similarly, the 1,150 underexpressed transcripts were enriched in genes specifically expressed in lymphocytes (NK cells, CD4+ and CD8+ T cells, and B cells), and epidermis-related cell types (melanocytes, keratinocytes, and hair outer root sheath [ORS] cells). Again, calculation of cell type signature scores revealed significant heterogeneity across patients.
Figure 3.

Genes differentially expressed in systemic sclerosis (SSc) skin samples (versus control samples). Enrichment with genes specifically expressed in certain cell types is shown. Genes were ranked according to the degree to which they were specifically expressed in each of 14 cell types. Enrichment statistics quantify the degree to which genes that were significantly increased (A) or decreased (B) in SSc skin samples are among the genes specifically expressed with respect to each cell type. Positive enrichment statistics denote enrichment of differentially expressed genes with respect to genes most specifically expressed in a given cell type. Negative enrichment statistics denote enrichment of differentially expressed genes with respect to genes showing specifically low expression in a given cell type. ** = P < 0.001 by Wilcoxon’s rank sum test. DC = dendritic cell; KC = keratinocyte; ORS = outer root sheath; NK = natural killer.
At the individual patient level (Figure 4), significantly higher scores were more frequently calculated for fibroblasts (72% of patients), indicating that genes specifically expressed in fibroblasts were increased in most of the biopsy specimens from patients with SSc (for additional information, see Supplementary Figure 10, available on the Arthritis & Rheumatology web site at http://onlinelibrary.wiley.com/doi/10.1002/art.39289/abstract). Similarly, in the majority of patients, we calculated significantly higher signature scores for microvascular and macrophage-related transcripts. Consistent with coexpression of fibrotic and inflammatory transcripts in our unsupervised hierarchical clustering experiments, the majority of samples with significantly higher fibroblast scores (35 of 44 [80%]) had significant macrophage and/or DC scores. Furthermore, the top cell–based profiles correlating with the fibroinflammatory signature in the initial clustering (Figure 2) were macrophage genes (r = 0.75, P < 0.005) and fibroblast genes (r = 0.68, P < 0.001). There was also a subgroup of patients with elevated expression of hair ORS–specific genes; the top cell-based profiles correlating with the keratin signature in the initial clustering (Figure 2) were hair ORS genes (rs = 0.44, P < 0.001) and keratinocyte genes (rs = 0.38, P < 0.001).
Figure 4.
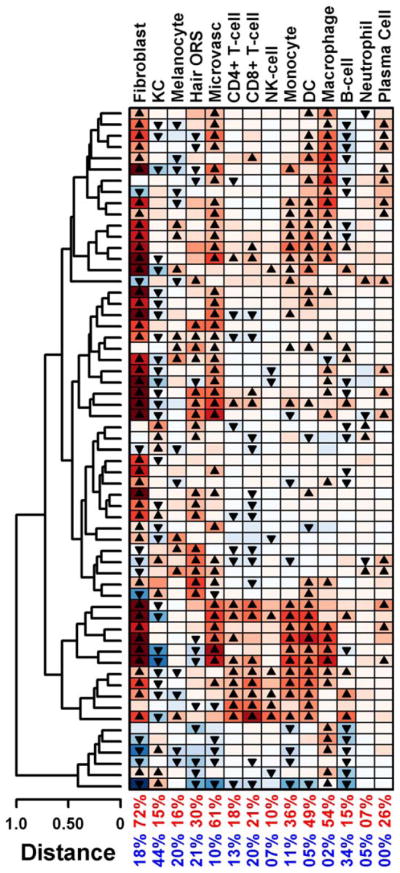
Hierarchical clustering of patients with systemic sclerosis based on cell type signature scores. Each row represents a patient sample. Transcript scores for each patient were calculated with respect to 14 cell types. Scores were calculated based on fold-change estimates for 125 signature genes per cell type (expression in patient samples/average expression in 36 control samples). Triangles denote scores that are significantly high (▲) or low (▼) compared with all other human genes. Values in the 2 bottom rows are the percentages of patients with significantly high (red) or low (blue) scores. KC = keratinocyte; ORS = outer root sheath; NK = natural killer; DC = dendritic cell.
Longitudinal progression of the keratin signature
In an exploratory investigation, we examined the longitudinal progression of the above-mentioned signatures (Figure 2) in 5 patients. The keratin signature increased numerically over time in the 2 patients with early disease (disease duration <2 years), while it declined numerically in the remainder of the patients (see Supplementary Figure 11, available on the Arthritis & Rheumatology web site at http://onlinelibrary.wiley.com/doi/10.1002/art.39289/abstract). The fibroinflammatory score showed less variation over time, although a downward trend over time was observed in the majority of samples (see Supplementary Figure 11). None of the observed changes reached statistical significance, which might be attributable to the small sample size (n = 5).
Immunohistochemical studies of the keratin signature
As shown in Figure 5, keratin 6 and keratin 16 staining in SSc skin samples (5 with a keratin signature) and matched controls was confined to hair follicles and eccrine sweat glands, whereas there was diffuse staining of the epidermis in a sample of psoriatic skin (positive controls). The keratin 85 staining was confined to hair matrix/precortex and hair cuticle in all 3 sample types (SSc, psoriasis, and controls) and was not present in the epidermis.
Figure 5.
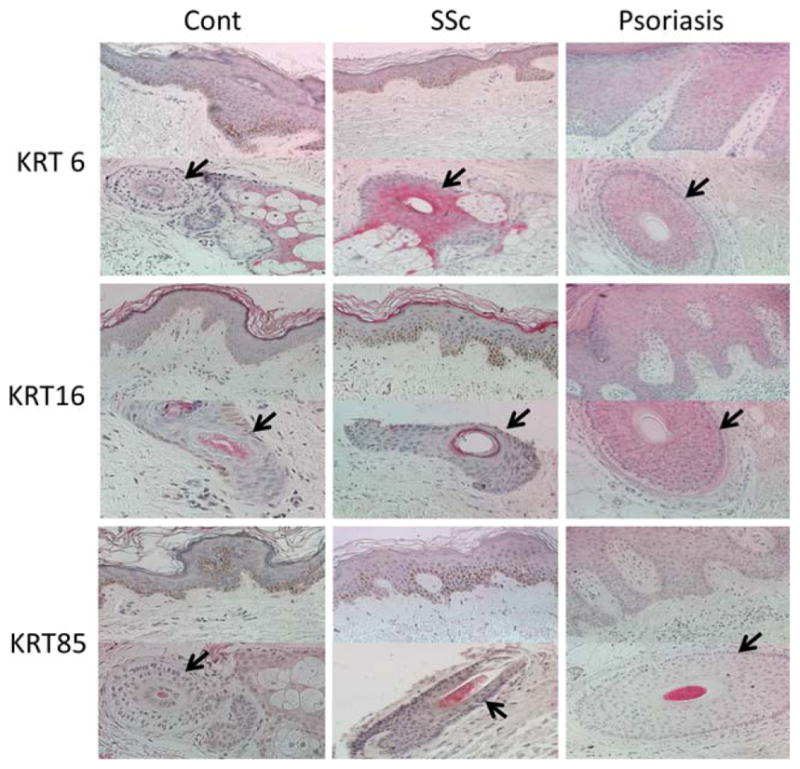
Representative images showing keratin 6 (KRT6), KRT16, and KRT85 staining of skin tissue from patients with systemic sclerosis (SSc) with a keratin transcript signature (n = 5) and unaffected control subjects (n = 5). Psoriatic skin was used as a positive control for KRT6 and KRT16. Arrows indicate hair follicles. Original magnification × 400.
DISCUSSION
In the present study, we investigated the global gene expression profile in a large sample of patients with SSc and control subjects, using a comprehensive microarray platform to dissect the heterogeneity of transcriptome patterns in affected SSc skin. SSc skin samples showed prominent fibroinflammatory and keratin transcript profiles that correlated with certain disease features. Furthermore, we performed a cell-based modular analysis that showed substantial heterogeneity in the inflammatory profile of SSc skin. These findings may have important implications for identification of therapeutic targets and development of biomarkers.
A prominent fibroinflammatory signature correlating with the MRSS and the local skin score was present in the majority of SSc skin samples. Hierarchical clustering and cell type–specific signature scores indicated that inflammatory and fibrotic signatures coexist in most patients. As expected, the majority of patients in the current study (72%) displayed significant up-regulation of the fibroblast cell-type signature, while the overall inflammatory profile of SSc patients showed significant heterogeneity. This heterogeneity might provide important information for stratifying patients for targeted therapies and/or responses to general immunosuppression. The DC/macrophage modules were the most commonly up-regulated inflammatory modules (>50%), whereas NK cell, CD4, and CD8 T cell modules were up-regulated in only 10%, 18%, and 21% of cases, respectively. A similar analysis in psoriatic plaques revealed a more inflammatory and less fibrotic profile. In patients with psoriasis, the majority of samples displayed heightened macrophage, DC, NK cell, and CD8 T cell signatures, while only 9% of samples showed up-regulation of the fibroblast signature (25). This finding is also clinically plausible, because psoriatic plaques are more responsive to immunosuppression than is SSc skin.
Full-thickness skin biopsy specimens consist of a heterogeneous collection of cell types, each of which contributes to the aggregate expression measurement for any individual gene. However, few previous global gene expression studies in SSc skin have included analyses to relate the observed transcript heterogeneity to cell-specific signatures. Whitfield et al (10) measured gene expression in 11 different cell lines grown in culture that represent cell types likely to be present in skin. A comparison of the transcript profile of these cell lines with skin samples revealed that SSc skin had prominent dysregulation of fibroblast- and endothelial-related genes. Gardner et al (7) examined the gene expression profile of SSc skin and concomitantly collected explanted passage 4 fibroblasts. A comparison of skin and fibroblast transcriptomes showed that a subgroup of differentially expressed transcripts are likely to be of fibroblast origin, while other cell types were also required for full expression of the SSc phenotype. Composite scores for the cell-specific signatures were not calculated in either of those studies.
Pendergrass et al (17) also performed a cell type–specific analysis based on 2 previously published data sets (26,27). Similar to our analysis, a composite score was calculated for cell-based gene signatures. However, we have here calculated a rank-based signature score statistic while using a novel and large collection of data samples to identify signature genes for each cell type (25,28,29). Pendergrass et al also observed significant heterogeneity in the SSc skin inflammatory profile. However, a cross-comparison between their specific cell type signatures and our results is difficult, because the cell types were defined differently. Similar to our results, a prominent fibroblast signature in patient samples was observed. The most prominent inflammatory cell signature in the Pendergrass study was the granulocyte signature, while the macrophage signature was the most prominent inflammatory signature in our study. Those investigators also reported a combined signature for myeloid cells that was present in the majority of patients.
We also investigated the presence of previously described intrinsic inflammatory and fibrotic signatures (9,16,17) in our data set. A subset of SSc samples showed an increased coexpression pattern for the intrinsic inflammatory transcripts, but this was not observed for the intrinsic proliferative transcripts. In the present study, we not only included a larger number of patients but also investigated a substantially higher number of control subjects with a similar demographic background (36 control subjects in the present study versus 6–10 in previous studies [9,16,17]). This larger number increased the power to detect differentially expressed transcripts and better reflects the heterogeneity within each study population (patients and controls) during the clustering analysis. Furthermore, we used a platform that includes 54% more genes (30,500 versus 19,800), allowing us to perform a more comprehensive investigation of SSc skin. For example, only 55.1% of keratin signature genes were present in the previously used platform (16,17). Based on our results, it seems prudent to continue broader molecular profiling of SSc skin to characterize the transcript dysregulations most relevant for understanding disease mechanisms, creating subsets, identifying therapeutic targets, and developing biomarkers.
We observed a prominent keratin signature in SSc skin, which is a novel finding. Previous research mainly focused on molecular dysregulations in the dermal layer of SSc skin, although phenotypic changes in the skin such as hypopigmentation or hyperpigmentation also imply involvement of the epidermis (30). Previous studies have also indicated overexpression of the key cytokines TGFβ (31), monocyte chemotactic protein 1 (32), vascular endothelial growth factor (33), and interleukin-2 receptor (34) in SSc epidermis. A proteomic analysis of lesional scleroderma skin showed prominent dysregulation of proteins specific to epidermal differentiation in addition to those involved in extracellular matrix production and myofibroblast contractility (35). In a followup study, epidermal keratinocyte maturation was delayed, and an activation pattern with up-regulation of keratin 6 and keratin 16 was observed in both clinically involved and uninvolved skin of patients with early dcSSc. Furthermore, coculture of epidermis from SSc patients and normal human fibroblasts promoted fibroblast contractility to the extent observed with TGFβ, while epidermis from healthy controls did not have a similar effect (36).
Similar to the above-mentioned study (36), the keratin transcript signature was present in involved and uninvolved skin in the present study. However, our immunohistochemical staining results did not indicate that the keratin signature that we observed was a marker of general activation of keratinocytes, as seen in psoriatic skin (25). Specifically, keratin 6 and keratin 16, both of which are usually expressed only in hair and eccrine sweat glands but show broad epidermal staining in diseases with general activation of keratinocytes (e.g., psoriasis), did not show a broad epidermal staining pattern in SSc patients with the keratin signature. The keratin signature consisted mainly of up-regulation of hair- and adnexal structure–related keratins. Consistent with this notion, keratin 85 staining was confined to hair follicles and eccrine sweat glands. Of note, we do not believe that the observed keratin signature is due to the higher number of hair follicles in SSc patients, because the same anatomic site was biopsied in patients and controls. Furthermore, there was no association between the keratin signature and male sex.
The observed association between the keratin signature and shorter disease duration supports the notion that this transcript profile is a time-dependent occurrence. The observed keratin signature might be a response of the hair follicle to the molecular changes in SSc skin. Hair follicle morphogenesis and growth are regulated through complex and reciprocal epithelial mesenchymal interactions. The dermal papilla is essential for follicle formation in the embryo and for initiating the next period of hair growth in adults (37). Activation of Wnt/β-catenin signaling is an important stimulator of new hair growth and differentiation (38–40). In our data set, the keratin signature correlated with the predicted activation of the Wnt/β-catenin pathway, supporting the notion that the up-regulation of this pathway in SSc (41) might contribute to the observed keratin signature. The observed association of the keratin signature with ILD might also stem from common upstream regulators for ILD and this transcript signature. Further studies are needed to investigate the potential role of this signature in the pathogenesis of SSc. In general, our results provide further evidence for the presence of molecular dysregulation in several skin compartments (not only dermis) in SSc.
Similar to what was observed in previous studies, a subset of patients showed normal-like gene expression profiles (7,9,16,17). These patients had a significantly longer disease duration, and a trend for association of a normal-like signature with longer disease duration was observed in a previous SSc skin data set (17). This finding is also supported by the decreasing composite fibroinflammatory scores observed in our pilot longitudinal study (see Supplementary Figure 11, available on the Arthritis & Rheumatology web site at http://onlineflibrary.wiley.com/doi/10.1002/art.39289/abstract). Patients with a normal-like transcript profile also tended to have milder disease (lower MRSS and lower skin score at the biopsy site), although these findings did not reach statistical significance.
Patients in whom skin at the biopsy site was affected were more likely to have a distinct gene expression profile and a higher composite fibroinflammatory score. However, we were unable to compare the gene expression profile of skin biopsy specimens obtained from 1 affected area (e.g., the arm) and 1 unaffected area (usually the buttock or back) in the same individual, because biopsies of the buttocks area were not performed in our study. Furthermore, the number of differentially expressed genes in clinically affected versus unaffected SSc skin was substantially lower than the number of transcripts in affected SSc skin versus control skin, indicating substantial heterogeneity in the group with unaffected SSc skin. It is likely that a subgroup of SSc patients with clinically unaffected skin have histologic changes characteristic of SSc.
In conclusion, this large global SSc skin gene expression study indicated the presence of prominent fibroinflammatory and keratin profiles. A subset of patients with a longer disease duration had a normal-like gene expression profile. Furthermore, analysis of cell type–specific signature scores revealed significant heterogeneity in the inflammatory profile of SSc skin, which might provide important information for substratifying patients to enable targeted therapies and to predict the response to immunosuppression.
Supplementary Material
Acknowledgments
We thank Dr. Samuel Theodore for his assistance with the data collection and Julio Charles for performing the laboratory experiments. We are also grateful to Professor Lutz Langbein (University of Heidelberg, Germany) for providing the KRT85 antibodies.
Supported by the NIH (grants KL2-RR-024149 and K23-AR-061436 to Dr. Assassi, K08-AR-060802 to Dr. Gudjonsson, and UL1-TR-000371), the Scleroderma Foundation (SCORE Grant to Dr. Assassi), the A. Alfred Taubman Medical Research Institute (Kenneth and Frances Eisenberg Emerging Scholar Award to Dr. Gudjonsson), the Doris Duke Foundation (grant 2013106 to Dr. Gudjonsson), and the US Department of Defense (contract W81XWH-13-1-0452 to Dr. Mayes).
Footnotes
Dr. Khanna has received consulting fees from Actelion, Bayer, Bristol-Myers Squibb, Cytori, Roche/Genentech, InterMune, Lycera, Merck, and Seattle Genetics (less than $10,000 each). Dr. Furst has received consulting fees, speaking fees, and/or honoraria from AbbVie, Actelion, Bristol-Myers Squibb, Amgen, Gilead, GlaxoSmithKline, Novartis, Pfizer, Roche/Genentech, UCB, Cytori, and Janssen (less than $10,000 each). Dr. Mayes has received consulting fees, speaking fees, and/or honoraria from Practice Point Communications, Medtelligence, Boehringer-Ingelheim, and Cytori (less than $10,000 each), receives royalties from Oxford University Press for The Scleroderma Book, from Harry Stewart Talks for a video of a prerecorded lecture on scleroderma, and from the British Medical Journal for a monograph on scleroderma, and has served as a paid consultant to the Gerson-Lehrman Group and to Leerink Partners, investment analysis companies, regarding systemic sclerosis unmet needs. Dr. Gudjonsson has received consulting fees, speaking fees, and/or honoraria from Novartis and AnaptysBio (less than $10,000 each) and owns stock or stock options in NuMedii.
AUTHOR CONTRIBUTIONS
All authors were involved in drafting the article or revising it critically for important intellectual content, and all authors approved the final version to be published. Dr. Assassi had full access to all of the data in the study and takes responsibility for the integrity of the data and the accuracy of the data analysis.
Study conception and design. Assassi, Tan, Furst, Mayes, Gudjonsson, Chang.
Acquisition of data. Assassi, Tan, Khanna, Furst, Tashkin, Mayes.
Analysis and interpretation of data. Assassi, Swindell, Wu, Tan, Jahan-Tigh, Mayes, Gudjonsson, Chang.
References
- 1.Elhai M, Meune C, Avouac J, Kahan A, Allanore Y. Trends in mortality in patients with systemic sclerosis over 40 years: a systematic review and meta-analysis of cohort studies. Rheumatology (Oxford) 2011;51:1017–26. doi: 10.1093/rheumatology/ker269. [DOI] [PubMed] [Google Scholar]
- 2.Bullinger L, Dohner K, Bair E, Frohling S, Schlenk RF, Tibshirani R, et al. Use of gene-expression profiling to identify prognostic subclasses in adult acute myeloid leukemia. N Engl J Med. 2004;350:1605–16. doi: 10.1056/NEJMoa031046. [DOI] [PubMed] [Google Scholar]
- 3.Baechler EC, Batliwalla FM, Karypis G, Gaffney PM, Ortmann WA, Espe KJ, et al. Interferon-inducible gene expression signature in peripheral blood cells of patients with severe lupus. Proc Natl Acad Sci U S A. 2003;100:2610–5. doi: 10.1073/pnas.0337679100. [DOI] [PMC free article] [PubMed] [Google Scholar]
- 4.Beer DG, Kardia SL, Huang CC, Giordano TJ, Levin AM, Misek DE, et al. Gene-expression profiles predict survival of patients with lung adenocarcinoma. Nat Med. 2002;8:816–24. doi: 10.1038/nm733. [DOI] [PubMed] [Google Scholar]
- 5.Van Baarsen LG, Vosslamber S, Tijssen M, Baggen JM, van der Voort LF, Killestein J, et al. Pharmacogenomics of interferon-β therapy in multiple sclerosis: baseline IFN signature determines pharmacological differences between patients. PLoS One. 2008;3:e1927. doi: 10.1371/journal.pone.0001927. [DOI] [PMC free article] [PubMed] [Google Scholar]
- 6.Kandoth C, Schultz N, Cherniack AD, Akbani R, Liu Y, Shen H, et al. Integrated genomic characterization of endometrial carcinoma. Nature. 2013;497:67–73. doi: 10.1038/nature12113. [DOI] [PMC free article] [PubMed] [Google Scholar]
- 7.Gardner H, Shearstone JR, Bandaru R, Crowell T, Lynes M, Trojanowska M, et al. Gene profiling of scleroderma skin reveals robust signatures of disease that are imperfectly reflected in the transcript profiles of explanted fibroblasts. Arthritis Rheum. 2006;54:1961–73. doi: 10.1002/art.21894. [DOI] [PubMed] [Google Scholar]
- 8.Hsu E, Shi H, Jordan RM, Lyons-Weiler J, Pilewski JM, Feghali-Bostwick CA. Lung tissues in patients with systemic sclerosis have gene expression patterns unique to pulmonary fibrosis and pulmonary hypertension. Arthritis Rheum. 2011;63:783–94. doi: 10.1002/art.30159. [DOI] [PMC free article] [PubMed] [Google Scholar]
- 9.Milano A, Pendergrass SA, Sargent JL, George LK, McCalmont TH, Connolly MK, et al. Molecular subsets in the gene expression signatures of scleroderma skin. PLoS One. 2008;3:e2696. doi: 10.1371/journal.pone.0002696. [DOI] [PMC free article] [PubMed] [Google Scholar]
- 10.Whitfield ML, Finlay DR, Murray JI, Troyanskaya OG, Chi JT, Pergamenschikov A, et al. Systemic and cell type-specific gene expression patterns in scleroderma skin. Proc Natl Acad Sci U S A. 2003;100:12319–24. doi: 10.1073/pnas.1635114100. [DOI] [PMC free article] [PubMed] [Google Scholar]
- 11.Assassi S, Mayes MD, Arnett FC, Gourh P, Agarwal SK, McNearney TA, et al. Systemic sclerosis and lupus: points in an interferon-mediated continuum. Arthritis Rheum. 2010;62:589–98. doi: 10.1002/art.27224. [DOI] [PMC free article] [PubMed] [Google Scholar]
- 12.Christmann RB, Hayes E, Pendergrass S, Padilla C, Farina G, Affandi AJ, et al. Interferon and alternative activation of monocyte/macrophages in systemic sclerosis–associated pulmonary arterial hypertension. Arthritis Rheum. 2011;63:1718–28. doi: 10.1002/art.30318. [DOI] [PMC free article] [PubMed] [Google Scholar]
- 13.Higgs BW, Liu Z, White B, Zhu W, White WI, Morehouse C, et al. Patients with systemic lupus erythematosus, myositis, rheumatoid arthritis and scleroderma share activation of a common type I interferon pathway. Ann Rheum Dis. 2011;70:2029–36. doi: 10.1136/ard.2011.150326. [DOI] [PubMed] [Google Scholar]
- 14.Streicher K, Morehouse CA, Groves CJ, Rajan B, Pilataxi F, Lehmann KP, et al. The plasma cell signature in autoimmune disease. Arthritis Rheumatol. 2014;66:173–84. doi: 10.1002/art.38194. [DOI] [PubMed] [Google Scholar]
- 15.Tan FK, Zhou X, Mayes MD, Gourh P, Guo X, Marcum C, et al. Signatures of differentially regulated interferon gene expression and vasculotrophism in the peripheral blood cells of systemic sclerosis patients. Rheumatology (Oxford) 2006;45:694–702. doi: 10.1093/rheumatology/kei244. [DOI] [PubMed] [Google Scholar]
- 16.Hinchcliff M, Huang CC, Wood TA, Mahoney JM, Martyanov V, Bhattacharyya S, et al. Molecular signatures in skin associated with clinical improvement during mycophenolate treatment in systemic sclerosis. J Invest Dermatol. 2013;133:1979–89. doi: 10.1038/jid.2013.130. [DOI] [PMC free article] [PubMed] [Google Scholar]
- 17.Pendergrass SA, Lemaire R, Francis IP, Mahoney JM, Lafyatis R, Whitfield ML. Intrinsic gene expression subsets of diffuse cutaneous systemic sclerosis are stable in serial skin biopsies. J Invest Dermatol. 2012;132:1363–73. doi: 10.1038/jid.2011.472. [DOI] [PMC free article] [PubMed] [Google Scholar]
- 18.Assassi S, Sharif R, Lasky RE, McNearney TA, Estrada YM, Draeger HT, et al. Predictors of interstitial lung disease in early systemic sclerosis: a prospective longitudinal study of the GENI-SOS cohort. Arthritis Res Ther. 2010;12:R166. doi: 10.1186/ar3125. [DOI] [PMC free article] [PubMed] [Google Scholar]
- 19.Khanna D, Saggar R, Mayes MD, Abtin F, Clements PJ, Maranian P, et al. A one-year, phase I/IIa, open-label pilot trial of imatinib mesylate in the treatment of systemic sclerosis–associated active interstitial lung disease. Arthritis Rheum. 2011;63:3540–6. doi: 10.1002/art.30548. [DOI] [PMC free article] [PubMed] [Google Scholar]
- 20.Van den Hoogen F, Khanna D, Fransen J, Johnson SR, Baron M, Tyndall A, et al. 2013 classification criteria for systemic sclerosis: an American College of Rheumatology/European League Against Rheumatism collaborative initiative. Arthritis Rheum. 2013;65:2737–47. doi: 10.1002/art.38098. [DOI] [PMC free article] [PubMed] [Google Scholar]
- 21.Leroy EC, Black C, Fleischmajer R, Jablonska S, Krieg T, Medsger TA, Jr, et al. Scleroderma (systemic sclerosis): classification, subsets, and pathogenesis. J Rheumatol. 1988;15:202–5. [PubMed] [Google Scholar]
- 22.Clements P, Lachenbruch P, Siebold J, White B, Weiner S, Martin R, et al. Inter and intraobserver variability of total skin thickness score (modified Rodnan TSS) in systemic sclerosis. J Rheumatol. 1995;22:1281–5. [PubMed] [Google Scholar]
- 23.Tusher VG, Tibshirani R, Chu G. Significance analysis of microarrays applied to the ionizing radiation response. Proc Natl Acad Sci U S A. 2001;98:5116–21. doi: 10.1073/pnas.091062498. [DOI] [PMC free article] [PubMed] [Google Scholar]
- 24.Kenny PA, Enver T, Ashworth A. Receptor and secreted targets of Wnt-1/β-catenin signalling in mouse mammary epithelial cells. BMC Cancer. 2005;5:3. doi: 10.1186/1471-2407-5-3. [DOI] [PMC free article] [PubMed] [Google Scholar]
- 25.Swindell WR, Johnston A, Voorhees JJ, Elder JT, Gudjonsson JE. Dissecting the psoriasis transcriptome: inflammatory- and cytokine-driven gene expression in lesions from 163 patients. BMC Genomics. 2013;14:527. doi: 10.1186/1471-2164-14-527. [DOI] [PMC free article] [PubMed] [Google Scholar]
- 26.Palmer C, Diehn M, Alizadeh AA, Brown PO. Cell-type specific gene expression profiles of leukocytes in human peripheral blood. BMC Genomics. 2006;7:115. doi: 10.1186/1471-2164-7-115. [DOI] [PMC free article] [PubMed] [Google Scholar]
- 27.Haider AS, Lowes MA, Suarez-Farinas M, Zaba LC, Cardinale I, Blumenberg M, et al. Cellular genomic maps help dissect pathology in human skin disease. J Invest Dermatol. 2008;128:606–15. doi: 10.1038/sj.jid.5701067. [DOI] [PubMed] [Google Scholar]
- 28.Swindell WR, Johnston A, Xing X, Voorhees JJ, Elder JT, Gudjonsson JE. Modulation of epidermal transcription circuits in psoriasis: new links between inflammation and hyperproliferation. PLoS One. 2013;8:e79253. doi: 10.1371/journal.pone.0079253. [DOI] [PMC free article] [PubMed] [Google Scholar]
- 29.Swindell WR, Stuart PE, Sarkar MK, Voorhees JJ, Elder JT, Johnston A, et al. Cellular dissection of psoriasis for transcriptome analyses and the post-GWAS era. BMC Med Genomics. 2014;7:27. doi: 10.1186/1755-8794-7-27. [DOI] [PMC free article] [PubMed] [Google Scholar]
- 30.Tabata H, Hara N, Otsuka S, Yamakage A, Yamazaki S, Koibuchi N. Correlation between diffuse pigmentation and keratinocyte-derived endothelin-1 in systemic sclerosis. Int J Dermatol. 2000;39:899–902. doi: 10.1046/j.1365-4362.2000.00110.x. [DOI] [PubMed] [Google Scholar]
- 31.Rudnicka L, Varga J, Christiano AM, Iozzo RV, Jimenez SA, Uitto J. Elevated expression of type VII collagen in the skin of patients with systemic sclerosis: regulation by transforming growth factor-β. J Clin Invest. 1994;93:1709–15. doi: 10.1172/JCI117154. [DOI] [PMC free article] [PubMed] [Google Scholar]
- 32.Distler O, Pap T, Kowal-Bielecka O, Meyringer R, Guiducci S, Landthaler M, et al. Overexpression of monocyte chemoattractant protein 1 in systemic sclerosis: role of platelet-derived growth factor and effects on monocyte chemotaxis and collagen synthesis. Arthritis Rheum. 2001;44:2665–78. doi: 10.1002/1529-0131(200111)44:11<2665::aid-art446>3.0.co;2-s. [DOI] [PubMed] [Google Scholar]
- 33.Davies CA, Jeziorska M, Freemont AJ, Herrick AL. The differential expression of VEGF, VEGFR-2, and GLUT-1 proteins in disease subtypes of systemic sclerosis. Hum Pathol. 2006;37:190–7. doi: 10.1016/j.humpath.2005.10.007. [DOI] [PubMed] [Google Scholar]
- 34.Distler JH, Jungel A, Kowal-Bielecka O, Michel BA, Gay RE, Sprott H, et al. Expression of interleukin-21 receptor in epidermis from patients with systemic sclerosis. Arthritis Rheum. 2005;52:856–64. doi: 10.1002/art.20883. [DOI] [PubMed] [Google Scholar]
- 35.Aden N, Shiwen X, Aden D, Black C, Nuttall A, Denton CP, et al. Proteomic analysis of scleroderma lesional skin reveals activated wound healing phenotype of epidermal cell layer. Rheumatology (Oxford) 2008;47:1754–60. doi: 10.1093/rheumatology/ken370. [DOI] [PubMed] [Google Scholar]
- 36.Aden N, Nuttall A, Shiwen X, de Winter P, Leask A, Black CM, et al. Epithelial cells promote fibroblast activation via IL-1α in systemic sclerosis. J Invest Dermatol. 2010;130:2191–200. doi: 10.1038/jid.2010.120. [DOI] [PubMed] [Google Scholar]
- 37.Hardy MH. The secret life of the hair follicle. Trends Genet. 1992;8:55–61. doi: 10.1016/0168-9525(92)90350-d. [DOI] [PubMed] [Google Scholar]
- 38.Lo CC, Prowse DM, Watt FM. Transient activation of β-catenin signalling in adult mouse epidermis is sufficient to induce new hair follicles but continuous activation is required to maintain hair follicle tumours. Development. 2004;131:1787–99. doi: 10.1242/dev.01052. [DOI] [PubMed] [Google Scholar]
- 39.Lowry WE, Blanpain C, Nowak JA, Guasch G, Lewis L, Fuchs E. Defining the impact of β-catenin/Tcf transactivation on epithelial stem cells. Genes Dev. 2005;19:1596–611. doi: 10.1101/gad.1324905. [DOI] [PMC free article] [PubMed] [Google Scholar]
- 40.Van Mater D, Kolligs FT, Dlugosz AA, Fearon ER. Transient activation of β-catenin signaling in cutaneous keratinocytes is sufficient to trigger the active growth phase of the hair cycle in mice. Genes Dev. 2003;17:1219–24. doi: 10.1101/gad.1076103. [DOI] [PMC free article] [PubMed] [Google Scholar]
- 41.Wei J, Fang F, Lam AP, Sargent JL, Hamburg E, Hinchcliff ME, et al. Wnt/β-catenin signaling is hyperactivated in systemic sclerosis and induces Smad-dependent fibrotic responses in mesenchymal cells. Arthritis Rheum. 2012;64:2734–45. doi: 10.1002/art.34424. [DOI] [PMC free article] [PubMed] [Google Scholar]
Associated Data
This section collects any data citations, data availability statements, or supplementary materials included in this article.