

Abstract
Following spinal cord injury (SCI), astrocytes demonstrate long-lasting reactive changes, which are associated with the persistence of neuropathic pain and motor dysfunction. We previously demonstrated that upregulation of trkB.T1, a truncated isoform of the brain-derived neurotrophic factor receptor (BDNF), contributes to gliosis after SCI, but little is known about the effects of trkB.T1 on the function of astrocytes. As trkB.T1 is the sole isoform of trkB receptors expressed on astrocytes, we examined the function of trkB.T1-driven astrocytes in vitro and in vivo. Immunohistochemistry showed that trkB.T1+ cells were significantly upregulated 7 d after injury, with sustained elevation in white matter through 8 weeks. The latter increase was predominantly found in astrocytes. TrkB.T1 was also highly expressed by neurons and microglia/macrophages at 7 d after injury and declined by 8 weeks. RNA sequencing of cultured astrocytes derived from trkB.T1+/+ (WT) and trkB.T1−/− (KO) mice revealed downregulation of migration and proliferation pathways in KO astrocytes. KO astrocytes also exhibited slower migration/proliferation in vitro in response to FBS or BDNF compared with WT astrocytes. Reduced proliferation of astrocytes was also confirmed after SCI in astrocyte-specific trkB.T1 KO mice; using mechanical allodynia and pain-related measurements on the CatWalk, these animals also showed reduced hyperpathic responses, along with improved motor coordination. Together, our data indicate that trkB.T1 in astrocytes contributes to neuropathic pain and neurological dysfunction following SCI, suggesting that trkB.T1 may provide a novel therapeutic target for SCI.
SIGNIFICANCE STATEMENT Neuropathic pain after spinal cord injury (SCI) may in part be caused by upregulation of the brain-derived neurotrophic factor (BDNF) receptor trkB.T1, a truncated isoform of BDNF. TrkB.T1 is the only isoform of tropomyosin-related receptor kinase type B (trkB) receptors expressed on astrocytes. Here, we showed that trkB.T1 is significantly increased in the injured mouse spinal cord, where it is predominantly found in astrocytes. RNA sequencing of cultured astrocytes demonstrated downregulation of migration and proliferation pathways in trkB.T1 KO astrocytes. This was validated in vivo, where deletion of trkB.T1 in astrocytes reduced cell proliferation and migration. After SCI, astrocyte-specific trkB.T1 KO mice showed reduced hyperpathic responses and improved motor coordination. Therefore, the trkB.T1 receptor plays a significant pathophysiological role after SCI, and may provide a novel therapeutic target for SCI.
Keywords: astrocytes, brain-derived neurotrophic factor, neuropathic pain, spinal cord injury, trkB.T1
Introduction
Following spinal cord injury (SCI), reactive astrocytes are the main cellular component of the glial scar. They undergo morphological changes, show enhanced proliferation and migration, and increase synthesis of glial fibrillary acidic protein (GFAP; Silver and Miller, 2004). The glial scar can serve a protective role (Faulkner et al., 2004) but can also limit axon regeneration (Silver and Miller, 2004). Moreover, after SCI or peripheral nerve injuries, such glial changes may contribute to neuropathic pain through the production of selected cytokines, chemokines, and growth factors (Hulsebosch et al., 2009; Ji et al., 2013). However, the molecular mechanisms underlying these processes are still largely undefined.
Brain-derived neurotrophic factor (BDNF) is a potent modulator of pain signaling initiated by binding of the mature BDNF to the tropomyosin-related receptor kinase type B (trkB) receptor family. Although there are multiple isoforms, the most commonly expressed include the catalytically active full-length receptor trkB.FL and a truncated form, trkB.T1 (Middlemas et al., 1991; Squinto et al., 1991). TrkB.T1 binds to BDNF with the same affinity as trkB.FL; however, its short 11 aa intracellular domain lacks the kinase activation component required for classical signal transduction pathways, indicating it may have signaling pathways that are distinct from trkB.FL. TrkB.T1 is the predominant isoform expressed in the adult mammalian nervous system (Middlemas et al., 1991; Klein et al., 1993) and is also the sole isoform expressed by astrocytes (Rose et al., 2003; Dorsey et al., 2006). Although the biological functions of trkB.T1 signaling remain poorly understood (Fenner, 2012), during development, trkB.T1 regulates calcium entry into astrocytes as well as astrocytic morphology via ρ GTPases in primary astrocyte cultures (Rose et al., 2003; Ohira et al., 2005). However, little is known about the effects of trkB.T1 on the function of astrocytes.
TrkB.T1 is upregulated in multiple injury and disease states, including SCI, amyotrophic lateral sclerosis, Down syndrome, Alzheimer's disease, and HIV-related neuropathic pain (Ferrer et al., 1999; King et al., 2000; Liebl et al., 2001; Dorsey et al., 2002, 2006; Yanpallewar et al., 2012; Wu et al., 2013). In mouse models of neuropathic pain, including that caused by antiretroviral treatment or hindpaw inflammation, the genetic deletion of trkB.T1 reduced both mechanical and thermal hypersensitivity (Renn et al., 2009), and reduced mechanical hyperesthesia after SCI (Wu et al., 2013). Upregulation of trkB.T1 in injured spinal cord contributes to astrogliosis, whereas genetic deletion of trkB.T1 significantly reduces gliosis and is associated with decreased locomotor recovery and hyperpathia (Wu et al., 2013). However, the role for trkB.T1-driven astrocytes following SCI remains poorly understood.
TrkB.T1 is the sole isoform expressed on astrocytes. As such, astrocytes may provide a model system to explore the role and function of trkB.T1 in cell signaling. Here we examined proliferation and migration, as well as transcription changes, in cultured astrocytes derived from neonatal trkB.T1+/+ versus trkB.T1−/− mice, or after knockdown using siRNAs. We also examined whether astrocyte-specific trkB.T1 deletion can convey additional beneficial effects in post-SCI mice and provide significant amelioration of neuropathic pain while improving motor recovery. Our data demonstrate reduced astrocyte proliferation and migration in vitro and in vivo. After SCI, astrocyte-specific trkB.T1−/− mice showed reduced hyperpathic responses and improved motor coordination. Together, our findings suggest that trkB.T1-mediated astrocyte dysfunction contributes to impaired motor function and neuropathic pain after SCI.
Materials and Methods
Animals
Behavioral and histopathological experiments were conducted using adult male C57BL/6J mice (22–26 g; Taconic) or adult male trkB.T1 astrocytic knock-out (KO) mice, generated by selectively breeding GFAP-cre-expressing mice (The Jackson Labs) with trkB.T1-FLPE mice, which have both trkB.T1 alleles targeted with loxP sites and express normal levels of trkB.T1 until cre recombinase is introduced. TrkB.T1-GFAP KO mice were genotyped by PCR using tail DNA obtained at the time of weaning [postnatal day (P) 21]. Astrocyte cultures were conducted using P0–P1 trkB.T1 homozygous null [trkB.T1−/− (T1 KO)] and WT (trkB.T1+/+) pups (breeding pairs were homozygous-null or WT for the trkB.T1 gene back-crossed on the C57BL/6J background to generation N20; Wu et al., 2013). All mice were housed on a 12:12 h light/dark cycle with food and water available ad libitum. Experiments were performed following the approval of the institutional animal care and use committee of the University of Maryland School of Medicine.
Astrocyte culture and analysis
Primary astrocyte cell cultures.
Astrocyte cultures were prepared from the cortices of P0–P1 mouse pups as described previously (Wu et al., 2010). Briefly, cortices were dissected in chilled HBSS, and dissociated and distributed in poly-d-lysine (PDL) precoated T75 flasks. Cells were grown in DMEM/F12 (Invitrogen, #11320033) media, supplemented with 10% fetal bovine serum (FBS; Invitrogen, #10082147) and 2% penicillin/streptomycin at 37°C with 5% CO2. Once cells had grown to confluence, the flasks were shaken at 200 rpm for several days to remove microglia and oligodendroglia.
Astrocyte migration/proliferation assay.
To reliably evaluate the proliferative and migratory capacities of cultured astrocytes, the xCELLigence Real-Time Cell Analysis system was used. Serum was removed from culture flasks 24 h before all xCELLigence testing. In preparation for the migration assay, astrocytes were harvested from culture flasks and resuspended at a density of 70,000 cells/100 μl in serum-free DMEM containing 2% penicillin/streptomycin, and seeded into the upper chamber of cell invasion/migration 16-well plates (CIM-16, Roche Diagnostics), which consisted of an upper and lower chamber, the latter of which contained either DMEM with 10% FBS or BDNF (Millipore; GF029; 50 ng/ml) as chemoattractants, or serum-free media as a control. Chambers were separated by a microporous 8 μm membrane with electrodes on its underside to detect cells that had migrated through in an impedance-based detection system. In preparation for proliferation assays, serum-starved astrocytes were resuspended at a density of 50,000 cells/100 μl in serum-free media and seeded into the wells of an E-View 16-well plate, consisting of a single-layer well with electrodes on its floor to detect cells that have adhered. Cell numbers for each assay were recorded every 5 min for ≤72 h.
Astrocyte scratch assay.
Astrocytes were plated onto PDL-coated coverslips and allowed to grow to confluence. A scratch was then made across the length of the coverslip (Chen et al., 2007; Jakovcevski et al., 2007), and washed in fresh media. Phase contrast images were obtained at 0, 18, 24, and 36 h postscratch, and the scratch widths evaluated using ImageJ analysis software (National Institutes of Health). For each coverslip, the T = 0 time point was used to represent 100% scratch width, and subsequent images calculated as an expression of percentage scratch width.
Astrocyte siRNA transfection.
TrkB-targeted siRNA silencer select S70856 (catalog #24390822) and negative control 2 (catalog #4390846) were purchased from Ambion. This siRNA is targeted to a portion of trkB in exon 8, and will therefore knock down the expression of all isoforms of trkB. Lipofectin (Life Technologies, #18292037) was used as the transfection reagent as per the manufacturer's instructions. Ten nanomole siRNA was used to transfect the cells on day 1 and day 3 after plating. The cells were harvested on day 5 after plating. Transfection with 10 nm scrambled siRNA was used as the negative control.
Astrocyte proliferation assay by immunocytochemistry.
Cultured astrocytes were replated on PDL-coated glass coverslips. Before proliferation testing, all cells were serum-deprived for 24 h. Media was then removed and replaced with either standard media containing 10% FBS, 50 ng/ml BDNF, or serum-free media as a control. Cells were then allowed to expand for 24 h, then immunolabeled for Ki67 (1:500; Leica Biosystems, #PA0230) or proliferating cell nuclear antigen (PCNA; 1:500; Abcam, #ab18197). Experiments were repeated three times each with n = 6 cultures per experiment and five images per culture were obtained for quantitative analysis.
RNA sequencing
Library construction.
Illumina RNAseq libraries were prepared with the mRNA-Seq Sample Prep Kit (Illumina, #RS-122-2101) following a variation of the manufacturer's protocol. The RNA was purified between enzymatic reactions and the size selection of the library was performed with AMPure XT beads (Beckman Coulter Genomics). For indexed samples, the PCR amplification step was performed with primers containing an index sequence 6 nt long.
Sequencing.
Libraries were sequenced using the 150 bp paired-end protocol on an Illumina HiSeq4000 Sequencer. Raw data from the Sequencer was processed using Illumina's Real-Time Analysis (RRID:SCR_014332) and Casava pipeline software (RRID:SCR_001802), which includes image analysis, base calling, sequence quality scoring, and index demultiplexing. Data were then processed through both FastQC (https://www.bioinformatics.babraham.ac.uk/projects/download.html; RRID:SCR_005539) and in-house pipelines for sequence assessment and quality control. These pipelines report numerous quality metrics and perform a megablast-based contamination screen. By default, our quality-control pipeline assesses basecall quality and truncates reads where the median Phred-like quality score falls below Q20.
Alignment.
The sequenced reads for the six samples (three replicates for WT Naive, 3 replicates for KO Naive) were used as input for TopHat v. 1.4 (RRID:SCR_013035) to align the reads to the Mus musculus reference genome (Ensembl Mus Musculus GRCm38, RRID:SCR_006553; Trapnell et al., 2009). The output from TopHat was obtained as Binary Alignment/Map (BAM) format files that consist of information on the alignment of each read within the reference genome. In the alignment phase, we allowed two mismatches per 25 bp segment. The BAM alignment files obtained from the TopHat alignment were analyzed to generate the alignment statistics for each sample, which included the total number of reads, the number of mapped reads, the percentage of total mapped reads, and the percentage of reads that mapped to exonic, intronic, and intergenic regions. The coverage analysis aided in determining whether there were any quality issues with any of the samples.
Differential expression.
The alignment files from TopHat were used for the differential expression analysis. The reference annotation for Mus musculus (Ensembl v. 84) in Gene Transfer Format was used for the gene models. The number of reads that mapped to each gene described in the annotation was calculated using the Python package HTSeq (Anders et al., 2015; RRID:SCR_005514). The raw read counts generated from HTSeq were fed into the DESeq R package (RRID:SCR_000154) to perform the differential expression analysis. The DESeq analysis resulted in the determination of potential differentially expressed genes between the KO Naive samples and the WT Naive samples. The differentially expressed genes were deemed significant if the false discovery rate (FDR) was <0.05, the gene expression was above a read count percentile of 10% and showed a ±2-fold change difference between the conditions (Trapnell et al., 2010, 2013).
Spinal cord contusion
Briefly, mice were first anesthetized via inhaled isoflurane. Then, a laminectomy was performed at T9 to remove the portion of vertebra overlying the spinal cord. The spinal column was stabilized using lateral clamps over the lateral processes at T8 and T10. A moderate contusion injury was produced using the Infinite Horizon (Precision Systems and Instrumentation) spinal cord impactor with a force of 60 kilodyne (Wu et al., 2013, 2014, 2016b). Sham animals received laminectomy without contusion. Bladders were manually expressed twice daily until a reflex bladder was established (7–14 d after SCI). All mice from both genotypes were randomly assigned to experimental groups and individuals involved in data analysis were blinded to group designations throughout all stages of the experiment, including animal care, behavior, tissue dissection, tissue sectioning, imaging, and data analysis.
Behavioral evaluations
Locomotor testing.
Basic measurements of locomotor function after SCI were evaluated using the Basso Mouse Scale (BMS; Basso et al., 2006). This standardized scale ranges from 0 to 9, with 0 being the equivalent of complete paralysis and loss of mobility, and 9 being full recovery of mobility and coordination. A minimum score of 4, or occasional plantar stepping, was required to evaluate each animal in additional measures for pain-like behaviors as well as more sensitive measures of motor and coordinative recovery. BMS scores were recorded at 1 d after injury and weekly thereafter for 6 weeks.
Nocifensive testing.
To evaluate pain-like behaviors in mice, animals capable of placing the plantar surface of the hindpaws on a flat surface were assessed at 5 weeks after SCI using von Frey filaments, to measure mechanical allodynia, and hot-plate testing, for thermal hyperalgesia. Von Frey testing took place as formerly described (Wu et al., 2013). Briefly, animals were first given 30 min to acclimate to the testing environment, which featured individual Plexiglas cubicles over a coated wire mesh platform. A series of von Frey filaments (Touch Test Sensory Evaluator Kit, Stoelting, #58011) with bending forces that ranged from 0.04 to 2.00 g were applied to the plantar surface of the hindpaw, beginning with the 0.04 g filament, until the fiber just bent, and held in place for 5 s or until a withdrawal response occurred. The smallest fiber to evoke ≥3 responses out of five repeated applications was recorded as the withdrawal threshold. If the 0.04 g filament evoked ≥3 responses, testing was moved down to the next smallest fiber until <3 responses were observed. A resting time of ≥1 h was given to animals before continuing with thermal threshold testing. Mice were first placed within a clear glass cylinder on the metal plate of the IITC incremental hot/cold plate apparatus (IITC Series 8, IITC Life Sciences). Over the course of 2 min, the plate gradually increased in temperature from 30 to 50°C. If a mouse was observed to hop from the plate surface or lick a back paw, the increment was stopped and the temperature recorded as the thermal pain threshold. Each subject completed two trials with a minimum intertrial interval of 1 h to rest between each testing session.
CatwalkXT automated gait analysis.
Gait analysis was performed using the CatwalkXT automated system (Noldus; RRID:SCR_004074), allowing for more sensitive measurements than the standard ink-and-paper method used previously (de Medinaceli et al., 1982). Each mouse underwent only one testing session at 8 weeks after SCI to maintain situational novelty and encourage exploration of the CatWalk. Data acquisition took place in a darkened room with the same researcher handling each subject. The CatWalk itself features a red overhead lamp and green illuminated walkway, which responds to the pressure of the animals' weights and obtains live footprint videos. Animals were first placed in the open end of the CatWalk under the red ceiling light and allowed to walk across the walkway to the darkened escape enclosure. A minimum of three valid runs, or complete walkway crossings, were obtained for each subject. Trials in which the animal stopped partway across or turned around during a run were excluded from analysis. The primary variables were stride length (the distance between steps of a single hindpaw) for general locomotor ability, print position (the distance between the hind and forepaw of one side during gait) for motor coordination, and regularity index (the percentage of step cycles that can be characterized as fitting a standard pattern of gait). Additionally, two measures of pain-like behaviors were recorded based on stepping qualities in the CatWalk, including maximum contact area of the hindpaw and maximum intensity at maximum contact. While several measurements are available to evaluate behaviors associated with neuropathic pain, a decrease in maximum intensity at maximum contact has been found to be reliably correlated with a decrease in mechanical allodynia threshold (Vrinten and Hamers, 2003), indicating that these may be reliable tools for evaluating spontaneous hyperalgesia in post-SCI mice.
Tissue processing and histopathology
At the endpoint of the study, mice were killed and transcardially perfused with a solution of 4% paraformaldehyde (PFA). Tissue was postfixed in additional PFA for 2 h, followed by cryoprotection in a sucrose gradient, embedded in optimal cutting temperature compound and frozen, then coronally sectioned at 20 μm and placed serially on statically charged microscope slides in sets of 10 for 10 sets of slides. A representative slide from each set was then stained for myelin using Luxol fast blue (LFB) to determine the location of the lesion epicenter, defined as the section with the least amount of spared white matter (WM). Residual WM was also calculated for areas rostral and caudal to the lesion epicenter (Wu et al., 2013). Images were captured at 2.5× magnification and analyzed using National Institutes of Health ImageJ software (RRID:SCR_003070). The threshold level of each 8 bit image was set to mark only LFB-positive tissue, and total LFB-positive area was calculated for each section.
Immunohistochemistry, image acquisition, and quantification
Once identification of the lesion epicenter was complete, representative slides were selected for immunofluorescent staining. Tissue from the lesion site as well as lumbar area were labeled for trkB.T1-expressing cells (1:200; Santa Cruz Biosciences, sc-119; RRID:AB_632559), and double-labeled separately with GFAP (1:500; Millipore, MAB3402; RRID:AB_94844), NeuN (1:500; Millipore, MAB377; RRID:AB_2298772), and mouse anti-CD11b (1:500; Serotec, MCA74GA; RRID:AB_324660). Proliferation in vivo was also evaluated with double-labeling for Ki67 (1:500, Leica, PA0230; RRID:AB_2341199) and PCNA (1:500; Cell Signaling Technology, 2586S; RRID:AB_1065749), and with double-labeling for Ki67 and GFAP. Briefly, slides were first washed gently in PBS, dried, and placed in a vacuum chamber for 20 min to promote adhesion. Tissue was then blocked in 5% normal goat serum for 1 h, and incubated overnight at 4°C in primary antibodies. The next day, slides were washed and incubated for 2 h in fluorescent secondaries (Alexa fluor), and washed again. Then DAPI nuclear stain (Sigma-Aldrich; RRID:AB_2307445) was added for 30 min before a final wash, followed by coverslipping in nonfluorescing mounting medium (National Diagnostics, HS-106).
For quantitative image analysis, images were acquired using a fluorescent Nikon Ti-E inverted microscope, at 20× (CFI Plan APO VC 20×; numerical aperture, 0.75; working distance, 1 mm) magnification and quantified using NIS-Elements AR software (Nikon; RRID:SCR_014329). Exposure times were kept constant for all sections in each experiment. Background for all images was subtracted using Elements. All images were quantified using Elements: nuclei were identified using Spot Detection algorithm based on DAPI staining; cells positive for any of the immunofluorescence markers were identified using Detect Regional Maxima or Detect Peaks algorithms, followed by global thresholding. The number of positive cells was normalized to the total area imaged. All images were acquired 2–3 mm rostral to the epicenter or lumbar enlargement (L4–L5), with n = 2–4 images per location from four to five sections per mouse. For each experiment, data from all images from one region in each mouse were summed up and used for final statistical analysis. At least 1000–2000 cells were quantified per mouse per area per experiment (Liu et al., 2015; Wu et al., 2016b). The images were processed using Adobe Photoshop 7.0 software (Adobe Systems; RRID:SCR_014199).
Statistical analysis
All statistical analyses except RNA sequencing were conducted by using the GraphPad Prism Program, Version 3.02 for Windows (GraphPad Software; RRID:SCR_002798) or SigmaPlot, version 12 (Systat Software; RRID:SCR_003210). Time course analyses of astrocyte migration and proliferation as well as BMS scores were analyzed using two-way ANOVA with repeated measures followed by Student's Newman–Keuls or Bonferroni's post hoc test. For multiple comparisons, one-way ANOVA was performed followed by Student's Newman–Keuls post hoc test for parametric (normality and equal variance passed) data. Kruskal–Wallis ANOVA based on ranks followed by Dunn's post hoc test was used for nonparametric (normality and/or equal variance failed) data. For experiments with only two groups, a two-tailed Mann–Whitney rank sum test (nonparametric) was performed. An α level of p < 0.05 was used to indicate statistical significance for all tests performed, and data as shown represent the mean ± SEM. Differential gene expression analysis of RNA sequencing data was performed using the DESeq R software package (Bioconductor; RRID:SCR_006442). To correct for inflated error due to multiple testing, FDR p values of <0.05 were considered statistically significant. Genes that were statistically significantly differentially regulated and met the criteria of ≥2-fold change in trkB.T1 KO astrocytes versus WT astrocytes were subjected to downstream analysis. Pathway analysis was conducted using commercially available software (Ingenuity Pathway Analysis; RRID:SCR_008653) and using on-line, open-source packages [GO::TermFinder; RRID:SCR_008870; (Boyle et al., 2004); and Database for Annotation, Visualization and Intgrated Discovery (DAVID) v6.8; https://david-d.ncifcrf.gov]. Visualization of GO::TermFinder results was conducted using Revigo (Supek et al., 2011; RRID:SCR_005825).
Results
TrkB.T1 expression is elevated at different times in astrocytes, neurons, and microglia/macrophages after SCI
Immunofluorescence assessment of trkB.T1 at lesion site from mice at 7 d postinjury revealed significant increases (p < 0.05 [dorsal horn (DH), ventral horn (VH)], p < 0.001 [WM] vs Sham with one-way ANOVA with Student's Newman–Keuls post hoc analysis) in all regions of interest when compared with that of sham controls (Fig. 1A). Increased trkB.T1+ cells were chronically located in the WM area at 8 weeks postinjury. This upregulation was most substantial in areas more proximal to the lesion site, such as the DH and dorsal WM. Quantitative image analysis was performed independently in five anatomical regions: DH, VH, dorsal WM, lateral WM, and ventral medial WM (Fig. 1B). Next, we determined the cell-type specificity for trkB.T1 accumulation in the injured spinal cord using different cell-type markers. We observed significant colocalization of the trkB.T1 signal with the astrocyte marker GFAP in the WM area at day 7 following injury (twofold increase compared with sham control; Fig. 1C,D; p < 0.01 vs Sham). This increase sustained up to 8 weeks postinjury (p < 0.001 vs Sham). These data suggest that SCI causes persistent expression of trkB.T1 by astrocytes. We also observed a robust increase in colocalization of the trkB.T1 signal with the neuronal marker NeuN, reaching 2.5–3.0-fold in both DH and VH at 7 d after injury [Fig. 1E,F; p < 0.01 (DH), p < 0.001 (VH) vs Sham]. TrkB.T1+/NeuN+ cells were then decreased at week 8 following injury. In addition, at day 7 significantly higher numbers of trkB.T1 were accumulated in CD11b+ microglia/macrophages mainly at the lesion core (Fig. 1G,H; p < 0.01 vs Sham). TrkB.T1+/Cd11b+ cells were reduced at 8 weeks postinjury, suggesting that accumulation of trkB.T1 in microglia/macrophages was transient after SCI.
Figure 1.
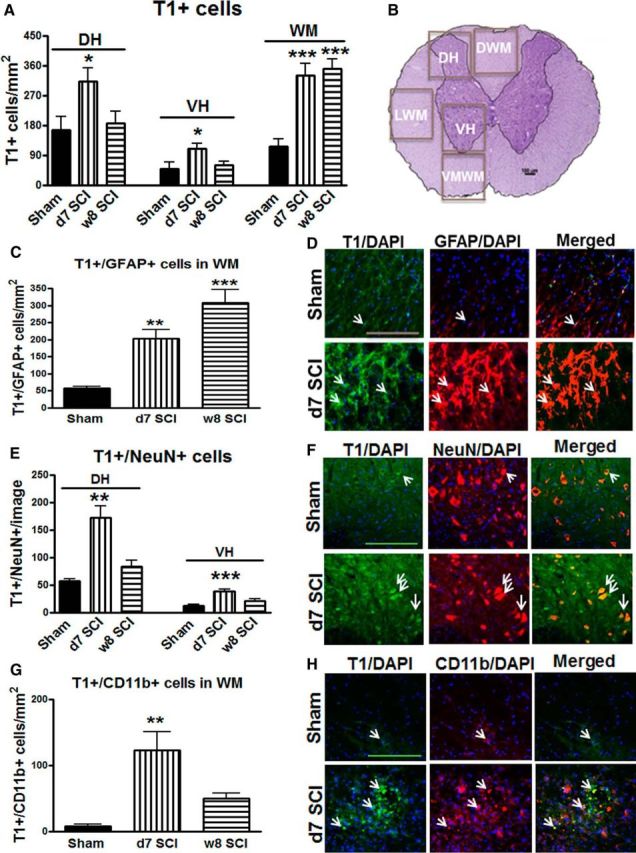
TrkB.T1 is upregulated at different times in astrocytes, neurons, and microglia/macrophages after SCI. A, Total number of T1-positive cells per mm2 tissue was elevated in all regions of the DH, VH, and WM at 7 d after SCI. Cells with increased trkB.T1+ expression were only located in the WM area at 8 weeks after injury. B, Regions of interest for histological analysis included the DHs, the VHs, and the dorsal, lateral, and ventromedial WM. C–D, Double-labeling for trkB.T1 and GFAP revealed a dramatic and persistent increase in the number of astrocytes expressing trkB.T1 after SCI. E, F, Double-labeling for trkB.T1 and NeuN indicated an increase in the number of mature neurons expressing trkB.T1 at 7 d after injury. G, H, CD11b-positive cells also expressing trkB.T1 indicate upregulation of microglia/macrophages, particularly in the dorsal WM. Scale bar, 50 μm. Arrows (in D, F, H) indicate double-positive cells. N = 6 mice/group. *p < 0.05, *p < 0.01, ***p < 0.001 versus Sham (1-way ANOVA with Newman–Keuls post hoc corrections).
TrkB.T1 gene deletion in astrocytes results in downregulation of inflammatory and cellular migration and of proliferation genes and pathways
To examine why reactive astrogliosis and the glial scar are decreased in trkB.T1 KO mice, and to examine the functional role for trkB.T1 expression in astrocytes, we conducted high-throughput, next-generation RNA sequencing (Figs. 2, 3; Table 1 at https://www.nursing.umaryland.edu/directory/susan-dorsey/). Cultured astrocytes from P0–P1 trkB.T1 WT and trkB.T1 KO mice were harvested in Trizol (n = 3 independent biological replicates per genotype) and their RNA was extracted. The quality and quantity of RNA was examined via the RNA 6000 nanochip. Only those samples with an RNA integrity number >8 were used. We sequenced the samples on the Illumina HiSeq instrument. We obtained 150 bp paired end reads, and aligned those reads to the latest Ensembl mouse genome build. The average number of reads for each genotype exceeded 650 million and, of those, >73% were mapped to the reference genome. Aligned files were analyzed using the R package DESeq and we identify 1777 differentially regulated genes that met our FDR-corrected p value (<0.05) and fold change (±2.0) criteria in trkB.T1 KO astrocytes compared with WT astrocytes. First, we conducted unbiased pathway analysis (Ingenuity Pathway Analysis) and discovered that top diseases and biofunctions related to inflammation, cellular migration, and proliferation were all predicted to be significantly inhibited in our differentially expressed gene dataset (Table 1 at https://www.nursing.umaryland.edu/directory/susan-dorsey/), and that many of the genes within these areas were significantly downregulated in the trkB.T1 KO astrocytes when compared with WT controls (Fig. 2). Similar results were obtained when the upstream regulator analysis was run, with both migration and proliferation pathways predicted to be significantly downregulated or inhibited. We next used gene ontology analysis using two different open source workflows (GO::TermFinder, DAVID) and obtained similar results—inflammation, migration, and proliferation pathways were significantly enriched in the differentially expressed gene set from trkB.T1 KO astrocytes compared with WT controls (Fig. 3).
Figure 2.
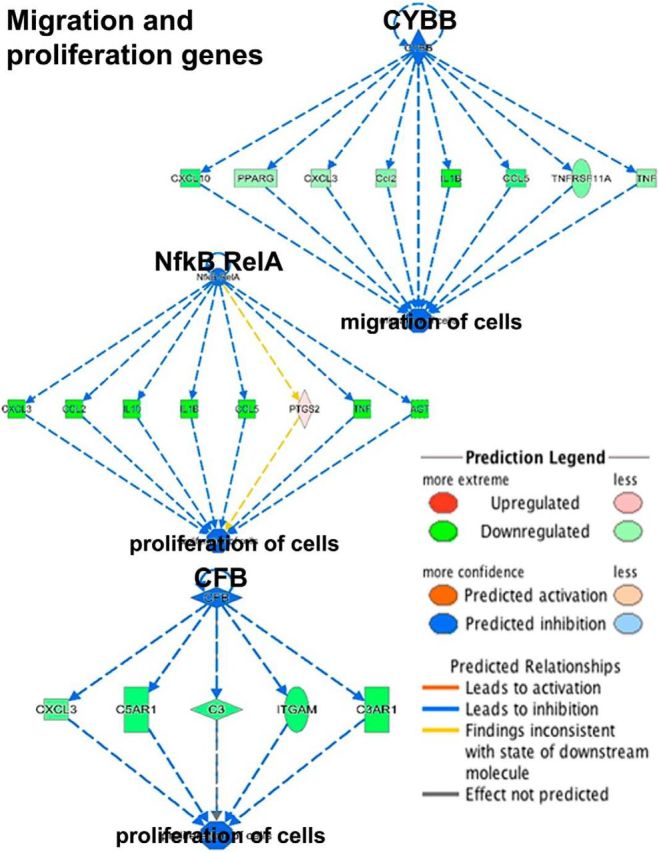
Canonical pathway and upstream regulator effects analysis identifies inflammatory response, migration, and proliferation pathways enriched in trkB.T1 KO astrocytes. To examine which upstream regulators and pathways were statistically significantly enriched in our dataset, we used Ingenuity Pathway Analysis (Qiagen) and GO::TermFinder. Upstream regulator analysis demonstrated that our set of differentially regulated genes was predicted to inhibit cellular migration, proliferation pathways, and inflammatory response genes (not depicted in figure due to number of differentially regulated genes; gene list can be found in Table 1 at https://www.nursing.umaryland.edu/directory/susan-dorsey/). Per the prediction legend, blue is predicted inhibition; orange is predicted activation. Genes colored in green are significantly downregulated in trkB.T1 KO astrocytes compared with WT astrocytes. Red indicates upregulation of the particular gene. The yellow line indicates that the findings from the RNAseq experiment are inconsistent with the state of the downstream outcome from the upstream regulator (e.g., proliferation, migration). The darker the color, the greater the degree of dysregulation.
Figure 3.
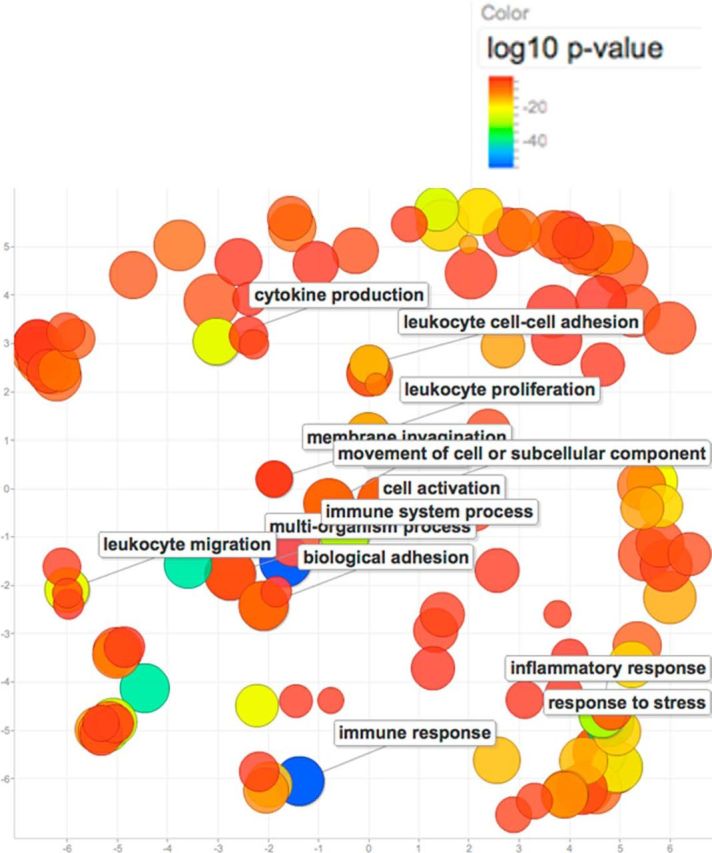
GO::TermFinder (Boyle et al., 2004) was used to identify significant GO terms enriched in the list of differentially expressed genes in trkB.T1 KO astrocytes. This list was submitted to the Reduce + Visualize Gene Ontology (REVIGO; Supek et al., 2011) analysis tool and GO terms were visualized in a semantic similarity-based scatterplot. Per the legend, the colors do not reflect pathway direction but rather the degree of statistical significance. For example, red circles indicate regulated pathways that are different to a highly significant degree; green and blue also indicate significant difference, but to a lesser degree. The color intensity represents the negative log10 p value for each of the statistically enriched pathways shown on the scatterplot. These results are consistent with the upstream regulator analysis in Figure 2.
Truncated trkB.T1, but not full-length, regulates astrocyte migration in vitro
To explore the role and function of trkB.T1 in cell signaling, and to confirm the RNA sequencing results, we cultured astrocytes with and without trkB.T1. To quantify the migratory capacity of the astrocytes deprived from trkB.T1 KO and WT mice, the xCELLigence real-time cell analysis system was used. This system measures the electrical impedance of cells as they move through a membrane, providing real-time migration data. Cell indexes collected every 6 h indicated that in absence of serum, KO astrocytes showed significantly lower migration beginning 48 h after seeding compared with WT cells (Fig. 4A). The factors Post-No FBS Hours (F(1,60) = 63.31; p < 0.0001) and Genotypes (F(11,6) = 4.21; p < 0.0001) were found to be significant. Ten percent FBS stimulated robust cell migration in both genotypes. Remarkably, WT cells demonstrated a greater rate of migration (Fig. 4B), showing ∼2-fold faster migration than the trkB.T1 KO astrocytes. After 60–66 h postseeding, the rate of migration from both genotypes reached to the same plateau. The factors Post-FBS Hours (F(1,204) = 71.41; p < 0.0001) and Genotypes (F(11,204) = 156.48; p < 0.0001) were found to be significant. The interaction of Post-FBS Hours × Genotypes (F(11,204) = 3.23; p = 0.0004; repeated-measures two-way ANOVA) was significant. Furthermore, BDNF (50 ng/ml), a trkB ligand, increased WT cell migration up to onefold at 66 h after seeding, but only slightly elevated trkB.T1 KO cell migratory capacity. WT cells demonstrated a fourfold greater rate of migration than that of trkB.T1 KO astrocytes at 66 h postseeding (Fig. 4C). The factors of Post-BDNF Hours (F(1,168) = 778.45; p < 0.0001) and Genotypes (F(11,168) = 55.55; p < 0.0001) were found to be significant. The interaction of Post-BDNF Hours × Genotypes (F(11,168) = 29.09; p < 0.0001; repeated-measures two-way ANOVA) was significant. Furthermore, a scratch migration assay was performed to measure the ability of cells to migrate into an in vitro wound site. After 18 h cultivation with DMEM/F12/10% FBS, trkB.T1+/+ astrocytes migrated significantly more into the void area than trkB.T1−/− astrocytes [p < 0.001 vs KO 18 h with analysis of two-tailed Mann–Whitney rank sum test (nonparametric); Fig. 5A]. By 36 h after the initial scratch, trkB.T1+/+ cells completely close the scratch area whereas trkB.T1−/− cells have only filled in 50% of the area (Fig. 5B). These findings suggest a potential impact of trkB.T1 on scar formation following an in vitro model of injury.
Figure 4.
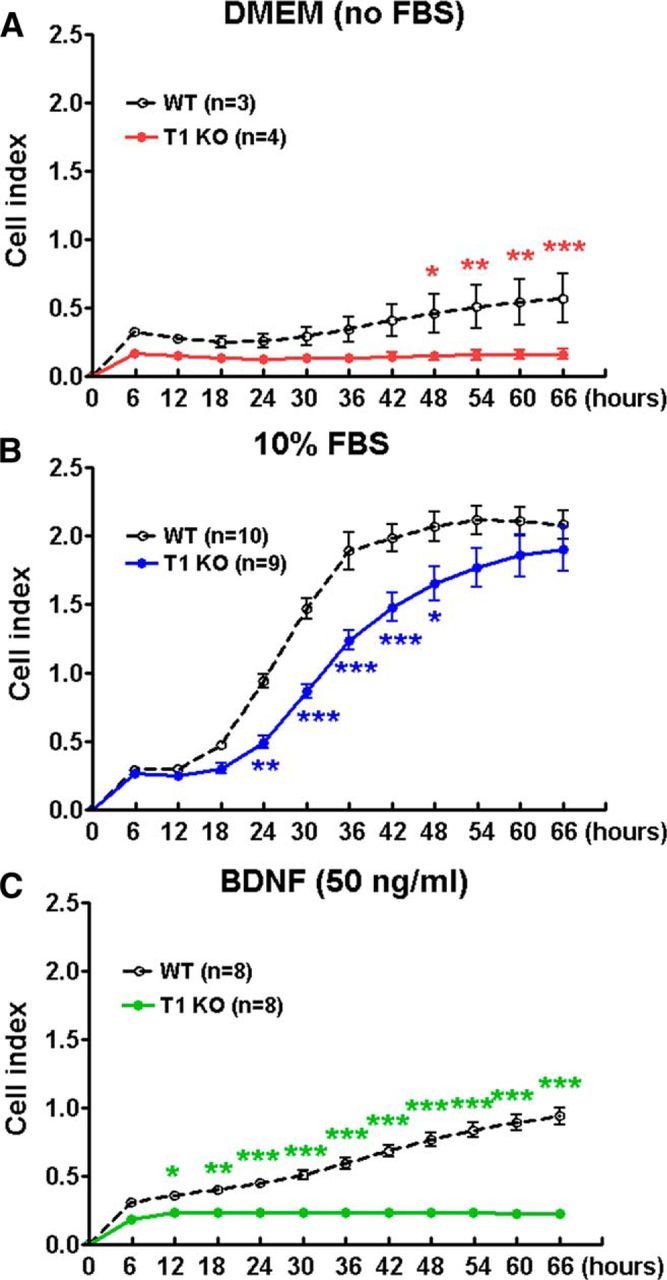
Migration of astrocytes toward a chemoattractant is decreased in cells derived from trkB.T1 KO mice compared with WT as revealed by xCelligence real-time cell analysis. A, Baseline migration in serum-starved astrocytes was negligible in trkB.T1 KO cells and remained negligible over time. In WT cells, migration in serum-starved astrocytes was somewhat faster and slowly increased over time. N = 3–4 wells/group from two independent experiments. B, Astrocyte migration toward 10% FBS was more rapid in WT cells than in trkB.T1 KO cells. N = 10 wells/group from three independent cultures. C, BDNF (50 ng/ml) stimulated migration in WT astrocytes, but not in KO astrocytes. N = 8 wells/group from three independent cultures. *p < 0.05, **p < 0.01, and ***p < 0.001 versus WT (repeated measurements of 2-way ANOVA with Student's Newman–Keuls post hoc analysis).
Figure 5.
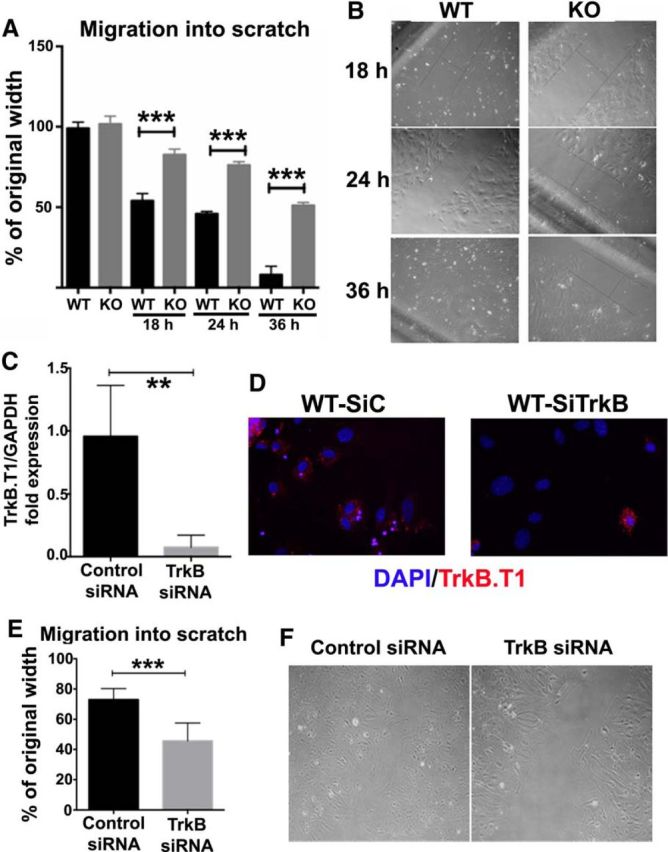
Migration into in vitro scratch wounds is impeded in astrocytes derived from trkB.T1 KO mice when compared with WT astrocytes. A, A standard scratch assay was used to examine the astrocyte's migrative capacity at 18, 24, and 36 h after injury. Compared with KO astrocytes, WT astrocytes traveled significantly farther and faster into the scratch area. N = 4 separate experiments. ***p < 0.001 versus WT [analysis with 2-tailed Mann–Whitney rank sum test (nonparametric)]. B, Representative images of WT and KO astrocyte migration into scratch areas at 18, 24, and 36 h after scratch. C–F, Acute gene deletion of trkB.T1 via transfection of astrocytes with trkB siRNA significantly reduces cellular migration into scratch wound. WT astrocytes were transfected with 10 nm of either scrambled (SiC) or targeted (SiTrkB) siRNA on 1 d postplating. Cells were harvested at day 5 postplating and mRNA isolated and cDNA prepared for real-time PCR. Real-time PCR was performed using primers against trkB.T1 (C). Immunofluorescent images showed successful transfection of cells (D). A scratch assay for migration was performed after knockdown of trkB.T1. Knockdown of trkB significantly reduced the migratory rate of astrocytes (E). Representative images of in vitro scratch assay for siRNA transfected astrocytes (F). N = 4 separate experiments. **p < 0.01, ***p < 0.001 versus Control [analysis with 2-tailed Mann–Whitney rank sum test (nonparametric)].
As the astrocytes derived from trkB.T1 constitutive KO mice may have potential developmental deficits and compensatory modulation of other/redundant pathways, we next performed acute gene deletion/reduction in astrocytes by using siRNA specific to trkB on exon 8. One day after transfection of trkB.T1+/+ astrocytes with siRNA resulted in a 40–60% decrease in trkB.T1 mRNA [p < 0.01 vs Control by analysis with two-tailed Mann–Whitney rank sum test (nonparametric); Fig. 5C]. Knockdown was further confirmed at a protein level by immunocytochemistry (Fig. 5D). Like the the genetic knock-out, siRNA knock-down of trkB.T1 also revealed a reduction in astrocyte migration into the scratch injury (p < 0.001 vs Control; Fig. 5E). The control siRNA cells migrated to fill in 60% of the scratch area, whereas the trkB siRNA transfected cells only migrate into 25% of the available space in the same time (Fig. 5F). Thus, astrocytes lacking or knocking down trkB.T1 demonstrate diminished migratory capability compared with trkB.T1+/+ cells.
Loss of trkB.T1 in astrocytes reduces cellular proliferation
Proliferation is also a hallmark of astrocytes that respond to a lesion in vivo and our RNA sequencing results demonstrated downregulation of proliferative pathways in astrocytes lacking trkB.T1. We, therefore, compared the proliferative activity of astrocytes between two genotypes in vitro in the presence or the absence of FBS or BDNF using the xCELLigence real-time cell analysis system. Proliferation in serum-starved astrocytes remained low in both genotypes, yet was significantly higher in WT cells than that in KO by 36 h postseeding (Fig. 6A). The factors of Post-No FBS Hours (F(1,42) = 36.45; p < 0.0001) and Genotypes (F(6,42) = 49.11; p < 0.0001) were found to be significant (repeated-measures two-way ANOVA). Ten percent FBS stimulated robust cell proliferation in both genotypes. Remarkably, the trkB.T1−/− cells proliferated at a significantly slower rate than trkB.T1+/+ cells beginning 48 h and up to 72 h postseeding (Fig. 6B). The factors of Post-FBS Hours (F(1,90) = 61.30; p < 0.0001) and Genotypes (F(8,90) = 298.96; p < 0.0001) were found to be significant. The interaction of Post-FBS Hours × Genotypes (F(9,90) = 10.05; p < 0.0001; repeated-measures two-way ANOVA) was significant. This difference was observed to continue in response to exogenous BDNF as early as 12 h postseeding (Fig. 6C). The factors of Post-BDNF Hours (F(1,70) = 635.37; p < 0.0001) and Genotypes (F(6,70) = 251.51; p < 0.0001) were found to be significant. The interaction of Post-BDNF Hours × Genotypes (F(6,70) = 21.63; p < 0.0001; repeated-measures two-way ANOVA) was significant. To confirm these findings, we then examined specific cell markers indicative of new cell growth through Ki67 and PCNA immunolabeling. Total cell counts from cultured astrocytes indicated that trkB.T1 KO cells show a slowed rate of proliferation in response to 10% FBS than that of WT astrocytes [two-way ANOVA analysis, Post-FBS: F(1,20) = 37.351 (Ki67) and 22.823 (PCNA); p < 0.001; Genotypes: F(1,20) = 5.445 (Ki67) and 5.851 (PCNA); p = 0.030 (Ki67) and 0.025 (PCNA); the interaction of Post-FBS × Genotypes: F(1,20) = 31.752 (Ki67) and 4.598 (PCNA); p = 0.007 (Ki67) and 0.044 (PCNA)], and that the addition of BDNF stimulates growth in WT, but not KO, astrocytes [Post-BDNF: F(1,20) = 37.351 (Ki67) and 6.406 (PCNA); p < 0.001 (Ki67) and p = 0.020 (PCNA); Genotypes: F(1,20) = 18.132 (Ki67) and 20.379 (PCNA); p < 0.001; the interaction of Post-BDNF × Genotypes: F(1,20) = 7.554 (Ki67) and 0.660 (PCNA); p = 0.012 (Ki67) and 0.426 (PCNA); Fig. 7]. Student's Newman–Keuls post hoc analysis showed significantly decreased proliferation in KO/FBS (p < 0.01 vs WT/FBS) and KO/BDNF (p < 0.001 vs WT/BDNF). Therefore, based on the current findings, genetic deletion of trkB.T1 successfully inhibited the proliferation of astrocytes in vitro.
Figure 6.
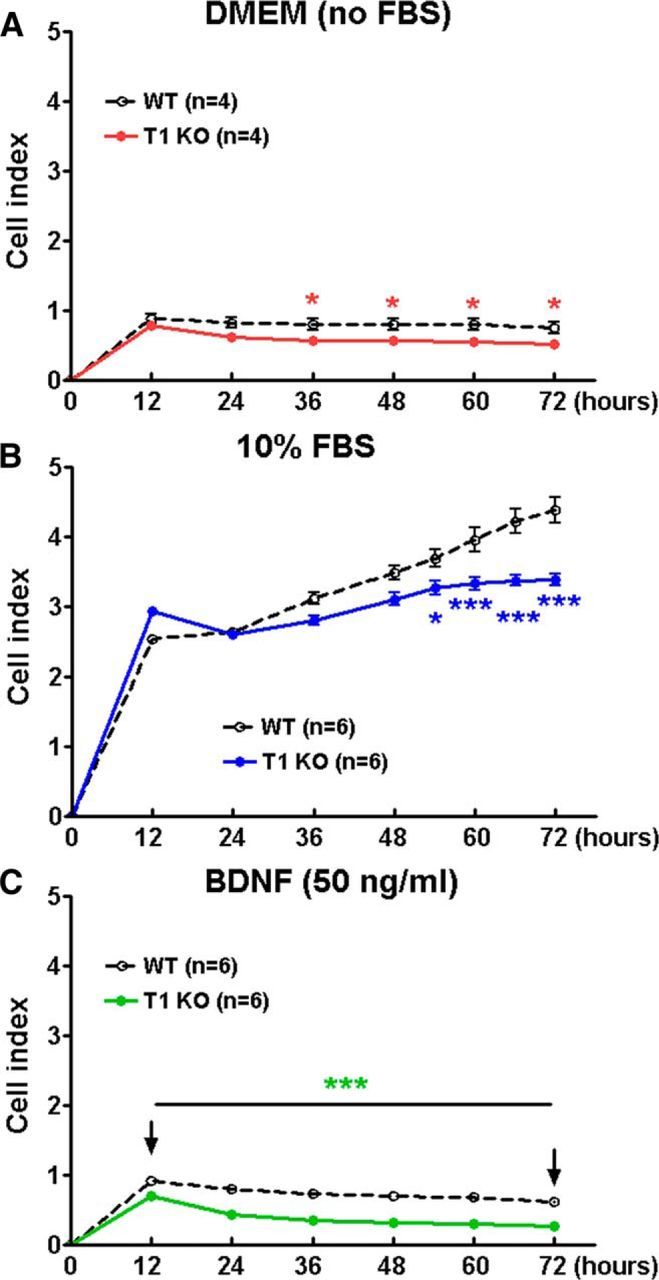
Proliferation of astrocytes derived from trkB.T1 KO mice was slower than that of WT mice, as identified by the xCelligence real-time cell analysis system. A, Baseline proliferation in serum-starved astrocytes was slower in trkB.T1 KO cells than in WT cells. N = 4 wells/group from two independent experiments. B, Astrocyte proliferation in response to 10% FBS was more rapid in WT cells than in trkB.T1 KO cells. N = 6 wells/group from three independent cultures. C, Proliferation in response to BDNF (50 ng/ml) was higher in WT astrocytes, than in KO astrocytes at as early as 12 h. N = 6 wells/group from three independent cultures. *p < 0.05, ***p < 0.001 versus WT (repeated measurements of two-way ANOVA with Student's Newman–Keuls post hoc analysis).
Figure 7.

Astrocytes derived from trkB.T1 KO mice demonstrate reduced proliferation in response to FBS, and are not stimulated to expand following exogenous BDNF application. A, B, Cell counts of immunolabeled astrocytes in response to 10% FBS (24 h) show slower proliferation in KO cells compared with WT cells. C, D, BDNF (50 ng/ml, 24 h) stimulates dividing of astrocytes derived from trkB.T1 WT mice, but not KO mice. N = 6 wells/group from three independent cultures. ***p < 0.001 versus WT/control; $p < 0.05 versus KO/control; ##p < 0.01, ###p < 0.001 versus WT/FBS (2-way ANOVA with Student's Newman–Keuls post hoc analysis).
Astrocytic deletion of trkB.T1 reduces SCI-induced astrocyte proliferation in vivo
To explore whether the reduced proliferation of cultured astrocytes derived from trkB.T1 KO mice would also translate to the in vivo condition, trkB.T1-GFAP KO mice were used. We performed immunohistochemical costaining using antibodies against trkB.T1 and astrocyte marker GFAP (Fig. 8A). Expression of trkB.T1 was presented in both GFAP+ (asterisks) and GFAP− cells (arrowheads) in WT mice at 8 weeks post-SCI. We confirmed that GFAP+ astrocytes were trkB.T1-negative (arrows) in the trkB.T1-GFAP KO mice where we also detected trkB.T1 on GFAP-negative cells (arrowheads). The histopathological markers indicative of new cell growth were examined in spinal cord tissues at 8 weeks after SCI. Cells positive for Ki67 were found to be dramatically upregulated in both WM and GM, but significantly higher in WT animals than in TrkB.T1-GFAP KO mice [Fig. 8B,C; p < 0.001 vs Sham/WT (two-way ANOVA with Student's Newman–Keuls post hoc analysis); After Injury: F(1,20) = 46.142 [thoracic GM (TGM)] and 84.858 [thoracic WM (TWM)]; p < 0.001; Genotypes: F(1,20) = 4.768 [TGM] and 8.290 [TWM]; p = 0.041 [TGM] and 0.009 [TWM]; the interaction of Postinjury × Genotypes: F(1,20) = 4.256 [TGM] and 8.373 [TWM]; p = 0.052 [TGM] and 0.009 [TWM]), including in the lumbar spinal DH (LSDH, p < 0.01 vs SCI/WT; Postinjury: F(1,20) = 19.515; p < 0.001; Genotypes: F(1,20) = 6.499; p = 0.019; the interaction of Postinjury × Genotypes: F(1,20) = 5.252; p = 0.033), with similar patterns occurring in PCNA-positive cells [Fig. 8D,E; Postinjury: F(1,20) = 16.967 (TGM), 79.466 (TWM), and 26.826 (LSDH); p < 0.001; Genotypes: F(1,20) = 3.073 (TGM), 6.677 (TWM), and 5.751 (LSDH); p = 0.095 (TGM), 0.018 (TWM), and 0.026 (LSDH); the interaction of Postinjury × Genotypes: F(1,20) = 3.897 (TGM), 8.200 (TWM), and 4.240 (LSDH); p = 0.062 (TGM), 0.010 (TWM), and 0.053 (LSDH)]. Double-labeling for Ki67 and GFAP suggests that the majority of proliferating cells at 8 weeks after SCI are astrocytes, which is reduced in trkB.T1-GFAP KO animals [Fig. 8F,G; p < 0.001 vs Sham/WT; p < 0.05 (TGM, TWM), p < 0.01 (LSDH) vs SCI/WT with two-way ANOVA with Student's Newman–Keuls post hoc analysis; Postinjury: F(1,16) = 33.240 (TGM), 18.746 (TWM), and 35.817 (LSDH); p < 0.001; Genotypes: F(1,16) = 2.279 (TGM), 1.780 (TWM), and 4.160 (LSDH); p = 0.151 (TGM), 0.201 (TWM), and 0.058 (LSDH); the interaction of Postinjury × Genotypes: F(1,16) = 2.710 (TGM), 2.210 (TWM), and 3.236 (LSDH); p = 0.119 (TGM), 0.157 (TWM), and 0.091 (LSDH)]. In addition, total GFAP+ astrocytes were significantly reduced in trkB.T1-GFAP KO animals vs WT mice (Fig. 8H,I), including thoracic injury area as well as LSDH [p < 0.001 vs Sham/WT; p < 0.05 (TWM, LSDH), p < 0.001 (TGM) vs SCI/WT with two-way ANOVA with Student's Newman–Keuls post hoc analysis; Postinjury: F(1,16) = 79.959 (TGM), 20.063 (TWM), and 16.102 (LSDH); p < 0.001; Genotypes: F(1,16) = 6.809 (TGM), 1.342 (TWM), and 4.608 (LSDH); p = 0.019 (TGM), 0.264 (TWM), and 0.047 (LSDH); the interaction of Postinjury × Genotypes: F(1,16) = 6.897 (TGM), 2.510 (TWM), and 1.842 (LSDH); p = 0.018 (TGM), 0.133 (TWM), and 0.194 (LSDH)]. Together, these data suggested that loss of trkB.T1 in astrocytes results in reduced proliferation of astrocytes after SCI.
Figure 8.
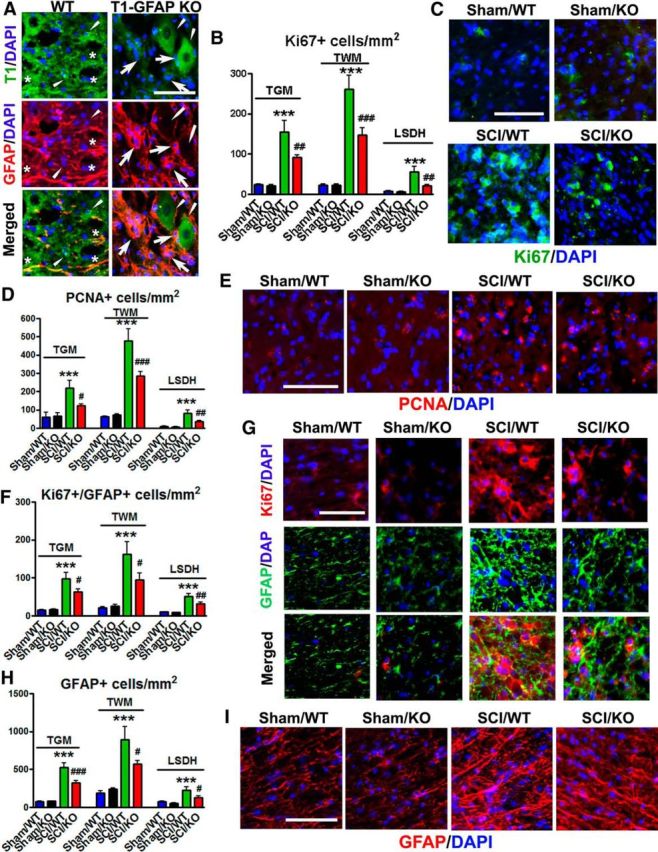
In vivo in the spinal cords of trkB.T1 WT mice, there is elevated proliferation of astrocytes at 8 weeks after injury, which is decreased in astrocyte-specific GFAP-cre trkB.T1 KO mice. A, Representative images showed that TrkB.T1 (green) was present in both GFAP+ (red, asterisks) and GFAP− cells (arrowheads) in WT mice. GFAP+ astrocytes were trkB.T1− (arrows) in the TrkB.T1-GFAP KO mice where we also detected trkB.T1 on GFAP− cells (arrowheads). B–E, Proliferation of new cells (Ki67, PCNA) was found to be significantly upregulated in both GM (TGM) and WM (TWM) at thoracic injured area, as well as in the LSDH. F–G, Double-labeling for Ki67 and GFAP indicate that a significant amount of new cell growth consisted of astrocytes, which showed an identical pattern to the presence of astrocytes. H, I, Total GFAP+ astrocytes were significantly reduced in these regions. N = 5 (Sham/WT), 3 (Sham/KO), 6 (SCI/WT), and 6 (SCI/KO). ***p < 0.01 versus Sham/WT; #p < 0.05, ##p < 0.01, ###p < 0.001 versus Sham/KO (2-way ANOVA with Student's Newman–Keuls post hoc analysis). Scale bar, 50 μm.
Elimination of trkB.T1 in astrocytes facilitates functional recovery after SCI
We have previously shown (Wu et al., 2013) that global deletion of trkB.T1 in mice significantly reduced post-SCI locomotor dysfunction and mechanical hyperesthesia. To address whether changes in trkB.T1 regulation specifically in astrocytes after SCI are associated with nocifensive responses or locomotor recovery, trkB.T1-GFAP KO mice and their wild-type littermates were subjected to moderate SCI. Hindlimb locomotor function was assessed using the BMS. No significant differences were observed between two genotypes in gross motor function in the BMS (Fig. 9A), correlated with spared WM area (data not shown). The factor of Postinjury Days (F(6,119) = 17.76; p < 0.0001) in BMS test was found to be significant. However, the factor of Genotypes (F(1,119) = 0.88; p = 0.3507) as well as the interaction of Postinjury Days × Genotypes (F(6,119) = 0.42; p = 0.8633; repeated-measures two-way ANOVA) were not significant. To detect potential differences in hindlimb functional recovery beyond that recognized by BMS scores, we also used more refined terminal quantitative gait analysis by CatWalk for motor coordination. By using the CatWalk and its capabilities for more sensitive motor characteristics, we were able to detect significant differences in general motor function, as well as coordination. Stride length, which is calculated as the total distance between steps of the same paw and approached 6 cm in healthy animals, was significantly reduced in all injured mice compared with Sham animals (p < 0.01, two-way ANOVA with Student's Newman–Keuls post hoc analysis). No significant differences were observed between two genotypes before or after SCI (Fig. 9B). The factor of Postinjury (F(1,18) = 18.32; p < 0.001) was found to be significant. However, the factor of Genotypes (F(1,18) = 0.91; p = 0.353) as well as the interaction of Postinjury × Genotypes (F(1,18) = 0.051; p = 0.824; two-way ANOVA) were not significant. Print position was dramatically increased in injured WT mice (p < 0.001, two-way ANOVA with Student's Newman–Keuls post hoc analysis). Print position is defined as the distance between the hindpaw and forepaw of the same side, where uninjured mice are able to place their hindpaws in approximately the same location as the forepaw that has just been lifted from the walkway, resulting in a print position score typically approaching 0–1 cm. Remarkably, SCI/KO mice approached normal levels of print placement compared with SCI/WT animals (Fig. 9C; p < 0.001). The factors of Postinjury (F(1,18) = 26.98; p < 0.001), Genotypes (F(1,18) = 16.53; p < 0.001), and the interaction of Postinjury × Genotypes (F(1,18) = 9.96; p = 0.005; two-way ANOVA) were found to be significant. Also apparent in these representative images is magnitude of impression for individual steps and the number of steps taken, though these parameters were found to be functionally synonymous with the maximum contact area and print position variables, respectively. To evaluate motor coordination, regularity index, a parameter under the category of step sequencing, was selected. This tracks the order of paw placements in a step cycle where a single step cycle is defined as each of the four paws being placed on the walking surface in sequence, and attributes each set of steps into either a normal stepping pattern or abnormal gait. The result is a percentage of normal stepping that ideally reaches 100% in healthy animals (Hamers et al., 2001), though in practice, naive mice typically approach 80–90%. In response to SCI, the regularity index in WT, which was reduced by nearly half compared with Sham animals, strikingly appeared to be significantly restored in KO mice, approaching 70% normal stepping (Fig. 9D). Two-way ANOVA analysis showed significant effects of Postinjury (F(1,16) = 43.47; p < 0.001) and Genotypes (F(1,16) = 9.21; p = 0.008), and Student's Newman–Keuls post hoc analysis showed significantly increased regularity index in SCI/KO mice (p < 0.01) when compared with the SCI/WT group. Significant difference was not observed in the interaction of Postinjury × Genotypes (F(1,16) = 3.66; p = 0.074; two-way ANOVA). There are no apparent differences in the sham groups between these genotypes with regard to stride length, print position, and regularity index.
Figure 9.
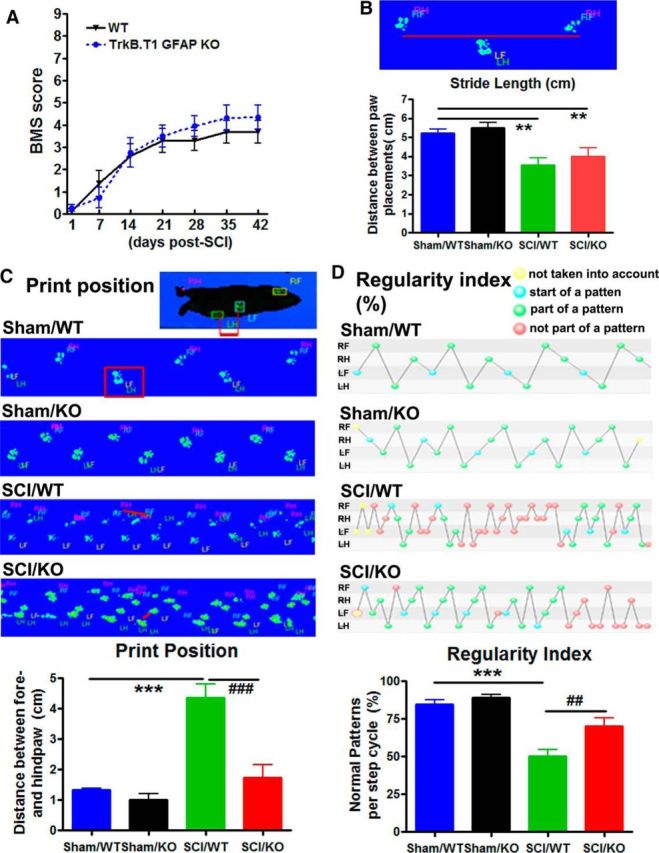
TrkB.T1-GFAP KO mice showed improved recovery of motor function and coordination compared with WT mice at 8 weeks after SCI. A, No significant differences were found in general locomotor recovery on the BMS. N = 8–11 mice/group (2-way ANOVA with repeated measurements). B, Changes in motor recovery were observed in T1-GFAP KO mice using the CatWalk, including stride length, though not to the level of healthy Sham mice. Stride length is shown here through a representative image of two placements of the right hindpaw (RH), in tandem with the right forepaw (RF) and in contrast with the left forepaw (LF) and left hindpaw (LH). C, The distance between the forepaws and hindpaws of the same side is shown here as print position, and is indicated by the red lines. Print position was highly increased in SCI WT mice, but recovered to near-Sham levels in T1-GFAP KO mice, suggesting significant recovery of voluntary motor control in KO animals. D, KO mice also showed significant recovery in coordination as measured by the regularity index when compared with WT mice. The beginning of a step cycle is shown here in blue and subsequent steps within the cycle that fit a standard pattern shown in green, while irregular steps appear in red. T1-GFAP KO mice showed significant recovery of normal stepping patterns compared with WT, as indicated by an increased percentage regularity index. N = 5–6 mice/group. **p < 0.01, ***p < 0.001 versus Sham/WT; ##p < 0.01, ###p < 0.001 versus SCI/WT (2-way ANOVA with Student's Newman–Keuls post hoc analysis).
Mice, like humans, display hyperpathic pain after SCI that endures well into the chronic phase. In evaluating various types of hyperpathic pain, we were able to identify reductions in pain-like behaviors in mice lacking astrocytic trkB.T1. Allodynia, measured using the von Frey filament test, as well as thermal hyperalgesia, measured using the hot plate, both showed increases in withdrawal threshold of KO mice compared with WT mice (p < 0.01, two-way ANOVA with Student's Newman–Keuls post hoc analysis), indicating reduced hyperpathic pain (Fig. 10A,B). Two-way ANOVA analysis in the von Frey filament test showed significant effects of Postinjury (F(1,30) = 203.258; p < 0.001), Genotypes (F(1,30) = 5.031; p = 0.032), and the interaction of Postinjury × Genotypes (F(1,30) = 4.765; p = 0.037). In the thermal hyperalgesia test, the factors of Postinjury Days (F(1,34) = 4.245; p = 0.047) and Genotypes (F(1,34) = 5.846; p = 0.021) were found to be significant. However, the interaction of Postinjury Days × Genotypes (F(1,34) = 2.212; p = 0.146; two-way ANOVA) was not significant. Improvements in the thermal test were not significantly different from those for uninjured controls, suggesting a recovery from thermal hyperalgesia to near-normal levels in KO mice.
Figure 10.

Behaviors indicative of neuropathic pain were reduced in T1-GFAP KO mice compared with WT mice at the chronic phase of injury. A, Mechanical allodynia as tested using von Frey filaments was detected in mice at 5 weeks after SCI, but was found to be less severe in T1-GFAP KO mice than in WT mice. B, Thermal hyperalgesia recovered to near-baseline levels in KO mice, in contrast to heightened sensitization in WT mice. N = 8–9 mice/group. *p < 0.05, ***p < 0.001 versus Baseline; ##p < 0.01 versus SCI/WT (2-way ANOVA with Student's Newman–Keuls post hoc analysis). C–E, TrkB.T1-GFAP KO mice showed significant improvements in spontaneous pain-like behaviors in the CatWalk compared with WT mice. Sample images of paw impressions in the CatWalk, depicting both total area of the step and magnitude of impression are indicated in C. Maximum contact area was automatically calculated as the total area of the hindpaw at the point of maximum placement, as shown by the X and Z axes of the paw print map. Maximum intensity at maximum contact used the same paw print as that of maximum contact area, but explored the highest point of intensity, or the y-axis on the paw print map, with greater intensities appearing on a scale of blue to green where green is high intensity. Higher intensities on the maximum intensity at maximum contact are indicative of increased weight-bearing on the hindpaws, further suggesting a reduction in spontaneous allodynic pain. N = 5–6 mice/group. **p < 0.01, ***p < 0.001 versus Sham/WT; ##p < 0.01 versus SCI/WT (2-way ANOVA with Student's Newman–Keuls post hoc analysis).
In addition to reductions in allodynia, we also observed reductions in spontaneous pain-type behaviors in the automated CatWalk. No significant differences were observed in the sham groups between these genotypes with regard to maximum contact area and maximum intensity at maximum contact. However, maximum contact area of the hindpaw was greatly reduced in injured mice compared with sham controls (p < 0.01, two-way ANOVA with Student's Newman–Keuls post hoc analysis), though KO mice showed significantly higher contact area than WT (p < 0.01), suggesting a reduction in spontaneous pain upon paw placement (Fig. 10C,D). The factor of Genotypes (F(1,18) = 4.962; p = 0.039) was found to be significant. However, the factor of Postinjury (F(1,18) = 4.314; p = 0.052) and the interaction of Postinjury × Genotypes (F(1,18) = 4.152; p = 0.057; two-way ANOVA) were not significant. In tandem with this finding was that of maximum intensity at maximum contact, or the highest amount of pressure placed on the hindpaw during the print with the greatest contact area, which revealed a reduction in weight-bearing in WT mice that recovered to near-baseline levels in KO mice (Fig. 10E; p < 0.01, two-way ANOVA with Student's Newman–Keuls post hoc analysis), further supporting the evidence that astrocyte-specific trkB.T1 deletion contributes to reductions in post-SCI pain. The factors of Postinjury (F(1,18) = 24.183; p < 0.001) and the interaction of Postinjury × Genotypes (F(1,18) = 4.521; p = 0.048; two-way ANOVA) were found to be significant. However, the factor of Genotypes (F(1,18) = 4.068; p = 0.059) was not significant.
Discussion
Upregulation of trkB.T1 is known to contribute to locomotor dysfunction and neuropathic pain after SCI (Wu et al., 2013). Here we demonstrate that pathways related to inflammation, cellular proliferation, and migration are significantly reduced in trkB.T1 KO astrocytes compared with those from WT controls. Further in vitro and in vivo data confirmed that KO astrocytes exhibit slower migration/proliferation in response to exogenous FBS/BDNF or spinal cord contusion. After SCI, astrocyte-specific trkB.T1 KO mice also showed reduced hyperpathic responses and improved motor coordination.
Our previous reports, based on the use of Western blots, demonstrated trkB.T1 elevation in injured spinal cord (Wu et al., 2013). In the present study, we identified the specific times, regions, and cell types in which trkB.T1+ cells accumulate after SCI. In the WM, astrocytes and microglia are preferentially affected. The extent of trkB.T1+ cells correlates with the proximity to the injury site, with the dorsal columns showing greatest changes. In the GM, trkB.T1+ cells occur primarily in neurons and are more pronounced in the DH compared with the VH. TrkB.T1 expression is elevated at 7 d after injury in neurons, astrocytes, and microglia, remaining upregulated well into the chronic phase of injury predominantly in astrocytes.
TrkB.T1 is the sole trkB isoform expressed on astrocytes and is highly conserved across species (Klein et al., 1993). To gain insight into the functional role for trkB.T1 expression in astrocytes, we examined transcriptional differences between trkB.T1 KO astrocytes and WT controls. We found that pathways related to inflammation, cellular proliferation, and migration were significantly reduced in the KO animals, which, because astrocytes serve a key role in inflammatory regulation, is consistent with the reduction of “gliopathy” in trkB.T1 KO mice after SCI reported previously (Wu et al., 2013). The involvement of trkB.T1 in migration, proliferation, and motility has previously been suggested but is not well explored. The data presented here demonstrate that absence or reduction of trkB.T1 markedly alters astrocyte migration and proliferation. Serum-deprived cells showed differences in migratory capacity that became more pronounced when serum or BDNF were introduced. Similar changes were also found in scratch assays or in WT cells subjected to siRNA knockdown of trkB.T1. In the latter studies, inhibition significantly impeded migration in an in vitro wound model.
Under certain pathological conditions, such as trauma or stroke, astrocytes near the site of an injury become highly motile with increased potential for remodeling/reorganization. After SCI, these reactive astrocytes migrate to the injury site and form an astroglial scar. Although the glial scar may serve to protect the injury tissue from spreading inflammation and these astroglia can selectively initiate de novo proliferation surrounding an injury site (Bardehle et al., 2013), the scar forms a physical barrier to axonal regrowth and releases inhibitory compounds that limit the spinal cord's regenerative capacity (Silver and Miller, 2004; Sofroniew, 2015). Here we demonstrate that deleting trkB.T1 alters proliferation of astrocytes, either in the absence of or presence of serum or BDNF. Reduced proliferation of astrocytes was also found after SCI in astrocyte-specific trkB.T1 KO mice. Double-labeling for astrocytes and proliferative markers indicated that most new cells in WT tissue consisted of astrocytes. In contrast, astrocyte content in KO animal tissue was reduced by one-third to one-half compared with WT, suggesting that the proliferation of astrocytes in response to SCI was reduced in these animals. These findings indicate that trkB.T1 plays roles both in the migratory and proliferative responses to injury. In addition, upregulation of truncated trkB.T1 receptors on non-neuronal cells inhibits BDNF-induced neurite outgrowth in SY5Y neuroblastoma cells (Fryer et al., 1997), supporting the hypothesis that the upregulation of trkB-T1 on astrocytes after SCI contributes to the inhibition of neuronal axonal regrowth. This hypothesis should be further investigated.
Reactive astrocytes in the spinal cord have been implicated in the development and maintenance of central sensitization and pain hypersensitivity. The emerging literature strongly suggests that microglia and astrocytes play distinct roles in neuropathic pain induction and maintenance (Raghavendra et al., 2003; Shi et al., 2012; Ji et al., 2013). Compared with microglial activation, astroglial activation in neuropathic pain conditions is more persistent and plays a more important role in neuropathic pain maintenance (Hulsebosch et al., 2009; Gao and Ji, 2010; Chen et al., 2012; Ji et al., 2014; Walters, 2014), although microglia are also involved in neuropathic pain maintenance (Tsuda et al., 2003; Hains and Waxman, 2006; Wu et al., 2016a). Pain originating in the hindpaw of rodents is processed and maintained by signaling in the lumbar spinal cord following nerve injuries (Detloff et al., 2008). Our group previously determined that decreased activation of astrocytes in the lumbar spinal DH of global trkB.T1 KO mice was associated with reduced below-level pain (Wu et al., 2013). We show here a reduced total number of astrocytes in the lumbar spinal DH at 8 weeks after injury in astrocyte-specific trkB.T1 KO mice. As trkB.T1 is predominantly expressed by astrocytes at late time points after SCI, these findings are consistent with the concept that trkB.T1 is involved in late-phase neuropathic pain maintenance. Our previous studies have illuminated the role of trkB.T1 in the activation of the cell cycle (Wu et al., 2013). It is generally believed that central sensitization, the formation of a long-term “memory” in the spinal cord DH neurons, is a critical mechanism that underlies SCI-induced pain sensitization (Ji et al., 2003; Kuner, 2010). Accumulating evidence suggests that spinal cord astrocytes play an important role in neuropathic pain sensitization through the release of astroglial mediators (e.g., cytokines, chemokines, and growth factors) that increase the activity of spinal cord nociceptive neurons (Gao and Ji, 2010; Ji et al., 2013, 2016). In addition, astrocytes under pathological conditions lose their ability to maintain the homeostatic concentrations of extracellular potassium (K+) and glutamate, leading to neuronal hyperexcitability (Ji et al., 2013). Whether reduced numbers and activation of astrocytes in the absence of trkB.T1 limits neuronal hyperactivity following SCI needs further investigation.
Previous work from our laboratory has demonstrated improved recovery of locomotor function after global genetic deletion of trkB.T1, as well as reductions in mechanical allodynia (Wu et al., 2013). Although differences in the BMS scores were not observed between astrocyte-specific trkB.T1 KO and WT mice, more sensitive assays of stride length, print position, and the regularity index using the CatWalk system showed significant restoration of motor coordination in animals lacking astrocytic trkB.T1. Moreover, using the von Frey filament test for mechanical allodynia and the hot plate for thermal hyperalgesia, significant differences were found between injured WT and KO animals. CatWalk data were consistent with these findings—using measures of maximum intensity at maximum contact and maximum weight bearing detected at the point of greatest paw print area—which have been previously found to be reliable and sensitive pain-sensitivity parameters with high correlation to von Frey filament scores (Vrinten and Hamers, 2003). Collectively, these findings support the conclusion that astrocyte-specific trkB.T1 contributes to post-SCI pain.
In summary, we show that elimination of the trkB.T1 isoform reduces astrocyte proliferation and migration both in vitro and in vivo, and that deletion of astrocyte-specific trkB.T1 reduces pathophysiological changes after SCI in mice, including motor function and pain sensitivity. The ability of siRNA knock-down of trkB.T1 to reproduce effects of the selective KO in vitro further suggests that blocking trkB.T1 may provide a novel and effective approach for limiting neuropathic pain after SCI.
Notes
Supplemental material for this article is available at https://www.nursing.umaryland.edu/directory/susan-dorsey/. Table 1. Differentially expressed genes related to cellular migration, proliferation. and the inflammatory response from RNAseq. Those genes that met the thresholds for consideration as significantly dysregulated in trkB.T1 KO astrocytes compared with WT included those with ≥2-fold change (±) and a FDR-corrected p value of <0.05. The genes listed are those that were significantly enriched in the upstream regulator and gene ontology analysis represented in Figure 2. This material has not been peer reviewed.
Footnotes
This work was supported by grants from National Institutes of Health (R01 NR013601 to S.D.G./A.I.F.; R01 NS094527 to J.W.; NIH T32 HL007698 to Dr. Dudley Strickland). We thank Carleveva J. Thompson for help with animal husbandry, Dr. Marta M. Lipinski for technical assistance, and Nicole Ward and Shuxin Zhao for help with von Frey test and histological tissue preparation.
The authors declare no competing financial interests.
References
- Anders S, Pyl PT, Huber W (2015) HTSeq—a Python framework to work with high-throughput sequencing data. Bioinformatics 31:166–169. 10.1093/bioinformatics/btu638 [DOI] [PMC free article] [PubMed] [Google Scholar]
- Bardehle S, Krüger M, Buggenthin F, Schwausch J, Ninkovic J, Clevers H, Snippert HJ, Theis FJ, Meyer-Luehmann M, Bechmann I, Dimou L, Götz M (2013) Live imaging of astrocyte responses to acute injury reveals selective juxtavascular proliferation. Nat Neurosci 16:580–586. 10.1038/nn.3371 [DOI] [PubMed] [Google Scholar]
- Basso DM, Fisher LC, Anderson AJ, Jakeman LB, McTigue DM, Popovich PG (2006) Basso Mouse Scale for locomotion detects differences in recovery after spinal cord injury in five common mouse strains. J Neurotrauma 23:635–659. 10.1089/neu.2006.23.635 [DOI] [PubMed] [Google Scholar]
- Boyle EI, Weng S, Gollub J, Jin H, Botstein D, Cherry JM, Sherlock G (2004) GO::TermFinder—open source software for accessing gene ontology information and finding significantly enriched gene ontology terms associated with a list of genes. Bioinformatics 20:3710–3715. 10.1093/bioinformatics/bth456 [DOI] [PMC free article] [PubMed] [Google Scholar]
- Chen J, Wu J, Apostolova I, Skup M, Irintchev A, Kügler S, Schachner M (2007) Adeno-associated virus-mediated L1 expression promotes functional recovery after spinal cord injury. Brain 130:954–969. [DOI] [PubMed] [Google Scholar]
- Chen MJ, Kress B, Han X, Moll K, Peng W, Ji RR, Nedergaard M (2012) Astrocytic CX43 hemichannels and gap junctions play a crucial role in development of chronic neuropathic pain following spinal cord injury. Glia 60:1660–1670. 10.1002/glia.22384 [DOI] [PMC free article] [PubMed] [Google Scholar]
- de Medinaceli L, Freed WJ, Wyatt RJ (1982) An index of the functional condition of rat sciatic nerve based on measurements made from walking tracks. Exp Neurol 77:634–643. 10.1016/0014-4886(82)90234-5 [DOI] [PubMed] [Google Scholar]
- Detloff MR, Fisher LC, McGaughy V, Longbrake EE, Popovich PG, Basso DM (2008) Remote activation of microglia and pro-inflammatory cytokines predict the onset and severity of below-level neuropathic pain after spinal cord injury in rats. Exp Neurol 212:337–347. 10.1016/j.expneurol.2008.04.009 [DOI] [PMC free article] [PubMed] [Google Scholar]
- Dorsey SG, Bambrick LL, Balice-Gordon RJ, Krueger BK (2002) Failure of brain-derived neurotrophic factor-dependent neuron survival in mouse trisomy 16. J Neurosci 22:2571–2578. [DOI] [PMC free article] [PubMed] [Google Scholar]
- Dorsey SG, Renn CL, Carim-Todd L, Barrick CA, Bambrick L, Krueger BK, Ward CW, Tessarollo L (2006) In vivo restoration of physiological levels of truncated TrkB.T1 receptor rescues neuronal cell death in a trisomic mouse model. Neuron 51:21–28. 10.1016/j.neuron.2006.06.009 [DOI] [PubMed] [Google Scholar]
- Faulkner JR, Herrmann JE, Woo MJ, Tansey KE, Doan NB, Sofroniew MV (2004) Reactive astrocytes protect tissue and preserve function after spinal cord injury. J Neurosci 24:2143–2155. 10.1523/JNEUROSCI.3547-03.2004 [DOI] [PMC free article] [PubMed] [Google Scholar]
- Fenner BM. (2012) Truncated TrkB: beyond a dominant negative receptor. Cytokine Growth Factor Rev 23:15–24. 10.1016/j.cytogfr.2012.01.002 [DOI] [PubMed] [Google Scholar]
- Ferrer I, Marín C, Rey MJ, Ribalta T, Goutan E, Blanco R, Tolosa E, Martí E (1999) BDNF and full-length and truncated TrkB expression in Alzheimer disease. Implications in therapeutic strategies. J Neuropathol Exp Neurol 58:729–739. 10.1097/00005072-199907000-00007 [DOI] [PubMed] [Google Scholar]
- Fryer RH, Kaplan DR, Kromer LF (1997) Truncated trkB receptors on nonneuronal cells inhibit BDNF-induced neurite outgrowth in vitro. Exp Neurol 148:616–627. 10.1006/exnr.1997.6699 [DOI] [PubMed] [Google Scholar]
- Gao YJ, Ji RR (2010) Targeting astrocyte signaling for chronic pain. Neurotherapeutics 7:482–493. 10.1016/j.nurt.2010.05.016 [DOI] [PMC free article] [PubMed] [Google Scholar]
- Hains BC, Waxman SG (2006) Activated microglia contribute to the maintenance of chronic pain after spinal cord injury. J Neurosci 26:4308–4317. 10.1523/JNEUROSCI.0003-06.2006 [DOI] [PMC free article] [PubMed] [Google Scholar]
- Hamers FP, Lankhorst AJ, van Laar TJ, Veldhuis WB, Gispen WH (2001) Automated quantitative gait analysis during overground locomotion in the rat: its application to spinal cord contusion and transection injuries. J Neurotrauma 18:187–201. 10.1089/08977150150502613 [DOI] [PubMed] [Google Scholar]
- Hulsebosch CE, Hains BC, Crown ED, Carlton SM (2009) Mechanisms of chronic central neuropathic pain after spinal cord injury. Brain Res Rev 60:202–213. 10.1016/j.brainresrev.2008.12.010 [DOI] [PMC free article] [PubMed] [Google Scholar]
- Jakovcevski I, Wu J, Karl N, Leshchyns'ka I, Sytnyk V, Chen J, Irintchev A, Schachner M (2007) Glial scar expression of CHL1, the close homolog of the adhesion molecule L1, limits recovery after spinal cord injury. J Neurosci 27:7222–7233. 10.1523/JNEUROSCI.0739-07.2007 [DOI] [PMC free article] [PubMed] [Google Scholar]
- Ji RR, Kohno T, Moore KA, Woolf CJ (2003) Central sensitization and LTP: do pain and memory share similar mechanisms? Trends Neurosci 26:696–705. 10.1016/j.tins.2003.09.017 [DOI] [PubMed] [Google Scholar]
- Ji RR, Berta T, Nedergaard M (2013) Glia and pain: is chronic pain a gliopathy? Pain 154 [Suppl 1]:S10–S28. 10.1016/j.pain.2013.06.022 [DOI] [PMC free article] [PubMed] [Google Scholar]
- Ji RR, Xu ZZ, Gao YJ (2014) Emerging targets in neuroinflammation-driven chronic pain. Nat Rev Drug Discov 13:533–548. 10.1038/nrd4334 [DOI] [PMC free article] [PubMed] [Google Scholar]
- Ji RR, Chamessian A, Zhang YQ (2016) Pain regulation by non-neuronal cells and inflammation. Science 354:572–577. 10.1126/science.aaf8924 [DOI] [PMC free article] [PubMed] [Google Scholar]
- King VR, Bradbury EJ, McMahon SB, Priestley JV (2000) Changes in truncated trkB and p75 receptor expression in the rat spinal cord following spinal cord hemisection and spinal cord hemisection plus neurotrophin treatment. Exp Neurol 165:327–341. 10.1006/exnr.2000.7480 [DOI] [PubMed] [Google Scholar]
- Klein R, Smeyne RJ, Wurst W, Long LK, Auerbach BA, Joyner AL, Barbacid M (1993) Targeted disruption of the trkB neurotrophin receptor gene results in nervous system lesions and neonatal death. Cell 75:113–122. 10.1016/S0092-8674(05)80088-1 [DOI] [PubMed] [Google Scholar]
- Kuner R. (2010) Central mechanisms of pathological pain. Nat Med 16:1258–1266. 10.1038/nm.2231 [DOI] [PubMed] [Google Scholar]
- Liebl DJ, Huang W, Young W, Parada LF (2001) Regulation of Trk receptors following contusion of the rat spinal cord. Exp Neurol 167:15–26. 10.1006/exnr.2000.7548 [DOI] [PubMed] [Google Scholar]
- Liu S, Sarkar C, Dinizo M, Faden AI, Koh EY, Lipinski MM, Wu J (2015) Disrupted autophagy after spinal cord injury is associated with ER stress and neuronal cell death. Cell Death Dis 6:e1582. 10.1038/cddis.2014.527 [DOI] [PMC free article] [PubMed] [Google Scholar]
- Middlemas DS, Lindberg RA, Hunter T (1991) trkB, a neural receptor protein-tyrosine kinase: evidence for a full-length and two truncated receptors. Mol Cell Biol 11:143–153. 10.1128/MCB.11.1.143 [DOI] [PMC free article] [PubMed] [Google Scholar]
- Ohira K, Kumanogoh H, Sahara Y, Homma KJ, Hirai H, Nakamura S, Hayashi M (2005) A truncated tropomyosin-related kinase B receptor, T1, regulates glial cell morphology via Rho GDP dissociation inhibitor 1. J Neurosci 25:1343–1353. 10.1523/JNEUROSCI.4436-04.2005 [DOI] [PMC free article] [PubMed] [Google Scholar]
- Raghavendra V, Tanga F, DeLeo JA (2003) Inhibition of microglial activation attenuates the development but not existing hypersensitivity in a rat model of neuropathy. J Pharmacol Exp Ther 306:624–630. 10.1124/jpet.103.052407 [DOI] [PubMed] [Google Scholar]
- Renn CL, Leitch CC, Dorsey SG (2009) In vivo evidence that truncated trkB.T1 participates in nociception. Mol Pain 5:61. 10.1186/1744-8069-5-61 [DOI] [PMC free article] [PubMed] [Google Scholar]
- Rose CR, Blum R, Pichler B, Lepier A, Kafitz KW, Konnerth A (2003) Truncated TrkB-T1 mediates neurotrophin-evoked calcium signalling in glia cells. Nature 426:74–78. 10.1038/nature01983 [DOI] [PubMed] [Google Scholar]
- Shi Y, Gelman BB, Lisinicchia JG, Tang SJ (2012) Chronic-pain-associated astrocytic reaction in the spinal cord dorsal horn of human immunodeficiency virus-infected patients. J Neurosci 32:10833–10840. 10.1523/JNEUROSCI.5628-11.2012 [DOI] [PMC free article] [PubMed] [Google Scholar]
- Silver J, Miller JH (2004) Regeneration beyond the glial scar. Nat Rev Neurosci 5:146–156. 10.1038/nrn1326 [DOI] [PubMed] [Google Scholar]
- Sofroniew MV. (2015) Astrocyte barriers to neurotoxic inflammation. Nat Rev Neurosci 16:249–263. 10.1038/nrn3898 [DOI] [PMC free article] [PubMed] [Google Scholar]
- Squinto SP, Stitt TN, Aldrich TH, Davis S, Bianco SM, Radziejewski C, Glass DJ, Masiakowski P, Furth ME, Valenzuela DM (1991) trkB encodes a functional receptor for brain-derived neurotrophic factor and neurotrophin-3 but not nerve growth factor. Cell 65:885–893. 10.1016/0092-8674(91)90395-F [DOI] [PubMed] [Google Scholar]
- Supek F, Bošnjak M, Škunca N, Šmuc T (2011) REVIGO summarizes and visualizes long lists of gene ontology terms. PLoS One 6:e21800. 10.1371/journal.pone.0021800 [DOI] [PMC free article] [PubMed] [Google Scholar]
- Trapnell C, Pachter L, Salzberg SL (2009) TopHat: discovering splice junctions with RNA-Seq. Bioinformatics 25:1105–1111. 10.1093/bioinformatics/btp120 [DOI] [PMC free article] [PubMed] [Google Scholar]
- Trapnell C, Williams BA, Pertea G, Mortazavi A, Kwan G, van Baren MJ, Salzberg SL, Wold BJ, Pachter L (2010) Transcript assembly and quantification by RNA-Seq reveals unannotated transcripts and isoform switching during cell differentiation. Nat Biotechnol 28:511–515. 10.1038/nbt.1621 [DOI] [PMC free article] [PubMed] [Google Scholar]
- Trapnell C, Hendrickson DG, Sauvageau M, Goff L, Rinn JL, Pachter L (2013) Differential analysis of gene regulation at transcript resolution with RNA-seq. Nat Biotechnol 31:46–53. 10.1038/nbt.2450 [DOI] [PMC free article] [PubMed] [Google Scholar]
- Tsuda M, Shigemoto-Mogami Y, Koizumi S, Mizokoshi A, Kohsaka S, Salter MW, Inoue K (2003) P2X4 receptors induced in spinal microglia gate tactile allodynia after nerve injury. Nature 424:778–783. 10.1038/nature01786 [DOI] [PubMed] [Google Scholar]
- Vrinten DH, Hamers FF (2003) ‘CatWalk’ automated quantitative gait analysis as a novel method to assess mechanical allodynia in the rat; a comparison with von Frey testing. Pain 102:203–209. 10.1016/s0304-3959(02)00382-2 [DOI] [PubMed] [Google Scholar]
- Walters ET. (2014) Neuroinflammatory contributions to pain after SCI: roles for central glial mechanisms and nociceptor-mediated host defense. Exp Neurol 258:48–61. 10.1016/j.expneurol.2014.02.001 [DOI] [PubMed] [Google Scholar]
- Wu J, Wrathall JR, Schachner M (2010) Phosphatidylinositol 3-kinase/protein kinase Cdelta activation induces close homolog of adhesion molecule L1 (CHL1) expression in cultured astrocytes. Glia 58:315–328. 10.1002/glia.20925 [DOI] [PMC free article] [PubMed] [Google Scholar]
- Wu J, Renn CL, Faden AI, Dorsey SG (2013) TrkB.T1 contributes to neuropathic pain after spinal cord injury through regulation of cell cycle pathways. J Neurosci 33:12447–12463. 10.1523/JNEUROSCI.0846-13.2013 [DOI] [PMC free article] [PubMed] [Google Scholar]
- Wu J, Zhao Z, Sabirzhanov B, Stoica BA, Kumar A, Luo T, Skovira J, Faden AI (2014) Spinal cord injury causes brain inflammation associated with cognitive and affective changes: role of cell cycle pathways. J Neurosci 34:10989–11006. 10.1523/JNEUROSCI.5110-13.2014 [DOI] [PMC free article] [PubMed] [Google Scholar]
- Wu J, Zhao Z, Zhu X, Renn CL, Dorsey SG, Faden AI (2016a) Cell cycle inhibition limits development and maintenance of neuropathic pain following spinal cord injury. Pain 157:488–503. 10.1097/j.pain.0000000000000393 [DOI] [PMC free article] [PubMed] [Google Scholar]
- Wu J, Zhao Z, Kumar A, Lipinski MM, Loane DJ, Stoica BA, Faden AI (2016b) Endoplasmic reticulum stress and disrupted neurogenesis in the brain are associated with cognitive impairment and depressive-like behavior after spinal cord injury. J Neurotrauma 33:1919–1935. 10.1089/neu.2015.4348 [DOI] [PMC free article] [PubMed] [Google Scholar]
- Yanpallewar SU, Barrick CA, Buckley H, Becker J, Tessarollo L (2012) Deletion of the BDNF truncated receptor TrkB.T1 delays disease onset in a mouse model of amyotrophic lateral sclerosis. PLoS One 7:e39946. 10.1371/journal.pone.0039946 [DOI] [PMC free article] [PubMed] [Google Scholar]