Abstract
A DNA‐sensing platform is developed by exploiting the easy surface functionalization of metal–organic framework (MOF) particles and their highly parallelized fluorescence detection by flow cytometry. Two strategies were employed to functionalize the surface of MIL‐88A, using either covalent or non‐covalent interactions, resulting in alkyne‐modified and biotin‐modified MIL‐88A, respectively. Covalent surface coupling of an azide‐dye and the alkyne–MIL‐88A was achieved by means of a click reaction. Non‐covalent streptavidin–biotin interactions were employed to link biotin–PNA to biotin–MIL‐88A particles mediated by streptavidin. Characterization by confocal imaging and flow cytometry demonstrated that DNA can be bound selectively to the MOF surface. Flow cytometry provided quantitative data of the interaction with DNA. Making use of the large numbers of particles that can be simultaneously processed by flow cytometry, this MOF platform was able to discriminate between fully complementary, single‐base mismatched, and randomized DNA targets.
Keywords: metal–organic frameworks, multivalent biomaterials, nanoparticles, nucleic acid recognition, peptide nucleic acids
Introduction
Surface ligands determine, to a great extent, the biologically relevant functions of various nanosized particles. This is particularly important for drug delivery, where active ligands provide specific interactions to guide particles to the desired place in the body, and for biosensing, where moieties that recognize the analyte of choice provide the necessary selectivity in binding the analyte to the sensor surface.
Metal–organic frameworks (MOFs), also known as coordination polymers, are a relatively new class of crystalline porous materials that are formed by the assembly of metal ions with rigid rod‐like organic ligands in suitable solvents.1 MOFs offer ultrahigh porosity, large internal surface‐to‐volume ratios, tunable structures, and tailorable chemistry.2 MOFs have attracted considerable interest in many potential applications.3 In particular, the use of MOFs in biomedicine is growing rapidly because of their advantages in drug delivery and imaging applications over traditional carriers such as organic polymers4 and inorganic materials.5 Therefore, surface modification strategies are important for tuning the properties of MOFs toward specific applications, such as drug delivery and biosensing.
MOFs can be used in the development of multifunctional nanocarriers for biomedicine, because they can be tailored in order to have: (i) a particle size appropriate for intravenous applications,6 (ii) a specific trigger for assembly and disassembly that allows controlled drug encapsulation and release,3f, 7 (iii) the ability to serve as a contrast agent8 (e.g., to differentiate between normal and cancerous cells), (iv) a surface functionalized with stabilizers6, 9 (such as PEG) to permit circulation in the bloodstream for a prolonged period of time, and (v) cell‐targeting surface moieties to allow targeted drug delivery.8b, 10
In particular, MIL‐88A has been used for drug encapsulation and as a contrast agent by Horcajada, Gref, and co‐workers.6 MIL‐88A has many advantages compared to other MOFs because of its flexible framework, low toxicity, endogenous degradation products (iron and fumaric acid), and easy synthesis in an aqueous medium, resulting in beneficial properties such as a good biocompatibility, degradability, imaging properties, and high loading capacities.
Recently, DNA moieties have been incorporated on MOF surfaces to allow particle stabilization, DNA detection, and cellular entry.11 Mirkin et al.11a created the first nucleic acid–MOF nanoparticle hybrids, in which the oligonucleotides were appended with a dibenzylcyclooctyne containing linker to an azide‐functionalized UiO‐66 MOF; these were used to create a steric and electrostatic barrier that stabilize the particles in highly dielectric media and at the same time allows them to enter cells. Moreover, nanosized MOFs (nanoMOFs) were non‐covalently linked to fluorescently labeled PNA for miRNA detection.12
Many researchers used MOFs as sensing platforms for DNA detection using electrostatic interactions and π–π stacking. Chen et al.11b developed a selective fluorescence sensor for sequence‐specific recognition of HIV ds‐DNA in vitro, using a MOF functionalized with triplex‐forming oligonucleotide (TFO) probes as the sensing platform. Using a similar approach, Li et al.11c introduced MIL‐101 as a fluorescence anisotropy (FA) amplifier for DNA detection. This MOF provided a strong affinity for negatively charged ss‐DNA through π–π stacking and electrostatic interactions. Jiang et al.11d used a similar approach but using UiO66‐NH2 instead of MIL‐101. Here, DNA was detected by electrostatic interactions and π–π stacking between ss‐DNA and the benzyl‐amino group in UiO‐66‐NH2. The authors developed a platform that is capable of distinguishing complementary and mismatched target sequences with high sensitivity and selectivity. Kang et al.12 used this concept for sensing multiplexed miRNAs in living cancer cells by a peptide nucleic acid labeled with a fluorophore adsorbed on a nanoMOF.
Previously our group developed a strategy to simultaneously control both the size and the surface functionalization of MOF particles.13 MIL‐88A was synthesized and its size was tuned by varying the stoichiometric ratio between multivalent and monovalent ligands. At the same time, surface functionalization was successfully accomplished and the surface coverage was quantified using a fluorine‐containing capping ligand. Moreover, surface functionalization with PEG and biotin groups was shown, and the latter was bound to fluorescently labeled streptavidin.
Here, we describe the development of general surface functionalization strategies of MOFs, using both covalent and non‐covalent approaches, based on the concept of simultaneous particle formation and surface functionalization. The copper(I)‐catalyzed Huisgen cycloaddition (“click” reaction) and the biotin–streptavidin interaction have been used for these approaches, respectively. The non‐covalent strategy is applied to the formation of peptide nucleic acid (PNA)‐functionalized MIL‐88A, which is used subsequently for the selective binding of DNA at the MOF surface. Flow cytometry is used to analyze sufficiently large numbers of particles so that differences in hybridization efficiency can be detected with statistical significance.
Results and Discussion
Native MIL‐88A was synthesized using ferric chloride (as the metal ion providing the secondary building unit) and fumaric acid (as the organic linker) providing a final structure of Fe3O(OOC−C2H2−COO)3Clz⋅3 H2O. Using a previously described methodology,13 MIL‐88A was functionalized with alkyne (alkyne–MIL‐88A) or biotin moieties (biotin–MIL‐88A) by replacing a small fraction of the organic linker fumaric acid with 10‐undecynoic acid (5 %) or biotin–COOH (1 %), respectively, as shown in Scheme 1 a. Powder X‐ray diffraction (XRD) (see Figure S1 in the Supporting Information) showed that all MOFs were semi‐crystalline. The changes observed in the spectra of the functionalized MOFs compared to the native MIL‐88A are attributed to the flexibility of the framework and the effect of water absorption into the pores.13, 14, 15 The presence of the ligands may further affect the degree of hydration. Figure 1 shows scanning electron microscopy (SEM) images and the average length and width of MIL‐88A, alkyne‐MIL‐88A, and biotin‐MIL‐88A particles, which confirm the successful synthesis of the MOFs. As observed before,13, 15 adding small‐MW ligands to the MOF surface has only limited effect on the MOF particle size. Here, we only observe a significant decrease in the width but not the length of the particles. Because functionalization was our primary target here, we did not investigate the size effects further.
Scheme 1.
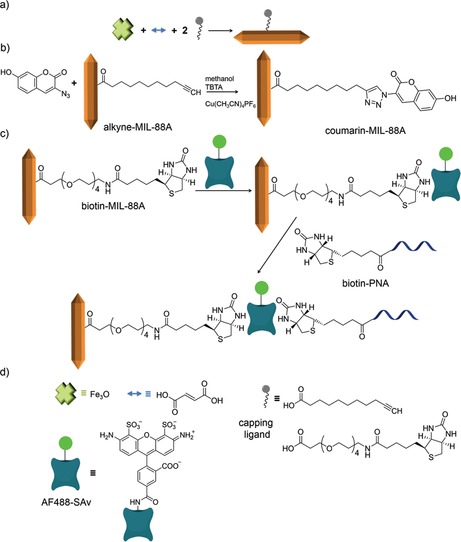
a) Synthesis of MIL‐88A functionalized with a capping ligand; b) covalent surface functionalization by the click reaction between alkyne–MIL‐88A and azide–coumarin; c) non‐covalent surface interactions between biotin–MIL‐88A, AF488‐SAv, and biotin–PNA; d) chemical structures of the compounds used here.
Figure 1.
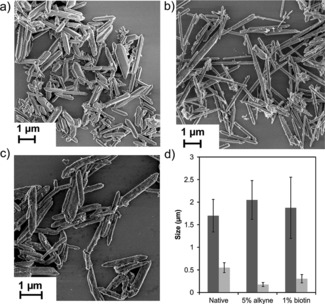
SEM images of a) MIL‐88A and MIL‐88A functionalized with b) 5 % 10‐undecynoic acid and c) 1 % biotin–COOH capping ligand; d) average particle dimensions from SEM images (a–c); length (dark gray) and width (light gray).
N2 adsorption isotherms were measured for two samples, non‐functionalized MIL‐88A and biotin‐MIL‐88A. Addition of biotin led to a strong decrease of the Brunauer–Emmett–Teller (BET) surface area, from 347 m2 g−1 for unfunctionalized MIL‐88A to 13.4 m2 g−1 for biotin‐MIL‐88A. This strong decrease is consistent with earlier observations.2b, 13, 15 Given the similar molecular weight of undecynoic acid compared to the fluorine‐containing capping ligand described before,13 we presume the BET areas to be similar. The zeta potential values of uncoated MIL‐88A (19.4±3.4 mV) were shifted to more neutral values of 12.4±0.3 and 12.4±0.4 mV in the case of alkyne‐MIL‐88A and biotin‐MIL‐88A, respectively, in line with a partial capping of free Fe coordination sites at the surface, as discussed before.15 In summary, we successfully functionalized the surface of MIL‐88A with alkyne and biotin groups, which can be used for further covalent and non‐covalent functionalization, respectively.
Covalent surface functionalization was achieved by employing the CuI‐catalyzed click reaction at the surface of alkyne‐MIL‐88A (see Scheme 1 b) using 3‐azido‐7‐hydroxycoumarin as reagent, resulting in coumarin–MIL‐88A. The reaction was carried out by adding an excess of azide, using tetrakis(acetonitrile)copper(I) hexafluorophosphate as catalyst, in the presence of tris‐(benzyltriazolylmethyl)amine (TBTA), followed by continuous stirring overnight at room temperature.
After the click reaction, bright field and fluorescence microscopy images (Figure 2) were taken. The images show MOF particles with a high fluorescence intensity, demonstrating the successful functionalization of the surface of MIL‐88A. Performing the click reaction at approximately twofold higher concentrations of both alkyne and azide (data not shown) led to a small increase of fluorescence intensity. Control experiments were performed with a MOF lacking the alkyne function (control 1), or with alkyne MOF but in the absence of the copper catalyst (control 2). The bright field and fluorescence images of these controls (Figure S2 in the Supporting Information) indicate the absence of fluorescence in both cases, which confirms the need of alkyne groups on the MOF surface and the presence of the catalyst to achieve the successful click synthesis. In summary, these results demonstrate the specific covalent surface functionalization of MIL‐88A using the CuI‐catalyzed click reaction.
Figure 2.
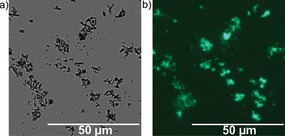
Bright field (a) and fluorescence (b) microscopy images of MIL‐88A after reaction of alkyne–MIL‐88A (0.49 mm of alkyne) with coumarin azide (3.3 mm).
To demonstrate the feasibility of employing MIL‐88A as a platform for PNA/DNA functionalization for binding target DNA, we chose to functionalize MIL‐88A with PNA with a specific sequence that has already been tested in sensing applications.16 Three different DNA targets were chosen to evaluate the binding selectivity of the MOF–PNA system: the full match (DNAFM) strand, a single‐base mismatched (DNA1MM) strand, and a randomized sequence (DNArand) (Scheme 2). All DNA targets were labelled with Cy5 for visualization. To bind biotinylated PNA to the MOF platform for the selective binding of DNA (Scheme 2 a), we employed the specific non‐covalent interaction between biotin‐MIL‐88A and Alexa‐Fluor488‐labeled streptavidin (AF488‐SAv) (Scheme 1 c).13
Scheme 2.
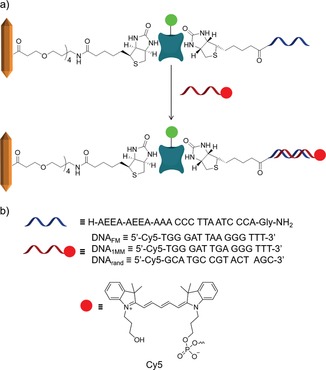
a) Non‐covalent surface interactions between biotin–MIL‐88A, AF488‐SAv, and biotin–PNA and further hybridization with DNA and b) structures of the oligonucleotides used here.
As shown in Scheme 2 a, AF488‐SAv was first attached to biotin–MIL‐88A using a high SAv/biotin ratio of 15 to suppress interparticle crosslinking that was observed before at lower ratios.13 The fluorescence intensities of AF488‐SAv and Cy5 (DNA targets) were measured using flow cytometry, as shown in Figure 3 and Figure 4. Fluorescence intensities of biotin–MIL‐88A particles in the absence of any dyes were below 102 for emission of both dyes (Figure 3 a). For biotin–MIL‐88A conjugated with AF488‐SAv, significantly higher intensities were observed for the emission of AF488 (Figure 3 b) confirming the conjugation between biotin–MIL‐88A and AF488‐SAv. To focus on the DNA‐recognition properties of the particles conjugated with AF488‐SAv, we selected in all cases those particles that passed the minimum relative fluorescence intensity of 102 for the AF488 emission (Figure 3 c). This enables easier visualization of differences in selectivity for the different Cy5‐labeled DNA target probes used here. The few events above the relative fluorescence Cy5 intensity of 102 observed in Figure 3 c (purple markers) are attributed to background noise because Cy5 is not present in this sample. For the PNA–DNA hybridization, we used a relative fluorescence intensity staining of 102 for Cy5 and used the same gate settings for both dyes at all experiments described below.
Figure 3.

Flow cytometry results for: a) biotin–MIL‐88A, and b) the conjugate of biotin–MIL‐88A and AF488‐SAv, and c) the fraction of particles of b for which the AF488 intensity is above 100. The blue regions indicate the fractions of particles for which the AF488 intensity is below 100, green indicates the fractions of particles for which the AF488 intensity is above 100 (indicative of conjugation between biotin–MIL‐88A and AF488‐SAv), and pink represents the fractions of particles for which both the AF488 and Cy5 intensities are above 100. The intensities of Cy5 and AF488 are given in arbitrary units.
Figure 4.
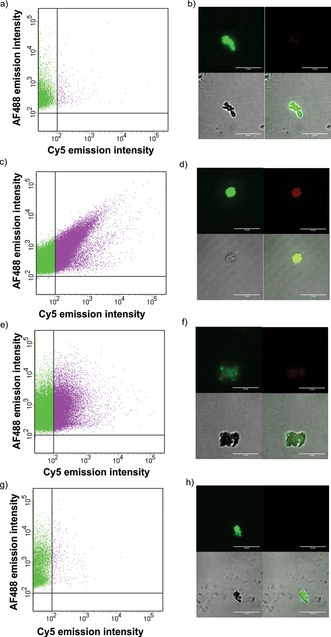
Flow cytometry (a, c, e, g) and confocal microscopy (b, d, f, h) results for biotin–MIL‐88A particles after incubation with AF488‐SAv followed by incubation with either DNAFM (a, b) or biotin–PNA followed by hybridization with DNAFM (c, d), DNA1MM (e, f), and DNArand (g, h) after washing at 40 °C. In the flow cytometry graphs, only the fractions of particles are shown for which the AF488 intensity passed the relative fluorescence intensity of 100. The green regions indicate particles with a high intensity of AF488 and pink represents a high intensity for both AF488‐SAv and Cy5. In the confocal images (b, d, f, h), the top left panel corresponds to AF488‐SAv, and top right corresponds to Cy5 (marker bound to DNA) fluorescence channels, bottom left is the microscope bright field image, and bottom right is the overlay. Scale bars are 10 μm.
Particles of biotin–MIL‐88A, pre‐conjugated with AF488‐SAv, were incubated with biotin–PNA at room temperature using a PNA/SAv ratio of 3. Thereafter, hybridization between PNA and the complementary DNAFM target, labeled with Cy5, was performed at 30 °C for 1 h using a PNA/DNA ratio of 1, followed by washing at 40 °C. Washing at room temperature instead gave non‐specific electrostatic interactions between the MOF particles and the DNA targets (Figure S3 in the Supporting Information). The same hybridization and washing procedure was followed for the DNA1MM and DNArand targets.
The samples were characterized using flow cytometry and confocal microscopy. In the absence of biotin–PNA, incubation with DNAFM did not yield Cy5 fluorescence for the particles (Figure 4 a, b). In contrast, in the presence of PNA, incubation with DNAFM gave co‐localization of high fluorescence intensities of AF488 as well as Cy5 (Figure 4 c, d). These results indicate that PNA and DNAFM have been successfully and specifically hybridized at the MOF surface.
In addition to DNAFM, the single‐mismatch target DNA1MM and the random DNArand target were used to investigate the selectivity of the sensing platform, likewise characterized using flow cytometry and confocal microscopy (Figure 4 d–h). Flow cytometry showed high Cy5 intensities for the adduct of MOF+PNA and DNA1MM (Figure 4 e) but low intensities for the adduct of MOF+PNA and DNArand (Figure 4 g). The high intensity of MOF+PNA with DNA1MM is attributed to the high sequence similarity (93 %) of DNA1MM compared to DNAFM. In the case of the interaction of MOF+PNA with DNArand, the fluorescence intensity distribution (Figure 4 g) was similar to the control without biotin–PNA (Figure 4 a). Fluorescence imaging (Figure 4 f, h) confirmed these findings by the co‐localization of fluorescence of AF488‐SAv and Cy5 (Figure 4 f) for the interaction between MOF+PNA and DNA1MM, and a strong intensity of only AF488‐SAv (Figure 4 h) for MOF+PNA with DNArand.
Fluorescence intensity profiles were taken from several confocal images, as shown in Figure S4a–d (see the Supporting Information). The ratio, r, of the intensity differences of ΔI Cy5 and ΔI AF488 between the peak and background intensities of Cy5 and AF488‐SAv, respectively, was measured and plotted in Figure S4e for all cases. Figure S4e shows that the hybridization of MOF+PNA with complementary DNAFM exhibited the largest r value, followed by MOF+PNA with single‐base mismatch DNA1MM. The adducts of MOF (without PNA) with DNAFM and of MOF+PNA with DNArand show very small r values, due to very low Cy5 intensities in these cases. Statistical analyses (t‐tests), shown in Table 1, gave p values below 0.05 only for the comparisons of MOF+PNA with DNAFM with MOF (no PNA) with DNAFM and MOF–PNA with DNArand. In the case of MOF–PNA with DNA1MM, the confocal intensity ratios were not significantly different. The main reason for this is most likely the lack of a sufficiently large number of analyzed particles.
Table 1.
Statistical t‐test results for MOF–PNA+DNAFM vs. different cases using the average r values from Figure S4e (confocal imaging) and the mean intensity values from Figure 5 (FACS).
| p | ||
|---|---|---|
| MOF–PNA+DNAFM vs. | Confocal imaging | FACS |
| MOF | – | <0.0001 |
| MOF (no PNA)+DNAFM | 0.026 | <0.0001 |
| MOF–PNA+DNA1MM | 0.340 | <0.0001 |
| MOF–PNA+DNArand | 0.023 | <0.0001 |
In contrast, flow cytometry provides convenient access to the analysis of much larger numbers of particles. To analyze these results more deeply, we compared the mean Cy5 intensities (M Cy5) of all events for each sample as well as the fractions of particles with a Cy5 intensity over 102 (Table 2, also including the total numbers of particles analyzed). MOF–PNA+DNAFM gave the highest M Cy5 value (103), followed by MOF–PNA+DNA1MM (40). As expected, the values for MOF, MOF (no PNA)+DNAFM, and MOF–PNA+DNArand had similar and low M Cy5 values. Likewise, MOF–PNA+DNAFM showed the largest fraction (46.5 %) of particles with a Cy5 intensity above 102 in comparison to all other cases, indicating higher degrees of hybridization. In the case of MOF–PNA+DNA1MM (18.3 %), the high‐intensity fraction was still higher than for MOF, MOF (no PNA)+DNAFM, and MOF–PNA+DNArand, which were much lower.
Table 2.
Average intensity, M Cy5, for all the events, fractions (%) with a Cy5 intensity below or above 100, and total numbers of particles, as measured by flow cytometry for MOF (=adduct of AF488‐SAv and biotin–MIL‐88A), MOF–PNA+DNAFM, MOF (no PNA)+DNAFM, MOF–PNA+DNA1MM, MOF–PNA+DNArand after washing at 40 °C.
| Sample | M CY5 | Fraction [%] with int. >100 | Number of particles |
|---|---|---|---|
| MOF | 7 | 1.0 | 199 999 |
| MOF–PNA+DNAFM | 103 | 46.5 | 191 927 |
| MOF (no PNA)+DNAFM | 5 | 1.1 | 44 999 |
| MOF–PNA+DNA1MM | 40 | 18.3 | 199 999 |
| MOF–PNA+DNArand | 9 | 2.2 | 49 998 |
Next, we determined the average Cy5 intensities of only those particles with a Cy5 intensity above 102, as shown in Figure 5. The values for MOF incubated with DNAFM (in the absence of PNA; 163), MOF+PNA with DNArand (148) are comparable to the value of MOF (153), and are based on comparably low numbers of particles because the high‐intensity fraction of particles is small for these cases. In contrast, the much larger fraction of MOF–PNA+DNAFM yielded a Cy5 fluorescence mean intensity of 185. For MOF–PNA incubated with DNA1MM, the average intensity was only slightly less, with a mean intensity value of 180. Yet, a statistical analysis (t‐test) of the data shown in Figure 5 (Table 1) showed that all p values for comparisons of the adduct of MOF+PNA with DNAFM with those of MOF (no PNA) with DNAFM, MOF–PNA with DNA1MM, and MOF–PNA with DNArand were below 0.05. Thus, we conclude that PNA immobilized on MIL‐88A is able to distinguish between complementary DNAFM and single‐base mismatch DNA1MM when analyzing the data using flow cytometry, because sufficiently large numbers of particles can be analyzed simultaneously. In summary, these results indicate that (i) PNA is mandatory for the specific binding of DNA, (ii) DNAFM and DNA1MM are hybridized with this PNA but to measurably different extents, and (iii) this sensing platform is able to differentiate between the fully complementary DNAFM, mismatched DNA1MM, and random DNArand targets.
Figure 5.
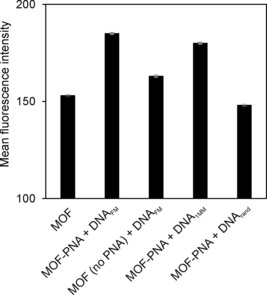
Mean fluorescence intensities as measured by flow cytometry for MOF and MOF–PNA, upon incubation with DNAFM, DNA1MM, or DNArand, after washing at 40 °C. The error bars denote a single standard deviation.
Conclusion
In conclusion, we have developed versatile methods for the surface functionalization of MIL‐88A using either covalent or non‐covalent interactions. Using the non‐covalent approach with biotin–streptavidin, we demonstrated that the MOF surface can be equipped with PNA. We tested this well‐known ligand attachment strategy because of its easy procedure and high rate of attachment. Future work will have to show whether the covalent click chemistry can result in a similarly robust PNA attachment strategy. The PNA‐functionalized MOF particles were used to achieve DNA binding and to assess the DNA binding selectivity. By washing MOFs at moderately high temperature, non‐specific adsorption between DNA and the particles can be avoided. Overall, the sensing platform was able to distinguish between complementary and single‐base mismatched or random sequences. The difference between complementary and single‐base mismatched DNA was small, but statistically significant when analyzing large numbers of particles using flow cytometry. The difference between these targets can possibly be improved further by washing at a temperature closer to the melting temperature of the DNA–PNA duplex. For future work, we envisage the creation of different DNA binding strategies for recognizing proteins, transcription factors, etc. This method can in principle be used to assay different analytes by introducing probes that selectively bind to the analytes. These features contribute to a simpler, efficient, and more general platform that could be expanded to other MOFs and applications.
Conflict of interest
The authors declare no conflict of interest.
Supporting information
As a service to our authors and readers, this journal provides supporting information supplied by the authors. Such materials are peer reviewed and may be re‐organized for online delivery, but are not copy‐edited or typeset. Technical support issues arising from supporting information (other than missing files) should be addressed to the authors.
Supplementary
Acknowledgements
This research was supported by the Council for Chemical Sciences of the Netherlands Organization for Scientific Research (NWO‐CW, Vici grant 700.58.443 to J.H.) and by the European Union's Horizon 2020 research and innovation programme under grant agreement No 633937, project ULTRAPLACAD. We gratefully thank the Inorganic Materials Science and Tissue Regeneration groups at the University of Twente for the use of XRD apparatus, Cindy Huiskes from the Inorganic Membranes group for the BET experiments, the Biomaterials Science and Technology group for the zeta potential measurements, and Mark A. Smithers for HR‐SEM imaging.
R. Mejia-Ariza, J. Rosselli, C. Breukers, A. Manicardi, L. W. M. M. Terstappen, R. Corradini, J. Huskens, Chem. Eur. J. 2017, 23, 4180.
Contributor Information
Dr. Raquel Mejia‐Ariza, http://www.utwente.nl/tnw/mnf/
Prof. Jurriaan Huskens, Email: j.huskens@utwente.nl, FAX: (+31) 53489 4645.
References
- 1.
- 1a. Férey G., Mellot-Draznieks C., Serre C., Millange F., Acc. Chem. Res. 2005, 38, 217–225; [DOI] [PubMed] [Google Scholar]
- 1b. Long J. R., Yaghi O. M., Chem. Soc. Rev. 2009, 38, 1213–1214; [DOI] [PubMed] [Google Scholar]
- 1c. Zhou H.-C., Long J. R., Yaghi O. M., Chem. Rev. 2012, 112, 673–674. [DOI] [PubMed] [Google Scholar]
- 2.
- 2a. Li H., Eddaoudi M., O'Keeffe M., Yaghi O. M., Nature 1999, 402, 276–279; [Google Scholar]
- 2b. Rowsell J. L. C., Yaghi O. M., Microporous Mesoporous Mater. 2004, 73, 3–14. [Google Scholar]
- 3.
- 3a. Corma A., Garcia H., Llabres i Xamena F. X., Chem. Rev. 2010, 110, 4606–4655; [DOI] [PubMed] [Google Scholar]
- 3b. Dang D., Wu P., He C., Xie Z., Duan C., J. Am. Chem. Soc. 2010, 132, 14321–14323; [DOI] [PubMed] [Google Scholar]
- 3c. Murray L. J., Dinca M., Long J. R., Chem. Soc. Rev. 2009, 38, 1294–1314; [DOI] [PubMed] [Google Scholar]
- 3d. Li J.-R., Sculley J., Zhou H.-C., Chem. Rev. 2012, 112, 869–932; [DOI] [PubMed] [Google Scholar]
- 3e. Keskin S., Kızılel S., Ind. Eng. Chem. Res. 2011, 50, 1799–1812; [Google Scholar]
- 3f. McKinlay A. C., Morris R. E., Horcajada P., Férey G., Gref R., Couvreur P., Serre C., Angew. Chem. Int. Ed. 2010, 49, 6260–6266; [DOI] [PubMed] [Google Scholar]; Angew. Chem. 2010, 122, 6400–6406; [Google Scholar]
- 3g. Horcajada P., Gref R., Baati T., Allan P. K., Maurin G., Couvreur P., Férey G., Morris R. E., Serre C., Chem. Rev. 2012, 112, 1232–1268. [DOI] [PubMed] [Google Scholar]
- 4. Freiberg S., Zhu X. X., Int. J. Pharm. 2004, 282, 1–18. [DOI] [PubMed] [Google Scholar]
- 5.
- 5a. Shivanand P., Sprockel O. L., Int. J. Pharm. 1998, 167, 83–96; [Google Scholar]
- 5b. Vallet-Regi M., Rámila A., del Real R. P., Pérez-Pariente J., Chem. Mater. 2001, 13, 308–311. [Google Scholar]
- 6. Horcajada P., Chalati T., Serre C., Gillet B., Sebrie C., Baati T., Eubank J. F., Heurtaux D., Clayette P., Kreuz C., Chang J.-S., Hwang Y. K., Marsaud V., Bories P.-N., Cynober L., Gil S., Ferey G., Couvreur P., Gref R., Nat. Mater. 2010, 9, 172–178. [DOI] [PubMed] [Google Scholar]
- 7. Wang C., Liu D., Lin W., J. Am. Chem. Soc. 2013, 135, 13222–13234. [DOI] [PMC free article] [PubMed] [Google Scholar]
- 8.
- 8a. Taylor K. M. L., Jin A., Lin W., Angew. Chem. Int. Ed. 2008, 47, 7722–7725; [DOI] [PubMed] [Google Scholar]; Angew. Chem. 2008, 120, 7836–7839; [Google Scholar]
- 8b. Taylor K. M. L., Rieter W. J., Lin W., J. Am. Chem. Soc. 2008, 130, 14358–14359. [DOI] [PubMed] [Google Scholar]
- 9. Agostoni V., Horcajada P., Noiray M., Malanga M., Aykaç A., Jicsinszky L., Vargas-Berenguel A., Semiramoth N., Daoud-Mahammed S., Nicolas V., Martineau C., Taulelle F., Vigneron J., Etcheberry A., Serre C., Gref R., Sci. Rep. 2015, 5, 7925. [DOI] [PMC free article] [PubMed] [Google Scholar]
- 10. Rowe M. D., Thamm D. H., Kraft S. L., Boyes S. G., Biomacromolecules 2009, 10, 983–993. [DOI] [PubMed] [Google Scholar]
- 11.
- 11a. Morris W., Briley W. E., Auyeung E., Cabezas M. D., Mirkin C. A., J. Am. Chem. Soc. 2014, 136, 7261–7264; [DOI] [PubMed] [Google Scholar]
- 11b. Chen L., Zheng H., Zhu X., Lin Z., Guo L., Qiu B., Chen G., Chen Z.-N., Analyst 2013, 138, 3490–3493; [DOI] [PubMed] [Google Scholar]
- 11c. Guo J. F., Li C. M., Hu X. L., Huang C. Z., Li Y. F., RSC Adv. 2014, 4, 9379–9382; [Google Scholar]
- 11d. Zhang H.-T., Zhang J.-W., Huang G., Du Z.-Y., Jiang H.-L., Chem. Commun. 2014, 50, 12069–12072; [DOI] [PubMed] [Google Scholar]
- 11e. Ye T., Liu Y., Luo M., Xiang X., Ji X., Zhou G., He Z., Analyst 2014, 139, 1721–1725. [DOI] [PubMed] [Google Scholar]
- 12. Wu Y., Han J., Xue P., Xu R., Kang Y., Nanoscale 2015, 7, 1753–1759. [DOI] [PubMed] [Google Scholar]
- 13. Rijnaarts T., Mejia-Ariza R., Egberink R. J. M., van Roosmalen W., Huskens J., Chem. Eur. J. 2015, 21, 10296–10301. [DOI] [PubMed] [Google Scholar]
- 14.
- 14a. Horcajada P., Salles F., Wuttke S., Devic T., Heurtaux D., Maurin G., Vimont A., Daturi M., David O., Magnier E., Stock N., Filinchuk Y., Popov D., Riekel C., Férey G., Serre C., J. Am. Chem. Soc. 2011, 133, 17839–17847; [DOI] [PubMed] [Google Scholar]
- 14b. Tamames-Tabar C., Cunha D., Imbuluzqueta E., Ragon F., Serre C., Blanco-Prieto M. J., Horcajada P., J. Mater. Chem. B 2014, 2, 262–271. [DOI] [PubMed] [Google Scholar]
- 15. Mejia-Ariza R., Huskens J., J. Mater. Chem. B 2016, 4, 1108–1115. [DOI] [PubMed] [Google Scholar]
- 16.
- 16a. D′Agata R., Corradini R., Ferretti C., Zanoli L., Gatti M., Marchelli R., Spoto G., Biosens. Bioelectron. 2010, 25, 2095–2100; [DOI] [PubMed] [Google Scholar]
- 16b. Bertucci A., Manicardi A., Candiani A., Giannetti S., Cucinotta A., Spoto G., Konstantaki M., Pissadakis S., Selleri S., Corradini R., Biosens. Bioelectron. 2015, 63, 248–254. [DOI] [PubMed] [Google Scholar]
Associated Data
This section collects any data citations, data availability statements, or supplementary materials included in this article.
Supplementary Materials
As a service to our authors and readers, this journal provides supporting information supplied by the authors. Such materials are peer reviewed and may be re‐organized for online delivery, but are not copy‐edited or typeset. Technical support issues arising from supporting information (other than missing files) should be addressed to the authors.
Supplementary


