Abstract
The genome of pancreatic ductal adenocarcinoma (PDAC) frequently contains deletions of tumour suppressor gene loci, most notably SMAD4, which is homozygously deleted in nearly one-third of cases1. As loss of neighbouring housekeeping genes can confer collateral lethality, we sought to determine whether loss of the metabolic gene malic enzyme2 (ME2) in the SMAD4 locus would create cancer-specific metabolic vulnerability upon targeting of its paralogous isoform ME3. The mitochondrial malic enzymes (ME2 and ME3) are oxidative decarboxylases that catalyse malate to pyruvate and are essential for NADPH regeneration and reactive oxygen species homeostasis2,3. Here we show that ME3 depletion selectively kills ME2-null PDAC cells in a manner consistent with an essential function for ME3 in ME2-null cancer cells. Mechanistically, integrated metabolomic and molecular investigation of mitochondrial malic enzyme-deficient cells revealed diminished NADPH production and consequent high levels of reactive oxygen species. These changes activate AMP activated protein kinase (AMPK), which in turn directly suppresses sterol regulatory element-binding protein 1 (SREBP1)-directed transcription of its direct targets including the BCAT2 (branched chain amino acid transaminase 2) gene. BCAT2 catalyses the transfer of the amino group from branched chain amino acids to α-ketoglutarate (α–KG)4thereby regenerating glutamate, which functions in part to support de novo nucleotide synthesis. Thus, mitochondrial malic enzyme deficiency, which results in impaired NADPH production, provides a prime ‘collateral lethality’ therapeutic strategy for the treatment of a substantial fraction of patients suffering from this intractable disease.
The paucity of therapeutically actionable oncogene mutations and the frequent occurrence of tumour suppressor gene deletions in PDAC prompted us to assess cancer-specific vulnerabilities incurred by deletion of passenger genes encoding essential cellular functions. In this ‘collateral lethality’ framework5, cancer cells tolerate deletion of critical housekeeping genes owing to the co-expression of functionally redundant paralogues that maintain these essential cellular reactions6.
Chromosomal region 18q21, which contains SMAD4, is homozygously deleted in a large fraction of human solid tumours1 (Fig. 1a, Extended Data Fig. 1a, b). This region also harbours multiple housekeeping genes including ME2, which is often deleted along with SMAD4 (Fig. 1b, Extended Data Fig. 1c–e). Analyses of the copy number (Fig.1c)and expression (Extended Data Fig. 1f) of ME2 and SMAD4 show a strong positive correlation. PDAC TCGA copy-number and transcriptomic analyses (n = 185) and a study of microdissected PDAC samples (n = 109)7have revealed homozygous deletion of SMAD4 in 14% (25 of 185) and 29% (32 of 109) of tumours, respectively, with ME2 deletion in 64% (16 of 25, homozygous deletion) and 96% (31 of 32, homozygous deletion) of these SMAD4-deleted cases, respectively (Fig. 1d, e, Extended Data Fig. 1g). Exclusion of stromal content in the microdissection study is likely to account for the higher codeletion of SMAD4 and ME2 in this study. Furthermore, immunohistochemistry (IHC) analysis of ME2 and SMAD4 expression in 62 PDAC and 77 matched normal samples revealed corresponding loss of both proteins in 37% of PDAC cases (Extended Data Fig. 1h–k). Beyond PDAC, homozygous deletion of ME2 occurs in many other cancers (Fig. 1e).
Figure 1. ME2 is a passenger deletion in patients with PDAC.
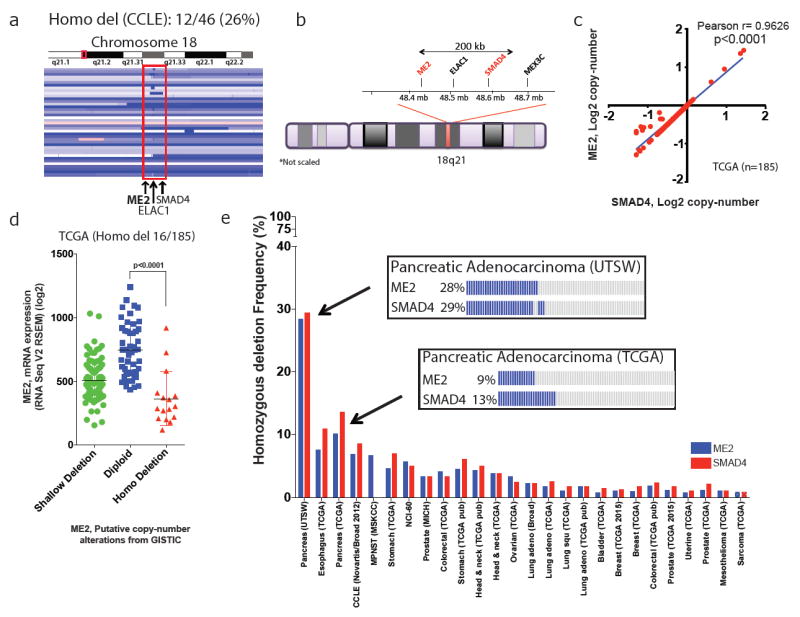
a, Interactive genome viewer (IGV) image of chromosome 18 encompassing region q21 of PDAC cell lines from CCLE data set. Twelve of 46 PDAC samples had homozygous deletion of ME2. b, Ideogram of chromosome 18 showing close proximity (<200 kb) of ME2 to SMAD4. c, Correlation of copy-number alterations (CNA) between SMAD4 and ME2 in PDAC samples. d, ME2 deletion events in PDAC samples (TCGA) showing a correlation between CNA and mRNA expression. Homozygous deletion in 16 of 185 samples. e, Frequency of ME2 and SMAD4 deletion in multiple solid tumours (cBioportal). Boxes detail ME2 and SMAD4 deletion frequency from UTSW and TCGA PDAC datasets. adeno, adenocarcinoma; DLBC, Diffuse large B-cell lymphoma; MPNST, Malignant Peripheral Nerve Sheath Tumors; NEPC, Neuroedocrine prostate cancer.
The family of malic enzymes consists of three isoforms: a cytosolic NADP+-dependent isoform (ME1) and two redundant mitochondrial NAD(P)+-dependent isoforms (ME2 and ME3)2,3. In normal cells and most cancer cells, ME2 is the main isoform in mitochondria and has higher abundance and enzymatic activity compared to ME3 (ref. 3). However, in the absence of ME2, ME3 presumably sustains essential NADPH synthesis in mitochondria.
To test the hypothesis that ME3 enables survival of ME2-deficient cells, we identified 12 lines with homozygous deletion of ME2 from the 46 PDAC cell lines in the Cancer Cell Line Encyclopedia (CCLE) database (Fig. 1a). We validated and used four ME2 homozygous null (hereafter ME2-null) (Panc05.04, Hs766T, PATU8988T, BxPC3) and five ME2-intact (PATU8902, ASPC1, KP-1NL, PK59, Panc1) cell lines (Fig. 2a, b). Consistent with the cell-essential and redundant function of malic enzymes in mitochondria, we observed a compensatory increase in ME3 expression in ME2-null cell lines (Fig. 2b). Similar observations were made in matched normal and PDAC samples, which showed an increase in ME3 expression (59%, 37 out of 62), and in the CCLE database, where there is a gain at the ME3 locus (65%, 30 out of 46) (Extended Data Fig. 2a–c). Overall, these findings suggest that mitochondrial malic enzymes have redundant and cell-essential roles, prompting us to hypothesize that collateral lethality would result from depletion of ME3 in ME2-deleted PDAC cells.
Figure 2. Depletion of ME3 leads to collateral lethality in ME2-null PDAC cells.
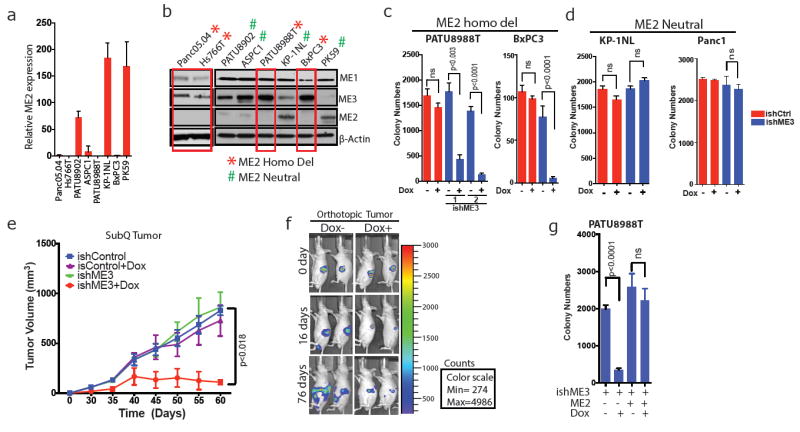
a, Relative ME2 mRNA expression determined by qRT–PCR in ME2-null and ME2-intact PDAC cell lines. b, Immunoblots of ME1, ME2 and ME3 expression in ME2-null (red boxes) and ME2-intact PDAC cell lines. β-Actin used as loading control. c, d, Quantification of colony formation assay of ME2-null PATU8988T and BxPC3 cell lines (c) and ME2-intact KP-1NL and Panc1 cell lines (d) upon ME3 depletion by addition of dox to cells expressing control ishRNA (ishCtrl) or ishRNA targeting ME3 (ishME3). e, Tumour volume progression of xenografted subcutaneous PATU8988T (ishCtrl ± dox and ishME3 ± dox) cells (n=5, each group). Colour scale, minimum 274, maximum 4,986. f, Representative luciferase imaging of orthotopic PDAC tumours in nude mice with and without dox (n = 5, each group). g, Colony formation of PATU8988T cells rescued by overexpression of ME2. All error bars represent s.d. of at least three replicates. P values determined by two-tailed t-test.
We surmised that ME1 might not be a viable collateral lethality target, as ME1 is expressed solely in the cytosolic compartment and is essential for biosynthetic pathways such as fatty acid biosynthesis, supplying NADPH to both cancer and normal cells. Indeed, ME1 proved to be essential for the survival of both PDAC cells and normal fibroblasts, as evidenced by increased cell death upon either short hairpin (sh)RNA or doxycycline (dox)-inducible short hairpin (ish)RNA-mediated knockdown of ME1in both ME2-null (PATU8988T) and ME2-intact (KP-1NL, NHDF-Neo) cell lines (Extended Data Fig. 2d–l).
We tested the effect of ME3 depletion as a collateral lethal target in the ME2-null context using dox-inducible shRNA in ME2-null and ME2-intact cells. Specifically, dox-induction of ME3 shRNA decreased colony formation and proliferation (Fig. 2c, d, Extended Data Fig. 3a–m) and profoundly impaired tumour growth and increased survival in subcutaneous and orthotopic models of ME2-null PDAC tumours (Fig. 2e, f, Extended Data Fig. 3n–r). Inhibition of tumour growth was accompanied by significantly reduced cell proliferation and increased cell death (Extended Data Fig. 4a, b), which was consistent with the identification of enriched cell proliferation and cell death pathways by RNA sequencing (RNA-seq) and Ingenuity Pathway Analysis (Extended Data Fig. 4c, d). Moreover, in vitro apoptosis assays of ME3-depleted cells showed increased annexin V-positive cells when compared with control cells (Extended Data Fig. 5a, b). Finally, these anti-tumour phenotypes were alleviated by ectopic expression of ME2 in mitochondrial ME3-depleted cells (Fig. 2g, Extended Data Fig. 5c–g), thus establishing that the paralogous ME3 isoform has a compensatory function in ME2-deleted PDAC cells.
Given the observed alterations in PGC1α and TCA cycle expression signatures (Extended Data Fig. 5h, i) following ME3 depletion in ME2-null PDAC cells, and the established function of malic enzymes in mitochondrial redox balance, we sought to confirm the role of malic enzymes in the maintenance of mitochondrial redox homeostasis in PDAC. We therefore treated ME3-depleted and non-depleted control cells with cell-permeable reduced glutathione (GSH) or antioxidant N-acetylcysteine (NAC). Treatment with either GSH or NAC resulted in partial rescue in colony formation assays, consistent with a function for mitochondrial malic enzymes in redox homeostasis. (Extended Data Fig. 5j), but the partial rescue belied additional non-redox functions of mitochondrial malic enzymes (see below). Indeed, consistent with the role of malic enzymes in converting malate to pyruvate, the addition of 5 mM cell-permeable pyruvate decreased ROS and moderately rescued colony formation (Extended Data Fig. 5k–n).
Mitochondrial malic enzymes are required for maintaining the NADPH pool, matching mitochondrial demand for reducing equivalents to detoxify mitochondrial reactive oxygen species (ROS)8. In addition to the pyruvate study above, we also assessed the utilization of metabolites, especially glucose (Glc) and glutamine (Gln). We have shown previously that Glc and Gln are essential for PDAC cell survival9-10and are key suppliers of TCA cycle intermediates. Metabolic analyses showed that ME3 depletion in ME2-null cells led to an increase in Gln flux via the TCA cycle, as indicated by metabolite isotopomer tracing of ME3-depleted cells using uniformly 13C-labelled Gln ([U-13C5]Gln) as a tracer (Extended Data Fig. 5o, p). The increase in Gln flux via the TCA cycle induced by ME3 depletion indicates that metabolic re-wiring compensates for mitochondrial stress by using an alternate pathway (Gln) to replenish NADPH. Glc flux to lactate and pyruvate was unchanged following ME3 depletion in ME2-null cells, but Glc entry into the TCA cycle was decreased upon depletion of mitochondrial malic enzymes (Extended Data Fig. 6a, b). Similarly, Glc uptake and lactate secretion rates remained unchanged upon ME3 depletion in both ME2-null (Extended Data Fig. 6c–f) and ME2-intact cells (Extended Data Fig. 6l–o). Further functional analysis using Seahorse revealed that depletion of mitochondrial malic enzymes decreased oxygen consumption rate (OCR) compared with ME3 non-depleted controls (Extended Data Fig. 6g). Conversely, the extracellular acidification rate (ECAR), an indirect measurement of glycolysis, was unchanged upon depletion of mitochondrial malic enzymes (Extended Data Fig. 6h). Similarly, we found no change in OCR and ECAR in ME2-intact KP-1NL cells (Extended Data Fig. 6i, j). These data suggest that ME3 depletion leads to inhibition of mitochondrial function. To further validate the effect of ME3 depletion on mitochondrial function, we stained the cells with MitoTracker red, a marker of mitochondrial structure. ME3 depletion in ME2-null cells generated profound changes in mitochondrial structure, resulting in a more globular appearance as seen by MitoTracker red staining (Fig. 3a, Extended Data Fig. 6k). In addition, ME3-depleted cells stained intensely for MitoTracker green, an indicator of mitochondrial biomass (Extended Data Fig. 6p, q). These data were reinforced by transmission electron microscopy (TEM) showing aberrant ring-shaped mitochondria, a feature consistent with ROS-mediated stress (Fig. 3b).
Figure 3. ME3 depletion in ME2-null PDAC cells leads to mitochondrial defects.
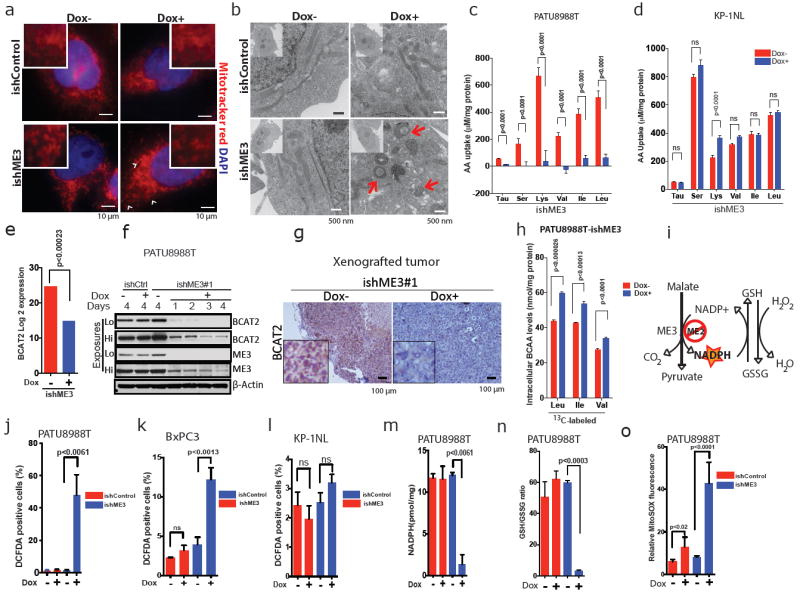
a, MitoTracker red staining in PATU8988T cells (arrow-head shows mitochondrial fission). Scale bar = 10 μm. b, TEM showing aberrant ring-shaped mitochondria (arrows in bottom right). Scale bar = 500 nm. c, d, Measurement of BCAA uptake in PATU8988T (c) and KP-1NL cells (d) (n = 6 each). Error bars represent the s.e.m.e, Log2 expression data of BCAA transaminase 2 (BCAT2) from RNA-seq data. f, Immunoblot of BCAT2 expression time course upon depletion of ME3. β-Actin used as loading control. g, Representative IHC images of BCAT2 in xenograft tumours. Scale bar = 100 μm. h, Plot of intracellular levels of BCAAs in ME3-depleted PATU8988T cells (n = 4). Error bars represent the s.e.m. i, Overview of malic enzyme reaction. J–l, Measurement of total ROS (as 2′,7′-dichlorofluorescin diacetate (DCFDA)-positive cells) in PATU8988T (j), BxPC3 (k) and KP-1NL (l) cells (n = 5 each). m, Measurement of NADPH in PATU8988T cells. n, Measurement of GSH/GSSG ratio in PATU8988T cells. o, Measurement of mitochondria-specific ROS (mitoSOX red) in PATU8988T cells. All error bars represent the s.d. except wherever mentioned otherwise. of at least three replicates from two independent experiments. P values were determined by two-tailed t-test.
As our previous work established that Gln is required for maintenance of redox haemostasis and ultimately for PDAC cell survival11, we sought further to explore the molecular mechanism that leads to mitochondrial dysfunction and ultimately cell death upon ME3 depletion. To that end, we analysed the utilization of amino acids by ME3-depleted cells. We did not observe a change in Gln uptake in either ME3-depleted ME2-null (PATU8988T) or ME3-depleted ME2-intact (KP-1NL) cells by ultra-performance liquid chromatography (UPLC) analysis (Extended Data Fig. 7a, b). However, we observed substantial underutilization of branched-chainamino acids (BCAAs; isoleucine, leucine and valine) upon ME3 depletion in ME2-null cells but not in ME2-intact cells (Fig. 3c, d, Extended Data Fig. 7c, d). BCAAs are important contributors of amino groups to α-KG in the synthesis of glutamic acid (Glu)12 (Extended Data Fig. 8a). Muscles act as an immediate repository of BCAAs, which constitute more than 50% of the amino acid uptake from the circulation13,14. An increase in BCAAs in the circulation is an indication of high protein turnover and muscle breakdown, which are hallmarks of cancer cachexia seen in many patients with PDAC15. Furthermore, BCAA derived from muscle breakdown provides a continuous source of Gln. Collectively, these observations prompted speculation that these systemic metabolic shifts may support PDAC genesis and progression by supplying BCAAs16-18.
Upon ME3 depletion in ME2-null cells, RNA-seq, immunoblot and IHC (Fig. 3e–g, Extended Data Fig. 8b–f) analyses showed substantial downregulation of BCAT2. BCAT2 is a mitochondrial isoform4,19 required for the first step in BCAA catabolism, where the amino group of BCAAs is transferred to α–KG to generate Glu (Extended Data Fig. 8a). Notably, the exocrine pancreas has the highest BCAT2 activity of all tissues19. BCAT2 operates at near equilibrium in most cells, and a small change in its availability can greatly affect BCAA catabolism owing to a decrease in mitochondrial BCAA uptake leading to BCAA accumulation inside the cytosol of ME3-depleted cells13,20,21(Fig. 3h). Next, we sought to elucidate the basis of BCAT2 downregulation. We predicted and confirmed that ME3 depletion in ME2-null cells (but not ME2-intact cells) would result in ROS accumulation, correlating with a reduction in NADPH and reduced glutathione (Fig. 3i–o and Extended Data Fig. 8g–i), which aligned with increased expression of the antioxidant protein regulator NRF2 (Extended Data Fig. 8j, k). Correspondingly, ME2 overexpression restored NADPH levels and decreased ROS (Extended Data Fig. 9a, b). High intracellular ROS is known to induce AMPK22, an established indicator of metabolic stress. AMPK activation (evidenced by phosphorylation of Thr172)23 was observed upon ME3 depletion (Fig. 4a). Transient expression of kinase-dead AMPK (T172A) largely abolished the effect of ME3 depletion on BCAT2 expression (Fig. 4b). Moreover, ME2 overexpression rescued BCAT2 expression in ME3-depleted cells (Fig. 4c). Similarly, the anti-oxidants EUK134 (Fig. 4d) and TROLOX (Extended Data Fig. 9c) restored BCAT2 expression. Conversely, pharmacological activation of AMPK using the cell-permeable AMPK activator AICAR led to downregulation of BCAT2 (Extended Data Fig. 9d). Together, these findings demonstrate that elevated ROS activates AMPK, which in turn suppresses BCAT2 expression.
Figure 4. ME3 regulates BCAT2 expression via AMPK and its downstream effectors.
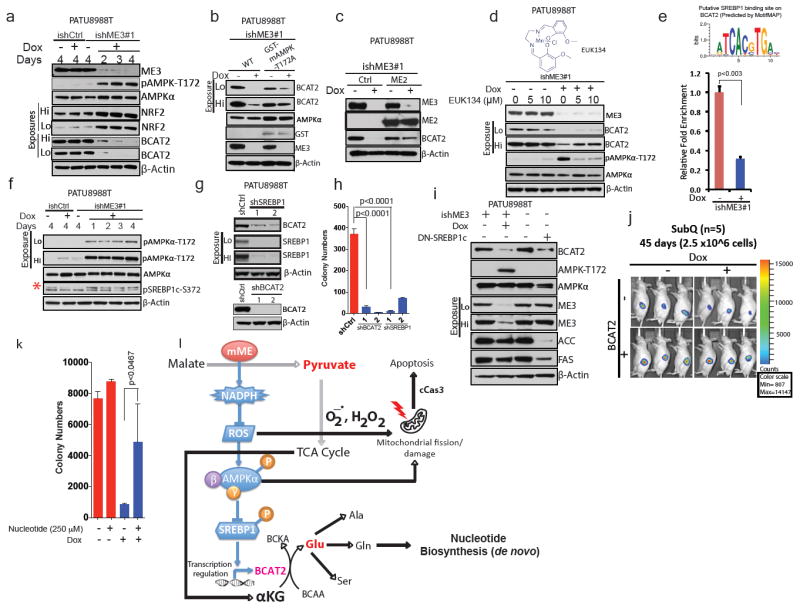
a, Immunoblot assessing activation of AMPK and expression of NRF2 in PATU8988T cells. β-Actin used as loading control. (b) Immunoblot showing rescue of BCAT2 expression using GST-tagged kinase-dead AMPK (T172A) in PATU8988T cells. c, Immunoblot showing rescue of BCAT2 expression by ME2 in PATU8988T cells. d, Immunoblot showing rescue of BCAT2 expression by 24-h treatment with EUK134. e, Top, putative SREBP1-binding site on BCAT2 promoter predicted by MotifMAP. Bottom, chromatin immunoprecipitation (ChIP) analysis of SREBP1 binding to BCAT2 promoter. f, Immunoblot of SREBP1c phosphorylation at S372 in PATU8988T cells (Red asterisk denote the specific band). g, Immunoblot of BCAT2 expression upon shRNA-mediated depletion of SREBP1 (top) and BCAT2 (bottom) in PATU8988T cells. h, Colony formation assay of cells depleted in BCAT2 (shBCAT2) or SREBP1 (shSREBP1). i, Immunoblot assessing BCAT2 expression in PATU8988T cells expressing DN-SREBP1c (Y320A). j, Luciferase images of BCAT2-overexpressing subcutaneous tumours (n = 5 each group) 45 days after implantation of 2.5 × 10⁶ cells. Colour scale, minimum 807, maximum 14,147. k, Rescue of ME3-depleted cells by addition of nucleotides. l, Proposed model of mitochondrial malic enzyme (mME) function. β-Actin used as loading control in all immunoblots. Error bars represent s.d. of at least three replicates. P values determined by two-tailed t-test.
On the mechanistic level, a binding site in the BCAT2 promoter was identified and confirmed for SREBP1c (sterol response element binding protein 1c), a known target regulated by AMPK (Fig. 4e). Activated AMPK inhibits SREBP1 activity24. SREBP1 is a sterol-sensing transcription factor that promotes lipogenesis. Activation of SREBP1 by mTORC1 leads to nuclear translocation of SREBP1 and subsequent transcription of its target genes25, such as the genes encoding acetyl CoA carboxylase and fatty acid synthase (FAS). Thus, AMPK inhibits nuclear translocation of SREBP1 by phosphorylation and thereby suppresses its target genes24. Indeed, depletion of ME3 in ME2-null cells increased SREBP1 phosphorylation (Fig. 4f). Moreover, shRNA-mediated depletion of SREBP1 or BCAT2 (Fig. 4g), both of which decreased BCAT2 expression, led to a comparable decline in colony formation (Fig. 4h, Extended Data Fig. 9e). Transient expression of a dominant-negative SREBP1c26, which disrupts the binding of SREBP1c to the sterol response element (SRE), decreased expression of BCAT2, ACC and FAS (Fig. 4i). In addition, BCAT2 overexpression in ME3-depleted cells (PATU8988T-ishME3) led to aggressive tumour growth, suggesting that PDAC tumours are acutely dependent on BCAAs (Fig. 4j). However, the impact of BCAT2 levels appears to be independent of mitochondrial respiration, as neither BCAT2 knockdown nor overexpression was observed to alter the OCR (Extended Data Fig. 9f, g).
ME3 depletion in ME2-null cells inhibited amino group transfer from BCAA to α–KG; this effect is reminiscent of BCAT2 knockdown, as shown by 15N-labelled BCAA (15N-Leu) tracing (M1 Glu) (Extended Data Fig. 10a). A similar decrease in amino group transfer to synthesize serine (Ser) and alanine (Ala) (non-essential amino acids derived from Glu) was also observed (Extended Data Fig. 10b, c). However, 13C-labelled BCAA flux analysis did not detect changes in TCA cycle flux (Extended Data Fig. 10d). It is known that Gln contributes its amino group to synthesize ammonia required for the de novo synthesis of nucleotides, especially pyrimidine27. Notably, addition of a mixture of nucleotides (adenine, guanine, cytosine, thymine and inosine) rescued colony formation after ME3 depletion in ME2-null cells, indicating that BCAA-derived nucleotide precursors are rate limiting to cell viability (Fig. 4k, Extended Data Fig. 10e). In summary, these findings are consistent with multiple consequences of mitochondrial malic enzyme depletion, including (i) ROS-mediated activation of the AMPK pathway causing a decrease in BCAA breakdown and thereby leading to a decrease in de novo nucleotide biosynthesis, and (ii) ROS-mediated mitochondrial damage leading to activation of apoptotic pathways (Fig. 4l). Overall, our study provides a mechanistic basis for the loss of cancer cell viability upon depletion of mitochondrial malic enzymes.
Here, in an effort to expand therapeutic strategies beyond oncogenic targets to those not directly linked to cancer pathogenesis, we have identified a collateral lethal vulnerability in PDAC that can be targeted pharmacologically in genotype-defined patient populations. Genomic data across many cancers further suggest that this therapeutic strategy may be effective for many patients, including those suffering from gastric and colon cancers. Our work also suggests a mechanism for cell lethality involving the regulation of BCAAs as crucial metabolites in PDAC, under the critical regulation of the mitochondrial malic enzymes. We propose that highly specific ME3 inhibitors could provide an effective therapy for a meaningful fraction of cancer patients.
METHODS
Cell culture
All the cell lines used in this study were purchased from ATCC, used below passage 25 and continuously cultured in 100 U/ml penicillin and 100 U/ml streptomycin. The cell lines were authenticated by short tandem repeat (STR) profiling at the Institute for Applied Cancer Sciences, MD Anderson Cancer Center. The PATU8988T, Hs766T and PATU8902 cell lines were routinely cultured in Dulbecco’s modified Eagle’s medium (DMEM) with 10% fetal bovine serum (FBS) (Invitrogen). AsPc1, BxPC3 and KP-1NL cell lines were routinely cultured in Roswell Park Memorial Institute (RPMI) 1640 (Invitrogen) with 10% FBS, and Panc05.04 cells were routinely cultured in RPMI 1640 with 15% FBS. For metabolic and metabolomic assays, 10% dialysed FBS (Atlanta Biologicals Inc.) was used. For BCAA experiments, DMEM medium without BCAAs was used (United States Biological). NHDF-neo-fibroblasts were cultured in Eagle’s modified medium (EMEM) with 10% FBS. The cell lines were mycoplasma free, based on tests done monthly in the laboratory using Lonza’s MycoAlert Mycoplasma Detection Kit assays with confirmatory tests by PCR-based assays.
Reagents and chemicals
Trolox (Cat. No. 238813) and AICAR (A9978) were purchased from Sigma. EUK134 (Cat. No. 10006329) was purchased from Cayman Chemicals.13C and 15N labelled isotopes were purchased from Cambridge Isotope Laboratories.
siRNA, shRNA and CRISPR knockdown
shRNA knockdown was performed essentially as described previously6. We screened five hairpins targeting ME3 and found three independent sequences that reduced mRNA levels by >60%. Initial hairpin screenings were performed in the pLKO3.1 shRNA vectors (Sigma Aldrich), while actual experiments were performed in the doxycycline-inducible ipLKO3.1 ishRNA vectors (engineered in the laboratory) using the sequences from the pLKO3.1 screening (ME1, ME2 and ME3 only). The ME3ishRNA sequences were as follows: ishME3#1 (CCGGGCTCAACAAATACCGTAACAACTCGAGTTGTTACGGTATTTGTTGAGC TTTTTG), ishME3#2 (CCGGCGTGTCTTTGAGAATTGCCATCTCGAGAT GGCAATTCTCAAAGACACGTTTTTG) and ishME3#3 (CCGGCCTCCGA ATCATGAGATATTACTCGAGTA ATATCTCATGATTCGGAGGTTTTTG). The ME1 shRNA sequences were as follows: ishME1#3 (CCGGGCTGAGGTTA TAGCTCAGCAACTCGAGTTGCTGAGCTATAACCTCAGCTTTTTG) and ishME1#5 (CCGGCCTGTGGGTAAATTGGCTCTACTCGAGTAGAGCCAATTTA CCCACAGGTTTTTG). The SREBP1 shRNA sequences were as follows: shSREBP1#2 (CCGGGCCATCGACTACATTCGCTTTCTCGAGAAAGCGAATGTA GTCGATGGCTTTTT) and shSREBP1#3(CCGGGCTGAATAAATCTGCTGTC TTCTCGAGAAGACAGCAGATTTATTCAGCTTTTT). The BCAT2 shRNA sequences were as follows: shBCAT2#2 (CCGGTGAAGTGCAATACGAAATAA ACTCGAGTTTATTTCGTATTGCACTTCATTTTTG) and shBCAT2#3 (CCGGGT GCACCGAATCCTGTACAAACTCGAGTTTGTACAGGATTCGGTGCACTTTTTG). A non-targeting shRNA (shCtrl) was used as a control. The shRNA-expressing pLKO3.1 vector was introduced into cancer cell lines by lentiviral infection. Recombinant lentiviral particles were produced by transient transfection of 293T cells following a standard protocol. Briefly, 10 μg of the shRNA plasmid, 5 μg of psPAX2 and 2.5 μg of pMD2.G were transfected using polyethylenimine (1 μg/μl, Polysciences # 23966-2) into 293T cells plated in a 100-mm dish. Viral supernatant was collected 72 h after transfection, centrifuged to remove any 293T cells and filtered (0.45 μm). For transduction, viral solutions were added to cell culture medium containing 4 μg/ml polybrene; 48 h after infection, cells were selected using 2 μg/ml puromycin and tested for ME1 and ME3 depletion by RT-qPCR or immunoblotting. siRNA targeting ME3 (Accell SMARTpool) was purchased from Dharmacon and used according to the manufacturer’s protocol. For CRISPR knockdown of ME2, sgRNA were designed based on the recommendations from ref. 28(http://portals.broadinstitute.org/gpp/public/analysis-tools/sgrna-design-v1). The sgRNA were then cloned into pL-CRISPR.EFS.GFP (Addgene#357818)29. The sgRNA sequences are sghME2-A_sense: CACCGCCAATTGTATATACACCGA; sghME2-A_antisense: AAACT CGGTGTATATACAATTGGC; sghME2-B_sense_F:CACCGAGCAGGCAAGAC CAACCGT; sghME2-B_antisense:AAACAC GGTTGGTCTTGCCTGCTC. For inducible CRISPR knockdown of ME3 the following plasmids were obtained from TranOMICS Technologies: three independent ME3 gRNA clones (pCLIP-gRNA-EFS-Blast and pCLIP-gRNA-EFS-ZsGreen), Cas9-Nickase-Puro and pTOL-tetR vectors. The plasmids were virally transduced into cell lines in sequence and the cells were selected for single clones at every step.
MitoTracker analysis
Cells for the assay were grown on or off doxycycline in 100-mm dishes for 72 h. Twenty-thousand cells per 96 well were seeded for the flow cytometry and microplate spectrophotometry-based assay. On the next day, the medium was removed, and pre-warmed (37 °C) staining solution containing 50 nM MitoTracker probes was added and incubated for 45 min at 37 °C. After staining was completed, the staining solution was replaced with fresh pre-warmed HBSS/Ca/Mg buffer. The cells were then trypsinized with 20 μl trypsin for 5 min at 37 °C and transferred to a round-bottomed 96-well plate. The plate was centrifuged and cells washed with 150 μl cold DMEM (no FBS). The pelleted cells were resuspended in 150 μl cold DMEM (no FBS) for flow analysis. MitoTracker fluorescence was analysed by flow cytometry (BD Fortessa) using the following channel: MitoTracker green FM: Ex 490/Em 516, FITC channel and MitoTracker Red CMXRos: Ex 579/Em 599, PE or PE-Texas red Channel. Ten-thousand cells per 150 μl medium were recorded by Fortessa. Data are expressed as relative fluorescence intensity (RFI) of the mean fluorescent signal versus unstained samples.
Ectopic expression of ME2, ME3, SREBP1, AMPK and BCAT2
Rescue of the phenotypic effects of knocking down ME3 in PATU8988T cells was performed by re-expression of ME2 from an ectopic plasmid (CMV-ME2). For the ectopic re-expression of ME2, sequenced-verified cDNA (Orfeome) clones were Gateway cloned into the pHAGE-CMV lentiviral vector and transduced into PDAC cell lines as described above. Successful re-expression of ME2 was verified by immunoblotting. For ectopic expression of ME3 (pCMV6-XL5-ME3, SC115951), SREBP1 (pCMV6-XL6, SC117502) and BCAT2 (pCMV6-AC-BCAT2, SC319477), cDNA clones were purchased from Origene and transiently transfected according to the manufacturer’s protocol. GST-tagged constitutively active rat AMPK (amino acids 1–312) and its kinase-dead mutant (T172A) was a gift from J. Chen (MD Anderson). pSV Sport SREBP1c dominant negative was a gift from B. Spiegelman (Addgene plasmid # 8885). pLKO-puro FLAG SREBP1 was a gift from D.Sabatini (Addgene plasmid # 32017). Transient transfection of PATU8988T, Panc1 and 293T cells was done using FuGENE HD (Promega) following the manufacturer’s protocol.
Proliferation and colony-formation assays
Cell growth of shRNA-treated cell lines was assayed either through crystal violet staining or by live-cell confluence measurement with IncuCyte (Essen BioScience). Growth curves using IncuCyte were generated by confluence imaging every 2 h with quadruplicate replicates of an initial seeding of 300 cells per well in 96-well plates. For colony formation assays, 300 cells were seeded in 6-well plates. At the indicated time point (usually 2 weeks), cells were fixed with 80% methanol and stained with crystal violet solution overnight. All experiments were performed in triplicate.
Immunoblotting and antibodies
Cells were washed twice in ice-cold phosphate-buffered saline (PBS), scraped and collected as pellets after centrifugation at 4,000 rpm for 5 min. The pelleted cells were incubated in RIPA buffer with proteinase and phosphatase inhibitor for 15 min. Lysates were then collected and centrifuged at 14,000 rpm for 15 min at 4 °C. Protein concentrations were measured using the DC Protein Assay Kit (Biorad, Cat. No. 5000111). SDS–PAGE and immunoblotting were performed as described previously in pre-cast bis-Tris 4–20% gradient gel (Invitrogen)6. The following antibodies were used: ME1 (Santa Cruz, sc-100569); ME2 (Santa Cruz, sc-85051; Abcam, ab139686); ME3 (Abcam, ab172972); AMPK (Cell Signalling Technologies (CST), 5831P); phospho-AMPK Thr172 (CST, 2535); BCAT2 (CST, 9432S);phospho-SREBP1c (CST, 9874S); NRF2 (CST, 12721); pACC (CST, 11818); ACC (CST, 3662); FAS (CST, 3180); SREBP1 (BD, 557036); GST (Abcam, 19256); and β-Actin (Sigma-Aldrich, A2228).
Immunohistochemistry and immunofluorescence
Tissues were fixed in 10% formalin overnight and embedded in paraffin. IHC was performed as described previously30. Briefly, endogenous peroxidases were inactivated by 3% hydrogen peroxide. Non-specific signals were blocked using 3% BSA, 10% goat serum in 0.1% Triton X-100. Tumour samples were stained with the following primary antibodies: ME2 (Sigma Prestige, HPA008247), ME3 (Sigma Prestige, HPA038473), SMAD4 (Santa Cruz, sc-7966), BCAT2 (Abcam, ab197917), Ki67 (Vector Laboratory, VP-RM04) and cleaved caspase 3 (CST, 9661). After overnight incubation, the slides were washed and incubated with secondary antibody (HRP-polymers, Biocare Medical) for 30 min at room temperature. The slides were washed three times and stained with DAB substrate (ThermoFisher Scientific). The slides were then counterstained with haematoxylin and mounted with mounting medium.
Human PDAC primary tumour samples
PDAC samples were obtained from MD Anderson Cancer Center’s tissue Biobank. The samples were stained using the standard IHC protocol. The antibodies used were ME2 (Sigma Prestige, HPA008247) and ME3 (Sigma Prestige, HPA038473). SMAD4 (Santa Cruz, sc-7966,) antibody staining was conducted using a CLIA-certified protocol and reagents. The stained samples were imaged using Pannoramic 250 slide scanner and data analysed using Pannoramic viewer software (3DHISTECH Ltd) by two independent pathologists. Human studies were approved by The UT MD Anderson Cancer Center’s institutional review board (IRB protocol number: LAB05-0854) and informed consent was obtained from all subjects.
Chromatin immunoprecipitation
ChIP was performed as described previously31using SREBP1 antibody (Santa Cruz, sc-367x). Briefly, 5 μg rabbit IgG (Santa Cruz) or SREBP1 antibody was incubated with Protein A Dynabead magnetic beads (Invitrogen) for 4 h, followed by extensive washing to remove unbound antibody. Antibody beads were then added to the chromatin and incubated overnight. The ChIP primers were purchased from Qiagen (EpiTect ChIP PCR assay) and used for qPCR analysis: BCAT2 (GPH1020848(+)03A).
Transcriptomic profiling by RNA-seq and qRT–PCR
RNA was isolated from tissues using Trizol extraction followed by purification with the Qiagen RNAeasy kit as described previously32,33. RNA-seq was performed by the Sequencing and Microarray Facility (SMF) core at MD Anderson. Libraries were generated using Illumina’s TruSeq kit and were sequenced using the Illumina HiSeq2000 Sequencer. Raw read RNA-seq data were mapped to the hg19 reference genome using Bowtie34. The mapped reads were then assembled by Cufflinks35to generate a transcriptome assembly for each sample. After the assembly phase, Cufflinks quantified the expression of the transcriptome in each gene for each sample (that is, FPKM, fragments per kilobase of transcript per million fragments mapped). For qRT–PCR, RNA samples were reverse transcribed into cDNA using the High-Capacity cDNA Reverse Transcript kit (Life Technologies). cDNA samples were subjected to qRT–PCR quantification in duplicate and performed with Power SYBR Green PCR Master Mix (Invitrogen) according to the product guides on a Agilent Mx3005P and Applied Biosystems AB7500 Fast Real Time machine.
The primer sequences used for real-time qRT–PCR are the following: ME2 (Fwd 5′ ATTAGTGACAGTGTTTTCCTA 3′, Rev 5′ CTATTCTGTTATCACAGG 3′), BCAT2 (Fwd 5′ CTCTGGGGCAGCTGTTTGA 3′, Rev 5′ ATAACACCATTCAGCGGGGG 3′).
Stable isotope analysis using GC-MS
Metabolite extraction
Cells were cultured in 6-well plates overnight and treated the next day with doxycycline for 72 h. Cells were then cultured in the presence of carbon- or nitrogen-labelled isotope tracers for 24 h. The medium was removed and cells were washed with ice-cold PBS solution. Next, cells were quenched with 400 μl methanol and 400 μl water containing 1 μl norvaline, scraped, washed with 800 μl ice-cold chloroform, vortexed at 4 °C for 30 min and centrifuged at 7,300 rpm for 10 min at 4 °C. The upper aqueous phase was collected for metabolite analysis.
Derivatization
Samples were first dried using a Speedvac, followed by the addition of 30 μl of 2% methoxyamine hydrochloride in pyridine (Pierce) and sonication for 15 min. Samples were then kept at 37 °C for 2 h, then at 55 °C for 1 h following the addition of 45 μl MBTSTFA + 1% TBDMCS (Pierce). Samples were next transferred to vials equipped with inserts.
GC-MS measurements
Metabolites were analysed using an Agilent 6890 GC equipped with a 30-m Rtx-5 capillary column connected to an Agilent 5975B MS operating under electron impact ionization at 70 eV. Samples were injected at 1 μl and 270 °C in splitless mode, and helium was used as the carrier gas at 1 ml/min. The heating cycle for the GC oven was as follows: 100 °C for 3 min, followed by 300 °C at 5 °C/min temperature increase, for a total run time of 48 min per sample. Data were acquired in scan mode and the integrated signal of all potentially labelled ions was normalized by the norvaline signal and used to calculate the abundance of relative metabolites. The mass isotopomer distribution was obtained by dividing the signal of each isotopomer by the sum of all isotopomer signals, corrected for natural abundance.
Oxygen consumption and glycolytic capacity
PDAC cells (PATU8988T and KP-1NL) were plated into XF Cell Culture Microplates (Seahorse Bioscience) overnight at 37 °C and 5% CO2. The next day, cells were treated with doxycycline for 72 h. To measure OCR and ECAR, media were replaced in the Seahorse microplates with assay medium free of sodium bicarbonate and FBS, and the plate was incubated in a CO2-free incubator for 1 h at 37 °C. Oligomycin, FCCP, and rotenone were sequentially injected at a final concentration of 2 μg/ml, 1 μM and 1 μM, respectively. Experiments were run using an XF analyser and raw data were normalized with total protein measured in each well of the microplate.
Glucose uptake and lactate production
Glucose uptake and lactate secretion were measured using Wako Glucose kit and Trinity Lactate kit, respectively. Briefly, 200 μl of reconstituted Wako glucose reagent or lactate reagent were added to a 96-well plate and mixed with 10-μl samples that were diluted 1:10 in PBS. To measure glucose uptake, the plate was incubated for 15 min at 37 °C, and the change in absorbance was recorded using a spectrophotometer (SpectraMax M5, Molecular Devices) at 505 nm. For lactate measurement, the plate was incubated for 1 h at 37 °C and absorbance was read at 540 nm. Raw data were normalized to total protein per well.
Amino acid uptake
Amino acid uptake and secretion rates were measured using UPLC (Waters Acquity). Briefly, cells were seeded in 12-well plates and treated for 72 h with doxycycline. Spent media were collected, deproteinized and mixed with MassTrak Reagent and Borate Buffer/NaOH. Samples were heated at 55 °C for 10 min and analysed using the Water ACI UPLC system. Instrument eluents were prepared according to protocol and eluents were run at 0.4 ml/min with UV detection set at 260 nm.
Pyruvate and nucleotide rescue experiments
For the pyruvate rescue experiment, 5 mM sodium pyruvate or methyl pyruvate were added to DMEM with 10% Tet-free FBS. The medium also lacked glucose and glutamine, and was supplemented with 25 mM glucose and 2 mM glutamine wherever required. For the nucleotide experiment, 250 μM mixture (adenine, guanine, cytosine, thymine and inosine) was supplemented directly into complete DMEM with 10% Tet-free FBS.
Chromogenic spectrophotometric NADPH assay
NADPH was measured using the NADP/NADPH assay kit (Abcam) following the manufacturer’s protocol. Briefly, 4 × 10⁶ cells were harvested in cold PBS and extracted using extraction buffer by two freeze–thaw cycles (20 min on dry ice followed by 10 min at room temperature). The samples were vortexed and centrifuged at 14,000 rpm for 5 min. The extracted samples were centrifuged at 14,000 rpm and the supernatant transferred to a new tube. NADP/NADPH inhibiting enzymes were removed using 10 kD Spin Column (Abcam, ab93349). NADPH and total NADP were measured upon decomposition of NADP by heating at 65 °C. Multiple readings were taken at OD450 followed by calculation of total NADP and NADPH.
Malic enzyme activity assay
Malic enzyme activity was quantified in native, non-denatured lysates of cancer cell lines following the method of Orsomando et al.36, with slight modifications. Native lysates were prepared with 20 mM Tris (pH 7.4), 1 mM EDTA and 1 mM β-mercaptoethanol6. After scraping, cells were broken by sonication and lysates cleared by centrifugation at 15,000 rpm for 15 min. Protein concentration was determined and normalized across samples. The reference assay mixture (0.4 ml final volume) contained 100 mM triethanolamine, pH 7.5, 25 mM MgCl2, 20 mM NaF, 1 mM both NMN and ATP, and 100 μg of cell lysate. In this assay, malate and NADP are converted to NADPH, which was left to run for 30 min; after this incubation, the assay was stopped and NAD+ was measured using the spectrophotometric chromogenic assay described in the section above. Controls included samples with lysis buffer only and reaction buffer (which omits malate).
Subcutaneous and orthotopic tumour formation
All animal procedures were approved by the MD Anderson Animal Care and Use Committee (IACUC Protocol number 00001039). Subcutaneous tumours were established by injection of 500,000 cells into the flanks of immune-compromised male mice (Taconic), aged 4–6 weeks. These experiments were not randomized, and the investigators were not blinded to allocation during experiments and outcome assessment. No statistical method was used to predetermine sample size. The animal sizes for the study were estimated based on previous experience using similar mouse models that showed significance. Animals were killed for humane reasons when tumours were ~15 mm in diameter. Doxycycline was provided to the animals as indicated in the form of dox water (dox 2mg/ml, sucrose 40 mg/ml) starting 2 days after transplantation. For late induction of ME3ishRNA, dox water was started 32 days after transplantation. For orthotopic pancreas transplantation, nude mice were anaesthetized using ketamine/xylazine. An incision was made in the left abdomen and the pancreas was gently pulled out along with the spleen. Luciferase-expressing cells were slowly injected into the tail of the pancreas using a Hamilton syringe. 5 μl cells (5 × 10⁵) mixed with 5 μl Matrigel were injected. For the orthotopic model, animals were imaged (IVIS Spectrum, PerkinElmer) 2 days after surgery to assess successful implantation of the tumours. Only orthotopic tumours of similar luciferase intensity were used further for the study. These criteria were pre-established. Furthermore, the animals were luciferase imaged to monitor the progress of the tumour at different time points. Dox water treatment was started 2 days after transplantation.
Measurement of total and mitochondrial ROS
A DCFDA cellular ROS detection assay (ThermoFisher Scientific) was used to measure total ROS activity within the cells. A total of 2.5 × 10⁴ cells per well were seeded on a 96-well plate and allowed to attach overnight. The cells were then stained with 25 μM DCFDA for 45 min at 37 °C. After staining, the cells were washed and measured using flow cytometry. 100 μM tert-butyl hydroperoxide (TBHP) was used as a positive control. For measurement of mitochondrial ROS, MitoSOX red mitochondrial superoxide (ThermoFisher Scientific, M36008) was used according to the manufacturer’s protocol. In brief, a total of 2.5 × 10⁴ cells per well was seeded on a 96-well plate and allowed to attach overnight. The cells were then stained with 5 μM MitoSOX for 10 min at 37 °C. After staining, the cells were washed and measured using flow cytometry.
Transmission electron microscopy (TEM)
TEM was performed at MD Anderson’s High Resolution Electron Microscopy Facility. Samples were fixed with a solution containing 3% glutaraldehyde plus 2% paraformaldehyde in 0.1 M cacodylate buffer, pH 7.3, for 1 h. After fixation, the samples were washed and treated with 0.1% Millipore-filtered cacodylate buffered tannic acid, postfixed with 1% buffered osmium tetroxide for 30 min, and stained en bloc with 1% Millipore-filtered uranyl acetate. The samples were dehydrated in increasing concentrations of ethanol, infiltrated and embedded in LX-112 medium. The samples were polymerized in a 60 °C oven for 2 days. Ultrathin sections were cut in a Leica Ultracut microtome, stained with uranyl acetate and lead citrate in a Leica EM Stainer and examined in a JEM 1010 transmission electron microscope (JEOL, USA, Inc.) at an accelerating voltage of 80 kV. Digital images were obtained using an AMT Imaging System (Advanced Microscopy Techniques Corp).
Statistical analysis
Graphpad Prism software was used to conduct the statistical analysis of all data, except for qPCR, stable isotope tracing, amino acids utilization and Seahorse data where Microsoft Excel was used. Data are presented as mean ± s.d. except for metabolic and metabolomic experiments where data are presented as mean ± s.e.m. All quantitative results were assessed by unpaired Student’s t-test after confirming that the data met appropriate assumptions (normality and independent sampling). The Student’s t-test assumed two-tailed distributions to calculate statistical significance between groups. Unless otherwise indicated, for all in vitro experiments, three technical replicates were analysed. Sample size estimation was done taking into consideration previous experience with animal strains, assay sensitivity and tissue collection methodology used. For mouse and clinical studies, the staining intensity of tissue sections was scored in a ‘blinded’ manner by two independent pathologists. Animal survival benefit was determined by Kaplan Meier analysis. P < 0.05 was considered statistically significant and the P value is indicated in the figures.
Data availability
The RNA-seq data have been submitted to the Gene Expression Omnibus under accession number GSE80411. All other raw data generated or analysed during this study are included in this published article (and its Supplementary Information files).
Extended Data
Extended Data Fig. 1. ME2 is codeleted with SMAD4 in pancreatic cancer.
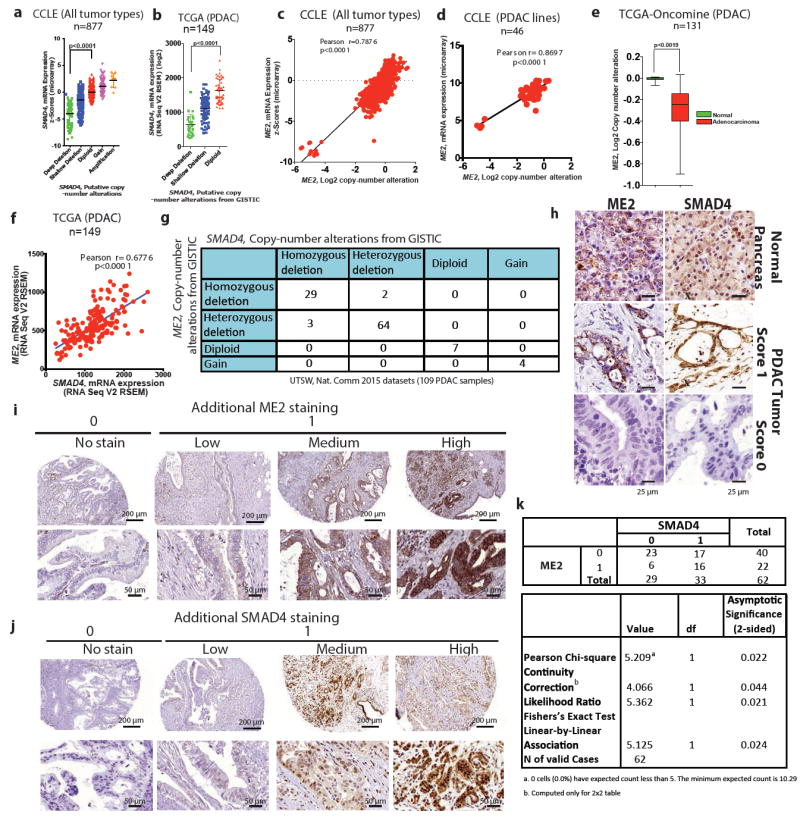
a, b, Scatterplots of SMAD4 mRNA expression against log2 CNA of all tumour types from CCLE datasets (a; n = 877), and PDAC samples in TCGA (b; n = 149). c, d, Scatterplots of ME2 mRNA expression against log2 CNA of all tumour types from CCLE datasets (c; n = 877) and PDAC samples from CCLE datasets (d; n = 46). e, log2 CNA of ME2 in TCGA PDAC database analysed by Oncomine (n = 131). f, Correlation between mRNA expression of ME2 and SMAD4 in TCGA PDAC database (n = 149). g, CNA of ME2 and SMAD4 in UTSW microdissected PDAC samples (Nature Communication data sets, 2015)7(n = 109) as reported by cBioportal were current in August 2016. h, Representative IHC images of SMAD4 and ME2 expression in PDAC samples compared with a matching normal pancreas sample. i,j, Additional ME2 (i) and SMAD4 (j) IHC images of PDAC samples. Staining is shown as no stain (score 0) and low-to-high staining (score 1). k, IHC analysis of paired normal and PDAC samples (n = 62) for ME2 and SMAD4 expression. Scoring is based on no expression (score 0) and low-to-high expression (score 1).
Extended Data Figure 2. ME1 and ME3 are paralogous isoformsof ME2.
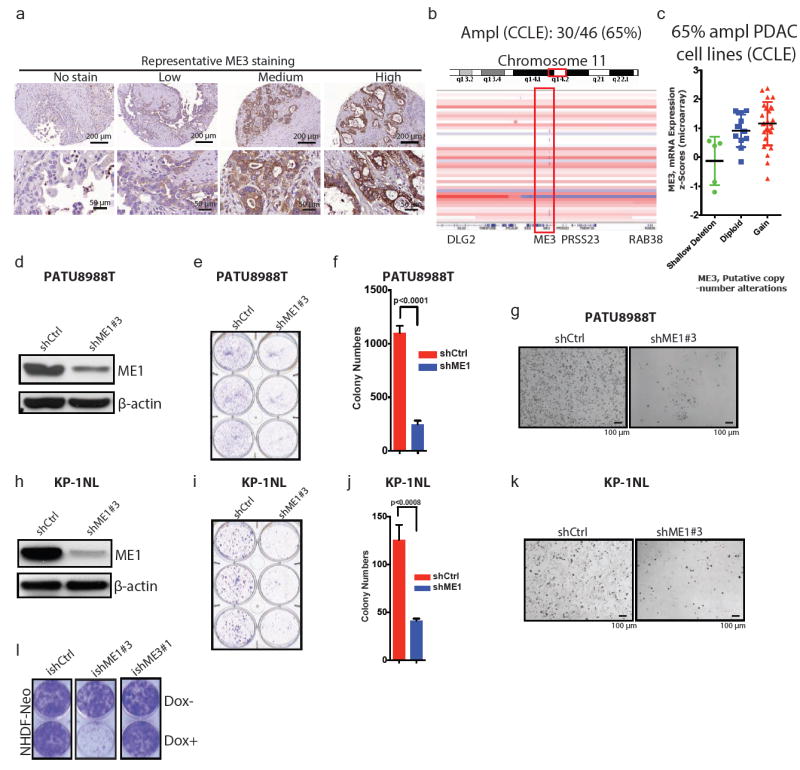
a, Representative IHC images of ME3 in PDAC samples. Staining is shown as no stain or low-to-high staining. b, IGV image of chromosome 11 encompassing region q14 of PDAC cell lines from CCLE (n = 46). c, ME3 mRNA expression against log2 copy number of PDAC lines from CCLE (n = 46). d, Expression of ME1 upon depletion of ME1 in PATU8988T cells. β-Actin used as loading control. e, Colony-formation assay of cell lines corresponding to the immunoblot in d. f, Quantification of the colony-formation assay in e. g, Representative microscopic fields of PATU8988T shCtrl and shME1#3 cells (Scale bar= 100 μm). h, Expression of ME1 upon depletion of ME1 in KP-1NL cells. i, Colony-formation assay corresponding to the immunoblot in h. j, Quantification of the colony-formation assay in i. k, Representative microscopic fields of KP-1NL shCtrl and shME1#3 cells (Scale bar= 100 μm). l, Colony-formation assay of NHDF-Neo cells (skin fibroblast cell line) (ishCtrl ± dox, ishME1#3 ± dox and NHDF-Neo/ishME3#1 ± dox). β-Actin used as loading control. Error bars represent s.d. of at least n = 3 replicates.
Extended Data Figure 3. ME3 depletion in ME2 null cellsleads to growth inhibitiona.
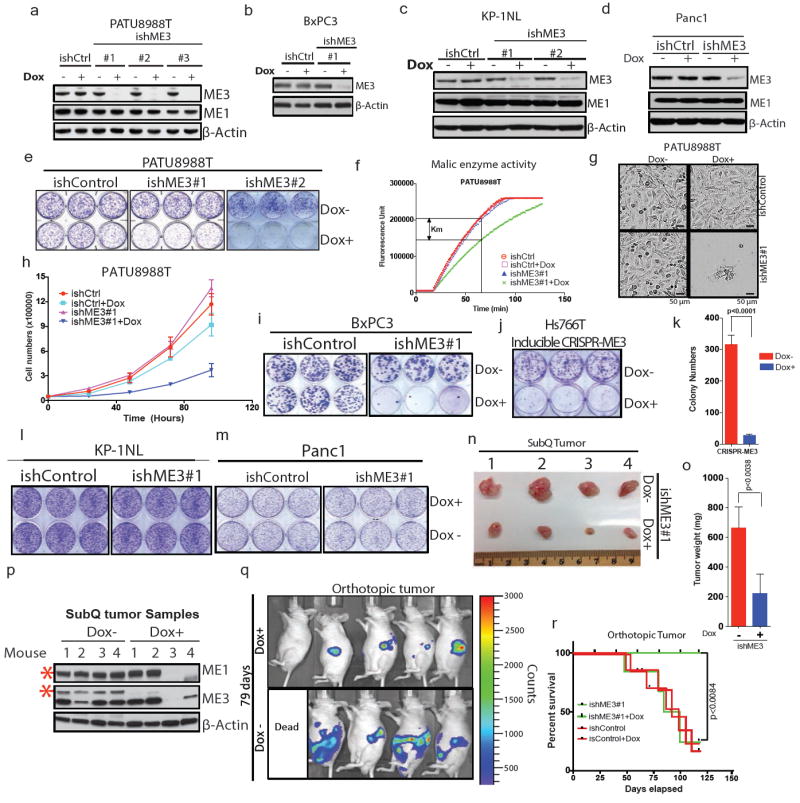
Immunoblot showing expression of ME3 upon depletion with three independent Dox-inducible hairpins or non-targeting inducible control hairpin (ishCtrl) in PATU8988T cells. ME1 expression remained unchanged upon ME3 depletion. b, Expression of ME3 following depletion by ishME3#1 and ishCtrl hairpin in BxPC3 cells (ME2-null). c, Immunoblot of KP-1NL cells (ME2-intact) assessing deletion of ME3 expression. d, Immunoblot of Panc1 cells (ME2-intact) assessing deletion of ME3 expression. e, Raw photos of colony-formation assay upon depletion of ME3 in ME2-null PATU8988T cells. f, Malic enzyme activity assay upon depletion of ME3 in PATU8988T cells. g, Representative microscopic field comparing cell growth between ishCtrl ± Dox and ishME3#1 ± Dox cells (Scale bar= 50 μm). h, Growth curve upon ME3 depletion. i, Raw photos of colony-formation assay upon depletion of ME3 in ME2-null BxPC3 cells. j, Raw photo of colony-formation assay upon inducible CRISPR/Cas9 deletion of ME3 in Hs766T cells. k, Inducible CRISPR/Cas9 deletion of ME3 inhibits colony formation in Hs766T cells. l, m, Raw photos of colony formation assay upon depletion of ME3 in ME2-intact (l) KP-1NL and (m) Panc1 cells. n, o, Raw tumour image after 60 days of tumour growth (n) and graph of mean tumour weights (o) (n = 5). p, Immunoblot of ME3-depleted (dox+) and non-depleted (dox–) xenograft tumour samples confirms complete depletion of ME3. Human-specific ME1 antibody did not detect any remaining ME1 protein in dox+ mouse tumours #3 and #4, indicating no remaining human tumour cells (Red asterisk denote the specific band). β-Actin used as loading control. q, Luciferase imaging (IVIS spectrum) of nude mice 79 days after orthotopic transplantation of PATU8988T-ishME3 cells (±dox). r, Survival data for mice (n = 10 each group) orthotopically grafted with PATU8988T cells (ishCtrl ± dox and ishME3#1 ± dox).
Extended Data Figure 4. Inhibition of ME3 in ME2 null cells affects tumour growth.
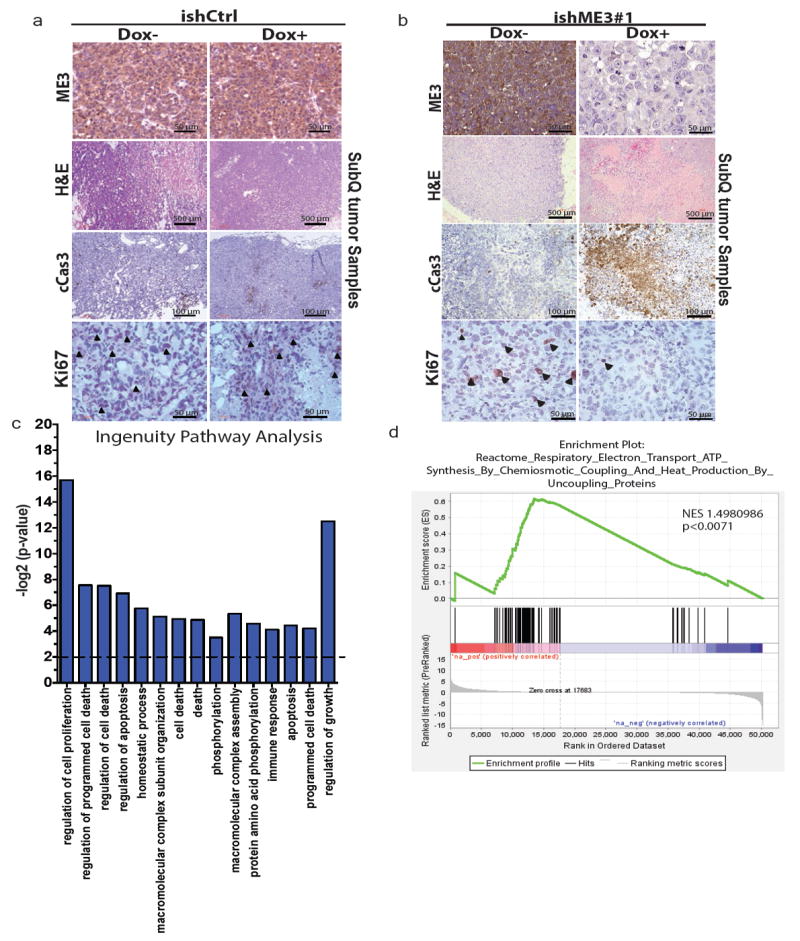
a, b, Representative IHC and haematoxylin and eosin-stained images of xenograft tumour samples of PATU8988T ishCtrl ± dox (a) and ishME3 ± dox (b) cells. Arrowheads indicate Ki67-positive cells. c, Top pathways enriched in ME3-depleted xenograft tumours from Ingenuity pathway analysis of RNA-seq data. d, Electron transport cycle (ETC) pathways are enriched in non-ME3-depleted versus ME3-depleted xenograft tumours as analysed by GSEA.
Extended Data Figure 5. ME3 depletion in ME2 null cells increases apoptosis.
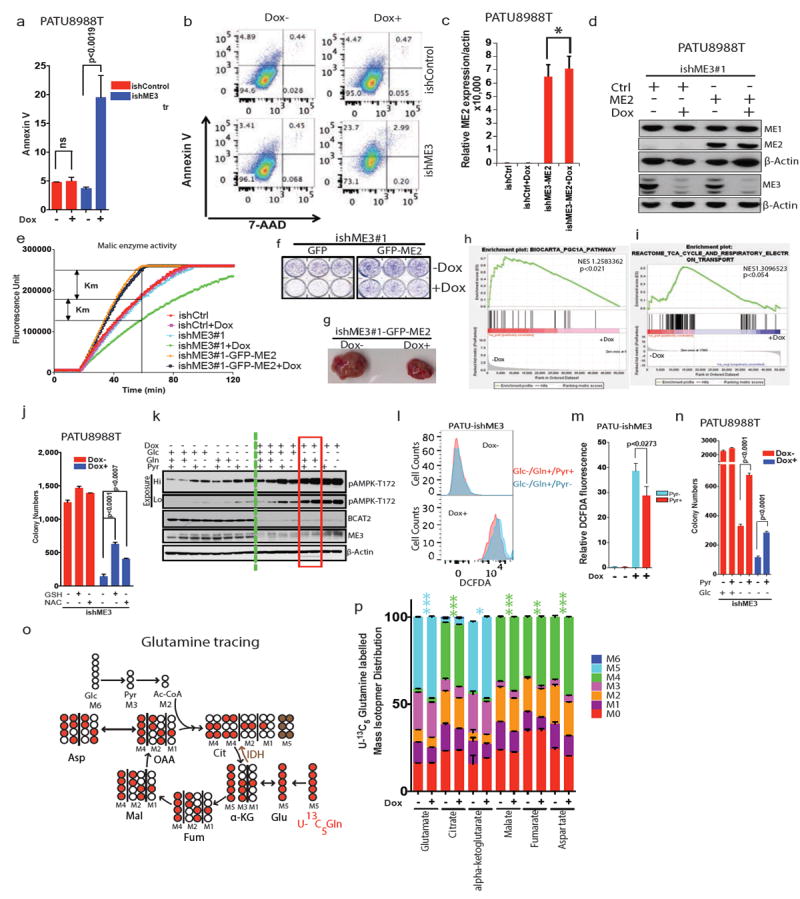
a, Increase in annexin V staining upon ME3 depletion. b, Raw flow cytometric plot of rate of apoptosis using annexin V and propidium iodide staining of PATU8988T cells. c, qRT PCR data showing ME2 (CMV-GFP-ME2) expression in PATU8998T-ishME3#1 cells. d, Immunoblot of overexpression of ME2 in ME3-depleted PATU8988T cells. e, Malic enzyme assay showing the rescue of enzyme activity upon overexpression of ME2 in PATU8998T-ishME3#1 cells. f, Colony-formation assay of cell lines (PATU8998T-ishME3#1-GFP and PATU8998T-ishME3#1-GFP-ME2). g, Representative xenograft tumour photo showing partial rescue of tumour growth upon ME2 overexpression in ME3-depleted cell lines (n = 5, each group). h, GSEA analysis of RNA-seq data showing enrichment of PGC1α signature. i, GSEA analysis of RNA-seq data showing enrichment of TCA cycle signature. j, Colony-formation data for PATU8988T-ishME3 cells rescued with GSH (4 mM) or NAC (4 mM). k, Expression of pAMPK1-T172, BCAT2 and ME3 upon treatment with Glc (10 mM), Gln (2 mM) and/or Pyr (5 mM). l, Raw flow cytometric plot of DCFDA upon rescue with pyruvate (5 mM). m, Relative DCFDA fluorescence upon rescue with pyruvate. n, Colony-formation data for PATU8988T-ishME3 cells rescued with pyruvate (5 mM). o, Mapping of carbon atom transitions using uniformly labelled 13C5-glutamine. p, Mass isotopomer distribution (MID) of uniformly labelled 13C5-glutamine contribution to TCA cycle metabolites. ME3 depletion led to increased glutamine flux into TCA cycle. Error bars represent s.e.m. of n = 4 biological samples from two independent experiments. P values were determined by two-tailed t-test.
Extended Data Figure 6. ME3 depletion in ME2 null cells causes mitochondrial dysfunction.
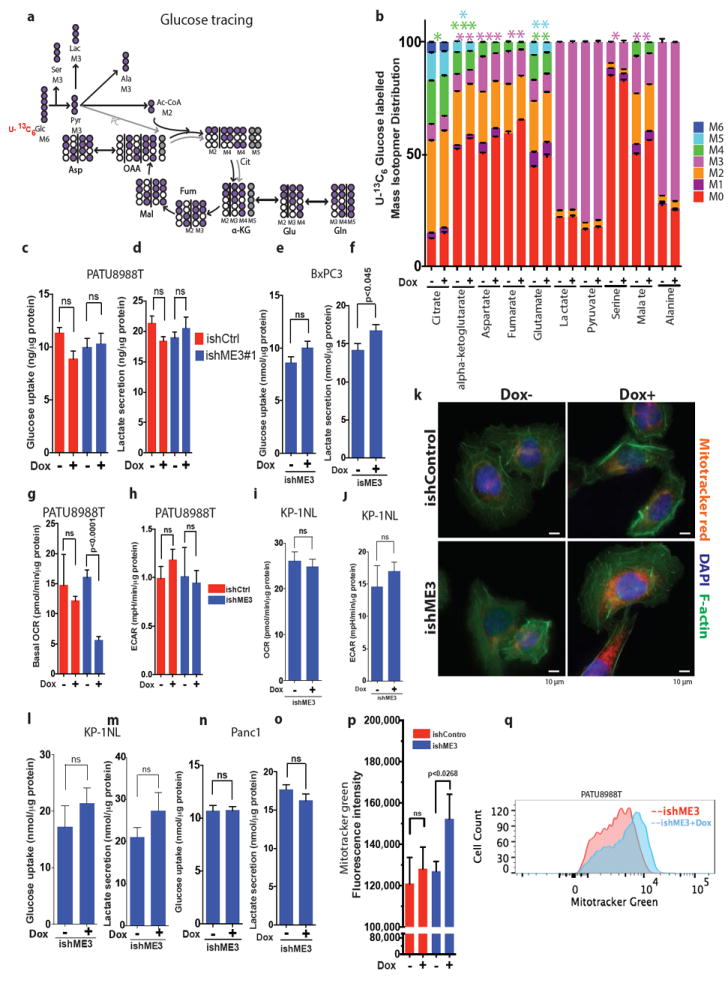
a, Mapping of carbon atom transitions using uniformly labelled 13C6-glucose. b, MID of uniformly labelled 13C6-glucose contribution to TCA cycle metabolites. ME3 depletion led to decreased glucose entry to TCA cycle. Error bars represent the s.e.m of n = 4 biological samples from two independent experiments. P values were determined by two-tailed t-test. c–f, Glucose uptake rate and lactate secretion rate were measured in PATU8988T (c, d) and BxPC3 (e, f) cells. g, h, Measurements of oxygen consumption rate (OCR) (g) and extracellular acidification rate (ECAR) (h) in PATU8988T cells upon ME3 depletion. i, j, Measurements of OCR (i) and ECAR (j) in KP-1NL cells upon ME3 depletion. Error bars represent s.e.m. of at least n = 5 replicates. P values were determined by two-tailed t-test. k, MitoTracker red, DAPI and F-actin staining of ME3-depleted (Dox+) and non-depleted (Dox–) cells. l–o, Glucose uptake rate and lactate secretion rate were measured in KP-1NL (l, m) and Panc1 (n, o) cells. p, Quantification of MitoTracker green staining to assess the mitochondrial biomass (Scale bar= 10 μm). q, Representative flow cytometry data of MitoTracker green staining of ME3-depleted (+Dox) versus. non-depleted cells. Error bars represent s.e.m. of at least n = 5 replicates. P values were determined by two-tailed t-test.
Extended Data Figure 7. ME affects branched chain amino acids metabolism.
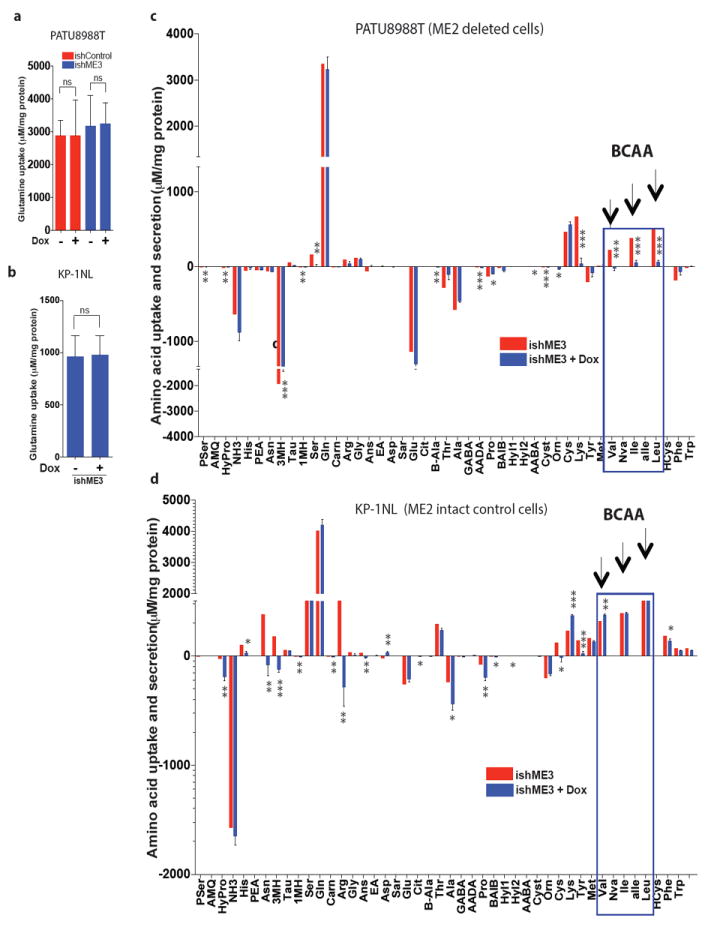
a, b,Glutamine uptake rate measured in PATU8988T (a) and KP-1NL (b) cells upon ME3 depletion. c, d, Measurement of amino acid uptake and secretion rates in PATU8988T (c) and KP-1NL (d) cells upon ME3 depletion. Positive values refer to amino acid uptake; negative values refer to secretion. Error bars represent s.e.m. of n = 6 biological samples (PATU8988T and KP-1NL). P values were determined by two-tailed t-test.
Extended Data Figure 8. ME regulates BCAT2 via a ROS mediated pathway.
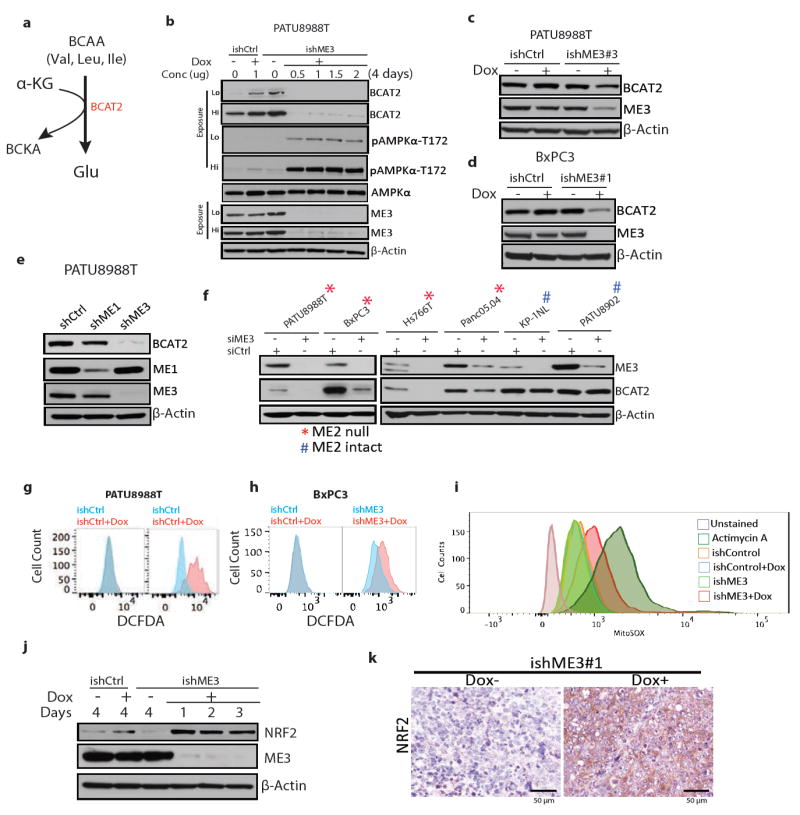
a, Schematic of the first enzymatic step of BCAA catabolism to branched chain ketoacid (BCKA). b, Time course of expression of BCAT2, ME3, pAMPKα-T172 and total AMPK following ME3 depletion in PATU8988T cells. c, Expression of BCAT2 and ME3 in cells treated with another independent ishRNA (ishME3#3). d, Expression of BCAT2 and ME3 in BxPC3 cells. e, Expression of BCAT2 and ME3 upon depletion of ME1 and ME3 using independent (non-dox dependent) shRNAs. f, Expression of ME3 and BCAT2 upon siRNA depletion of ME3 in PDAC lines. β-Actin used as loading control. g, h, Raw flow cytometry data of DCFDA-stained cells for measurement of ROS in PATU8988T (g) and BxPC3 (h) cells upon ME3 depletion. i, Raw flow cytometry data of MitoSOX staining in PATU8988T and ME3-depleted PATU8988T cells. Antimycin A used as positive control. j, Immunoblot showing time course of expression of NRF2 in cells with dox-induced ME3 depletion. β-Actin used as loading control. k, IHC images showing NRF2 staining in ME3-depleted and control xenograft tumours (Scale bar= 50μm).
Extended Data Figure 9. Increase in ROS activates AMPK pathway.
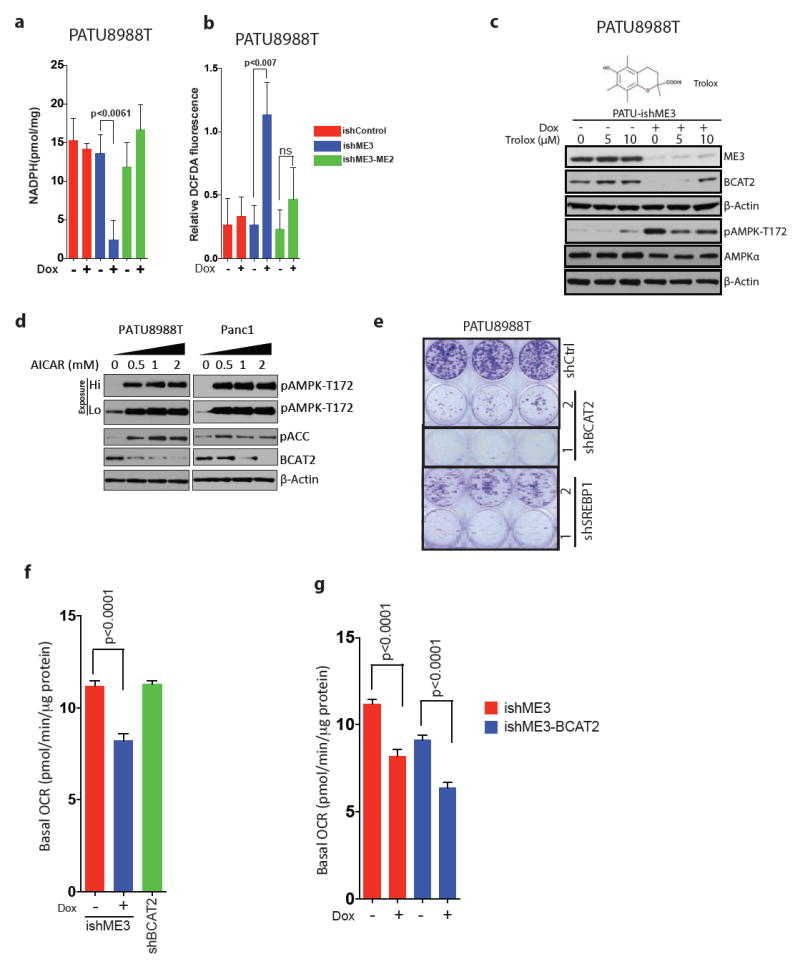
a, b, Measurement of NADPH (a) and total ROS (b) in ME2-rescued and ME3-depleted PATU8988T cells. Error bars represent s.d. of at least n = 5 replicates. c, Immunoblot of ME3, BCAT2 and AMPK expression upon depletion of ME3 followed by Trolox treatment for 24 h. Structure of Trolox (above), a synthetic vitamin E analogue that acts as a potent antioxidant. d, Expression of BCAT2 in PATU8988T and Panc1 cells upon treatment with AICAR for 14 h. e, Colony-formation assay showing decreased cell growth upon shRNA-mediated depletion of BCAT2 and SREBP1 using two independent shRNAs. Error bars represent s.d. of at least n = 3 replicates.f, OCR in cells depleted of BCAT2 by shRNA. g, OCR in cells upon overexpression of BCAT2. Error bars represent s.e.m of at least n = 5 replicates. P values were determined by two-tailed t-test.
Extended Data Figure 10. BCAAs contribution to nucleotide synthesis.
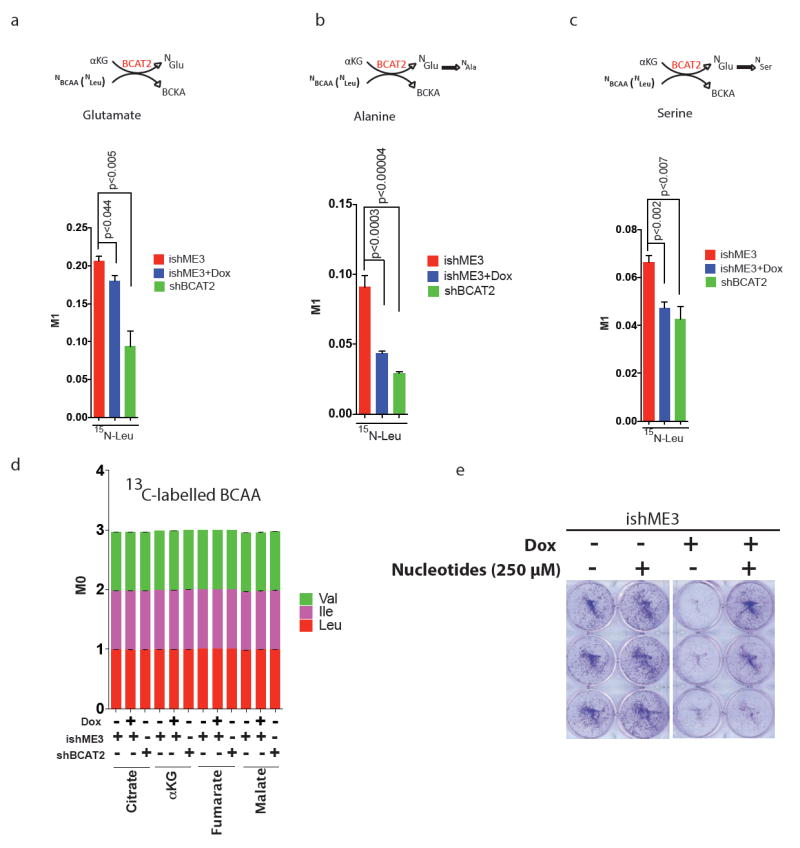
a–c, MID of 15N-labelled BCAA (Leu) contribution to glutamate (a), alanine (b), and serine (c). d, Plot of 13C-labelled BCAAs contribution to TCA cycle metabolites. Error bars represent s.e.m. of n = 4 biological samples from two independent experiments. P values were determined by two-tailed t-test. e, Colony formation assay of cells treated with nucleotides (mix of thymine, guanine, cytosine, uracil, and inosine, 250 μM each) showing rescue of ME3-depleted PATU8988T cells. Error bars represent s.d. of n = 3 biological samples from two independent experiments. P values were determined by two-tailed t-test.
Supplementary Material
Acknowledgments
We thank T. Tieu for vector cloning; the MD Anderson core facilities, including K. Dunner Jr for High Resolution Electron Microscopy Facility, Sequencing and Microarray Facility (SMF), Flow Cytometry and Cellular Imaging Core Facility; S. Jiang and Z. Xu for assistance in maintenance of mouse colonies; Z. Lu for discussion; and D. Spring for editing. This study was supported by NCI P01 CA117969 grant (R.A.D.); UT Star award (R.A.D.); CPRIT grant RP140612 (R.A.D.); DOD Postdoctoral research fellowship W81XWH-14-1-0429 (P.D.); MD Anderson Bridge Fund (R.A.D.); St. Louis Ovarian Cancer Awareness Research Grant (D.N.) and Odyssey Fellowships at MD Anderson (D.Z., T.G.).The MD Anderson core facilities are supported by NIH P30CA16672.
Reviewer InformationNature thanks C. Van Dang, A. Trumpp and the other anonymous reviewer(s) for their contribution to the peer review of this work.
Footnotes
Author Contributions P.D., Y.A.W., D.N. and R.A.D. designed the studies, interpreted the data and wrote the manuscript; P.D. performed all experiments; J.B. performed experiments and analysis of metabolite isotope tracing, Seahorse and UPLC; A.A. and L.Y. conducted metabolomics data analysis; C.C.W. performed bioinformatics analysis; W.-T.L. and H.W. conducted tissue microarray analysis; Z.L. conducted ChIP analysis; T.G. was responsible for ME2 CRISPR design and cloning; Y.K., J.F. and A.V. contributed essential reagents and resources; F.M., G.G., H.Y., G.D. and A.M. provided intellectual input; A.C., N.S., D.Z., Y.K., J.L. and E.C. provided technical support.
Supplementary Information is available in the online version of the paper.
The authors declare no competing financial interests.
References
- 1.Bardeesy N, et al. Smad4 is dispensable for normal pancreas development yet critical inprogression and tumor biology of pancreas cancer. Genes Dev. 2006;20:3130–3146. doi: 10.1101/gad.1478706. [DOI] [PMC free article] [PubMed] [Google Scholar]
- 2.Pongratz RL, Kibbey RG, Shulman GI, Cline GW. Cytosolic andmitochondrial malic enzyme isoforms differentially control insulin secretion. J Biol Chem. 2007;282:200–207. doi: 10.1074/jbc.M602954200. [DOI] [PubMed] [Google Scholar]
- 3.Jiang P, Du W, Mancuso A, Wellen KE, Yang X. Reciprocal regulation of p53 and malic enzymes modulates metabolism and senescence. Nature. 2013;493:689–693. doi: 10.1038/nature11776. [DOI] [PMC free article] [PubMed] [Google Scholar]
- 4.Hutson SM, Fenstermacher D, Mahar C. Role of mitochondrial transamination in branched chain amino acid metabolism. J Biol Chem. 1988;263:3618–3625. [PubMed] [Google Scholar]
- 5.Muller FL, Aquilanti EA, DePinho RA. Collateral lethality: a new therapeutic strategy in oncology. Trends Cancer. 2015;1173:161. doi: 10.1016/j.trecan.2015.10.002. [DOI] [PMC free article] [PubMed] [Google Scholar]
- 6.Muller FL, et al. Passenger deletions generate therapeutic vulnerabilities in cancer. Nature. 2012;488:337–342. doi: 10.1038/nature11331. [DOI] [PMC free article] [PubMed] [Google Scholar]
- 7.Witkiewicz AK, et al. Whole-exome sequencing of pancreatic cancer defines genetic diversity and therapeutic targets. Nat Commun. 2015;6:6744. doi: 10.1038/ncomms7744. [DOI] [PMC free article] [PubMed] [Google Scholar]
- 8.Lewis CA, et al. Tracing compartmentalized NADPH metabolism in the cytosol and mitochondria of mammalian cells. Mol Cell. 2014;55:253–63. doi: 10.1016/j.molcel.2014.05.008. [DOI] [PMC free article] [PubMed] [Google Scholar]
- 9.Ying H, et al. Oncogenic Kras maintains pancreatic tumors through regulation of anabolic glucose metabolism. Cell. 2012;149:656–670. doi: 10.1016/j.cell.2012.01.058. [DOI] [PMC free article] [PubMed] [Google Scholar]
- 10.Son J, et al. Glutamine supports pancreatic cancer growth through a KRAS-regulated metabolic pathway. Nature. 2013;496:101–105. doi: 10.1038/nature12040. [DOI] [PMC free article] [PubMed] [Google Scholar]
- 11.Ying H, et al. Genetics and biology of pancreatic ductal adenocarcinoma. Genes Dev. 2016;30:355–385. doi: 10.1101/gad.275776.115. [DOI] [PMC free article] [PubMed] [Google Scholar]
- 12.Holecek M. Relation between glutamine, branched-chain amino acids, and protein metabolism. Nutrition. 2002;18:130–133. doi: 10.1016/s0899-9007(01)00767-5. [DOI] [PubMed] [Google Scholar]
- 13.Suryawan A, et al. A molecular model of human branched-chain amino acid metabolism. Am J Clin Nutr. 1998;68:72–81. doi: 10.1093/ajcn/68.1.72. [DOI] [PubMed] [Google Scholar]
- 14.Hutson SM, Sweatt AJ, Lanoue KF. Branched-chain amino acid metabolism: implications for establishing safe intakes. J Nutr. 2005;135(Suppl):1557S–1564S. doi: 10.1093/jn/135.6.1557S. [DOI] [PubMed] [Google Scholar]
- 15.O’Connell TM. The complex role of branched chain amino acids in diabetes and cancer. Metabolites. 2013;3:931–945. doi: 10.3390/metabo3040931. [DOI] [PMC free article] [PubMed] [Google Scholar]
- 16.Mayers JR, et al. Elevation of circulating branched-chain amino acids is an early event in human pancreatic adenocarcinoma development. Nat Med. 2014;20:1193–1198. doi: 10.1038/nm.3686. [DOI] [PMC free article] [PubMed] [Google Scholar]
- 17.Fearon KC, Glass DJ, Guttridge DC. Cancer cachexia: mediators, signaling, and metabolic pathways. Cell Metab. 2012;16:153–166. doi: 10.1016/j.cmet.2012.06.011. [DOI] [PubMed] [Google Scholar]
- 18.Tsoli M, Robertson G. Cancer cachexia: malignant inflammation, tumorkines, and metabolic mayhem. Trends Endocrinol Metab. 2013;24:174–183. doi: 10.1016/j.tem.2012.10.006. [DOI] [PubMed] [Google Scholar]
- 19.Sweatt AJ, et al. Branched-chain amino acid catabolism: unique segregation of pathway enzymes in organ systems and peripheral nerves. Am J Physiol Endocrinol Metab. 2004;286:E64–E76. doi: 10.1152/ajpendo.00276.2003. [DOI] [PubMed] [Google Scholar]
- 20.Krebs HA, Lund P. Aspects of the regulation of the metabolism of branched-chain amino acids. Adv Enzyme Regul. 1976;15:375–394. doi: 10.1016/0065-2571(77)90026-7. [DOI] [PubMed] [Google Scholar]
- 21.Hutson SM, Cree TC, Harper AE. Regulation of leucine and alpha-ketoisocaproate metabolism in skeletal muscle. J Biol Chem. 1978;253:8126–8133. [PubMed] [Google Scholar]
- 22.Blättler SM, Rencurel F, Kaufmann MR, Meyer UA. In the regulation of cytochrome P450 genes, phenobarbital targets LKB1 for necessary activation of AMP-activated protein kinase. Proc Natl Acad Sci USA. 2007;104:1045–1050. doi: 10.1073/pnas.0610216104. [DOI] [PMC free article] [PubMed] [Google Scholar]
- 23.Woods A, et al. Identification of phosphorylation sites in AMP-activated protein kinase (AMPK) for upstream AMPK kinases and study of their roles by site-directed mutagenesis. J Biol Chem. 2003;278:28434–28442. doi: 10.1074/jbc.M303946200. [DOI] [PubMed] [Google Scholar]
- 24.Li Y, et al. AMPK phosphorylates and inhibits SREBP activity to attenuate hepatic steatosis and atherosclerosis in diet-induced insulin-resistant mice. Cell Metab. 2011;13:376–388. doi: 10.1016/j.cmet.2011.03.009. [DOI] [PMC free article] [PubMed] [Google Scholar]
- 25.Porstmann T, et al. SREBP activity is regulated by mTORC1 and contributes to Akt-dependent cell growth. Cell Metab. 2008;8:224–236. doi: 10.1016/j.cmet.2008.07.007. [DOI] [PMC free article] [PubMed] [Google Scholar]
- 26.Tontonoz P, Kim JB, Graves RA, Spiegelman BM. ADD1: a novel helix-loop-helix transcription factor associated with adipocyte determination and differentiation. Mol Cell Biol. 1993;13:4753–4759. doi: 10.1128/mcb.13.8.4753. [DOI] [PMC free article] [PubMed] [Google Scholar]
- 27.Berg JM, Tymoczko JL, Stryer L. Biochemistry. 7. W.H. Freeman; 2012. [Google Scholar]
- 28.Doench JG, et al. Rational design of highly active sgRNAs for CRISPR-Cas9-mediatedgene inactivation. Nat Biotechnol. 2014;32:1262–1267. doi: 10.1038/nbt.3026. [DOI] [PMC free article] [PubMed] [Google Scholar]
- 29.Heckl D, et al. Generation of mouse models of myeloid malignancy with combinatorialgenetic lesions using CRISPR-Cas9 genome editing. Nat Biotechnol. 2014;32:941–946. doi: 10.1038/nbt.2951. [DOI] [PMC free article] [PubMed] [Google Scholar]
- 30.Dey P, Ström A, Gustafsson J. A. Estrogen receptor β upregulates FOXO3a andcauses induction of apoptosis through PUMA in prostate cancer. Oncogene. 2014;33:4213–4225. doi: 10.1038/onc.2013.384. [DOI] [PubMed] [Google Scholar]
- 31.Kapoor A, et al. Yap1 activation enables bypass of oncogenic Kras addiction inpancreatic cancer. Cell. 2014;158:185–197. doi: 10.1016/j.cell.2014.06.003. [DOI] [PMC free article] [PubMed] [Google Scholar]
- 32.Sahin E, et al. Telomere dysfunction induces metabolic and mitochondrial compromise. Nature. 2011;470:359–365. doi: 10.1038/nature09787. [DOI] [PMC free article] [PubMed] [Google Scholar]
- 33.Paik JH, et al. FoxOs cooperatively regulate diverse pathways governing neural stemcell homeostasis. Cell Stem Cell. 2009;5:540–553. doi: 10.1016/j.stem.2009.09.013. [DOI] [PMC free article] [PubMed] [Google Scholar]
- 34.Langmead B, Salzberg SL. Fast gapped-read alignment with Bowtie 2. Nat Methods. 2012;9:357–359. doi: 10.1038/nmeth.1923. [DOI] [PMC free article] [PubMed] [Google Scholar]
- 35.Trapnell C, et al. Differential gene and transcript expression analysis of RNA-seqexperiments with TopHat and Cufflinks. Nat Protocols. 2012;7:562–578. doi: 10.1038/nprot.2012.016. [DOI] [PMC free article] [PubMed] [Google Scholar]
- 36.Orsomando G, et al. Simultaneous single-sample determination of NMNAT isozymeactivities in mouse tissues. PLoS One. 2012;7:e53271. doi: 10.1371/journal.pone.0053271. [DOI] [PMC free article] [PubMed] [Google Scholar]
Associated Data
This section collects any data citations, data availability statements, or supplementary materials included in this article.
Supplementary Materials
Data Availability Statement
The RNA-seq data have been submitted to the Gene Expression Omnibus under accession number GSE80411. All other raw data generated or analysed during this study are included in this published article (and its Supplementary Information files).


