

Abstract
The dynamic post-translational modification O-linked β-N-acetylglucosamine (O-GlcNAc) regulates thousands of nuclear, cytoplasmic, and mitochondrial proteins. Cellular stress, including oxidative stress, results in increased O-GlcNAcylation of numerous proteins, and this increase is thought to promote cell survival. The mechanisms by which the O-GlcNAc transferase (OGT) and the O-GlcNAcase (OGA), the enzymes that add and remove O-GlcNAc, respectively, are regulated during oxidative stress to alter O-GlcNAcylation are not fully characterized. Here, we demonstrate that oxidative stress leads to elevated O-GlcNAc levels in U2OS cells but has little impact on the activity of OGT. In contrast, the expression and activity of OGA are enhanced. We hypothesized that this seeming paradox could be explained by proteins that bind to and control the local activity or substrate targeting of OGA, thereby resulting in the observed stress-induced elevations of O-GlcNAc. To identify potential protein partners, we utilized BioID proximity biotinylation in combination with stable isotopic labeling of amino acids in cell culture (SILAC). This analysis revealed 90 OGA-interacting partners, many of which exhibited increased binding to OGA upon stress. The associations of OGA with fatty acid synthase (FAS), filamin-A, heat shock cognate 70-kDa protein, and OGT were confirmed by co-immunoprecipitation. The pool of OGA bound to FAS demonstrated a substantial (∼85%) reduction in specific activity, suggesting that FAS inhibits OGA. Consistent with this observation, FAS overexpression augmented stress-induced O-GlcNAcylation. Although the mechanism by which FAS sequesters OGA remains unknown, these data suggest that FAS fine-tunes the cell's response to stress and injury by remodeling cellular O-GlcNAcylation.
Keywords: fatty acid synthase (FAS), glycoprotein, O-GlcNAcylation, oxidative stress, post-translational modification (PTM), protein-protein interaction, proteomics, signal transduction, BioID, mgea5
Introduction
The modification of intracellular proteins by monosaccharides of O-linked β-N-acetylglucosamine (O-GlcNAc)2 has emerged as an essential and dynamic post-translational modification of metazoans (1–3). O-GlcNAcylation is regulated by two enzymes: the O-GlcNAc transferase (OGT) (4, 5) and the O-GlcNAcase (OGA) (6, 7), which catalyze the addition and removal of O-GlcNAc, respectively. OGT utilizes the nucleotide sugar UDP-GlcNAc (2, 8), which is synthesized by the hexosamine biosynthetic pathway (HBP) (1–3). Highlighting the importance of O-GlcNAcylation in the maintenance of cellular homeostasis, ogt, mgea5 (OGA), and pgm3, a key enzyme in the HBP, are essential for the viability of cells, tissues, and organisms (9–12).
O-GlcNAcylation of cellular proteins is implicated in the regulation of diverse cellular pathways and processes such as development, aging, inflammation, cell cycle regulation, metabolic sensing, and the cellular stress response, the focus of this study (1–3, 13). O-GlcNAc levels are dynamically elevated in response to many forms of cellular stress (13, 14), including oxidative stress (13, 14) and ischemia reperfusion (I/R) injury (14–19). Elevating O-GlcNAc levels prior to (13–18, 20–26) or immediately after (27–31) injury significantly improves survival. In contrast, decreasing O-GlcNAc levels sensitizes cells and tissues to apoptosis and necrosis (13, 18, 24–26). Together, these data suggest that stress-induced changes in protein O-GlcNAcylation promote survival signaling.
Alterations in the expression, activity, localization, and targeting of OGT and OGA, as well as increased flux through the HBP, have been correlated with stress-induced changes in O-GlcNAcylation. For example, various cell culture models of stress result in enhanced O-GlcNAcylation that has been correlated with increases in the expression (13, 32), activity (13, 33), and targeting (32) of OGT. In both ex vivo (16) and in vivo (34) rodent models of cardiac I/R injury, O-GlcNAc levels are elevated concomitant with UDP-GlcNAc levels. Furthermore, increased O-GlcNAc levels have been correlated with elevated OGT expression (19) and activity (19, 35), as well as decreased OGA activity (35), in models of ischemic preconditioning. The mechanisms controlling the activity and substrate specificity of OGT and OGA in models of cellular injury remain unknown. However, it is generally accepted that these enzymes, like RNA polymerase II (36), exist as holoenzymes, i.e. the proteins they interact with regulate their specificity and activity (1, 37).
To identify protein candidates that regulate O-GlcNAc during oxidative stress, we have focused on the regulation of the full-length and predominant isoform of OGA (1–3, 6, 7, 38). We have identified the basal and oxidative stress-dependent protein-protein interactions of OGA using proximity biotinylation (39) coupled with stable isotopic labeling of amino acids in cell culture (SILAC)-based proteomics (40–42). A total of 90 interaction partners of OGA were identified, many of which exhibited increased association with oxidative stress, including fatty acid synthase (FAS), filamin-A (FLNA), heat shock cognate 70-kDa protein (HSC70), and OGT. The pool of OGA bound to FAS demonstrated a significant reduction (∼85%) in specific activity. Consistent with the stress-induced inhibition of OGA by FAS, we observed elevated O-GlcNAcylation on a subset of proteins during oxidative stress in FAS-overexpressing cells. These results suggest a novel mechanism by which the components of two metabolic-sensing pathways, O-GlcNAc cycling and fatty acid biogenesis, are coordinated to respond to cellular injury and improve survival.
Results
Oxidative stress increases OGT and OGA expression, OGA activity, and O-GlcNAc levels
To characterize the mechanisms that cells use to modulate O-GlcNAc levels in response to oxidative stress, we first assessed the activity and expression of OGT and OGA in U2OS human osteosarcoma cells exposed to the oxidant hydrogen peroxide (H2O2; 2.5 mm, 1–3 h). Normalization was performed against the housekeeping protein actin, whose expression is not affected by H2O2 treatment (Fig. 1, A and B). Consistent with our previous data (13, 14), there is a time-dependent increase in O-GlcNAc levels upon the induction of oxidative stress that is significant at 3 h (Fig. 1, A and C; repeated measures one-way analysis of variance (RM-1ANOVA)/Dunnett's multiple comparison test (MCT), p ≤ 0.01). The increase in O-GlcNAc levels is accompanied by an elevation in the expression of OGT at 3 h (Fig. 1, A and D; RM-1ANOVA/Dunnett's MCT, p ≤ 0.0001). Although we did not observe a statistically significant increase in OGT activity (Fig. 1E), the fold change increase in OGT expression at 2 nd 3 h parallels that of OGT activity. Interestingly, we detected a modest but significant augmentation of OGA expression (Fig. 1, A and F; RM-1ANOVA/Dunnett's MCT, p ≤ 0.01) and activity (Fig. 1G; RM-1ANOVA/Dunnett's MCT, p ≤ 0.05 (2 h), p ≤ 0.0001 (3 h)) after 2 and 3 h of oxidative stress. These data suggest that increased O-GlcNAcylation during oxidative stress cannot be attributed solely to global changes in the expression and activity of OGT or OGA. Together, these findings suggest that the substrate specificity of OGA may be modulated during oxidative stress, likely resulting from changes in its targeting or local activity. As protein-protein interactions are integral to the targeting of many enzymes, including OGT (1–3, 32, 43), we hypothesized that OGA may be regulated in a similar manner.
Figure 1.

Oxidative stress increases OGT and OGA expression, OGA activity, and O-GlcNAc levels. U2OS cells were treated with vehicle (V) or H2O2 (2.5 mm, 1–3 h). n = 10, unless otherwise indicated. A, expression of OGT, OGA, and actin, as well as O-GlcNAc levels, was assessed in NETN lysates (5 μg) by Western blotting (WB). Protein load was assessed by total protein stain (colloidal Coomassie G-250) and by Western blotting (actin). Molecular mass (MW) markers are indicated. B, quantitation of actin normalized to total protein (G-250). C, quantitation of O-GlcNAc levels normalized to actin. D, quantitation of OGT expression normalized to actin. E, NETN lysates (5 μg) were assayed for OGT activity using [3H]UDP-GlcNAc (0.5 μCi) and CKII acceptor peptide (1 mm). n = 4, three technical replicates per assay. F, quantitation of OGA expression normalized to actin. G, NETN lysates (5 μg) were assayed for OGA activity using 4MU-GlcNAc (1 mm). n = 6, two technical replicates per assay. B–G, data are presented as the mean ± S.E. Significance was determined by RM-1ANOVA followed by Dunnett's MCT, and differences were considered statistically significant at p ≤ 0.05 (*), p ≤ 0.01 (**), and p ≤ 0.0001 (****).
OGA-mBirA fusion proteins express, maintain catalytic activity, and biotinylate proteins in vivo
To identify the proteins that bind to and regulate OGA, we utilized the BioID proximity biotinylation methodology (39, 44, 45). This technique relies on the Escherichia coli biotin ligase BirA, which contains a single point mutation (R118G; herein referred to as mBirA) enabling it to release activated biotin, and this results in the biotinylation of proteins within an ∼10-nm radius (45–49). OGA is a large protein (916 amino acids) containing two domains, an N-terminal catalytic domain (β-N-acetylglucosaminidase; CD; amino acids 1–350) and a C-terminal acetyltransferase-like domain (AD; amino acids 583–916), which are separated by a linker (Fig. 2A) (6, 7, 50). As such, full-length OGA was cloned in-frame on the N terminus of mBirA-HA (OGA-mBirA-HA) or the C terminus of Myc-mBirA (Myc-mBirA-OGA) to provide greater coverage of the OGA interactome (Fig. 2A). The fusion constructs and a control vector (pcDNA3.1) were transiently transfected into U2OS cells and treated with or without biotin. Western blotting (WB) analysis demonstrates that OGA-mBirA-HA and Myc-mBirA-OGA are overexpressed (Fig. 2B). Of note, Myc-mBirA-OGA appears to be modestly stabilized by the addition of exogenous biotin, which is consistent with previous observations (Fig. 2B) (39, 51). To determine whether the fusion proteins maintain β-N-acetylglucosaminidase activity, desalted total cell lysates (TCL) were incubated with the fluorescent small molecule substrate 4-methylumbelliferyl (MU)-GlcNAc. Both fusion proteins maintain catalytic activity, which is enhanced by the addition of exogenous biotin (Fig. 2C). Interestingly, endogenous OGA activity is significantly elevated in pcDNA3.1-transfected cells treated with biotin (ratio-paired t test (RPT), p ≤ 0.05, n = 3).
Figure 2.
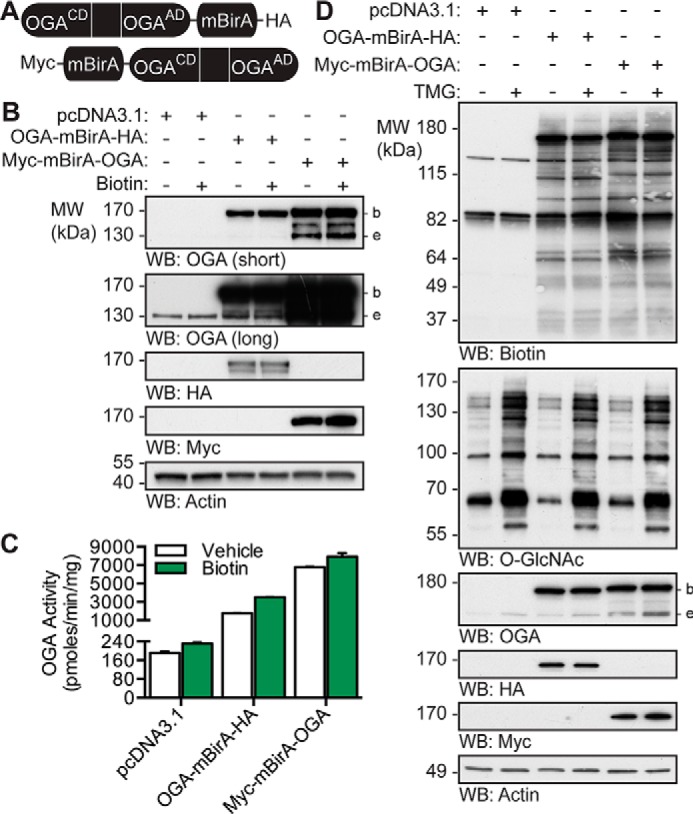
OGA-mBirA fusion proteins express, maintain catalytic activity, and biotinylate proteins in vivo. A, schematic of the OGA-mBirA fusion proteins. CD and AD represent the catalytic (β-N-acetylglucosaminidase) domain and acetyltransferase-like domain of OGA, respectively. B–D, U2OS cells were transfected with pcDNA3.1, OGA-mBirA-HA, or Myc-mBirA-OGA and treated with or without biotin (25 μm, 16 h) or TMG (100 nm, 20 h) as indicated. Proteins were extracted in TCL buffer. B, equal amounts of protein (10 μg) were separated by SDS-PAGE, and the following were detected by Western blotting: OGA, HA, Myc, and actin. n = 3. C, desalted lysates were assayed for OGA activity using 4MU-GlcNAc (1 mm). n = 3, representative data from one experiment is shown. Error bars indicate the intra-assay standard deviation from two technical replicates. D, equal amounts of protein (4.5 μg) were separated by SDS-PAGE, and the following were detected by Western blotting: biotin, O-GlcNAc, OGA, HA, Myc, and actin. n = 2. Migration of endogenous OGA (e), mBirA-tagged OGA (b), and the molecular mass (MW) markers are indicated.
To determine whether the fusion proteins biotinylate proximal proteins in vivo, cell lysate was separated by SDS-PAGE, and biotinylated proteins were detected with NeutrAvidin-HRP. Of note, two signals were observed in the pcDNA3.1 transfected cells at ∼130 and ∼80 kDa (Fig. 2D). These molecular masses are consistent with the endogenously biotinylated mammalian carboxylases (acetyl-CoA carboxylase, pyruvate carboxylase, 3-methylcrotonyl-CoA carboxylase, and propionyl-CoA carboxylase) (52, 53) and have been previously reported (39, 44). Overexpression of OGA-mBirA-HA and Myc-mBirA-OGA in the presence of exogenous biotin leads to the appearance of numerous biotinylated proteins (Fig. 2D). The biotinylation patterns of OGA-mBirA-HA and Myc-mBirA-OGA are different, suggesting that our dual-tagging strategy provides greater coverage of the OGA interactome (Fig. 2D). One potential control for our studies is overexpression of mBirA alone. However, mBirA-HA and Myc-mBirA biotinylate proteins in a promiscuous manner when compared with their OGA-mBirA counterparts (supplemental Fig. 1). As such, mBirA was not used as a control for subsequent experiments, and this is in accordance with previous BioID studies (39, 44, 45).
To determine whether interacting partners of OGA are predominantly substrates, cells were treated with the OGA inhibitor thiamet-G (TMG) (54). Interestingly, there is no dramatic change in the biotinylation pattern for either fusion protein with the addition of TMG. These data suggest that the biotinylated proteins are not predominantly substrates of OGA (Fig. 2D).
The localization and in vivo biotinylation of the OGA-mBirA fusion proteins were confirmed by indirect immunofluorescence. As a control, we first determined the localization of endogenous OGA in U2OS cells. Our data demonstrate that OGA staining is detected in the nucleus and cytoplasm of U2OS cells under basal conditions (supplemental Fig. 2), which is consistent with previous reports describing the subcellular localization of endogenous full-length OGA (6, 38). OGA has recently been demonstrated to exist in mitochondria of neonatal rat cardiomyocytes (55), and the orange signal in the merged images (supplemental Fig. 2, white triangles) may represent co-localization of OGA (green) and MitoTracker (red). Upon oxidative stress, we observe an increase in OGA staining that is consistent with the Western blotting analysis (Fig. 1, A and F), but the overall pattern of localization remains unchanged.
Like endogenous OGA, OGA-mBirA-HA (Fig. 3, B and C) and Myc-mBirA-OGA (Fig. 3, E and F) are present in the nucleus and cytoplasm. However, the overexpressed protein appears to have a more cytosolic distribution than the endogenous protein (supplemental Fig. 2). Similar to the staining pattern of endogenous OGA, the orange signal in the merged images (Fig. 3, B and E, white triangles) may represent co-localization of the OGA-mBirA fusion proteins with MitoTracker. Biotinylation, which is stimulated by the addition of exogenous biotin, is observed in cells overexpressing OGA-mBirA-HA (Fig. 3C) and Myc-mBirA-OGA (Fig. 3F). Faint staining for biotin in control cells (pcDNA3.1; Fig. 3A) can be attributed to the endogenously biotinylated mammalian carboxylases described above. Finally, the localization and biotinylation of OGA-mBirA-HA (Fig. 3D) and Myc-mBirA-OGA (Fig. 3G) are not altered by oxidative stress.
Figure 3.

OGA-mBirA fusion proteins localize to and biotinylate proteins in the nucleus, cytoplasm, and mitochondria of U2OS cells. U2OS cells were transfected with pcDNA3.1 (A), OGA-mBirA-HA (B–D), or Myc-mBirA-OGA (E–G), treated with (A, C, D, F, and G) or without (B and E) biotin (25 μm, 16 h), and treated with (D and G) or without (A–C, E, and F) H2O2 (2.5 mm, 2 h). Cells were fixed, permeabilized, and stained for BirA and biotin. Nuclei and mitochondria were stained with Hoechst 33342 and MitoTracker Orange CMTMRos, respectively. White triangles indicate co-localization (orange) of MitoTracker and OGA (B and E). Images were acquired at ×63 magnification on a Zeiss Axio Examiner 710NLO-Meta multiphoton microscope. n = 3. Scale bar, 15 μm.
OGA-mBirA-HA and Myc-mBirA-OGA biotinylate proximal proteins differentially in response to oxidative stress
To determine whether oxidative stress alters the interactome of OGA, cells were transfected with the OGA-mBirA constructs and treated with biotin and H2O2 (2 h). Western blotting for biotin demonstrates that OGA-mBirA-HA and Myc-mBirA-OGA each exhibit a markedly altered biotinylation pattern in response to oxidative stress (Fig. 4A). These data suggest that oxidative stress induces a change in the proteins associating with OGA, wherein some interactions appear to be augmented and others are decreased (Fig. 4A). Similar to the results described above, OGA-mBirA-HA and Myc-mBirA-OGA have distinct biotinylation patterns. These results are further illustrated in the densitometric total lane profiling of the biotin signal (Fig. 4B). Importantly, endogenous biotinylation and biotinylation by mBirA-HA and Myc-mBirA are not altered by oxidative stress (supplemental Fig. 1). These data suggest that changes in the biotinylation pattern are not a result of changes in mBirA activity, but rather they are due to specific changes in oxidative stress-dependent biotinylation by OGA-mBirA-HA and Myc-mBirA-OGA.
Figure 4.
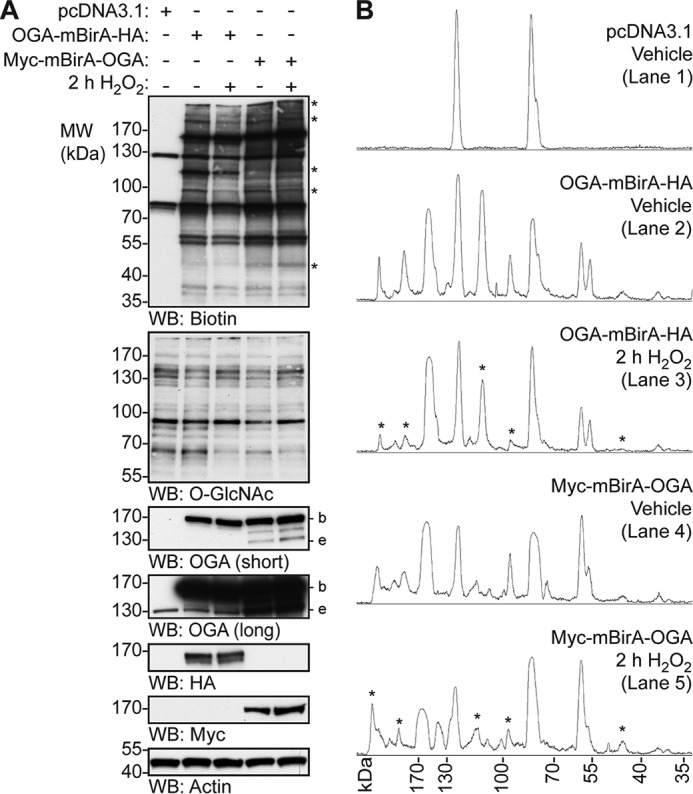
OGA-mBirA-HA and Myc-mBirA-OGA biotinylate proximal proteins differentially in response to oxidative stress. U2OS cells were transfected with pcDNA3.1, OGA-mBirA-HA, or Myc-mBirA-OGA and treated with biotin (25 μm, 16 h) in the presence or absence of H2O2 (2.5 mm, 2 h). A, equal amounts of protein (5 μg; denaturing TCL lysis) were separated by SDS-PAGE, and the following were detected by Western blotting: biotin, O-GlcNAc, OGA, HA, Myc, and actin. n = 4. B, densitometric total lane profiles for each lane from the biotin signal in A. Asterisks are used to highlight a subset of the biotinylated signals that are altered by oxidative stress. Migration of endogenous OGA (e), mBirA-tagged OGA (b), and the molecular mass (MW) markers are indicated.
SILAC-BioID-MS/MS reveals numerous basal and stress-induced OGA-interacting proteins
To identify the proteins bound by OGA in basal and oxidatively stressed cells, we performed two SILAC-based proteomic experiments (Fig. 5). In all cases, the heavy (H) SILAC-labeled cells were transfected with pcDNA3.1, and the light (L) and medium (M) labeled cells were transfected with OGA-mBirA-HA (experiment 1) or Myc-mBirA-OGA (experiment 2) (Fig. 5A). Following transient transfection, biotinylation was stimulated, and the cells were treated with vehicle (V; medium SILAC label) or 2 h of H2O2 (light SILAC label) prior to harvesting (Fig. 5A). SILAC-labeled proteins were extracted in denaturing TCL buffer and combined in equal amounts (Fig. 5, A and B). Biotinylated proteins in the 1:1:1 extract mixture were enriched using NeutrAvidin-agarose, eluted with SDS (95 °C), and precipitated twice with acetone to remove free SDS. Peptides were generated by digestion with trypsin and LysC, and the resulting peptides were subjected to off-line basic reversed phase (bRP) fractionation followed by reversed phase (RP) liquid chromatography (LC)-tandem mass spectrometry (MS/MS) (Fig. 5A). The mass spectrometry proteomics data have been deposited to the ProteomeXchange Consortium (http://proteomecentral.proteomexchange.org) via the PRIDE partner repository (56–60) with the dataset identifier PXD005039.
Figure 5.

SILAC-BioID-MS/MS strategy used to identify the basal and oxidative stress-dependent interactome of OGA. A, U2OS cells were labeled with light, medium, or heavy isotopes of arginine and lysine for six generations. In experiment 1, cells were transfected with pcDNA3.1 (heavy) or OGA-mBirA-HA (light, medium), treated with biotin (25 μm, 16 h), and treated with vehicle (medium, heavy) or H2O2 (light; 2.5 mm, 2 h, n = 1). In experiment 2, Myc-mBirA-OGA was transfected in replacement of OGA-mBirA-HA. For each experiment, proteins were extracted in denaturing TCL buffer and combined in equal amounts. The biotinylated proteins were isolated on NeutrAvidin-agarose in denaturing conditions, eluted in 2% (w/v) SDS (95 °C), and precipitated with acetone. Peptides were generated by trypsin and LysC digestion, separated by basic reversed phase (bRP) fractionation, and identified by mass spectrometry (LC-ESI-MS/MS). Subsequently, protein-protein interactions were validated by co- IP and Western blotting. B, for the SILAC experiments (n = 1, each), equal amounts of protein (10 μg; denaturing TCL lysis) were separated by SDS-PAGE, and the following were detected by Western blotting: biotin, OGA, HA, Myc, and actin. Protein load was assessed by total protein stain (Sypro Ruby) and by Western blotting (actin). Migration of endogenous OGA (e), mBirA-tagged OGA (b), and the molecular mass (MW) markers are indicated.
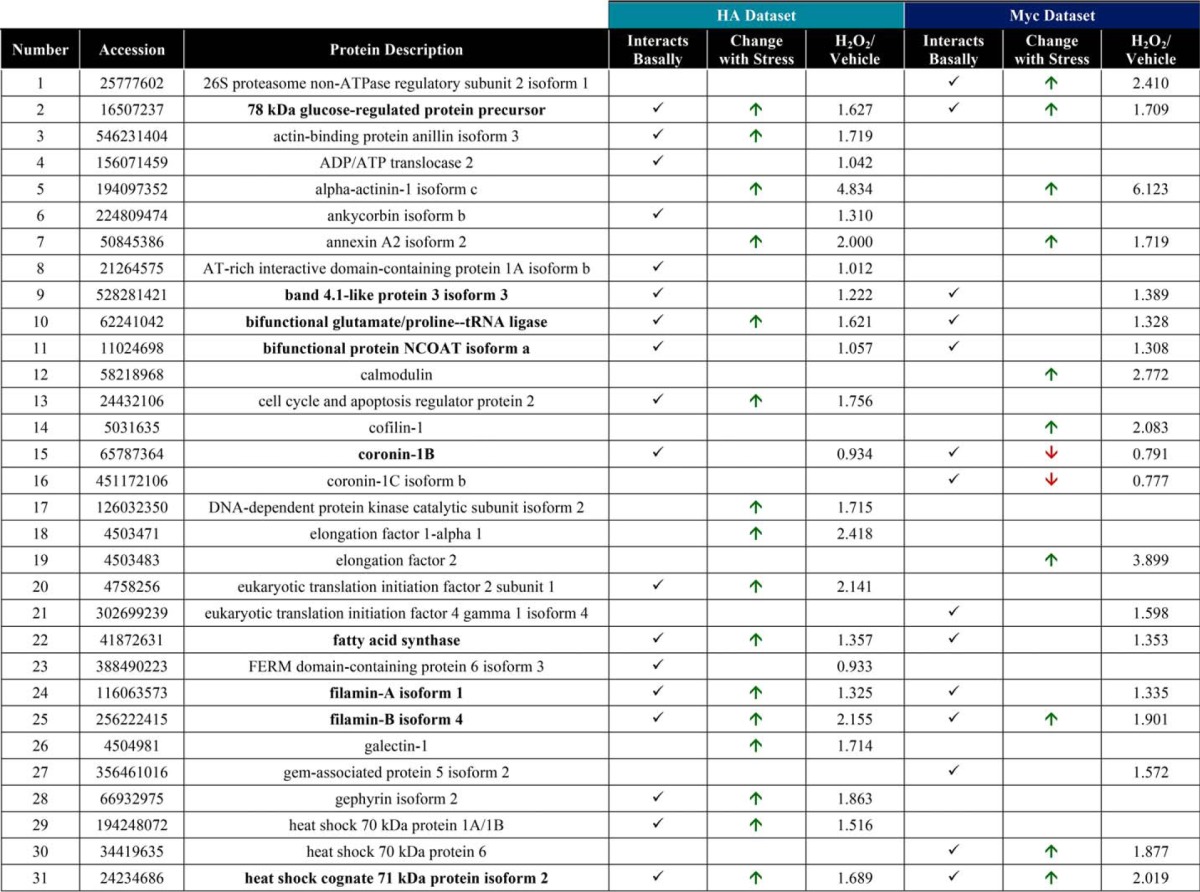
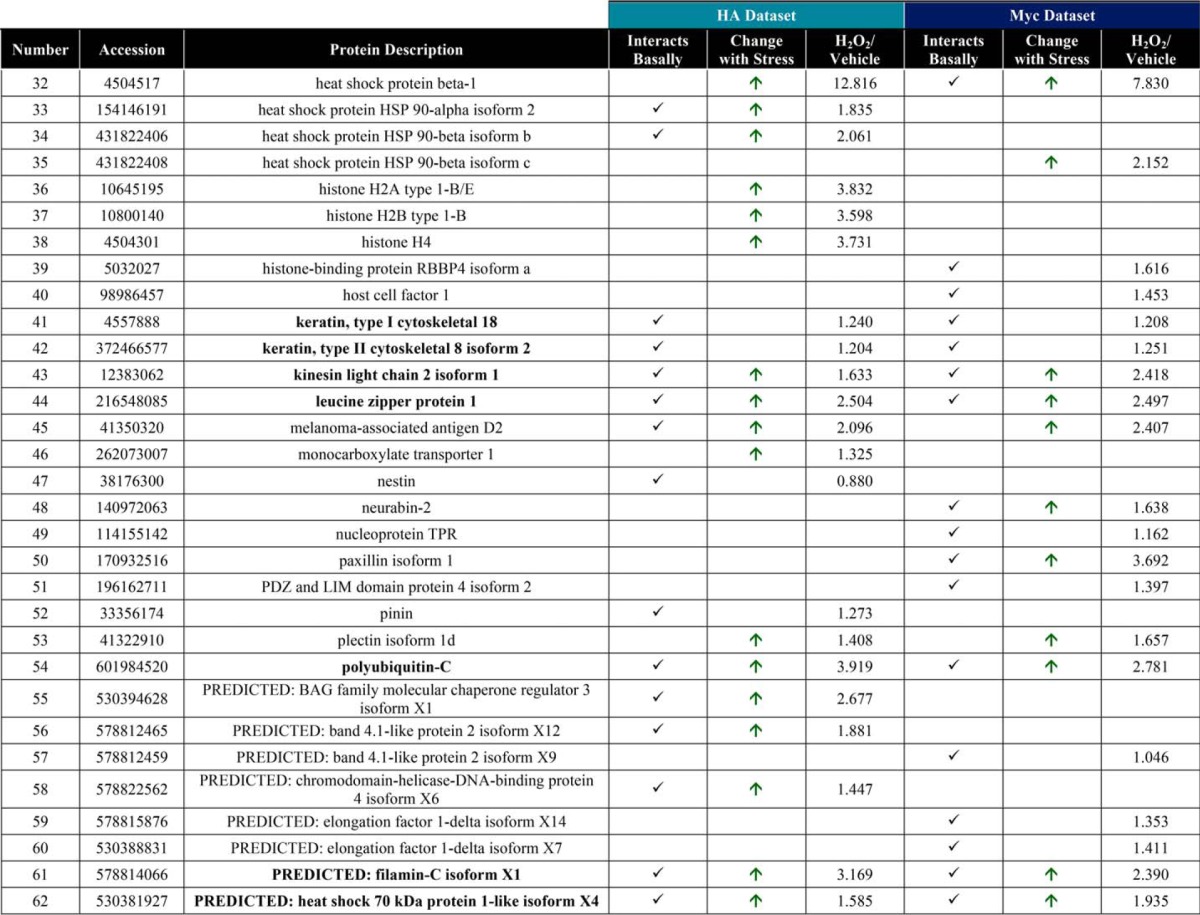
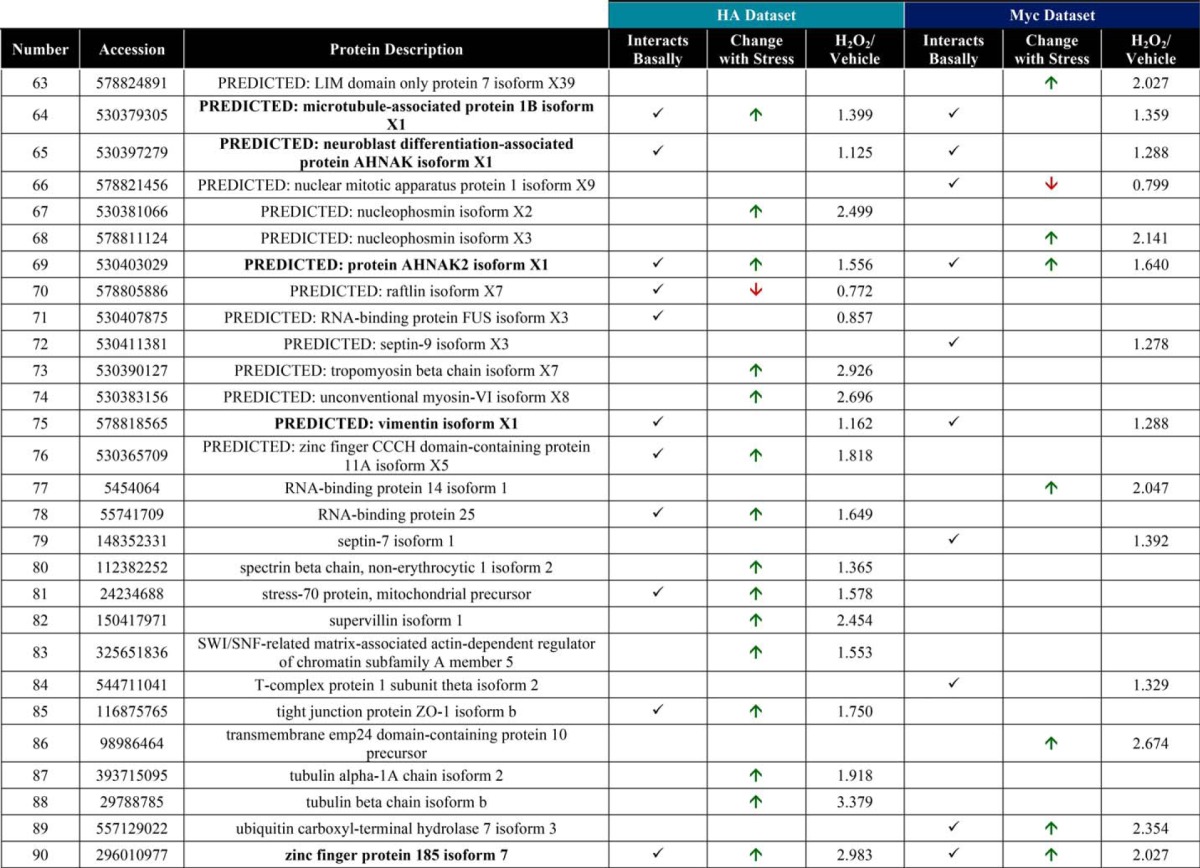
Raw MS protein and peptide identifications are reported in supplemental Tables 1–6, and processing of the raw MS data, as described below, is outlined in supplemental Fig. 3. LC-MS/MS identified 126 proteins in the OGA-mBirA-HA pulldown (supplemental Table 7) and 157 proteins in the Myc-mBirA-OGA pulldown (supplemental Table 8) after application of the following inclusion criteria in Proteome Discover 1.4: a peptide rank of 1 (filter 1), a 5% false discovery rate (FDR; filter 1), as well as ≥1 unique peptide, ≥2 total peptides, and ≥3 peptide spectral matches (PSMs) per identification (filter 2). Next, the variability in the endogenously biotinylated carboxylases was used to set a threshold for excluding nonspecific interactors (supplemental Fig. 3 (exclusion criteria 2), supplemental Fig. 4, and supplemental Table 9), yielding 44 proteins and 41 proteins enriched above background for the HA (Fig. 6A; supplemental Table 10) and Myc (Fig. 6B; supplemental Table 11) screens, respectively. To determine the interactors that are induced upon oxidative stress, we set a threshold of a 25% increase in protein abundance in stressed cells compared with control cells (supplemental Table 12). For the OGA-mBirA-HA pulldown, 48 proteins were identified as stress-induced interactors, of which 19 were present above background in only the stressed sample (Fig. 6A; supplemental Table 10). For the Myc-mBirA-OGA fusion protein, 28 proteins were identified as stress-induced interactors. Of these proteins, 12 were identified above background in only the stressed sample (Fig. 6B; supplemental Table 11). Highlighting the utility of our dual-tagging strategy for maximizing coverage of the OGA interactome, there were only 21 basal interactors (Fig. 6C) and 15 stress-induced interactors (Fig. 6D) that were present in both the HA and Myc datasets. MS protein identifications are summarized in supplemental Table 13. In total, 90 proteins were identified as potential OGA-interactors using SILAC-BioID-MS/MS (Table 1). Of these interactors, we identified 21 proteins above background in the basal and stressed samples (regardless of fold change upon stress) from both datasets (Fig. 6E), and we consider these proteins to be high-confidence binding partners of OGA (boldface in Table 1). Finally, gene list analysis using the Protein Analysis Through Evolutionary Relationships (PANTHER) (61, 62) classification system revealed that the identified proteins have diverse functions, belonging to classes of chaperones, cytoskeletal proteins, nucleic acid-binding proteins, and others (Fig. 6F).
Figure 6.

SILAC-BioID-MS/MS reveals numerous basal and stress-induced OGA-interacting proteins. Venn diagrams illustrate the following: A, basal and stress-induced interactors identified in the OGA-mBirA-HA screen. B, basal and stress-induced interactors identified in the Myc-mBirA-OGA screen. C, basal interactors identified in the HA and Myc datasets. D, stress-induced interactors identified in the HA and Myc datasets. E, interactors identified above background in the basal and stressed samples (regardless of fold change upon stress) in the HA and Myc datasets. F, PANTHER gene list analysis indicating the protein classes represented in the OGA interactome.
Table 1.
Interacting partners of OGA
Boldface proteins are high confidence interactors that were identified in the basal and stressed samples in the HA and Myc datasets.
Oxidative stress induces the association of OGA with FAS, FLNA, HSC70, and OGT
To validate a subset of the identified protein-protein interactions, endogenous OGA was enriched using an anti-OGA antibody from NETN U2OS cell lysates treated with H2O2 (1–3 h), and Western blotting was performed for interacting partners-of-interest (Fig. 7A). In addition to a subset of proteins identified in the screen, we also probed for OGT, a known binding partner of OGA (63). The interaction of OGA with FAS, FLNA, HSC70, and OGT is clearly induced in response to oxidative stress (Fig. 7A). Actin is shown as both a loading and negative control.
Figure 7.

Oxidative stress induces the association of OGA with FAS, FLNA, HSC70, and OGT. U2OS cells were treated with Vehicle (V) or H2O2 (2.5 mm, 1–3 h). n = 3. A, anti-OGA antibody (IP: OGA; top panel) or a rabbit isotype control immunoglobulin (IP: IgG; middle panel) was used to enrich endogenous OGA from NETN cell lysates (500 μg), of which 1.5–2% (input) and 30–40% (immunoprecipitate) were analyzed by SDS-PAGE. OGA, FAS, FLNA, HSC70, OGT (positive control), and actin (loading/negative control) were detected by Western blotting. B, anti-FAS antibody (IP: FAS; top panel) or a rabbit isotype control immunoglobulin (IP: IgG; middle panel) was used to enrich endogenous FAS from NETN cell lysates (250 μg), of which 3% (input) and 60% (immunoprecipitate) were analyzed by SDS-PAGE. FAS, OGA, HSC70, OGT, and actin (loading/negative control) were detected by Western blotting. C, U2OS cells were transfected with pcDNA3.1 (control) or pCMV-SPORT6 V5-FAS (test). An anti-V5 antibody was used to enrich V5-FAS from control and test NETN cell lysates (300 μg), of which 1.7% (input) and 33.3% (immunoprecipitate) were analyzed by SDS-PAGE. V5, OGA, HSC70, OGT, and actin (loading/negative control) were detected by Western blotting. A–C, FAS (CST) and FAS (NB) represent anti-FAS antibody from Cell Signaling Technology and Novus Biologicals, respectively. To ensure that images were in the linear range, Western blot exposures from the input and immunoprecipitated fractions are often different. The exposure lengths for the test and control isotype antibody immunoprecipitates are always identical. The migration of molecular mass (MW) markers is indicated.
Further validation of these protein-protein interactions was performed by immunoprecipitation (IP) of endogenous FAS and V5-tagged FAS using an anti-FAS antibody and an anti-V5 antibody, respectively. Endogenous FAS or transiently overexpressed pCMV-SPORT6 V5-FAS was enriched from NETN U2OS cell lysates treated with H2O2 (1–3 h), and Western blotting was performed for interacting partners-of-interest (Fig. 7, B and C). Consistent with previous results (Fig. 7A), the interaction between OGA and endogenous FAS is induced in response to oxidative stress (Fig. 7, B and C). Interestingly, we also observe that OGT and HSC70 exhibit increased binding to endogenous FAS and V5-FAS upon oxidative stress (Fig. 7, B and C).
To determine whether these protein-protein interactions are conserved in other cell types in addition to U2OS cells, we enriched endogenous OGA and endogenous FAS from HEPG2 human hepatocellular carcinoma cells (supplemental Fig. 5). We chose HEPG2 cells as a recent publication has indicated an interaction between OGT and FAS in the liver (64). Western blotting for the proteins-of-interest reveals that FAS and HSC70 co-IP with OGA in HEPG2 cells under basal conditions (supplemental Fig. 5A). We also observe that OGA and HSC70 co-IP with FAS basally in HEPG2 cells (supplemental Fig. 5B). Unlike U2OS cells, the interactions in HEPG2 cells are not induced in response to oxidative stress (data not shown). Furthermore, we assessed these interactions in murine liver tissue by enriching endogenous OGA and endogenous FAS. We have demonstrated that HSC70 co-IPs with OGA (supplemental Fig. 5C), and that OGA and HSC70 co-IP with FAS in normal liver tissue (supplemental Fig. 5D). Overall, these data suggest that the aforementioned protein-protein interactions are not specific to only U2OS cells, but that the interactions also occur in normal tissue and that the pathways regulating OGT and OGA may be cell/tissue type-specific.
An immunoprecipitation with a rabbit isotype control immunoglobulin (IgG) was used as an indicator of nonspecific binding for the endogenous OGA and endogenous FAS IPs (Fig. 7, A and B; supplemental Fig. 5), and pcDNA3.1-overexpressing cells were used to control for nonspecific binding in the V5-FAS IPs (Fig. 7C). Of note, a band at the apparent molecular weight of actin is observed in the control IgG IP (Fig. 7B). Analysis of control IgG alone in buffer indicates that this signal arises from the anti-actin primary antibody (data not shown).
OGA exhibits reduced specific activity when bound to FAS
Next we sought to determine whether FAS alters the specific activity of OGA. As the mechanism controlling the stress-induced association of OGA and FAS is currently unknown, we assessed the activity of OGA in cells stably overexpressing pcDNA3.1 or V5-FAS and treated with or without 2 h H2O2 (Fig. 8). The immunoprecipitation technique utilized in Fig. 7C was coupled with a downstream OGA activity assay. This allowed us to measure the activity of OGA in total cell lysates (Fig. 8, A and C) and the pool of OGA bound to FAS (Fig. 8, B and D). In total cell lysates (Fig. 8A), overexpression of V5-FAS did not alter OGA activity (Fig. 8C), and we attribute this observation to the small percentage of OGA that associates with FAS (<5%). To overcome the stoichiometry of this interaction, we enriched V5-FAS using an anti-V5 antibody and assessed the activity of OGA on the protein A/G magnetic beads (Fig. 8, B and D).
Figure 8.

OGA exhibits reduced catalytic activity when bound to FAS. U2OS cells stably overexpressing pcDNA3.1 (control) or pcDNA3.1 V5-FAS (test) were treated with vehicle (V) or H2O2 (2.5 mm, 2 h). An anti-V5 antibody was used to enrich V5-FAS from control and test NETN cell lysates (1.6 mg). n = 3. A and B, V5, OGA, and actin (loading/negative control) were detected by Western blotting. Western blots for each antibody were exposed for equal lengths of time. A, analysis of the inputs and unbound fractions. B, analysis of the bound fractions (31.25%). C, OGA activity was measured in the inputs and unbound fractions using 4MU-GlcNAc (1 mm). n = 3, two technical replicates per assay. Fluorescence values were converted to picomoles/min and then normalized to the pcDNA3.1 vehicle-treated sample. D, OGA activity was assessed in the input, bound (on-bead, 31.25%), and unbound fractions using 4MU-GlcNAc (1 mm). n = 3, two technical replicates per assay. Fluorescence values were converted to picomoles/min/μg using densitometric analysis of OGA in the input serial dilutions and the bound fractions, and then normalized to the pcDNA3.1 vehicle-treated sample. Only the data from FAS-overexpressing cells treated with H2O2 are shown, as OGA protein and activity was absent in the bound fraction of the other samples. Data are presented as the mean ± S.E. Significance was determined by RM-1ANOVA followed by Tukey's MCT, and differences were considered statistically significant at p ≤ 0.0001 (****). The migration of molecular mass (MW) markers is indicated.
Consistent with previous results (Fig. 7C), the interaction of V5-FAS with OGA was induced in response to oxidative stress (Fig. 8B). To assess the specific activity of OGA bound to FAS (on-bead) and to compare it with the specific activity of OGA in the unbound and input lysates, we determined the amount of OGA on the beads using Western blotting quantitation of the bound fractions and a dilution series of the inputs. The fraction of OGA bound to V5-FAS during oxidative stress exhibited an ∼85% reduction in specific activity (Fig. 8D, RM-1ANOVA/Tukey's MCT, p ≤ 0.0001) when compared with its activity in the unbound fraction. Importantly, we did not detect on-bead OGA activity above the baseline in the pcDNA3.1 controls or the vehicle-treated V5-FAS sample.
FAS overexpression increases O-GlcNAcylation during oxidative stress
As the pool of OGA bound to FAS is inhibited, we hypothesized that overexpression of FAS would result in a stress-dependent increase in O-GlcNAcylation on a subset of proteins. To test this hypothesis, cells stably overexpressing pcDNA3.1 or V5-FAS were treated with vehicle or H2O2 (1–3 h). Proteins from NETN lysates were separated by SDS-PAGE, and Western blots for OGT, OGA, and O-GlcNAc were performed. O-GlcNAc levels are significantly higher in FAS-overexpressing cells compared with control cells at 3 h H2O2 (Fig. 9, A and B; repeated measures two-way analysis of variance (RM-2ANOVA)/Sidak's MCT, p ≤ 0.01). Of note, we observe variable changes in the expression of OGT and OGA basally upon V5-FAS overexpression that only reach statistical significance for OGT (Fig. 9, A, C and D; RM-2ANOVA/Sidak's MCT, p ≤ 0.001). However, the expression of OGA and OGT remain unchanged in FAS-overexpressing cells during the hydrogen peroxide time course. Overall, these data suggest that FAS binds to and sequesters OGA preventing it from de-glycosylating a subset of proteins during oxidative stress, thereby augmenting cellular O-GlcNAcylation (Fig. 10).
Figure 9.
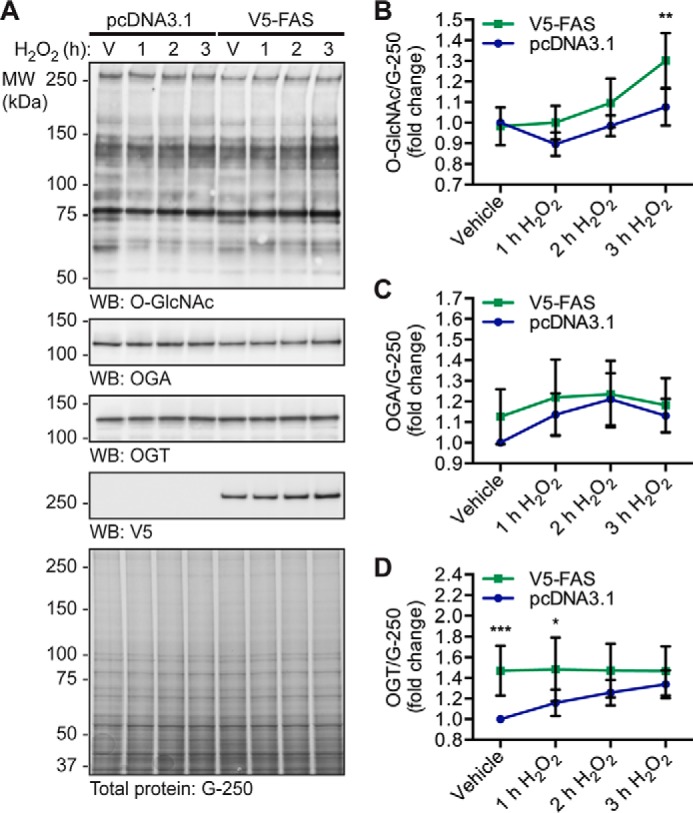
FAS overexpression increases O-GlcNAcylation during oxidative stress. U2OS cells stably overexpressing pcDNA3.1 or pcDNA3.1 V5-FAS were treated with vehicle (V) or H2O2 (2.5 mm, 1–3 h). n = 5. A, NETN lysates (∼7.5 μg) were analyzed by SDS-PAGE. O-GlcNAc, OGA, OGT, V5, and actin were detected by Western blotting. Total protein stain (colloidal Coomassie G-250) was used to assess protein load. The migration of molecular mass (MW) markers is indicated. B, quantitation of O-GlcNAc levels normalized to G-250. C, quantitation of OGA expression normalized to G-250. D, quantitation of OGT expression normalized to G-250. B–D, data are presented as the mean ± S.E. Significance was determined by RM-2ANOVA followed by Sidak's MCT, and differences were considered statistically significant at p ≤ 0.05 (*), p ≤ 0.01 (**), and p ≤ 0.001 (***).
Figure 10.
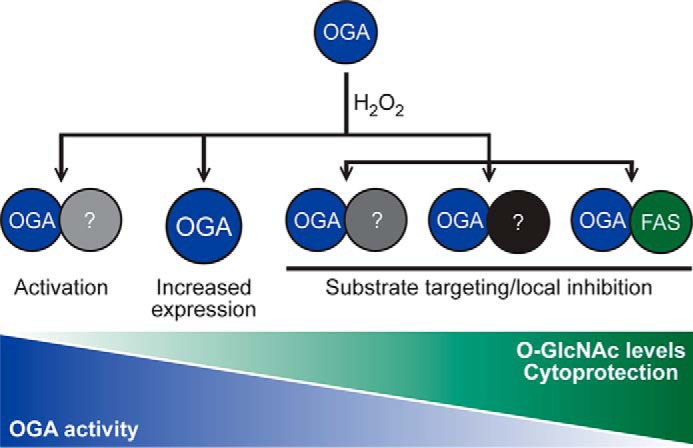
Proposed model for the regulation of OGA during oxidative stress resulting in elevated levels of O-GlcNAc. O-GlcNAc levels become elevated during oxidative stress, and this is associated with cytoprotection. Counterintuitively, in U2OS cells exposed to oxidative stress, OGT activity remains constant, whereas OGA activity and expression are elevated. Our data support a model in which OGA forms complexes with other proteins (?), such as FAS, that regulate its activity leading to a stress-induced elevation of O-GlcNAc.
Discussion
Dynamic O-GlcNAcylation is a critical regulator of many cellular processes, including the cellular stress response and survival signaling (1–3, 13). The molecular mechanisms by which cells communicate with OGT and OGA to glycosylate and de-glycosylate the correct substrates in response to stimuli, including cell stress and injury, are not well understood. The goal of this study was to determine which mechanisms the cell utilizes to regulate O-GlcNAc levels during oxidative stress and to provide insight into the proteins that interact with and regulate OGA. We have demonstrated that both OGA and OGT appear to be targeted during oxidative stress, resulting in an increase in the expression of both enzymes and elevated OGA activity (Fig. 1). An increase in the expression and activity of OGA cannot be reconciled with the observed increase in O-GlcNAc (Fig. 1), suggesting that OGA is targeted to substrates or that specific pools of OGA are inhibited. Several lines of evidence support this rationale. First, in glucose-deprived Neuro2A cells, O-GlcNAc levels are robustly elevated. However, only modest changes in OGT expression, but not specific activity, are observed. Contrary to expectations, there is a decrease in UDP-GlcNAc levels and an increase in OGA activity (32). Second, OGT interacts with p38 mitogen-activated protein kinase during glucose starvation, resulting in the targeting of OGT to glycosylate substrates such as neurofilament H (32). Third, we have recently reported that a subset of proteins exhibit decreased O-GlcNAcylation during oxidative stress, even when global O-GlcNAc levels are elevated (65). To define the regulation of OGA during oxidative stress, we have identified a subset of its interaction partners and determined how these interactions change with oxidative stress. Collectively, we have identified 90 binding partners and validated the interaction of OGA with FAS, FLNA, HSC70, and OGT. Notably, FAS was demonstrated to inhibit OGA activity, and consistent with this observation cellular O-GlcNAcylation was augmented in FAS-overexpressing cells upon oxidative stress.
In this study, we utilized BioID (39) to identify the interaction partners of OGA. BioID offers many advantages when compared with other methodologies (39, 45, 66), such as identifying low affinity and transient interactors, as well as obviating the need for an antibody-based enrichment. One disadvantage of this technique, when combined with SILAC quantification, is that the fold change reported for signal-induced interactions can be diluted out by the long biotin-labeling step (16 h). This dilution effect is highlighted by our data, in which proteins such as FAS and FLNA demonstrate clear stress-induced associations with OGA by co-immunoprecipitation, but they are only enriched ∼25% over OGA in the BioID screen. We speculate that the interactions of OGA with FAS and FLNA exist with a low affinity basally but are stabilized and enhanced during oxidative stress. In addition, BioID may be capturing stress-induced interactions between these proteins that occur as a result of natural fluctuations in reactive oxygen species levels that occur in growing cells. The recent development of spatially and temporally restricted enzymatic biotinylation has resolved this issue (67, 68). However, this second-generation approach relies on biotinylation that is activated by hydrogen peroxide (67, 68), a technique that is not compatible with our oxidative stress model. One additional caveat of the BioID approach is that the long biotin-labeling step reduces the chance of identifying interactions that dissociate upon stress. This is further exacerbated by our analysis approach, which excluded proteins if mass spectrometric quantification was present in only one channel.
Our study, using SILAC-BioID-MS/MS, has discovered candidate regulatory proteins of OGA during injury through the global identification of OGA's binding partners. Collectively, our screen identified 90 interacting proteins of OGA, which fall into diverse groups but were enriched in chaperones, cytoskeletal proteins, and nucleic acid-binding proteins (Fig. 6F). Of these proteins, 21 were present in the basal and stressed samples from both datasets (boldface, Table 1) suggesting that these proteins are robust, high confidence interactors of OGA. Of note, six proteins were identified to co-purify with OGA during its initial cloning and characterization (6), and one of these proteins (HSC70) was confirmed in our BioID screen. Recently, OGA was also identified to bind Mi2β, GATA-1, and Friend of GATA-1 at the Aγ-globin promoter using co-immunoprecipitation (69), although none of these nuclear interactors were identified in our study. Interestingly, our BioID screen revealed mitochondrial OGA-interacting proteins such as ADP/ATP translocase 2, of which isoform 1 of this protein has previously been reported to be O-GlcNAcylated in cardiac mitochondria (70). Although these results require further validation, our data are consistent with the co-localization of OGA(-mBirA) and MitoTracker in U2OS cells, as well as recent work demonstrating the mitochondrial localization of OGA (55).
As our goal is to understand the regulation of OGA during cellular injury, we focused our validation efforts on proteins whose association with OGA was augmented during oxidative stress (61 total proteins; Fig. 6D). A number of proteins were of particular interest, including FAS, FLNA, and HSC70, as they are known to be involved in the cellular stress response. Furthermore, confirmation of FAS and FLNA allowed us to test the arbitrary threshold of 25% set for stress-induced interactions. FAS is most commonly known as the enzyme that performs de novo lipogenesis, synthesizing 16-carbon chain fatty acids (palmitate) from acetyl-CoA and malonyl-CoA (71). Recently, FAS has been implicated as a metabolic oncogene and a biomarker for cancer detection and prognosis (72–77). Suggesting that FAS is a pro-survival signaling molecule, its inhibition has been demonstrated to induce tumor cell apoptosis through various mechanisms, including cell cycle arrest (78), reduced cellular growth and proliferation (76, 79–82), decreased phospholipid biosynthesis (82), disruption of lipid raft architecture (82), and blockage of the β-catenin and PI3K-AKT-mTOR signal transduction pathways (82). Importantly for our studies, FAS is also implicated in protecting the heart and has been demonstrated to be up-regulated in cardiomyocytes during heart failure (83–85). Interestingly, heart-specific FAS knock-out mice exhibit up-regulated calcium/calmodulin-dependent protein kinase II (CAMKII) signaling upon an acute transaortic constriction mechanical stress, leading to rapid cardiac dysfunction and arrhythmias (84). Supporting this model, CAMKII is O-GlcNAc-modified at serine 279 during acute hyperglycemia, resulting in its activation and cardiac dysfunction (86). These data suggest that FAS induction in the stressed heart may be a protective compensatory response to pathological calcium flux (84) and may at least in part be under the control of O-GlcNAc cycling. In accordance with this hypothesis, we have demonstrated that FAS interacts with OGA in a stress-induced manner in U2OS cells (Fig. 7), and this results in the inhibition of OGA (Fig. 8) and increased cellular O-GlcNAcylation (Fig. 9). Collectively, these data lead to a novel and attractive model in which FAS binds to and inhibits OGA upon oxidative stress to promote cell survival (Fig. 10).
In addition to FAS, we identified and validated the interactions of OGA with FLNA, HSC70, and OGT in U2OS cells (Fig. 7A). Although OGT and OGA have previously been reported to interact (63), the physiological significance of the stress-dependent association remains uncertain and suggests reciprocal regulation between the two enzymes. Interestingly, HSC70 and OGT were also demonstrated to interact with FAS in response to oxidative stress (Fig. 7, B and C), raising the possibility of a large stress-induced multiprotein complex containing FAS, OGT, OGA, and HSC70. These interactions are maintained basally in HEPG2 liver cancer cells and normal murine liver tissue (supplemental Fig. 5), suggesting that the interactions are not specific to U2OS cells. These data are in concordance with a recent study by Baldini et al. (64) demonstrating that FAS binds OGT in the liver of ob/ob mice. Collectively, our data suggest that the cell/tissue type may regulate the interactions and thus the regulation of OGT and OGA.
Our study, utilizing proximity biotinylation and SILAC-based MS, has revealed a host of novel basal and oxidative stress-dependent binding partners of OGA (Fig. 6; Table 1). Our data provide evidence for a model in which the interactors of OGA, such as FAS, regulate its local activity in a manner consistent with cell survival (Fig. 10). Such results will provide a framework for understanding the regulation of OGA during injury and in other models in which O-GlcNAc is misregulated, such as cancer, neurodegenerative disease, and metabolic syndrome.
Experimental procedures
Reagents
All chemicals and reagents were of the highest grade and supplied by Sigma or Thermo Fisher Scientific (Waltham, MA), unless otherwise indicated. TMG (54) was synthesized by S.D. ChemMolecules LLC (Owings Mills, MD) to a purity of 99.1%, as determined by high performance liquid chromatography. The chemical structure of TMG was verified by 1H nuclear magnetic resonance and ESI-MS.
Antibodies
The following antibodies were used for Western blotting analysis: anti-OGA (345), anti-O-GlcNAc (CTD110.6) (gift from The Johns Hopkins University School of Medicine Core C4); anti-FLNA (A301-135A; Bethyl Laboratories); anti-HA (H6908), anti-actin (A5060), anti-OGT (DM17, O6264), anti-mouse IgM-HRP (A8786; Sigma); NeutrAvidin-HRP (31030), anti-V5 (461157; Thermo Fisher Scientific); anti-Myc (9E10, CRL-1729; American Type Culture Collection (ATCC), Manassas, VA); anti-FAS (3180; Cell Signaling Technology, Danvers, MA); anti-FAS (H00002194-M01; Novus Biologicals, Littleton, CO); anti-HSC70 (sc-7298), anti-chicken IgY-HRP (sc-2428; Santa Cruz Biotechnology, Dallas, TX); anti-rabbit IgG-HRP (NA934V) and anti-mouse IgG-HRP (NA931V; GE Healthcare). The following antibodies were used for indirect immunofluorescence: anti-BirA (NB600-1098; Novus Biologicals); NeutrAvidin-DyLight 633 (22844; Thermo Fisher Scientific); and anti-OGA (345), anti-chicken IgY-Alexa Fluor 488 (703-545-155; Jackson ImmunoResearch, West Grove, PA). The following antibodies were used for immunoprecipitation: rabbit isotype control IgG (P120-101), anti-OGA (A304-345A), anti-FAS (A301-324A; Bethyl Laboratories); anti-V5 (461157; Thermo Fisher Scientific).
Cloning
The following DNA constructs were gifts (Kyle Roux, Sanford Research (39)): pcDNA3.1 Myc-mBirA multiple cloning site (MCS; plasmid 35700; Addgene, Cambridge, MA) and pcDNA3.1 MCS-mBirA-HA (plasmid 36047; Addgene). Myc-mBirA-OGA was generated by sub-cloning full-length human OGA (from pcDNA3.1 His6-OGA; gift from The Johns Hopkins University School of Medicine Core C4 (6)) into the MCS of pcDNA3.1 Myc-mBirA-MCS using NotI and PmeI. OGA-mBirA-HA was generated as follows: 1) PCR insertion of a start codon upstream of mBirA in pcDNA3.1 MCS-mBirA-HA; 2) PCR deletion of 23 bp between the AgeI and BamHI restriction sites in pcDNA3.1 MCS-mBirA-HA; 3) PCR insertion of a NotI restriction site upstream of AgeI in pcDNA3.1 MCS-mBirA-HA; 4) PCR insertion of an AgeI restriction site 3′ of full-length human OGA (from pcDNA3.1 His6-OGA; gift from The Johns Hopkins University School of Medicine Core C4 (6)); and 5) subcloning full-length OGA (from pcDNA3.1 His6-OGA) into the MCS of pcDNA3.1 MCS-mBirA-HA using NotI and AgeI. All of the mutagenesis PCRs described above were performed with KOD polymerase (EMD Millipore, Billerica, MA). Full-length untagged human FAS in pCMV-SPORT6 was a gift (Michael Wolfgang, The Johns Hopkins University School of Medicine). pCMV-SPORT6 His6-V5-TEV-FAS was generated by in-fusion using the SalI restriction site. His6-V5-TEV-FAS was subcloned into pcDNA3.1 using EcoRI and NotI. His6-V5-TEV-FAS will be referred to as V5-FAS. All primer sequences are available upon request. DNA constructs were verified by Sanger sequencing using an Applied Biosystems 3730xl DNA analyzer (Thermo Fisher Scientific; The Johns Hopkins University School of Medicine Synthesis and Sequencing Facility).
Cell culture
U2OS human osteosarcoma cells and HEPG2 human hepatocellular carcinoma cells (ATCC) were cultured in high glucose (4.5 g/liter) DMEM (Corning, Manassas, VA) supplemented with 10% (v/v) heat-inactivated FBS (Thermo Fisher Scientific), and 1% (v/v) penicillin/streptomycin (Corning) in a humidified water-jacketed CO2 (5%) incubator at 37 °C. All experiments were performed in U2OS cells unless otherwise indicated (supplemental Fig. 5 only).
All plasmid DNA transfections were performed in Opti-MEM (Thermo Fisher Scientific) using FuGENE 6 (Promega, Madison, WI). In all cases, cells were harvested 45–50 h post-transfection and 18–20 h post-feeding. Cell treatments included biotin (25 μm, 16 h; Sigma), H2O2 (2.5 mm, 1–3 h as indicated; Sigma), and TMG (100 nm, 20 h). Vehicle control was complete media (biotin, H2O2) or HEPES, pH 7.8 (TMG).
For the SILAC experiment, U2OS cells were cultured in light (unlabeled arginine and lysine; Sigma), medium ([13C6]arginine, lysine-D4; Cambridge Isotopes, Tewksbury, MA), or heavy ([13C6,15N4]arginine and [13C6,15N2]lysine; Cambridge Isotopes) media (40, 41). In all cases, low glucose (1 g/liter) DMEM (Athena Environmental Sciences, Baltimore, MD) was supplemented with unlabeled leucine (104.8 mg/liter, Sigma) and methionine (30 mg/liter, Sigma), 1 mm sodium pyruvate (Corning), 3.5 g/liter glucose (Sigma), 10% (v/v) FBS, and 1% (v/v) penicillin/streptomycin. Cells were passaged for six generations in SILAC media prior to transfection to ensure complete incorporation of the label (44, 45). Labeled cells were transfected with plasmid DNA encoding pcDNA3.1 (control vector), OGA-mBirA-HA, or Myc-mBirA-OGA, treated as indicated, and harvested 49 h post-transfection.
Generation of stable cell lines
Stable constitutive overexpression of V5-FAS in U2OS cells was carried out as follows. A pcDNA3.1 plasmid encoding V5-FAS (or empty vector as a control) was linearized with ScaI. The digested DNA was precipitated with ethanol prior to transfection with FuGENE 6. Stable cell selection was initiated ∼48 h post-transfection and continued for 14 days in 750 μg/ml G418 (Sigma). Cells were maintained in 375 μg/ml G418.
Murine tissue
Male C57BL/6 mice (12–14 weeks of age) were obtained from The Jackson Laboratory (Bar Harbor, ME). Animals were euthanized after anesthesia, and livers were rapidly removed, washed in ice-cold PBS, and snap-frozen in liquid nitrogen. All animal procedures were performed in accordance with the National Institutes of Health Guide for the Care and Use of Laboratory Animals and approved by the Institutional Laboratory Animal Care and Use Committee.
Preparation of cell and tissue lysates
The following lysis buffers were used in this study: TCL Buffer (50 mm Tris, pH 7.5 with 1% (v/v) Nonidet P-40, 150 mm NaCl, 2 mm EDTA, pH 8.0); Denaturing TCL Buffer (50 mm Tris, pH 7.5 with 1% (v/v) Nonidet P-40, 0.5 m urea, 150 mm NaCl, 2 mm EDTA, pH 8.0); NETN buffer (50 mm Tris, pH 8 with 0.5% (v/v) Nonidet P-40, 250 mm NaCl, 5 mm EDTA, pH 8). Unless indicated otherwise, lysis buffers were supplemented with the following inhibitors immediately prior to use: protease inhibitor cocktail sets II and III (EMD Millipore); 10 μm β-hexosaminidase inhibitor (376820; EMD Millipore); 0.5 μm TMG (SD ChemMolecules LLC); 0.1 mm PMSF, 10 mm NaF, 10 mm β-glycerophosphate, 3 μm trichostatin A1 (Sigma). Cells were extracted in the indicated lysis buffer for 30 min on ice with vortexing followed by sonication. Cell debris were pelleted at 17,111 × g (30 min, 4 °C). Livers were extracted in NETN buffer for 10 min on ice followed by homogenization, sonication, and centrifugation (17,200 × g, 30 min, 4 °C). Protein concentration was assessed using the 660 nm protein assay (Thermo Fisher Scientific).
Immunoprecipitation
For the SILAC study, cells were lysed in denaturing TCL buffer, and equal amounts of protein from each sample (2.32 mg) were combined (6.96 mg of total protein). Biotinylated proteins were isolated on high capacity NeutrAvidin-agarose (1.31 ml slurry, Thermo Fisher Scientific) with end-over-end rotation (2 h, 4 °C). The beads were washed in TCL buffer supplemented with 2 m urea (3 times) and subsequently in TBS, pH 7.5 (3 times). Biotinylated proteins were eluted with 2% (w/v) SDS (1.5 ml, 5 min, 95 °C, 10 times). The elution fractions containing biotinylated protein (fractions 1–8, as identified by electrophoresis) were combined and precipitated with acetone (65 h, −20 °C). Protein was recovered by centrifugation (5,000 × g, 30 min, 4 °C). Each pellet was resuspended in 2% (w/v) SDS and combined, and then the proteins were re-precipitated with acetone (18 h, −20 °C). The sample was centrifuged (25,000 × g, 30 min, 4 °C), and the pellet was dried briefly under vacuum.
For co-immunoprecipitation studies, NETN lysate was incubated with antibody overnight (16–20 h, 4 °C, with rotation). Endogenous OGA and FAS were enriched with an anti-OGA antibody and an anti-FAS antibody (Bethyl Laboratories), respectively. Samples were also incubated with rabbit isotype control IgG (Bethyl Laboratories) to indicate nonspecific binding. V5-FAS was enriched with an anti-V5 antibody, and pcDNA3.1-overexpressing cells were used to control for nonspecific binding. Antibody-protein complexes were captured using protein A/G magnetic beads (2 h, 4 °C, with rotation; Thermo Fisher Scientific) pre-blocked with 1 mg/ml BSA. Antibody-protein complexes were washed extensively with NETN buffer and then eluted and denatured in Laemmli sample buffer containing 25 mm DTT. For experiments in supplemental Fig. 5 only, NETN lysate was pre-cleared with rabbit isotype control IgG and protein A/G magnetic beads (2–4 h, 4 °C, with rotation) to reduce nonspecific binding.
Electrophoresis and Western blotting
SDS-PAGE was performed using Tris glycine (TGX, Bio-Rad; Novex, Life Technologies, Inc.) and Tris acetate (XT, Bio-Rad; Novex, Life Technologies, Inc.) polyacrylamide gels. Equal sample volumes at equal concentrations were loaded onto the gel, with the exception of immunoprecipitate fractions where the volume typically exceeded that of the input fractions. Proteins were electroblotted to nitrocellulose (0.45 μm; Bio-Rad). Membranes were blocked in 3% (w/v) nonfat milk in TBS-T (0.05% (v/v) Tween 20; 1 h, 25 °C), incubated with primary antibodies (16–20 h, 4 °C) and then incubated with HRP-conjugated secondary antibodies (1 h, 25 °C). Western blots were developed using Immobilon Western Chemiluminescent Substrate (EMD Millipore) and captured on autoradiography film or the Amersham Biosciences Imager 600 RGB (GE Healthcare). Western blots were incubated with 0.1% (w/v) sodium azide in PBS (10 min, 25 °C), stripped in 200 mm glycine, pH 2.5 (1 h, 25 °C), and then re-probed as described above. Stripped blots were re-probed for proteins that migrate at a different molecular weight than the original signal.
Protein load was assessed by Western blotting for a housekeeping protein (actin), total protein gel staining (colloidal Coomassie G-250), or total protein membrane staining (Sypro Ruby; Bio-Rad). Quantitation of Western blots and total protein stains was performed using ImageJ software (version 1.46; National Institutes of Health, Bethesda, MD). Quantitation was performed on individual protein bands, except for O-GlcNAc Western blots and total protein stains where quantitation was performed on the entire lane signal.
Indirect immunofluorescence
U2OS cells were grown and transfected on glass coverslips. Mitochondria were stained in vivo with MitoTracker Orange CMTMRos (200 nm, 45 min, 37 °C; Thermo Fisher Scientific). Cells were fixed in 4% (v/v) paraformaldehyde in PBS (15 min, on ice) and permeabilized with 0.5% (v/v) Triton X-100 in PBS (15 min, on ice). Slides were blocked in 3% (w/v) BSA in PBS (1–2 h, 25 °C), incubated with primary antibodies in 3% (w/v) BSA-X (0.05% (v/v) Triton X-100; 16–20 h, 4 °C), and then incubated with fluorophore-conjugated secondary antibodies in 3% (w/v) BSA-X (1 h, 25 °C). Nuclei were stained with Hoechst 33342 (8 min, 25 °C). Coverslips were mounted in VECTASHIELD Antifade Mounting Medium (Vector Laboratories, Burlingame, CA), sealed, and stored at 4 °C. Images were captured at 25 °C using an upright Zeiss (Carl Zeiss, Inc., Oberkochen, Germany) Axio Examiner 710NLO-Meta multiphoton and confocal laser-scanning microscope (C-Apochromat ±63/1.20 W Korr M27 water immersion objective) with spectral detection. Images were obtained on ZEN 2010 software (Carl Zeiss Inc.) and processed using Imaris software (version 7.6.5; Bitplane, Zurich, Switzerland). Image acquisition and processing were performed at The Johns Hopkins University School of Medicine Microscope Facility.
OGA activity assays
Lysates for OGA assays were prepared as follows. For Fig. 2C, lysates in TCL buffer at an equal concentration (1 mg/ml) were desalted into desalting buffer (20 mm Tris, pH 7.8, 20% (v/v) glycerol) using Zeba spin desalting columns (7,000 molecular weight cutoff; Thermo Fisher Scientific) and then the protein concentration was re-assessed. For Figs. 1G and 8, C and D, cells were lysed in NETN buffer without TMG. Lysates at equal concentration (1 mg/ml) were diluted 4-fold with ultrapure water (0.25× NETN) and assayed in a final concentration of 0.05× NETN.
The activity of OGA was assessed in duplicate with 1 mm 4MU-GlcNAc or 4MU-GalNAc (Sigma) fluorescent substrate, 100 mm GalNAc (Sigma), and OGA assay buffer (100 mm sodium cacodylate, pH 6.4 (50 mm in Fig. 2C), 0.3% (w/v) BSA) in a black flat/clear-bottomed 96-well plate as reported previously (46). β-N-Acetylhexosaminidasef (New England Biolabs, Ipswich, MA) diluted in desalting buffer or 0.25× NETN buffer was used as a positive control (5 units/well). Assays were quenched with glycine, pH 10.75 (final concentration, 120 mm in 100-μl assays and 150 mm in 50-μl assays), and the fluorescence intensity was measured using the Synergy HT microplate reader (BioTek Instruments, Inc., Winooski, VT; excitation 360 nm and emission 460 nm). OGA activity in cell lysates was normalized by subtracting the fluorescence signal resulting from lysosomal hexosaminidase contamination, which was assessed using 4MU-GalNAc (46). Activity was converted to picomoles/min/mg using a standard curve of free 4MU.
To assay OGA on beads (Fig. 8), U2OS cells stably overexpressing pcDNA3.1 or pcDNA3.1 V5-FAS were treated with vehicle or H2O2 (2.5 mm, 2 h). Cells were lysed in NETN buffer without TMG, and lysates were diluted to equal concentrations (1 mg/ml). V5-FAS was enriched using an anti-V5 antibody (30 min, 4 °C, with rotation) and captured using protein A/G magnetic beads (2 h, 4 °C, with rotation) pre-blocked with BSA. Antibody-protein complexes were washed with 1× NETN buffer (five times) and subsequently with 0.25× NETN buffer (three times). OGA activity assays were performed on-bead (3 h, 37 °C, with rotation) in duplicate (as described above). The reaction product was transferred to a black flat/clear-bottomed 96-well plate for fluorescence measurements. Serial dilutions of lysates from the inputs and unbound fractions were prepared and processed in diluted NETN (as described above). To assess the specific activity of OGA on-bead (bound to FAS) and compare it with the specific activity of OGA in the unbound and input lysates, the amount of OGA on the beads was determined by Western blotting quantitation of the bound fractions and serial dilutions of the inputs. To ensure accurate quantitation of OGA, the bound fractions from the V5-FAS cells were electroblotted to the same membrane as the corresponding V5-FAS input serial dilutions. Western blots for each antibody were exposed for equal lengths of time. Fluorescence values were converted to picomoles/min (Fig. 8C) or picomoles/min/μg (Fig. 8D) using a standard curve of free 4MU and the densitometric analysis described above. Finally, the data were normalized to the pcDNA3.1 vehicle-treated input sample to control for variable baseline OGA activity between biological replicates (reported as fold change).
OGT activity assays
Cells were lysed in NETN buffer without NaF and β-glycerophosphate (phosphatase inhibitors). Lysates at equal concentrations (2 mg/ml) were diluted 8-fold with ultrapure water (0.125× NETN) and assayed in a final concentration of 0.05× NETN. In a clear round-bottomed 96-well plate, 5 μg of cell lysate was incubated (1 h, 25 °C) in triplicate with 0.5 μCi of [3H]UDP-GlcNAc (ART 0128; American Radiolabeled Chemicals, St. Louis, MO; specific activity, 60 Ci/mmol), 1 mm casein kinase II (CKII) acceptor peptide (PGGSTPVSSANMM; The Johns Hopkins University School of Medicine Synthesis and Sequencing Facility), 2.5 units of calf intestinal alkaline phosphatase (New England Biolabs), 0.25 mm 5′-AMP (Sigma), and OGT assay buffer (100 mm sodium cacodylate, pH 6.4, 0.3% (w/v) BSA). Recombinant His6-OGT was purified in-house on nickel-nitrilotriacetic acid-agarose (Qiagen, Venlo, The Netherlands), diluted in 0.125× NETN buffer, and used as a positive control (0.5 μg/well). Assays were quenched with 37.5 mm formate, 750 mm NaCl (final concentration). Samples were loaded onto a Strata C18 96-well plate (25 mg/well; 8E-S001-CGB; Phenomenex) activated with 100% methanol and equilibrated in 50 mm formate, 1 m NaCl (three times with 2 ml each). The C18 plate was subsequently washed with 50 mm formate with 1 m NaCl, water, and 50 mm formate (two times with 2 ml each). The reaction product was eluted from the column with 100% methanol (2 ml), and the incorporation of radiolabeled GlcNAc was assessed by liquid scintillation counting (Beckman Coulter Inc., Indianapolis, IN). Activity was normalized by subtracting the counts arising from the average of triplicate samples incubated without CKII acceptor peptide. Counts/min were converted to disintegrations/min using a standard curve of [3H]UDP-GlcNAc, and then to femtomoles/min/mg.
Mass spectrometry sample preparation and analysis
MS sample preparation and data acquisition were performed by The Johns Hopkins University School of Medicine Mass Spectrometry and Proteomics Facility. Acetone protein pellets (as described above) were resuspended in 100 μl of 100 mm ammonium bicarbonate (NH4HCO3), pH 7.8, and 1 μl of 1% Protease Max (Promega) and sonicated for 15 min. The sample was then reduced and alkylated with 10 mm DTT and 55 mm iodoacetamide, respectively, and digested with a trypsin/LysC mixture (V5071; Promega). The resulting peptides were dried by vacuum centrifugation and resuspended in 50 μl of 100 mm TEAB. Subsequently, bRP micro-scale fractionation was performed using an Agilent 1200 capLC system with a multi-wavelength detector. Fractionation was performed at 5 μl/min on a 300-μm inner diameter fused silica column self-packed with Waters XBridge BEH130 C18 RP resin (3.5 μm, 130 Å; Milford, MA), and fractions were collected at 2-min intervals with a Probot (LC Packings) fraction collector (Dionex, Amsterdam, The Netherlands). After loading for 12 min onto the column, a gradient from 0 to 30% (v/v) mobile phase A (10 mm TEAB) to B (90% (v/v) acetonitrile (ACN), 10 mm TEAB) was performed over a 50-min time interval before ramping to 100% (v/v) B over 10 min and then holding for an additional 10 min. Fractions were concatenated into 12 fractions for subsequent LC-MS/MS analysis. Peptide fractions from bRP chromatography were injected onto a 2-cm desalting trap column packed with YMC C18 material (75-μm inner diameter, 5–15 μm, 120 Å; Allentown, PA) at 5 μl/min for 6 min before being eluted onto an analytical column packed with Michrom Magic C18 (75 μm × 15 cm, 5 μm, 120 Å; Bruker Daltonics, Billerica, MA) using a nanoAquity nanoLC system (Waters, MA) with a nanoflow solvent delivery of 300 nl/min. Each sample was separated on a 90-min gradient (5–90% (v/v) ACN, 0.1% (v/v) formate) with a flow rate of 300 nl/min. The peptides were eluted and ionized via emitter tip (10 μm; New Objective, Woburn, MA) and maintained at a 2.2-kV electrospray voltage into a Q-Exactive mass spectrometer (Thermo Fisher Scientific). Precursor ions were selected for MS/MS fragmentation using a data-dependent “Top 15” method operating in FT-FT acquisition mode. Precursor ions were scanned between m/z (mass/charge) 350 and 1800 Da at 70,000 resolution with a target maximum of 3e6 ions. Fragment ions (MS/MS scans) were analyzed at 17,500 resolution with a target of 1e5 ions. Maximum injection times for the precursor and fragment ions were set to 100 and 250 ms, respectively. The ion selection threshold for triggering MS/MS fragmentation was set to 2e4 counts. An isolation width and offset of 2.0 and 0.5 Da, respectively, were used to perform high energy collision-induced dissociation fragmentation with a normalized collision energy of 27. The polysiloxane background peak at 371.101230 m/z was used as a lock mass for each scan to maintain mass accuracy.
Search parameters and acceptance criteria
Peptide identifications were determined using a 30 parts per million precursor ion tolerance, a 0.05-Da MS/MS fragment ion tolerance, and a maximum of two missed cleavages. Methylthio-modification of cysteine residues was considered a static modification, whereas oxidation of methionine, biotinylation of lysine, and deamidation of asparagine and glutamine were set as variable modifications. For the SILAC labeling, variable modifications included lysine (2H4 and 13C615N2) and arginine (13C6 and 13C615N4) (light, no labels; medium, Arg-6, Lys-4; heavy, Arg-10, Lys-8). Spectra files (*.RAW) were searched through Proteome Discoverer 1.4 (Thermo Fisher Scientific) using the Mascot algorithm (Version 2.1, Matrix Sciences, United Kingdom) against the RefSeq2014 human database. The data were processed through the Xtract and MS2 processor nodes together with an unaltered search, and the combined searches were processed through Percolator node (Department of Genome Sciences, University of Washington, Seattle) for FDR estimation. Raw protein and peptide identifications were validated employing a q-value of 0.05 (5% FDR) and a peptide rank of 1 within Proteome Discoverer (supplemental Fig. 3 (inclusion criteria, filter 1); supplemental Tables 1–3 (HA dataset), 4–6 (Myc dataset)). The mass spectrometry proteomics data have been deposited into the ProteomeXchange Consortium (http://proteomecentral.proteomexchange.org) via the PRIDE partner repository (56–60) with the dataset identifier PXD005039.
The ratio of L/H (H2O2/background), M/H (vehicle/background), and L/M (H2O2/vehicle) were generated in Proteome Discoverer. The following criteria were used to select proteins for further analysis (supplemental Fig. 3). First, proteins considered for analysis have ≥1 unique peptide, ≥2 total peptides, and ≥3 PSMs per identification (supplemental Fig. 3 (inclusion criteria, filter 2); supplemental Tables 7–8). Second, the heavy sample represents background and is anticipated to contain the endogenously biotinylated proteins (carboxylases), proteins that associate with the carboxylases, and proteins that associate nonspecifically with the NeutrAvidin resin used for biotin enrichment. To set a threshold at or below which proteins were considered background, the log2 of the SILAC ratios (L/H; M/H) for the endogenous carboxylases from the HA and Myc datasets (supplemental Table 9) were converted to frequencies and plotted as histograms (supplemental Fig. 4) using GraphPad Prism (version 7; GraphPad Software Inc., La Jolla, CA). We then used the Z-score from a one-sided 95% confidence interval to calculate the log2 threshold for each ratio (L/H; M/H) in each dataset (HA; Myc), which was then converted back to a SILAC ratio (HA dataset: L/H >1.867 and M/H >1.874; Myc dataset: L/H >2.005 and M/H >2.258; supplemental Fig. 3 (exclusion criteria 2), 4; supplemental Table 9). Proteins not meeting the background threshold were excluded (supplemental Tables 10 and 11). Third, the majority of keratins were eliminated, as they are common environmental contaminants present in MS studies (supplemental Fig. 3 (exclusion criteria 3); supplemental Tables 10 and 11). Of note, keratin 8 and 18 were not excluded, as they are known to be O-GlcNAc-modified (87). Fourth, a variety of techniques have been used to set a threshold for signal-induced changes when using SILAC (88–91). As OGA is the “bait,” we assessed the L/M SILAC ratio of OGA (NCOAT; accession no. 1102469) in each dataset, 1.057 and 1.308 for the HA and Myc datasets, respectively (supplemental Tables 10–12). We set an arbitrary threshold of 25% above or below 1.32125 and 0.79275, respectively, for the HA dataset; and 1.635 and 0.981, respectively, for the Myc dataset (supplemental Tables 10–12). Our rationale for this threshold was as follows: as signal-induced changes are diluted out by the BioID labeling method, we set a lower threshold than we have used previously (30–50% change (42, 65, 92)). To validate this threshold, candidate proteins near the threshold (FAS and FLNA) were validated by co-immunoprecipitation. A summary of the protein identifications following each major exclusion criteria is highlighted in supplemental Table 13.
Experimental design and statistical rationale
Graphs and statistical analyses were prepared using GraphPad Prism software (version 6; GraphPad Software Inc.). Data are presented as the mean with error bars representing the standard error of the mean (S.E.) unless otherwise indicated. Unless otherwise noted, three biological replicates (N) were performed for each experiment and are indicated in the figure legends. For OGA activity assays, each biological replicate was assessed in duplicate. In Fig. 2C the transfection efficiency, and thus corresponding OGA activity, varies for each biological replicate. As such, the OGA activity values cannot be averaged, and one representative experiment is shown. In this case, the error bars represent the standard deviation (S.D.) of the two technical replicates. Data with at least three matched groups (Fig. 1: V, 1–3 h H2O2; Fig. 8D: input, bound, and unbound) were analyzed by a parametric RM-1ANOVA. Dunnett's MCT was used to compare each H2O2-treated sample with the vehicle-treated control (Fig. 1), and Tukey's MCT was used to compare OGA activity in the input, bound, and unbound fractions (Fig. 8D). Matched two-sample data (Fig. 2C; pcDNA3.1 ± biotin) were analyzed by a parametric RPT (two-tails, 95% confidence). Data with at least three matched groups (V, 1–3 h H2O2) in two matched samples (pcDNA3.1, V5-FAS) were analyzed by a parametric RM-2ANOVA (Fig. 9). Sidak's MCT was used to compare differences between the two matched samples (pcDNA3.1, V5-FAS) at each H2O2 time point. For all statistical tests, differences were considered significant at p ≤ 0.05 (*), p ≤ 0.01 (**), p ≤ 0.001 (***), and p ≤ 0.0001 (****). SILAC-based MS analysis was performed once. Protein-protein interactions were validated by orthologous methods (immunoprecipitation/Western blotting) using three biological replicates.
Author contributions
J. A. G. and N. E. Z. conceived and designed this study. J. A. G. performed, analyzed, and interpreted all experiments with assistance from N. E. Z. A. O. M. assisted with performing experiments. Mass spectrometry sample preparation, data acquisition, and database searching were performed by R. N. O. and R. N. C. J. A. G. wrote the paper, which was edited by N. E. Z. and R. N. C. All authors approved the final version of the manuscript.
Supplementary Material
Acknowledgments
Antibodies for OGA (345) and O-GlcNAc (CTD110.6), as well as pcDNA3.1 His6-OGA, were kind gifts from the laboratory of Gerald Hart (Department of Biological Chemistry, The Johns Hopkins University School of Medicine Core C4, supported by National Institutes of Health Grant P01HL107153). We thank Michael Wolfgang (Department of Biological Chemistry, The Johns Hopkins University School of Medicine) for providing pCMV-SPORT6 FAS and Kyle Roux (Sanford Research) for providing pcDNA3.1 Myc-mBirA-MCS and pcDNA3.1 MCS-mBirA-HA via Addgene. Confocal microscopy was performed at The Johns Hopkins University School of Medicine Microscope Facility (supported by National Institutes of Health Grant S10RR024550; Research Resources). Mass spectrometry sample preparation, data acquisition, and database searching was performed by The Johns Hopkins University School of Medicine Mass Spectrometry and Proteomics Facility (supported by National Institutes of Health Grant P30CA006973 from NCI).
This work was supported by National Institutes of Health Grant P01HL107153 from NHLBI, Grant F31AG047724 from NIA, and Grant MARC U-STAR T34GM008663 from NIGMS. The authors declare that they have no conflicts of interest with the contents of this article. The content is solely the responsibility of the authors and does not necessarily represent the official views of the National Institutes of Health.
This article contains supplemental Figs. S1–S5 and Tables S1–S13.
The mass spectrometric raw data and spectral libraries associated with this manuscript are available from ProteomeXchange with the accession number PXD005039.
- O-GlcNAc
- O-linked β-N-acetylglucosamine
- 4MU
- 4-methylumbelliferyl
- ACN
- acetonitrile
- AD
- acetyltransferase-like domain
- bRP
- basic reversed phase
- CAMKII
- calcium/calmodulin-dependent protein kinase II
- CD
- catalytic β-N-acetylglucosaminidase domain
- CKII
- casein kinase II
- ESI
- electrospray ionization
- FAS
- fatty acid synthase
- FDR
- false discovery rate
- FLNA
- filamin-A
- H
- heavy
- HBP
- hexosamine biosynthetic pathway
- HSC70
- heat shock cognate 70-kDa protein
- I/R
- ischemia reperfusion
- IP
- immunoprecipitation
- L
- light
- M
- medium
- MCS
- multiple cloning site
- MCT
- multiple comparison test
- OGA
- O-GlcNAcase
- OGT
- O-GlcNAc transferase
- PANTHER
- Protein Analysis Through Evolutionary Relationships
- PSM
- peptide spectral match
- RM-1ANOVA
- repeated measures one-way analysis of variance
- RM-2ANOVA
- repeated measures two-way analysis of variance
- RP
- reversed phase
- RPT
- ratio-paired t test
- SILAC
- stable isotopic labeling of amino acids in cell culture
- TCL
- total cell lysate
- TEAB
- triethylammonium bicarbonate
- TMG
- thiamet-G
- V
- vehicle
- WB
- Western blotting.
References
- 1. Hart G. W., Slawson C., Ramirez-Correa G., and Lagerlof O. (2011) Cross talk between O-GlcNAcylation and phosphorylation: roles in signaling, transcription, and chronic disease. Annu. Rev. Biochem. 80, 825–858 [DOI] [PMC free article] [PubMed] [Google Scholar]
- 2. Bond M. R., and Hanover J. A. (2015) A little sugar goes a long way: the cell biology of O-GlcNAc. J. Cell Biol. 208, 869–880 [DOI] [PMC free article] [PubMed] [Google Scholar]
- 3. Groves J. A., Lee A., Yildirir G., and Zachara N. E. (2013) Dynamic O-GlcNAcylation and its roles in the cellular stress response and homeostasis. Cell Stress Chaperones 18, 535–558 [DOI] [PMC free article] [PubMed] [Google Scholar]
- 4. Lubas W. A., Frank D. W., Krause M., and Hanover J. A. (1997) O-Linked GlcNAc transferase is a conserved nucleocytoplasmic protein containing tetratricopeptide repeats. J. Biol. Chem. 272, 9316–9324 [DOI] [PubMed] [Google Scholar]
- 5. Kreppel L. K., Blomberg M. A., and Hart G. W. (1997) Dynamic glycosylation of nuclear and cytosolic proteins. Cloning and characterization of a unique O-GlcNAc transferase with multiple tetratricopeptide repeats. J. Biol. Chem. 272, 9308–9315 [DOI] [PubMed] [Google Scholar]
- 6. Gao Y., Wells L., Comer F. I., Parker G. J., and Hart G. W. (2001) Dynamic O-glycosylation of nuclear and cytosolic proteins: cloning and characterization of a neutral, cytosolic β-N-acetylglucosaminidase from human brain. J. Biol. Chem. 276, 9838–9845 [DOI] [PubMed] [Google Scholar]
- 7. Wells L., Gao Y., Mahoney J. A., Vosseller K., Chen C., Rosen A., and Hart G. W. (2002) Dynamic O-glycosylation of nuclear and cytosolic proteins: further characterization of the nucleocytoplasmic β-N-acetylglucosaminidase, O-GlcNAcase. J. Biol. Chem. 277, 1755–1761 [DOI] [PubMed] [Google Scholar]
- 8. Haltiwanger R. S., Blomberg M. A., and Hart G. W. (1992) Glycosylation of nuclear and cytoplasmic proteins. Purification and characterization of a uridine diphospho-N-acetylglucosamine:polypeptide β-N-acetylglucosaminyltransferase. J. Biol. Chem. 267, 9005–9013 [PubMed] [Google Scholar]
- 9. Shafi R., Iyer S. P., Ellies L. G., O'Donnell N., Marek K. W., Chui D., Hart G. W., and Marth J. D. (2000) The O-GlcNAc transferase gene resides on the X chromosome and is essential for embryonic stem cell viability and mouse ontogeny. Proc. Natl. Acad. Sci. U.S.A. 97, 5735–5739 [DOI] [PMC free article] [PubMed] [Google Scholar]
- 10. Yang Y. R., Song M., Lee H., Jeon Y., Choi E.-J., Jang H.-J., Moon H. Y., Byun H.-Y., Kim E.-K., Kim D. H., Lee M. N., Koh A., Ghim J., Choi J. H., Lee-Kwon W., et al. (2012) O-GlcNAcase is essential for embryonic development and maintenance of genomic stability. Aging Cell 11, 439–448 [DOI] [PubMed] [Google Scholar]
- 11. Greig K. T., Antonchuk J., Metcalf D., Morgan P. O., Krebs D. L., Zhang J.-G., Hacking D. F., Bode L., Robb L., Kranz C., de Graaf C., Bahlo M., Nicola N. A., Nutt S. L., Freeze H. H., et al. (2007) Agm1/Pgm3-mediated sugar nucleotide synthesis is essential for hematopoiesis and development. Mol. Cell. Biol. 27, 5849–5859 [DOI] [PMC free article] [PubMed] [Google Scholar]
- 12. O'Donnell N., Zachara N. E., Hart G. W., and Marth J. D. (2004) Ogt-dependent X-chromosome-linked protein glycosylation is a requisite modification in somatic cell function and embryo viability. Mol. Cell. Biol. 24, 1680–1690 [DOI] [PMC free article] [PubMed] [Google Scholar]
- 13. Zachara N. E., O'Donnell N., Cheung W. D., Mercer J. J., Marth J. D., and Hart G. W. (2004) Dynamic O-GlcNAc modification of nucleocytoplasmic proteins in response to stress. A survival response of mammalian cells. J. Biol. Chem. 279, 30133–30142 [DOI] [PubMed] [Google Scholar]
- 14. Jones S. P., Zachara N. E., Ngoh G. A., Hill B. G., Teshima Y., Bhatnagar A., Hart G. W., and Marbán E. (2008) Cardioprotection by N-acetylglucosamine linkage to cellular proteins. Circulation 117, 1172–1182 [DOI] [PubMed] [Google Scholar]
- 15. Champattanachai V., Marchase R. B., and Chatham J. C. (2008) Glucosamine protects neonatal cardiomyocytes from ischemia-reperfusion injury via increased protein O-GlcNAc and increased mitochondrial Bcl-2. Am. J. Physiol. Cell Physiol. 294, C1509–C1520 [DOI] [PMC free article] [PubMed] [Google Scholar]
- 16. Fülöp N., Zhang Z., Marchase R. B., and Chatham J. C. (2007) Glucosamine cardioprotection in perfused rat hearts associated with increased O-linked N-acetylglucosamine protein modification and altered p38 activation. Am. J. Physiol. Heart Circ. Physiol. 292, H2227–H2236 [DOI] [PMC free article] [PubMed] [Google Scholar]
- 17. Liu J., Pang Y., Chang T., Bounelis P., Chatham J. C., and Marchase R. B. (2006) Increased hexosamine biosynthesis and protein O-GlcNAc levels associated with myocardial protection against calcium paradox and ischemia. J. Mol. Cell. Cardiol. 40, 303–312 [DOI] [PubMed] [Google Scholar]
- 18. Ngoh G. A., Watson L. J., Facundo H. T., and Jones S. P. (2011) Augmented O-GlcNAc signaling attenuates oxidative stress and calcium overload in cardiomyocytes. Amino Acids 40, 895–911 [DOI] [PMC free article] [PubMed] [Google Scholar]
- 19. Vibjerg Jensen R., Johnsen J., Buus Kristiansen S., Zachara N. E., and Bøtker H. E. (2013) Ischemic preconditioning increases myocardial O-GlcNAc glycosylation. Scand. Cardiovasc. J. 47, 168–174 [DOI] [PubMed] [Google Scholar]
- 20. Champattanachai V., Marchase R. B., and Chatham J. C. (2007) Glucosamine protects neonatal cardiomyocytes from ischemia-reperfusion injury via increased protein-associated O-GlcNAc. Am. J. Physiol. Cell Physiol. 292, C178–C187 [DOI] [PubMed] [Google Scholar]
- 21. Hwang S.-Y., Shin J.-H., Hwang J.-S., Kim S.-Y., Shin J.-A., Oh E.-S., Oh S., Kim J.-B., Lee J.-K., and Han I.-O. (2010) Glucosamine exerts a neuroprotective effect via suppression of inflammation in rat brain ischemia/reperfusion injury. Glia 58, 1881–1892 [DOI] [PubMed] [Google Scholar]
- 22. Laczy B., Marsh S. A., Brocks C. A., Wittmann I., and Chatham J. C. (2010) Inhibition of O-GlcNAcase in perfused rat hearts by NAG-thiazolines at the time of reperfusion is cardioprotective in an O-GlcNAc-dependent manner. Am. J. Physiol. Heart Circ. Physiol. 299, H1715–H1727 [DOI] [PMC free article] [PubMed] [Google Scholar]
- 23. Nagy T., Champattanachai V., Marchase R. B., and Chatham J. C. (2006) Glucosamine inhibits angiotensin II-induced cytoplasmic Ca2+ elevation in neonatal cardiomyocytes via protein-associated O-linked N-acetylglucosamine. Am. J. Physiol. Cell Physiol. 290, C57–C65 [DOI] [PubMed] [Google Scholar]
- 24. Ngoh G. A., Hamid T., Prabhu S. D., and Jones S. P. (2009) O-GlcNAc signaling attenuates ER stress-induced cardiomyocyte death. Am. J. Physiol. Heart Circ. Physiol. 297, H1711–H1719 [DOI] [PMC free article] [PubMed] [Google Scholar]
- 25. Ngoh G. A., Watson L. J., Facundo H. T., Dillmann W., and Jones S. P. (2008) Non-canonical glycosyltransferase modulates post-hypoxic cardiac myocyte death and mitochondrial permeability transition. J. Mol. Cell. Cardiol. 45, 313–325 [DOI] [PMC free article] [PubMed] [Google Scholar]
- 26. Ngoh G. A., Facundo H. T., Hamid T., Dillmann W., Zachara N. E., and Jones S. P. (2009) Unique hexosaminidase reduces metabolic survival signal and sensitizes cardiac myocytes to hypoxia/reoxygenation injury. Circ. Res. 104, 41–49 [DOI] [PMC free article] [PubMed] [Google Scholar]
- 27. Liu J., Marchase R. B., and Chatham J. C. (2007) Increased O-GlcNAc levels during reperfusion lead to improved functional recovery and reduced calpain proteolysis. Am. J. Physiol. Heart Circ. Physiol. 293, H1391–H1399 [DOI] [PMC free article] [PubMed] [Google Scholar]
- 28. Yang S., Zou L.-Y., Bounelis P., Chaudry I., Chatham J. C., and Marchase R. B. (2006) Glucosamine administration during resuscitation improves organ function after trauma hemorrhage. Shock 25, 600–607 [DOI] [PubMed] [Google Scholar]
- 29. Zou L., Yang S., Hu S., Chaudry I. H., Marchase R. B., and Chatham J. C. (2007) The protective effects of PUGNAc on cardiac function after trauma-hemorrhage are mediated via increased protein O-GlcNAc levels. Shock 27, 402–408 [DOI] [PubMed] [Google Scholar]
- 30. Nöt L. G., Marchase R. B., Fülöp N., Brocks C. A., and Chatham J. C. (2007) Glucosamine administration improves survival rate after severe hemorrhagic shock combined with trauma in rats. Shock 28, 345–352 [DOI] [PubMed] [Google Scholar]
- 31. Nöt L. G., Brocks C. A., Vámhidy L., Marchase R. B., and Chatham J. C. (2010) Increased O-linked β-N-acetylglucosamine levels on proteins improves survival, reduces inflammation and organ damage 24 hours after trauma-hemorrhage in rats. Crit. Care Med. 38, 562–571 [DOI] [PMC free article] [PubMed] [Google Scholar]
- 32. Cheung W. D., and Hart G. W. (2008) AMP-activated protein kinase and p38 MAPK activate O-GlcNAcylation of neuronal proteins during glucose deprivation. J. Biol. Chem. 283, 13009–13020 [DOI] [PMC free article] [PubMed] [Google Scholar]
- 33. Ryu I.-H., and Do S.-I. (2011) Denitrosylation of S-nitrosylated OGT is triggered in LPS-stimulated innate immune response. Biochem. Biophys. Res. Commun. 408, 52–57 [DOI] [PubMed] [Google Scholar]
- 34. Wang Z. V., Deng Y., Gao N., Pedrozo Z., Li D. L., Morales C. R., Criollo A., Luo X., Tan W., Jiang N., Lehrman M. A., Rothermel B. A., Lee A.-H., Lavandero S., Mammen P. P., Ferdous A., Gillette T. G., Scherer P. E., and Hill J. A. (2014) Spliced X-box binding protein 1 couples the unfolded protein response to hexosamine biosynthetic pathway. Cell 156, 1179–1192 [DOI] [PMC free article] [PubMed] [Google Scholar]
- 35. Jensen R. V., Zachara N. E., Nielsen P. H., Kimose H. H., Kristiansen S. B., and Bøtker H. E. (2013) Impact of O-GlcNAc on cardioprotection by remote ischaemic preconditioning in non-diabetic and diabetic patients. Cardiovasc. Res. 97, 369–378 [DOI] [PMC free article] [PubMed] [Google Scholar]
- 36. Seither P., Iben S., and Grummt I. (1998) Mammalian RNA polymerase I exists as a holoenzyme with associated basal transcription factors. J. Mol. Biol. 275, 43–53 [DOI] [PubMed] [Google Scholar]
- 37. Wells L., Whelan S. A., and Hart G. W. (2003) O-GlcNAc: a regulatory post-translational modification. Biochem. Biophys. Res. Commun. 302, 435–441 [DOI] [PubMed] [Google Scholar]
- 38. Comtesse N., Maldener E., and Meese E. (2001) Identification of a nuclear variant of MGEA5, a cytoplasmic hyaluronidase and a β-N-acetylglucosaminidase. Biochem. Biophys. Res. Commun. 283, 634–640 [DOI] [PubMed] [Google Scholar]
- 39. Roux K. J., Kim D. I., Raida M., and Burke B. (2012) A promiscuous biotin ligase fusion protein identifies proximal and interacting proteins in mammalian cells. J. Cell Biol. 196, 801–810 [DOI] [PMC free article] [PubMed] [Google Scholar]
- 40. Ong S.-E., Blagoev B., Kratchmarova I., Kristensen D. B., Steen H., Pandey A., and Mann M. (2002) Stable isotope labeling by amino acids in cell culture, SILAC, as a simple and accurate approach to expression proteomics. Mol. Cell. Proteomics 1, 376–386 [DOI] [PubMed] [Google Scholar]
- 41. Amanchy R., Kalume D. E., and Pandey A. (2005) Stable isotope labeling with amino acids in cell culture (SILAC) for studying dynamics of protein abundance and posttranslational modifications. Sci. STKE. 2005, pl2. [DOI] [PubMed] [Google Scholar]
- 42. Zachara N. E., Molina H., Wong K. Y., Pandey A., and Hart G. W. (2011) The dynamic stress-induced “O-GlcNAc-ome” highlights functions for O-GlcNAc in regulating DNA damage/repair and other cellular pathways. Amino Acids 40, 793–808 [DOI] [PMC free article] [PubMed] [Google Scholar]
- 43. Cheung W. D., Sakabe K., Housley M. P., Dias W. B., and Hart G. W. (2008) O-Linked β-N-acetylglucosaminyltransferase substrate specificity is regulated by myosin phosphatase targeting and other interacting proteins. J. Biol. Chem. 283, 33935–33941 [DOI] [PMC free article] [PubMed] [Google Scholar]
- 44. Roux K. J., Kim D. I., and Burke B. (2013) BioID: a screen for protein-protein interactions. Curr. Protoc. Protein Sci. 74, Unit 19.23 [DOI] [PubMed] [Google Scholar]
- 45. Varnaitė R., and MacNeill S. A. (2016) Meet the neighbours: mapping local protein interactomes by proximity-dependent labelling with BioID. Proteomics 16, 2503–2518 [DOI] [PMC free article] [PubMed] [Google Scholar]
- 46. Kim D. I., Birendra K. C., Zhu W., Motamedchaboki K., Doye V., and Roux K. J. (2014) Probing nuclear pore complex architecture with proximity-dependent biotinylation. Proc. Natl. Acad. Sci. U.S.A. 111, E2453–E2461 [DOI] [PMC free article] [PubMed] [Google Scholar]
- 47. Choi-Rhee E., Schulman H., and Cronan J. E. (2004) Promiscuous protein biotinylation by Escherichia coli biotin protein ligase. Protein Sci. 13, 3043–3050 [DOI] [PMC free article] [PubMed] [Google Scholar]
- 48. Cronan J. E. (2005) Targeted and proximity-dependent promiscuous protein biotinylation by a mutant Escherichia coli biotin protein ligase. J. Nutr. Biochem. 16, 416–418 [DOI] [PubMed] [Google Scholar]
- 49. Kwon K., and Beckett D. (2000) Function of a conserved sequence motif in biotin holoenzyme synthetases. Protein Sci. 9, 1530–1539 [DOI] [PMC free article] [PubMed] [Google Scholar]
- 50. Schultz J., and Pils B. (2002) Prediction of structure and functional residues for O-GlcNAcase, a divergent homologue of acetyltransferases. FEBS Lett. 529, 179–182 [DOI] [PubMed] [Google Scholar]
- 51. Coyaud E., Mis M., Laurent E. M., Dunham W. H., Couzens A. L., Robitaille M., Gingras A.-C., Angers S., and Raught B. (2015) BioID-based identification of Skp cullin F-box (SCF)β-TrCP1/2 E3 ligase substrates. Mol. Cell. Proteomics 14, 1781–1795 [DOI] [PMC free article] [PubMed] [Google Scholar]
- 52. Tong L. (2013) Structure and function of biotin-dependent carboxylases. Cell. Mol. Life Sci. 70, 863–891 [DOI] [PMC free article] [PubMed] [Google Scholar]
- 53. Moss J., and Lane M. D. (1971) The biotin-dependent enzymes. Adv. Enzymol. Relat. Areas Mol. Biol. 35, 321–442 [DOI] [PubMed] [Google Scholar]
- 54. Yuzwa S. A., Macauley M. S., Heinonen J. E., Shan X., Dennis R. J., He Y., Whitworth G. E., Stubbs K. A., McEachern E. J., Davies G. J., and Vocadlo D. J. (2008) A potent mechanism-inspired O-GlcNAcase inhibitor that blocks phosphorylation of τ in vivo. Nat. Chem. Biol. 4, 483–490 [DOI] [PubMed] [Google Scholar]
- 55. Banerjee P. S., Ma J., and Hart G. W. (2015) Diabetes-associated dysregulation of O-GlcNAcylation in rat cardiac mitochondria. Proc. Natl. Acad. Sci. U.S.A. 112, 6050–6055 [DOI] [PMC free article] [PubMed] [Google Scholar]
- 56. Perez-Riverol Y., Xu Q.-W., Wang R., Uszkoreit J., Griss J., Sanchez A., Reisinger F., Csordas A., Ternent T., Del-Toro N., Dianes J. A., Eisenacher M., Hermjakob H., and Vizcaíno J. A. (2016) PRIDE inspector toolsuite: moving toward a universal visualization tool for proteomics data standard formats and quality assessment of proteomeXchange datasets. Mol. Cell. Proteomics 15, 305–317 [DOI] [PMC free article] [PubMed] [Google Scholar]
- 57. Martens L., Hermjakob H., Jones P., Adamski M., Taylor C., States D., Gevaert K., Vandekerckhove J., and Apweiler R. (2005) PRIDE: the proteomics identifications database. Proteomics 5, 3537–3545 [DOI] [PubMed] [Google Scholar]
- 58. Vizcaíno J. A., Csordas A., del-Toro N., Dianes J. A., Griss J., Lavidas I., Mayer G., Perez-Riverol Y., Reisinger F., Ternent T., Xu Q.-W., Wang R., and Hermjakob H. (2016) 2016 update of the PRIDE database and its related tools. Nucleic Acids Res. 44, D447–D456 [DOI] [PMC free article] [PubMed] [Google Scholar]
- 59. Côté R. G., Griss J., Dianes J. A., Wang R., Wright J. C., van den Toorn H. W., van Breukelen B., Heck A. J., Hulstaert N., Martens L., Reisinger F., Csordas A., Ovelleiro D., Perez-Rivevol Y., Barsnes H., et al. (2012) The PRoteomics IDEntification (PRIDE) Converter 2 framework: an improved suite of tools to facilitate data submission to the PRIDE database and the ProteomeXchange consortium. Mol. Cell. Proteomics 11, 1682–1689 [DOI] [PMC free article] [PubMed] [Google Scholar]
- 60. Vizcaíno J. A., Deutsch E. W., Wang R., Csordas A., Reisinger F., Ríos D., Dianes J. A., Sun Z., Farrah T., Bandeira N., Binz P.-A., Xenarios I., Eisenacher M., Mayer G., Gatto L., et al. (2014) ProteomeXchange provides globally coordinated proteomics data submission and dissemination. Nat. Biotechnol. 32, 223–226 [DOI] [PMC free article] [PubMed] [Google Scholar]
- 61. Thomas P. D., Campbell M. J., Kejariwal A., Mi H., Karlak B., Daverman R., Diemer K., Muruganujan A., and Narechania A. (2003) PANTHER: a library of protein families and subfamilies indexed by function. Genome Res. 13, 2129–2141 [DOI] [PMC free article] [PubMed] [Google Scholar]
- 62. Mi H., Lazareva-Ulitsky B., Loo R., Kejariwal A., Vandergriff J., Rabkin S., Guo N., Muruganujan A., Doremieux O., Campbell M. J., Kitano H., and Thomas P. D. (2005) The PANTHER database of protein families, subfamilies, functions and pathways. Nucleic Acids Res. 33, D284–D288 [DOI] [PMC free article] [PubMed] [Google Scholar]
- 63. Whisenhunt T. R., Yang X., Bowe D. B., Paterson A. J., Van Tine B. A., and Kudlow J. E. (2006) Disrupting the enzyme complex regulating O-GlcNAcylation blocks signaling and development. Glycobiology 16, 551–563 [DOI] [PubMed] [Google Scholar]
- 64. Baldini S. F., Wavelet C., Hainault I., Guinez C., and Lefebvre T. (2016) The nutrient-dependent O-GlcNAc modification controls the expression of liver fatty acid synthase. J. Mol. Biol. 428, 3295–3304 [DOI] [PubMed] [Google Scholar]
- 65. Lee A., Miller D., Henry R., Paruchuri V. D., O'Meally R. N., Boronina T., Cole R. N., and Zachara N. E. (2016) Combined antibody/lectin enrichment identifies extensive changes in the O-GlcNAc sub-proteome upon oxidative stress. J. Proteome Res. 15, 4318–4336 [DOI] [PMC free article] [PubMed] [Google Scholar]
- 66. Mehta V., and Trinkle-Mulcahy L. (2016) Recent advances in large-scale protein interactome mapping. F1000Res. 5, 782. [DOI] [PMC free article] [PubMed] [Google Scholar]
- 67. Martell J. D., Deerinck T. J., Sancak Y., Poulos T. L., Mootha V. K., Sosinsky G. E., Ellisman M. H., and Ting A. Y. (2012) Engineered ascorbate peroxidase as a genetically encoded reporter for electron microscopy. Nat. Biotechnol. 30, 1143–1148 [DOI] [PMC free article] [PubMed] [Google Scholar]
- 68. Rhee H.-W., Zou P., Udeshi N. D., Martell J. D., Mootha V. K., Carr S. A., and Ting A. Y. (2013) Proteomic mapping of mitochondria in living cells via spatially restricted enzymatic tagging. Science 339, 1328–1331 [DOI] [PMC free article] [PubMed] [Google Scholar]
- 69. Zhang Z., Costa F. C., Tan E. P., Bushue N., DiTacchio L., Costello C. E., McComb M. E., Whelan S. A., Peterson K. R., and Slawson C. (2016) O-GlcNAc transferase and O-GlcNAcase interact with Mi2β at the Aγ-globin promoter. J. Biol. Chem. 291, 15628–15640 [DOI] [PMC free article] [PubMed] [Google Scholar]
- 70. Ma J., Liu T., Wei A.-C., Banerjee P., O'Rourke B., and Hart G. W. (2015) O-GlcNAcomic profiling identifies widespread O-GlcNAcylation in oxidative phosphorylation system regulating cardiac mitochondrial function. J. Biol. Chem. 290, 29141–29153 [DOI] [PMC free article] [PubMed] [Google Scholar]
- 71. Semenkovich C. F. (1997) Regulation of fatty acid synthase (FAS). Prog. Lipid Res. 36, 43–53 [DOI] [PubMed] [Google Scholar]
- 72. Pizer E. S., Wood F. D., Heine H. S., Romantsev F. E., Pasternack G. R., and Kuhajda F. P. (1996) Inhibition of fatty acid synthesis delays disease progression in a xenograft model of ovarian cancer. Cancer Res. 56, 1189–1193 [PubMed] [Google Scholar]
- 73. Mullen G. E., and Yet L. (2015) Progress in the development of fatty acid synthase inhibitors as anticancer targets. Bioorg. Med. Chem. Lett. 25, 4363–4369 [DOI] [PubMed] [Google Scholar]
- 74. Wakamiya T., Suzuki S. O., Hamasaki H., Honda H., Mizoguchi M., Yoshimoto K., and Iwaki T. (2014) Elevated expression of fatty acid synthase and nuclear localization of carnitine palmitoyltransferase 1C are common among human gliomas. Neuropathology 34, 465–474 [DOI] [PubMed] [Google Scholar]
- 75. Ito T., Sato K., Maekawa H., Sakurada M., Orita H., Shimada K., Daida H., Wada R., Abe M., Hino O., and Kajiyama Y. (2014) Elevated levels of serum fatty acid synthase in patients with gastric carcinoma. Oncol. Lett. 7, 616–620 [DOI] [PMC free article] [PubMed] [Google Scholar]
- 76. Kuhajda F. P., Jenner K., Wood F. D., Hennigar R. A., Jacobs L. B., Dick J. D., and Pasternack G. R. (1994) Fatty acid synthesis: a potential selective target for antineoplastic therapy. Proc. Natl. Acad. Sci. U.S.A. 91, 6379–6383 [DOI] [PMC free article] [PubMed] [Google Scholar]
- 77. Hamada S., Horiguchi A., Asano T., Kuroda K., Asakuma J., Ito K., Asano T., Miyai K., and Iwaya K. (2014) Prognostic impact of fatty acid synthase expression in upper urinary tract urothelial carcinoma. Jpn. J. Clin. Oncol. 44, 486–492 [DOI] [PubMed] [Google Scholar]
- 78. Zhou W., Simpson P. J., McFadden J. M., Townsend C. A., Medghalchi S. M., Vadlamudi A., Pinn M. L., Ronnett G. V., and Kuhajda F. P. (2003) Fatty acid synthase inhibition triggers apoptosis during S phase in human cancer cells. Cancer Res. 63, 7330–7337 [PubMed] [Google Scholar]
- 79. Veigel D., Wagner R., Stübiger G., Wuczkowski M., Filipits M., Horvat R., Benhamú B., López-Rodríguez M. L., Leisser A., Valent P., Grusch M., Hegardt F. G., García J., Serra D., Auersperg N., Colomer R., and Grunt T. W. (2015) Fatty acid synthase is a metabolic marker of cell proliferation rather than malignancy in ovarian cancer and its precursor cells. Int. J. Cancer 136, 2078–2090 [DOI] [PubMed] [Google Scholar]
- 80. Lee J. S., Lee M. S., Oh W. K., and Sul J. Y. (2009) Fatty acid synthase inhibition by amentoflavone induces apoptosis and antiproliferation in human breast cancer cells. Biol. Pharm. Bull. 32, 1427–1432 [DOI] [PubMed] [Google Scholar]
- 81. Carvalho M. A., Zecchin K. G., Seguin F., Bastos D. C., Agostini M., Rangel A. L., Veiga S. S., Raposo H. F., Oliveira H. C., Loda M., Coletta R. D., and Graner E. (2008) Fatty acid synthase inhibition with Orlistat promotes apoptosis and reduces cell growth and lymph node metastasis in a mouse melanoma model. Int. J. Cancer 123, 2557–2565 [DOI] [PubMed] [Google Scholar]
- 82. Ventura R., Mordec K., Waszczuk J., Wang Z., Lai J., Fridlib M., Buckley D., Kemble G., and Heuer T. S. (2015) Inhibition of de novo palmitate synthesis by fatty acid synthase induces apoptosis in tumor cells by remodeling cell membranes, inhibiting signaling pathways, and reprogramming gene expression. EBioMedicine 2, 808–824 [DOI] [PMC free article] [PubMed] [Google Scholar]
- 83. van der Vusse G. J., Glatz J. F., Stam H. C., and Reneman R. S. (1992) Fatty acid homeostasis in the normoxic and ischemic heart. Physiol. Rev. 72, 881–940 [DOI] [PubMed] [Google Scholar]
- 84. Razani B., Zhang H., Schulze P. C., Schilling J. D., Verbsky J., Lodhi I. J., Topkara V. K., Feng C., Coleman T., Kovacs A., Kelly D. P., Saffitz J. E., Dorn G. W. 2nd., Nichols C. G., and Semenkovich C. F. (2011) Fatty acid synthase modulates homeostatic responses to myocardial stress. J. Biol. Chem. 286, 30949–30961 [DOI] [PMC free article] [PubMed] [Google Scholar]
- 85. Abdalla S., Fu X., Elzahwy S. S., Klaetschke K., Streichert T., and Quitterer U. (2011) Up-regulation of the cardiac lipid metabolism at the onset of heart failure. Cardiovasc. Hematol. Agents Med. Chem. 9, 190–206 [DOI] [PMC free article] [PubMed] [Google Scholar]
- 86. Erickson J. R., Pereira L., Wang L., Han G., Ferguson A., Dao K., Copeland R. J., Despa F., Hart G. W., Ripplinger C. M., and Bers D. M. (2013) Diabetic hyperglycaemia activates CaMKII and arrhythmias by O-linked glycosylation. Nature 502, 372–376 [DOI] [PMC free article] [PubMed] [Google Scholar]
- 87. Srikanth B., Vaidya M. M., and Kalraiya R. D. (2010) O-GlcNAcylation determines the solubility, filament organization, and stability of keratins 8 and 18. J. Biol. Chem. 285, 34062–34071 [DOI] [PMC free article] [PubMed] [Google Scholar]
- 88. Neilson K. A., Keighley T., Pascovici D., Cooke B., and Haynes P. A. (2013) Label-free quantitative shotgun proteomics using normalized spectral abundance factors. Methods Mol. Biol. 1002, 205–222 [DOI] [PubMed] [Google Scholar]
- 89. Coombs K. M., Berard A., Xu W., Krokhin O., Meng X., Cortens J. P., Kobasa D., Wilkins J., and Brown E. G. (2010) Quantitative proteomic analyses of influenza virus-infected cultured human lung cells. J. Virol. 84, 10888–10906 [DOI] [PMC free article] [PubMed] [Google Scholar]
- 90. Boulon S., Ahmad Y., Trinkle-Mulcahy L., Verheggen C., Cobley A., Gregor P., Bertrand E., Whitehorn M., and Lamond A. I. (2010) Establishment of a protein frequency library and its application in the reliable identification of specific protein interaction partners. Mol. Cell. Proteomics 9, 861–879 [DOI] [PMC free article] [PubMed] [Google Scholar]
- 91. Trinkle-Mulcahy L., Boulon S., Lam Y. W., Urcia R., Boisvert F.-M., Vandermoere F., Morrice N. A., Swift S., Rothbauer U., Leonhardt H., and Lamond A. (2008) Identifying specific protein interaction partners using quantitative mass spectrometry and bead proteomes. J. Cell Biol. 183, 223–239 [DOI] [PMC free article] [PubMed] [Google Scholar]
- 92. Zhong J., Martinez M., Sengupta S., Lee A., Wu X., Chaerkady R., Chatterjee A., O'Meally R. N., Cole R. N., Pandey A., and Zachara N. E. (2015) Quantitative phosphoproteomics reveals crosstalk between phosphorylation and O-GlcNAc in the DNA damage response pathway. Proteomics 15, 591–607 [DOI] [PMC free article] [PubMed] [Google Scholar]
Associated Data
This section collects any data citations, data availability statements, or supplementary materials included in this article.