Abstract
Functional magnetic resonance imaging (fMRI) studies have shown altered brain dynamic functional connectivity (DFC) in mental disorders. Here, we aim to explore DFC across a spectrum of symptomatically‐related disorders including bipolar disorder with psychosis (BPP), schizoaffective disorder (SAD), and schizophrenia (SZ). We introduce a group information guided independent component analysis procedure to estimate both group‐level and subject‐specific connectivity states from DFC. Using resting‐state fMRI data of 238 healthy controls (HCs), 140 BPP, 132 SAD, and 113 SZ patients, we identified measures differentiating groups from the whole‐brain DFC and traditional static functional connectivity (SFC), separately. Results show that DFC provided more informative measures than SFC. Diagnosis‐related connectivity states were evident using DFC analysis. For the dominant state consistent across groups, we found 22 instances of hypoconnectivity (with decreasing trends from HC to BPP to SAD to SZ) mainly involving post‐central, frontal, and cerebellar cortices as well as 34 examples of hyperconnectivity (with increasing trends HC through SZ) primarily involving thalamus and temporal cortices. Hypoconnectivities/hyperconnectivities also showed negative/positive correlations, respectively, with clinical symptom scores. Specifically, hypoconnectivities linking postcentral and frontal gyri were significantly negatively correlated with the PANSS positive/negative scores. For frontal connectivities, BPP resembled HC while SAD and SZ were more similar. Three connectivities involving the left cerebellar crus differentiated SZ from other groups and one connection linking frontal and fusiform cortices showed a SAD‐unique change. In summary, our method is promising for assessing DFC and may yield imaging biomarkers for quantifying the dimension of psychosis. Hum Brain Mapp 38:2683–2708, 2017. © 2017 Wiley Periodicals, Inc.
Keywords: functional magnetic resonance imaging, dynamic functional connectivity, independent component analysis, schizophrenia, schizoaffective disorder, bipolar disorder
INTRODUCTION
Schizophrenia (SZ), schizoaffective disorder (SAD), and bipolar disorder with psychosis (BPP) have overlapping clinical symptoms, familial co‐occurrence and shared genetic risk [Cardno and Owen, 2014; Cosgrove and Suppes, 2013; Pearlson et al., 2016]. SZ is a psychotic disorder characterized by persistent psychotic symptoms (e.g., delusions and hallucinations) and decreased function. BPP is marked by presence of mania and concomitant psychosis. Over 100‐year ago, Kraepelin [Ebert and Bar, 2010] distinguished between SZ and BPP primarily based on longitudinal course and long‐term outcome, but noted that cross‐sectional symptoms including delusions, hallucinations, and mood disturbance were found in patients with both diagnoses [Pearlson, 2015]. Indeed, Kraepelin in 1920 lamented that his two‐psychosis model failed to adequately capture distinct disorders. Kasanin [Kasanin, 1933] introduced SAD, which combines features of both SZ and mood disorders, to elucidate this apparent symptom overlap by postulating an additional diagnostic category. Differentiating BPP, SAD, and SZ can be difficult based on phenomenological features alone. Considering the difficulty of differential diagnosis and lack of consensus, biological, in addition to symptomatic, measurements may be useful for differentiating these clinical syndromes. So far, most biological measures also fail to uniquely differentiate the psychoses, suggesting that more work is needed to understand the relationships between these clinical syndromes and neurobiology [Clementz et al., 2015, 2016; Pearlson et al., 2016].
Both structural [Mathew et al., 2014] and functional imaging [Meda et al., 2015] have been used to explore abnormalities in BPP, SAD, and SZ. Previous work [Glahn et al., 2008] found reduced gray matter density in SZ patients relative to healthy controls (HCs) in multiple brain regions. Gradual gray matter density deficits in BPP, SAD, and SZ patients, as well as in their biological relatives were reported [Ivleva et al., 2013]. Functional connectivities and functional networks derived from resting‐state functional magnetic resonance imaging (fMRI) data also have been used to investigate these disorders. Khadka et al. [2013] analyzed data of SZ, BPP and their unaffected first‐degree relatives using independent component analysis (ICA), and identified significant alterations in seven functional networks. Our previous work [Du et al., 2014, 2015b] studying networks decoded by ICA found brain differences among BPP, SAD, and SZ in multiple networks (including the default mode and salience networks), and observed that HCs and BPP patients clustered into one group while SAD and SZ patients clustered into another group. Using a regions of interest (ROIs)‐based method, Argyelan et al. [2014] investigated differences among HCs, SZ, and BPP patients in whole‐brain functional connectivities, and found that SZ patients had significantly lower connectivity strengths than HCs, and BPP group showed intermediate connectivity strengths between SZ group and HC group. While decreased connectivity strength has been found in SZ [Lynall et al., 2010], some work has also reported increased connectivity strength [Whitfield‐Gabrieli et al., 2009; Zhou et al., 2007] in SZ. So far, brain function impariments among BPP, SAD, and SZ are still unclear. It is uncertain whether there are progressively network alterations from HC to BPP to SAD to SZ, and what kinds of distinct versus shared impairments are related to these disorders. In addition, all the above mentioned connectivity and network studies used blood‐oxygen‐level dependent (BOLD) signal over the entire scan time to estimate, assuming functional connectivities (or networks) are stationary.
Connectivity patterns can be time‐varying over periods of tens of seconds, evident during a few minutes of resting‐state scans [Allen et al., 2014; Calhoun et al., 2014; Di and Biswal, 2013; Du et al., 2016; Hutchison et al., 2013; Kiviniemi et al., 2011; Yaesoubi et al., 2015; Zalesky et al., 2014]. It is possibly theoretically useful to capture these non‐stationary connectivity patterns for a better understanding of the influence of disease on brain connectivity [Damaraju et al., 2014; Du et al., 2016; Miller et al., 2016; Rashid et al., 2014; Yu et al., 2015]. In the present study, we aim to apply a novel “chronnectome” approach [Abrol et al., 2016; Calhoun et al., 2014] to study BPP, SAD, and SZ. We expect that dynamic functional connectivity (DFC) derived from resting‐state fMRI data would help clarify the nature of neural deviations across the psychosis spectrum.
Among different dynamic connectivity estimation models, the sliding time window method [Hutchison et al., 2013] is the most popular. This technique computes functional connectivities using the windowed BOLD time series, resulting in time‐varying connectivity patterns along different windows and thereby revealing implied connectivity states [Allen et al., 2014]. The diverse connectivity states may yield promising biomarkers for psychosis. To extract connectivity states, researchers have used various methods including clustering and decomposition techniques. Connectivity states extracted using different methods may have discrepant patterns due to their different assumptions [Calhoun et al., 2014]. Furthermore, while connectivity states obtained from clustering approaches have the same scale with real connectivity strength, post‐processing may be needed for connectivity states estimated using decomposition methods. Researchers used K‐means to extract connectivity states by grouping connectivity patterns from different windows into several clusters [Allen et al., 2014; Damaraju et al., 2014; Du et al., 2016]. K‐means could converge exponentially slow for data with extensive noise and fall into local optimum. Principal component analysis (PCA) [Leonardi et al., 2013] has been used to decompose the window‐direction concatenated connectivity patterns of all subjects into spatially uncorrelated components, of which the principle components are considered to be the group‐level (common) primary connectivity states across subjects. Using Fisher discrimination dictionary learning [Li et al., 2014], time‐varying connectivity patterns were decoded by sparse representation over connectivity states. The supervised machine learning method required prelabeling each connectivity pattern as guidance. Miller et al. [2016] applied spatial ICA on the window‐direction concatenated connectivity patterns of all subjects to estimate spatial independent components (ICs), which reflected the group‐level connectivity states. Temporal ICA [Yaesoubi et al., 2015] also has been used to decompose the dynamic connectivity series of all subjects to compute temporal ICs, and the corresponding mixing coefficients of ICs were regarded as the group‐level connectivity states. Most previous work using decomposition techniques only compared the group‐level connectivity states among different groups. Little discussion is given about obtaining the subject‐specific connectivity states with individual characteristics.
In this study, we introduce a novel ICA method, group information guided ICA (GIG‐ICA) [Du and Fan, 2013], to extract connectivity states from dynamic connectivity patterns. Different from the previous decomposition approaches, our method enables computation of states at both group‐level and subject‐level. GIG‐ICA first computes the group‐level connectivity states by analyzing the intra‐group subjects’ dynamic connectivity, and then guided by the group‐level states, it correspondingly estimates the subject‐specific connectivity states that are independent from each other. Therefore, the resulting subject‐specific states can simultaneously capture inter‐subject variability and within‐group similarity. In this article, we applied GIG‐ICA to analyze dynamic connectivity derived from resting‐state fMRI data of HC, BPP, SAD, and SZ subjects. Then, based on measures from dynamic connectivity, we explored the ability of the outcomes describe the psychosis continuum. In addition, we also performed conventional static functional connectivity (SFC) analysis to see if DFC could provide more informative information than SFC.
MATERIALS AND METHODS
We analyzed resting‐state fMRI data of the aforementioned four groups. First, the whole‐brain dynamic connectivities of each subject were calculated using the sliding time window approach. Then, we applied GIG‐ICA to each group's dynamic connectivity patterns to extract both group‐level and subject‐specific connectivity states. Subsequently, we investigated inter‐group differences in the group‐level connectivity states, the fluctuations of connectivity states, and the dominant subject‐specific connectivity states. Finally, we conducted traditional static connectivity analyses on the same dataset for a comparison.
Materials
Resting‐state fMRI data from 623 subjects including 238 HCs, 140 BPP, 132 SAD, and 113 SZ patients were analyzed. There were no significant group differences of age or sex (P = 0.31 for sex examined by Chi Square test; P = 0.19 for age examined by analysis of variance). The data were provided from participants in the multi‐site Bipolar and Schizophrenia Network on Intermediate Phenotypes study [Meda et al., 2014, 2015; Tamminga et al., 2013]. Subjects were recruited and scanned at six sites (Baltimore, Boston, Chicago, Dallas, Detroit, and Hartford). The scanning period was about five minutes for all sites. All subjects were psychiatrically stable and on stable medication regimens at the time of study. Participants were instructed to rest with eyes closed and stay awake. Demographic information is shown in Table 1. The detailed imaging acquisition parameters for each site can be found in Supporting Information Table S1.
Table 1.
Demographic and clinical characteristics
| HC (n = 238) | BPP (n = 140) | SAD (n = 132) | SZ (n = 113) | |||||
|---|---|---|---|---|---|---|---|---|
| Mean | SD | Mean | SD | Mean | SD | Mean | SD | |
| Age (year) | 38.15 | 12.55 | 36.00 | 12.57 | 36.23 | 12.23 | 35.57 | 12.29 |
| PANSS (Positive) | — | — | 12.78 | 4.24 | 18.24 | 5.11 | 17.31 | 5.81 |
| PANSS (Negative) | — | — | 11.69 | 3.52 | 15.54 | 4.68 | 16.45 | 5.84 |
| PANSS (General) | — | — | 28.53 | 7.82 | 34.88 | 9.00 | 32.57 | 8.78 |
| Maximum translation motion displacement (mm) | 0.58 | 0.85 | 0.67 | 0.55 | 0.76 | 0.85 | 0.65 | 0.58 |
| Maximum rotation motion displacement (degree) | 0.57 | 0.87 | 0.56 | 0.52 | 0.75 | 1.34 | 0.55 | 0.58 |
| n | % | n | n | % | % | n | % | |
| Male | 100 | 42 | 53 | 38% | 57 | 43 | 56 | 50 |
| Female | 138 | 58 | 87 | 62% | 75 | 57 | 57 | 50 |
SD, standard deviation; n, number; HC, healthy control; BPP, bipolar disorder with psychosis; SAD, schizoaffective disorder; SZ, schizophrenia; PANSS, Positive and Negative Syndrome Scale. Examined by analysis of variance, there were significant group differences in PANSS scores (P‐value = 5.04 e − 18 for the positive score, P‐value = 1.87 e − 15 for the negative score, and P‐value = 1.45 e − 8 for the general score). There was no significant group differences in motion (P‐value = 0.17 for the translation parameter and P‐value = 0.23 for the rotation parameter, tested by analysis of variance).
We preprocessed the fMRI data of each subject using a Data Processing Assistant for Resting‐State fMRI toolbox [Yan and Zang, 2010] based on Statistical Parametric Mapping (SPM8) (http://www.fil.ion.ucl.ac.uk/spm). The first six volumes were discarded, and then the remaining images were slice‐time corrected and realigned to the first volume for head‐motion correction. The output of realignment demonstrated that the head motion was slight in all subjects (the translations were less than 3 mm, and rotation did not exceed in all axis through the whole scanning process, see Table 1). Subsequently, we spatially normalized the images to the Montreal Neurological Institute EPI template [Friston et al., 1995], resliced them to 3 mm × 3 mm × 3 mm voxels, and smoothed them with a Gaussian kernel with a full‐width at half‐maximum of 8 mm. Detrending and filtering (0.01–0.08 Hz) [Auer, 2008; Cordes et al., 2001; Zuo et al., 2010] were then performed. Finally, nuisance covariates including six head motion parameters, white matter signal, cerebrospinal fluid signal, and global mean signal [Fox et al., 2005] were regressed out.
Method
Computing DFC via a sliding time window method
For each subject, we computed whole‐brain time‐varying connectivity matrices based on ( ) ROIs from the automated anatomical labeling (AAL) template [Tzourio‐Mazoyer et al., 2002] using a sliding time window method [Allen et al., 2014; Hutchison et al., 2013]. Figure 1A shows an example of estimation. The indices (IDs) and names of ROIs are included in Supporting Information Table S2. First, the averaged BOLD time‐series in ROI were computed. Second, for , the windowed time‐series were obtained by applying a sliding window on . Here, and denote the number of windows and the window ID, respectively. According to previous work [Allen et al., 2014; Zalesky and Breakspear, 2015], a tapered window was created by convolving a rectangle (width = 20 TRs) with Gaussian kernel (σ = 3 TRs) and moved in step of 1 TR. For different sites, the window length ranged from 30 to 60 s, which has been shown to be reasonable for capturing non‐stationarity in connectivity strengths [Abrol et al., 2016; Allen et al., 2014; Damaraju et al., 2014; Zalesky and Breakspear, 2015]. Supporting Information Table S1 includes the value of for each site. Thirdly, for each window , we calculated a connectivity matrix (size: ) that included the connectivity strengths between all pairs of . Consistent with previous studies [Allen et al., 2014; Damaraju et al., 2014], we initially estimated the regularized inverse covariance matrix [Smith et al., 2011] based on graphical LASSO model [Friedman et al., 2008]. For improving accuracy of dynamic connectivity estimation, LASSO imposed sparsity by placing a L1 norm penalty on the inverse covariance matrix to decrease noise effect of short time series in each window. When using the graphical LASSO, the regularization (penalty) parameter was optimized separately for each subject by evaluating the log‐likelihood in a cross‐validation framework (see details in the Supporting Information). After that, the covariance matrix was calculated based on the regularized inverse covariance matrix, and then was transformed into the correlation matrix that was taken as the estimation of . Thus, for each subject, matrices denoted by were obtained, representing the subject's dynamic connectivity patterns during the whole scan period.
Figure 1.
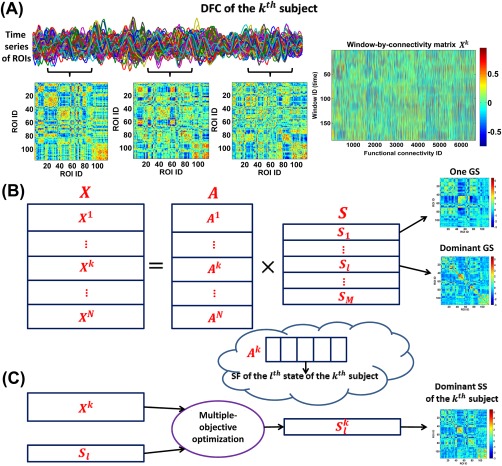
Framework for the DFC analyses. (A) Estimation of dynamic connectivity using a sliding time window method. (B) The first step of GIG‐ICA. For each group, the window‐direction concatenated dynamic connectivity of all subjects was decomposed by one ICA to obtain the GSs and the associated SFs. (C) The second step of GIG‐ICA. Based on the dominant GS and the individual‐subject dynamic connectivity, we used a multiple‐objective optimization to estimate the dominant SS for each subject. [Color figure can be viewed at http://wileyonlinelibrary.com]
Extracting functional connectivity states via GIG‐ICA
Instead of focusing only on the group‐level connectivity states, we applied GIG‐ICA method [Du and Fan, 2013] to the window‐direction concatenated dynamic connectivity patterns of multiple subjects to extract the inherent connectivity states at both group‐level and subject‐level. Considering the subtle differences among groups, GIG‐ICA was applied to each of the four groups separately.
Due to the symmetry of the connectivity matrix, all connectivity strengths among ROIs corresponding to the wth window can be converted to a vector containing only upper triangular elements in . Thus, the time‐varying connectivity patterns of the subject can be represented by a window‐by‐connectivity matrix (size: ). Consequently, the window‐direction concatenated dynamic connectivity patterns of all subjects can be represented by where is the number of subjects in one group.
At the first step of GIG‐ICA (Fig. 1B), we applied the Infomax algorithm [Amari et al., 1996; Bell and Sejnowski, 1995] to the Fisher‐transformed to estimate the group‐level connectivity states. To decrease the influence of initialization randomness in ICA, we applied ICASSO technique [Himberg et al., 2004] by running ICA multiple times and then finding reliable ICs. In our work, we selected the most stable run from 20 runs of ICA according to an improved method [Ma et al., 2011] and then regarded the components associated with the most stable ICA run as the reliable ICs (see Supporting Information), which is different from the original ICASSO technique [Himberg et al., 2004] taking the centrotypes of multiple runs as reliable ICs. Note that before the group‐level ICA, a two‐step PCA (including subject‐level PCAs and group‐level PCA) was performed for data reduction. In our study, the principal component numbers preserved in the subject‐level and group‐level PCAs were set to be the same for simplification. Thus, we obtained
| (1) |
where includes the estimated group‐level (common) ICs, representing the group‐level connectivity states (GSs). denotes the number of states. Greater will preserve more variances from individual‐subject dynamic connectivity. To simplify state matching and consequent comparisons among different groups, was determined to be the same number for all groups in our study. It is known that the selection of number of components is always difficult in blind signal decomposition problem, as different rules could result in different numbers. In dynamic connectivity analyses using fMRI data, many previous studies [Damaraju et al., 2014; Miller et al., 2016; Rashid et al., 2014; Yaesoubi et al., 2015] applied spatial ICA, temporal ICA, PCA, and K‐means to estimate connectivity states with the number of states as 5. Considering the similarity between our method and spatial ICA [Miller et al., 2016], we also set to 5, under which relatively high variance was preserved in individual PCAs (mean of the preserved variance percentage = 72%). Furthermore, we also evaluated the reliability of the estimated connectivity states under conditions of 20 ICA runs in one ICASSO, 100 additional ICASSO runs, and 100 subsets of original samples using different settings ( 2, 4, 5, 6, and 10). We found that the parameter 5 yielded greater reliability than bigger number (i.e., 6 and 10) while preserving acceptable variance compared to smaller number (i.e., 2 and 4). The relevant results can be found in Supporting Information Figs. S1‐S3. Next, each state (size: ) was Z‐scored to zero mean and unit variance for the following analysis. In Eq. (1), contains mixing matrices corresponding to subjects. For the subject, the associated mixing matrix is (size: ). Given , the column of (i.e., ) represents the subject‐specific fluctuation (SF) of the GS (i.e., ) in the subject's dynamic connectivity. As is the loading (or weight) coefficients in ICA, the sum of the absolute value of can reflect the state's importance to the subject's dynamic connectivity. Therefore, we measured the contribution of the lth GS to all subjects’ dynamic connectivity using , where is the column of . We term the GS with the greatest contribution the dominant GS, which included the most information (i.e., power) across the entire time‐varying connectivity patterns of all subjects.
At the second step of GIG‐ICA (Fig. 1C), based on the identified dominant GS and the individual‐subject Fisher‐transformed ), we estimated the corresponding dominant subject‐specific connectivity state (SS) for each subject. Using a multiple‐objective optimization function (2), the method simultaneously optimizes the independence of the subject‐specific IC (i.e., SS) as well as the correspondence between the subject‐specific IC (i.e., SS) and the group‐level IC (i.e., GS). To simplify description, we use to denote the identified dominant GS and to denote the corresponding dominant SS to estimate.
| (2) |
Here, denotes the dominant subject‐specific IC of the subject. is the whitened . is the unmixing vector. is a Gaussian variable with zero mean and unit variance. is a nonquadratic function. , the negentropy of the estimated with updates on , serves to measure the independence of . denotes the expectation of variable. , which equals to the Pearson correlation between and , was used to measures the similarity between and . Solving the optimization function results in the optimal , which represents the dominant SS of the subject. The algorithm automatically generates Z‐scored [Du and Fan, 2013], which can be compared across subjects. From the above derivation, is the corresponding SF of .
Hence, for each group we obtained five GSs, among which one GS was identified as the dominant GS. For each subject, we computed the dominant SS and SFs. It is worth noting that four groups of GSs may have diverse patterns and could not be very corresponding across groups, as they were estimated separately for each group. To make the GSs, the associated SFs and the dominant SS to be comparable across groups, we matched the results of the four groups using a greedy search rule (see Supporting Information).
Investigating group differences in the group‐level states and the states’ fluctuations
We expected to examine whether BPP, SAD, and SZ display disorder‐related connectivity states and whether the fluctuations of states show different features among groups. To show the overall difference in the GSs’ connectivity patterns, we visualized them using the BrainNet Viewer toolbox [Xia et al., 2013]. Furthermore, to assess the similarity of GSs across different groups, we computed Pearson correlation coefficients among the matched GSs, and took the mean of the correlations as their similarity measure.
We investigated the states’ fluctuations from two aspects. (1) To assess the variability of each state's SF for each subject, we computed the fractional amplitude of low frequency fluctuation (fALFF) of the normalized SF (with zero mean and unit variance) using its low‐frequency (<0.0125 Hz) to high‐frequency (>0.025Hz) power ratio [Du et al., 2015a]. For each state, we then compared the fALFF across groups using analysis of covariance (ANCOVA) (P < 0.05 with Bonferroni correction for multiple comparisons, i.e., P‐value threshold = 0.05/number of states) with age, gender, and site information as covariates and two‐tailed two‐sample t‐tests (P < 0.05 with Boneferroni correction, i.e., P‐value threshold = 0.05/number of group pairs). Additionally, we also compared the differences in fALFF among different states in each group using analysis of variance (P < 0.05 with Bonferroni correction, i.e., P‐value threshold = 0.05/number of groups). (2) We evaluated the activation mode of the states. For each state, the positive (or negative) values of all subjects’ SFs were thresholded by preserving half number of windows with greater absolute values using a manner similar to previous work [Yaesoubi et al., 2015], and then, the percentage of the positively (or negatively) active windows to all windows was calculated for each subject. Afterwards, for each state, we compared the positively (or negatively) active percentage among groups via ANCOVA (P < 0.05 with Bonferroni correction, i.e., P‐value threshold = 0.05/number of states) with age, gender, and site information as covariates and then two‐tailed two‐sample t‐tests (P < 0.05 with Boneferroni correction, i.e., P‐value threshold = 0.05/number of group pairs).
As mentioned in Extracting functional connectivity states via GIG‐ICA section, we tested the reliability of the estimated GSs of each group using different ICASSO runs. For each group, we repeated additional 100 ICASSO runs, each of which resulted in GSs. Then, we computed the similarity among GSs obtained from both original and additional 100 ICASSO runs.
Furthermore, we also evaluated if the estimated GSs of each group are stable when using different samples. For each group, we generated 100 permutations, each of which randomly included 80% of the original subjects. In each permutation run, we applied the group‐level ICA (as shown in Fig. 1B) to analyze the selected subjects’ dynamic connectivity, resulting in new GSs of the group. For each group, we further investigated similarity among those new GSs obtained from 100 permutations as well as the relationship between the GSs from the original subjects and the GSs from 100 permutations. (1) We computed Pearson correlation coefficients among the new GSs. (2) We projected the estimated GSs from both 100 permutations and the original subjects into a 2D‐plane using the t‐Distributed Stochastic Neighbor Embedding (t‐SNE) projection method [van der Maaten and Hinton, 2008]. (3) We averaged the corresponding GSs from 100 permutations, and then calculated Pearson correlation coefficient between each mean GS and the relevant GS obtained from the original subjects. Note for each permutation run, we matched the resulting states with the original states using a greedy rule for facilitating comparison.
Investigating group differences in the functional connectivities of the dominant state
Considering that the dominant state contained the most information of dynamic connectivity patterns, we compared the dominant connectivity state across groups in detail. We expected to explore the following aspects. (1) Whether functional connectivity (FC) strengths are impaired in those diagnoses. If true, which brain regions are involved in the altered FCs? (2) What kinds of deficits are related to symptomatology across diagnoses? Whether there is a gradual alteration from HC to BPP to SAD to SZ? Which impairments are common or unique?
To investigate differences among the four diagnostic groups, we performed ANCOVA (P < 0.01 with Bonferroni correction, i.e., P‐value threshold = 0.01/number of all ROI pairs) with age, gender, and site information as covariates on each element (reflecting one FC's strength) in the dominant SS. For each significantly discriminative FC, we further explored difference between any paired groups in the connectivity strength using a two‐tailed two‐sample t‐test (P < 0.01 with Bonferroni correction, i.e., P‐value threshold = 0.01/number of group pairs). Furthermore, for each discriminative FC, we computed the correlation (P < 0.05 with Bonferroni correction, i.e., P‐value threshold = 0.05/number of symptom scores) between the connectivity strengths and the symptom scores (displayed in Table 1) for patients to explore their association.
We also tested medication effects using two types of analyses. First, we converted all available anti‐psychotic data to their respective chlorpromazine (CPZ) dosage equivalents for 244 patients with available dose‐level medication data, as prescribed by Andreasen et al [2010]. We then used a multiple linear regression model to evaluate associations between CPZ measures and strengths of each FC (P < 0.05 with Bonferroni correction, i.e., P‐value threshold = 0.05/number of all ROI pairs). Second, we recoded available medication data into a binary “on”/”off” format for main drug classes (anti‐psychotics, anti‐depressants, mood stabilizers, anxiolytic/sedatives/hypnotic, and anti‐cholinergic/anti‐parkinsonian). Then, for each drug class, we performed a two‐tailed two‐sample t‐test (P < 0.05 with Bonferroni correction, i.e., P‐value threshold = 0.05/number of all ROI pairs) to examine group differences in FC strengths between the patients taking a particular medication and patients not taking the medication.
In our study, we applied GIG‐ICA to each group's dynamic connectivity separately to estimate the group‐specific connectivity states, which may raise concerns on whether the identified group differences were due to the grouping. To assess the validity of the identified group differences, we performed a permutation test based on 1,000 permutations by randomly rearranging all 623 subjects of the original four groups (i.e., HC, BPP, SAD, and SZ). For each of 1,000 permutations, we first generated four dummy groups each of which had the same number of subjects with the original group. Consistent with the processing on the original groups, we first estimated the group‐level states by performing the group‐level ICA on the dynamic connectivity of each dummy group, and then we identified the dominant group‐level state according to the states’ contributions, finally we estimated the dominant subject‐specific states on the basis of the dominant group‐level state. Afterwards, in each permutation run, we used ANCOVA with age, gender, and site information as covariates on each FC's strengths of the dominant subject‐specific states. While performing ANCOVA, the used age, gender and site information of each subject were the subject's real age, gender, and site information. Finally, for each FC in the dominant state, we calculated the occurring frequency of the case where the P‐value obtained from ANCOVA using rearranged groups (i.e., one permutation) was smaller than the corresponding P‐value obtained from ANCOVA using the original (i.e., real) groups. The frequency (i.e., the tail probability computed from 1,000 permutations) reflects the significance level of the identified group difference. Smaller tail probability indicates lower possibility of false positives of the identified group difference.
Static functional connectivity analyses
We performed the conventional SFC analyses for a comparison. For each subject, we computed Pearson correlation coefficients between any pair of , resulting in a connectivity matrix (size: ). Fisher's r‐to‐z transformation was applied to the connectivity strengths, and then ANCOVA (P < 0.01 with Bonferroni correction, i.e., P‐value threshold = 0.01/number of all ROI pairs) with age, gender, and site information as covariates was performed on each element (reflection one FC's strength) in . Based on each discriminative FC identified, we further explored the difference between any pair of groups using a two‐tailed two‐sample t‐test (P < 0.01 with Bonferroni correction, i.e., P‐value threshold = 0.01/number of group pairs). Similar to DFC analyses, we also computed Pearson correlation coefficients between the FC strengths and the symptom scores, and tested the medication effects for patients. Furthermore, to show the connectivity patterns, we averaged matrices across subjects for each group.
RESULTS
Dynamic Functional Connectivity
Figure 2A shows an example of the whole‐brain dynamic connectivity estimation from one subject. It can be seen that the connectivity pattern varied over time (windows), in agreement with prior reports of the brain functional dynamics [Calhoun et al., 2014]. Given any pair of windows with a specific distance (measured using the start time points of two windows), we computed the correlation between any pair of connectivity patterns in such two windows and averaged all correlations to measure the similarity of connectivity patterns in two windows with the distance. The result (bottom panel in Fig. 2A) shows that the similarity decreased rapidly along with the increasing distance and changed gently after the distance of 20, supporting the time‐varying property of connectivity and the existence of a relatively stable connectivity state. For a comparison, the connectivity matrix computed using the SFC analyses of the same subject is shown in Figure 2B. It can be seen that the connectivity pattern computed using the windowed BOLD signal was considerably different from that obtained using the whole BOLD signal, indicating that the dynamic connectivity approach may provide additional information.
Figure 2.
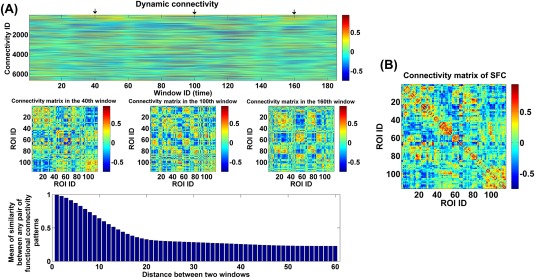
(A) The whole‐brain dynamic connectivity of one HC from Hartford site. Top panel: The window‐direction concatenated dynamic connectivity. Each column represents the connectivity strengths of all ROI pairs at one window, and each row represents the dynamics of connectivity strengths of one pair of ROIs. Middle panel: The connectivity matrices at three time windows marked by arrows in the top panel. Bottom panel: Mean of similarity (measured by correlation) between any two connectivity matrices in two windows with a specific distance. (B) The connectivity matrix from the SFC analyses of the same subject. The x‐axis and y‐axis in the bottom panel of (A) and (B) denotes the ROI ID, which corresponds to brain regions from the AAL template (see Supporting Information Table S2). [Color figure can be viewed at http://wileyonlinelibrary.com]
Group Differences in the Group‐Level States and the States’ Fluctuations
Figure 3A shows the ICASSO result of each group, indicating that the estimated GSs were relatively robust in 20 ICA runs. In addition, the performances of multiple ICASSO runs were also very close (Fig. 3B), supporting the states’ reliability. The matched GSs across HC, BPP, SAD, and SZ groups as well as their visualized connectivity patterns from the original ICASSO are shown in Figures 4 and 5, respectively. It is noted that the states were approximately matched across groups due to the fact that different groups exhibited various patterns of GSs. For each group, the dominant GS had the greatest contribution to the dynamic connectivity (46%, 44%, 48% and 47% for HC, BPP, SAD, and SZ groups, respectively), whereas each of the other four GSs had less than 20% contribution. Therefore, the dominant GS included the most information (i.e., power or contribution) compared to the remaining states.
Figure 3.
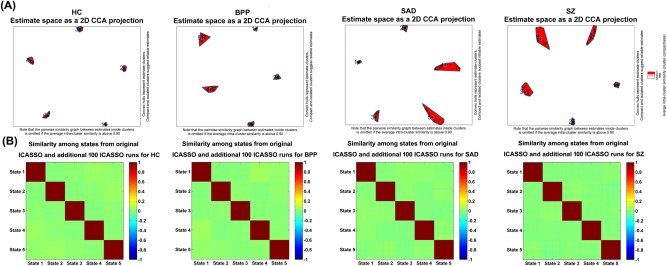
Reliability of GSs obtained from ICASSO runs. (A) ICASSO results of the group‐level states. Clusters are indicated by red convex hulls and white/red lines connect similar estimates. The cyanic circles indicate the reliable GSs, which were used for consequent analyses. (B) Similarity matrix among the states from original and additional 100 ICASSO runs. Each similarity matrix was computed based on 5 × 101 states obtained from original and additional 100 ICASSO runs. Each block on the diagonal of one similarity matrix reflects the similarity among corresponding states computed from 101 ICASSO runs. [Color figure can be viewed at http://wileyonlinelibrary.com]
Figure 4.
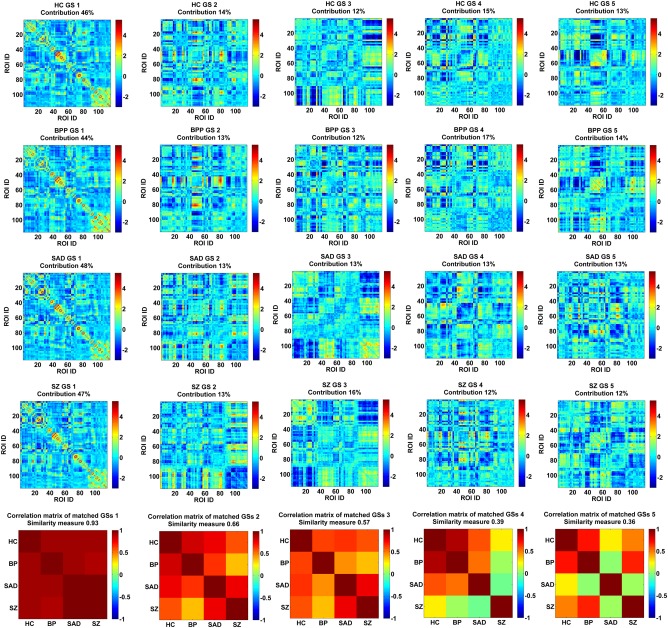
The matched GSs of HC, BPP, SAD, and SZ groups and their correlation matrix. Each row of the first four rows includes the connectivity matrices of GSs for one group. Contribution of each GS to dynamic connectivity is shown along with the GS matrix. Each matrix in the last row shows the correlation matrix of the matched GSs from four groups. The similarity measure reflects the mean of those correlations. The first column corresponds to the dominant GS. [Color figure can be viewed at http://wileyonlinelibrary.com]
Figure 5.
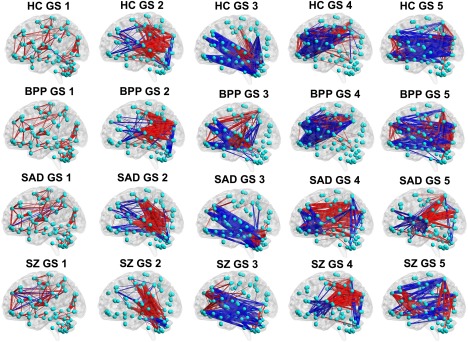
The visualized connectivity patterns of the matched GSs for HC, BPP, SAD, and SZ groups. The connectivity patterns are shown using the same sparsity, and the red and blue lines denote positive and negative values in the GS matrix (shown in Fig. 4), respectively. [Color figure can be viewed at http://wileyonlinelibrary.com]
Figure 4 (the bottom row) displays the correlation matrix of the matched GSs. Interestingly, the dominant GSs were very consistent across the four groups (similarity measure = 0.93). However, the similarity measures were relatively small for the rest of the four states (0.66, 0.57, 0.39, and 0.36, respectively). Specifically, for GS 2 and GS 3, BPP and SZ groups showed lowest correlation. Furthermore, GS 4 of SZ group was less correlated with all GSs 4 from other groups, and SAD group showed a unique pattern in GS 5, suggesting diagnosis‐relatedness of these states. To verify this, we also performed one group‐level ICA on the dynamic connectivity patterns of all 623 subjects to extract the connectivity states of all groups with the number of components as 5. Then, we computed the similarity between each state from one single group and the corresponding state from all groups. Results (shown in Supporting Information Fig. S4) support the diagnosis‐relatedness of GS 4 of SZ and GS 5 of SAD.
As mentioned in the method section, we also investigated stability of the identified group‐level states by applying 100 permutation runs to each group. Figure 6A shows the similarity matrix among all GSs from 100 permutations of each group. The result suggests that the corresponding GSs (especially the dominant GSs) obtained from different subsets of the same group were very similar. Figure 6B displays the projection results of the estimated GSs from both 100 permutations and the original subjects for each group, supporting that all corresponding GSs were clustered tightly. As shown in Figure 6C, each mean GS from 100 permutations was highly correlated to the relevant GS from the original subjects (correlations > 0.94). All our results support that the identified group‐level states were quite stable regardless of different samples and the original group‐level states (shown in Fig. 4 of the manuscript) were robust and meaningful.
Figure 6.
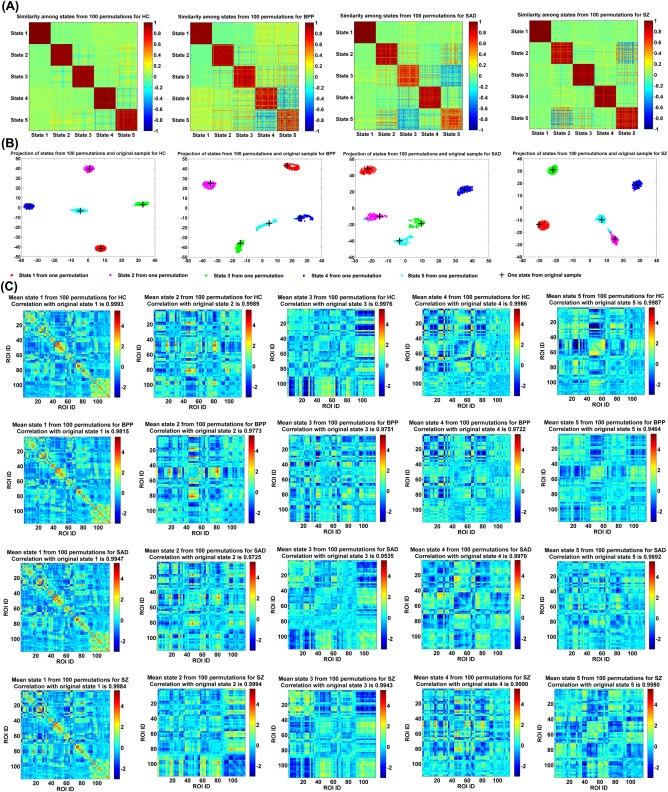
Reliability of GSs obtained from different permutations. (A) Similarity matrix of GSs from 100 permutations for each group. Each block on the diagonal of one similarity matrix reflects the similarity among corresponding states computed from 100 permutations. (B) Projection of the estimated GSs from 100 permutations and original subjects for each group. Corresponding GSs from different permutations are shown using dots with the same color. Each GS calculated from the original subjects is shown by a “+.” (C) Mean state of the corresponding GSs from 100 permutations for each group. The correlation between each mean GS and its associated GS from the original subjects is shown in the title of each subfigure. State corresponds to GS in Figure 4. [Color figure can be viewed at http://wileyonlinelibrary.com]
For each state, the corresponding SFs in all windows of all subjects are demonstrated in Figure 7A. Relative to other states, the dominant state contributed higher loadings in dynamic connectivity patterns for most of windows of all subjects. We compared the SF's fALFF among different states and did not find significant difference. However, measured by the mean of fALFF across subjects (shown in Supporting Information Fig. S5), the dominant state had slightly higher variability (low fALFF value) than other states, probably due to that the dominant state was relatively more active over time. There was no significant difference across the four groups in the variability of SFs. Figure 7B shows the percentage of the positively and negatively active windows for the matched states across groups. Our results indicate that for all subjects, the dominant GS was only positively active in the time‐varying connectivity. The percentage of the positively active window showed an increasing trend from BPP to SAD to SZ for GS 1 and GS 3. Specially, for GS 3, HC and BPP were more similar while SAD and SZ were close. In addition, for the GS 4 (SZ‐related state), SAD group showed difference with HC and BPP in activation. For the GS 5 (SAD‐related state), the activation mode of SZ was significantly different from that of HC and BPP. The results suggest that SAD and SZ groups showed greater change in fluctuations of states compared to BPP and HC groups.
Figure 7.
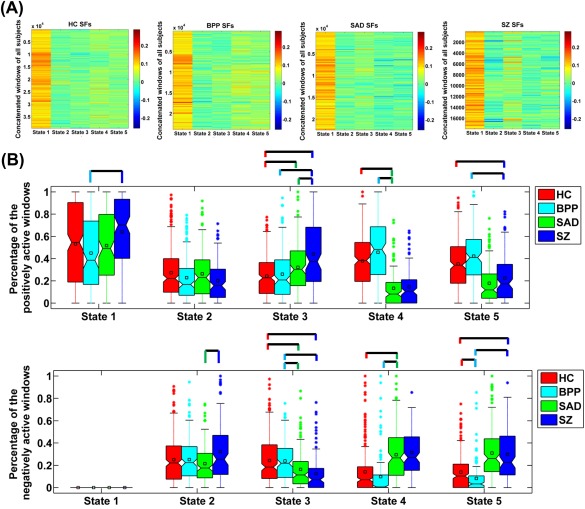
(A) Values of SFs in the concatenated windows of all subjects for each state. (B) The percentage of the positively and negatively active windows of each state. The percentages from different subjects in the same group are shown using a boxplot. For each boxplot, the central line is the median; the square is the mean; and the edges of the box are the 25th and 75th percentiles. The whiskers extend to 1 inter‐quartile range, and the outliers are displayed with a “*” sign. Any pair of groups with significant group difference tested by two‐sample t‐tests (P < 0.05 with Bonferroni correction) is denoted by a line. For State 4 of SZ and State 5 of SAD, we do not display their comparison results with the associated states from other groups, due to that they showed unique connectivity patterns. State corresponds to GS in Figure 4. [Color figure can be viewed at http://wileyonlinelibrary.com]
It is worth noting that the positive and negative values in the connectivity matrices of states (shown in Fig. 4) should be carefully interpreted as that the signs of ICs (i.e., states) are arbitrary. Therefore, the states should be considered along with their associated loadings (i.e., SFs). It can be observed from Figure 7 that the dominant state always had positive SFs, so the positive and negative values in the dominant state reflected the positive and negative connectivity strengths, respectively. Regarding the dominant GS, the positive connections primarily included the default mode network, the sensory‐motor network, the vision‐related network, and the within‐cerebellum connectivities, while the negative connections primarily linked cerebellum and other cortices including Rolandic operculum, insula, Heschl's gyri and superior temporal lobe. For other non‐dominant states, their SFs had both positive and negative values. Positive value in SF implies that the state exists in the connectivity pattern of the corresponding window, and negative value in SF indicates the anti‐state exists in the connectivity pattern of the corresponding window.
Group Differences in the Functional Connectivities of the Dominant State
Regarding the dominant SS, we show the ANCOVA result in Figure 8A–C. There are 166 FCs showing significant group difference, primarily located in the thalamus, cerebellum, frontal, temporal, occipital, fusiform, postcentral, cuneus, putamen, supramarginal, and calcarine cortices. Examined by two‐sample t‐tests, 52 FCs showed significant group differences among patient groups, while the remaining 114 FCs were only discrepant between HCs and psychosis patients. The detailed information including the associated ROIs, P‐value and effect size in ANCOVA, the mean of connectivity strength in each group, and the pair‐wise group difference are listed in Supporting Information Table S3. Additionally, we also examined group differences using analysis of variance (without covariates) instead of ANCOVA, and found similar discriminative FCs (see Supporting Information Fig. S6).
Figure 8.
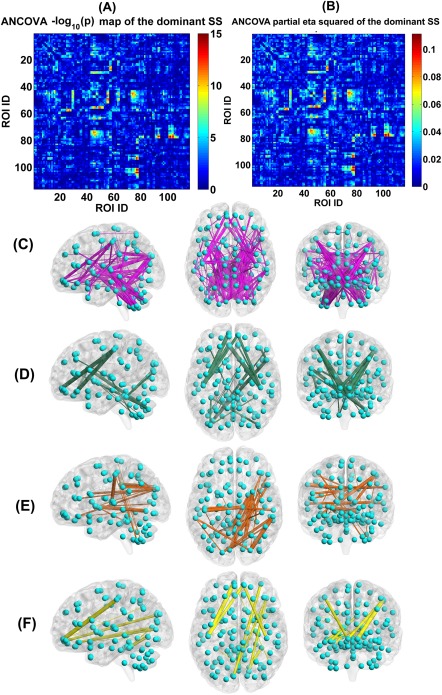
(A) Statistical values , which were identified by performing ANCOVA on each FC's strengths in the dominant SSs of the four groups. (B) Partial eta squared (reflecting effect size) of each FC in the dominant SS, tested by ANCOVA. (C) The visualization of the 166 discriminative FCs (P < 0.01 with Bonferroni correction). (D) Twenty‐two FCs which showed decreasing trends in the dominant SS from HC to BPP to SAD to SZ, measured by the mean connectivity strength. (E) Thirty‐four FCs which had increasing trends in the dominant SS from HC to BPP to SAD to SZ, measured by the mean connectivity strength. (F) Fourteen FCs which showed significant difference in HC versus SAD, HC versus SZ, BPP versus SAD, and BPP versus SZ, tested by two‐sample t‐tests (P < 0.01 with Bonferroni correction). In (C)–(F), the thickness of each line reflects the associated F‐value in ANCOVA. [Color figure can be viewed at http://wileyonlinelibrary.com]
Measured by the mean connectivity strength across subjects (see Supporting Information Table S3), 22 FCs (Fig. 8D) showed decreasing strengths, while 34 FCs (Fig. 8E) had increasing strengths from the HC to BPP to SAD to SZ. The hypoconnectivities with decreasing trends included the postcentral, frontal, and cerebellum cortices, and the hyperconnectivities with increasing trends involved insular, temporal, frontal, thalamus, cerebellum, fusiform, lingual, occipital, and supramarginal cortices. Interestingly, all hypoconnectivities having significant associations with the symptom scores were negatively correlated with the PANSS positive or negative scores, and all related FCs were linking postcentral and frontal gyri (see Fig. 9). Similarly, all hyperconnectivities having significant correlations with the symptom scores were positively correlated with the PANSS scores (see Fig. 10). Moreover, non‐frontal hyperconnectivities appeared to underlie negative symptoms, while frontal hyperconnectivities were more critical for positive symptoms. Therefore, our findings suggest that these FCs may reflect disease severity, and the FC strengths between postcentral and frontal cortices showed an apparent clinical relevance.
Figure 9.
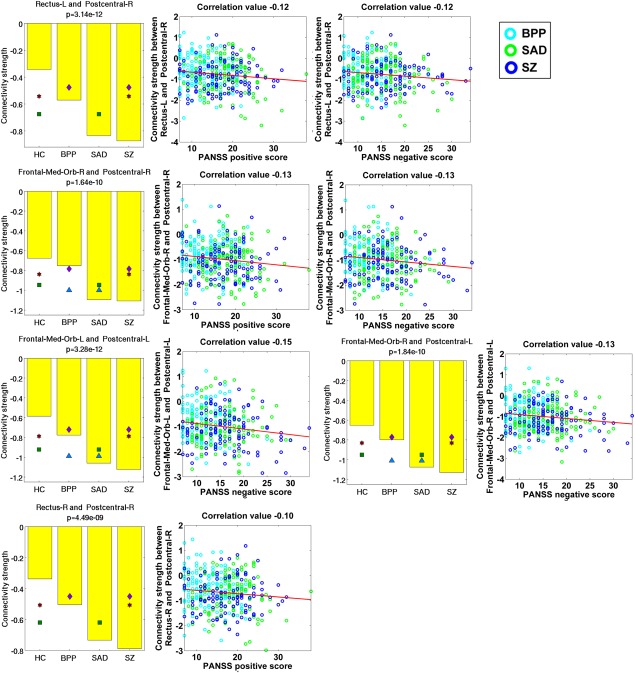
Statistical analyses and symptom association results of five hypoconnectivities that had significant correlations with the symptom scores. Statistical analyses result of each FC linking two ROIs is shown using a subfigure, where each bar shows the mean of connectivity strengths across subjects in one group, and the title includes the P‐value of ANCOVA. Any pair of groups with significant difference (two‐sample t‐test, P < 0.01 with Bonferroni correction) is denoted using two symbols with the same color and shape. Significant association was identified by computing Pearson correlation between the strengths of each discriminative FC and the symptom scores of patients (P < 0.05 with Bonferroni correction). The following similar figures are shown using the same manner. [Color figure can be viewed at http://wileyonlinelibrary.com]
Figure 10.
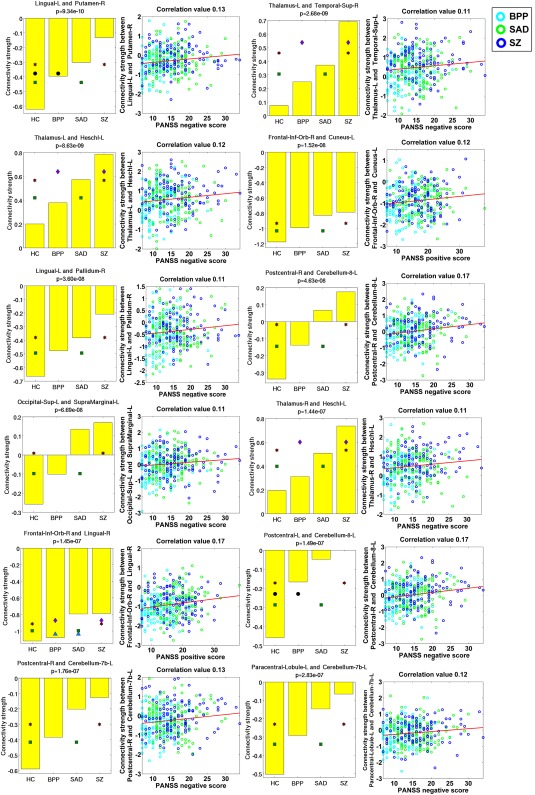
Statistical analyses and symptom association results of 12 hyperconnectivities that showed significant correlations with the symptom scores. [Color figure can be viewed at http://wileyonlinelibrary.com]
Figure 11.
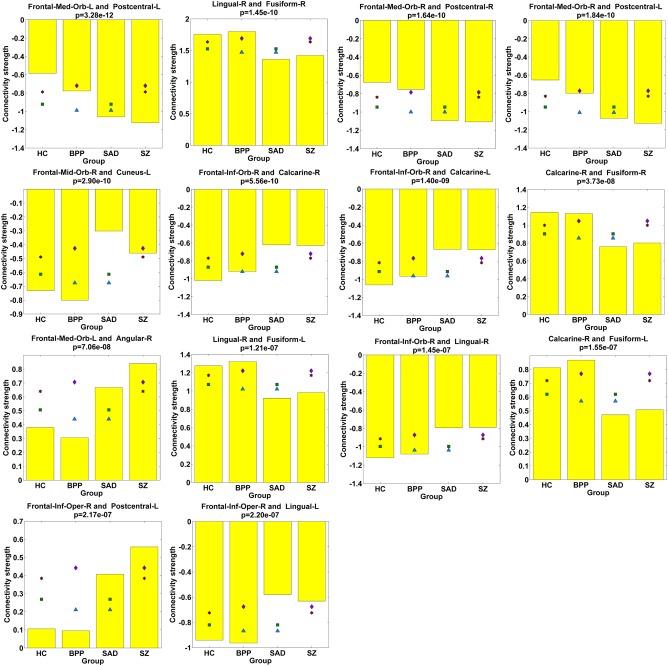
Statistical analyses results of 14 FCs showing significant differences in HC versus SAD, HC versus SZ, BPP versus SAD, and BPP versus SZ, assessed by two‐sample t‐tests (P < 0.01 with Bonferroni correction). [Color figure can be viewed at http://wileyonlinelibrary.com]
Assessed by two‐sample t‐tests, 14 FCs (see Figs. 8F and 11) only showed significant differences in HC versus SAD, HC versus SZ, BPP versus SAD, and BPP versus SZ, suggesting that BPP and HC groups resembled each other while SAD and SZ groups were more similar to each other in these FCs. Interestingly, 10 of the 14 FCs were relevant to the frontal cortex, and the remaining four FCs were located around fusiform gyrus. Hence, our results supported common frontal and fusiform impairments in SAD and SZ.
We also found that SZ differed significantly from other diagnostic groups in three FCs (Fig. 12), all of which were relevant to the left cerebellar crus. SAD had a significant alteration compared to the other three groups in one FC linking the frontal and fusiform cortices.
Figure 12.
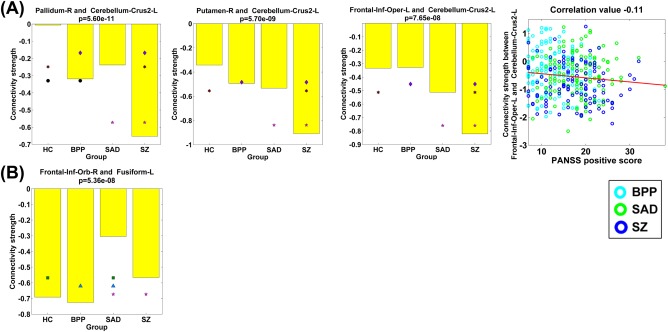
(A) Statistical analyses results of three FCs that showed significant group differences between the SZ group and the other three groups, tested by two‐sample t‐tests (P < 0.01 with Bonferroni correction). Last sub‐figure shows the significant association with the symptom scores (P < 0.05 with Bonferroni correction). (B) Statistical analyses result of one FC that showed significant group difference between the SAD group and the other three groups. [Color figure can be viewed at http://wileyonlinelibrary.com]
In addition, in targeted medication analyses, we found no significant associations between FC strengths and daily antipsychotic dose CPZ equivalents. Likewise, for binary coded medication classes, we observed no significant associations with FC.
As mentioned in Investigating group differences in the functional connectivities of the dominant state section, we examined the validity of the identified group differences using an additional permutation test. Figure 13A shows all connections’ P‐values obtained by performing ANCOVA on each connection's strengths in the dominant subject‐specific states based on the original four groups. Figure 13B displays all connections’ associated P‐values (i.e., the frequencies or tail probabilities) that were computed based on ANCOVA results of the dominant state from 1,000 permutations. By comparing Figure 13A and 13B, we found that the P‐value map was quite comparable between the original ANCOVA and the permutation test. More importantly, as shown in Figure 13C, regarding the identified 166 discriminative FCs presenting group differences among the original four groups, only 24 FCs (see Supporting Information Table S4 for details) showed P‐values with more than zero value (maximum P‐value = 0.014, minimum P‐value = 0.001, and mean P‐value = 0.0025) in the permutation test. In summary, our results support that the 166 discriminative connectivities shown in Figure 8C were driven by diseases rather than grouping.
Figure 13.

(A) P‐value map obtained from performing ANCOVA on each FC's strengths in the dominant subject‐specific states of the original four groups. (B) All FCs’ associated P‐values (i.e., the frequencies or tail probabilities) that were computed based on ANCOVA results of the dominant state from 1,000 permutations. (C) Among the 166 discriminative FCs (representing the significant group differences among the original four groups), only 24 FCs (see Supporting Information Table S4 for details) showed P‐values with more than zero value in the permutation test. [Color figure can be viewed at http://wileyonlinelibrary.com]
Group Differences Identified Using the SFC Analyses
Figure 14 displays each group's mean connectivity matrix obtained from the SFC analyses. By comparing Figure 14 with Figures 4 and 5, it is seen that the mean static connectivity matrix and the dominant group‐level state's connectivity matrix exhibited a similar pattern, supporting that the dominant state consisted of the most information of dynamic connectivity patterns. As shown in Figure 15A–C, ANCOVA on the static connectivity revealed significant group differences in 29 FCs (see Supporting Information Table S4 for details). Among the 29 FCs, 28 FCs were observed using the above mentioned DFC method.
Figure 14.
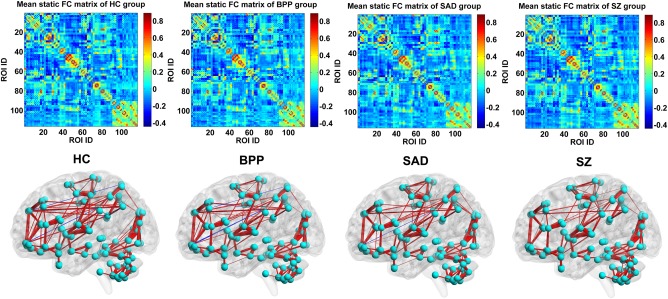
The mean static FC matrix across subjects and its visualized pattern for HC, BPP, SAD, and SZ group, respectively. The red and blue lines represent positive and negative connectivity strengths, respectively. [Color figure can be viewed at http://wileyonlinelibrary.com]
Figure 15.
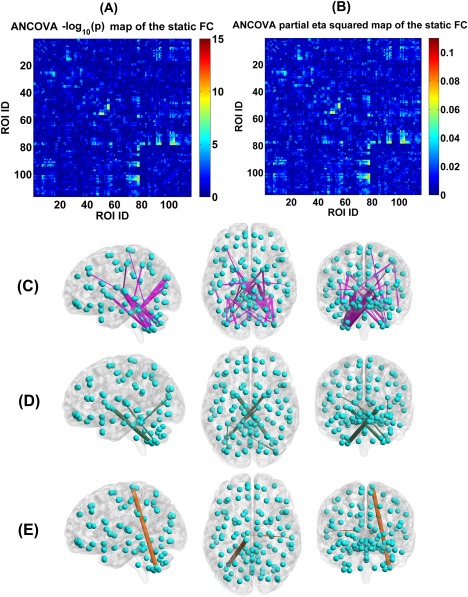
(A) Statistical values , which were identified by performing ANCOVA on each FC's strengths in the static FC matrix of the four groups. (B) Partial eta squared of each FC in the SFC matrix, examined by ANCOVA. (C) The visualization of the 29 discriminative FCs (P < 0.01 with Bonferroni correction). (D) Six FCs that showed decreasing trends from HC to BPP to SAD to SZ using the static connectivity analyses, measured by the mean connectivity strength. (E) Three FCs showing increasing trends across the four groups using the static connectivity analyses, measured by the mean connectivity strength. In (C)–(E), the thickness of each line reflects the associated F‐value in ANCOVA. [Color figure can be viewed at http://wileyonlinelibrary.com]
Measured by the mean connectivity strength across subjects, six FCs showed decreasing strengths (as shown in Fig. 15D), while three FCs had increasing strengths (as shown in Fig. 15E) across HC, BPP, SAD, and SZ groups using the SFC analyses. The hypoconnectivities (Fig. 16A) involved pallidum, cerebellum, thalamus, occipital, and fusiform cortices, and the hyperconnectivities (Fig. 16B) lay in paracentral, thalamus, cerebellum, and temporal cortices. Only one hyperconnectivity linking paracentral lobule and cerebellum (Fig. 16C) showed significant positive correlations with PANSS positive and negative scores of patients.
Figure 16.
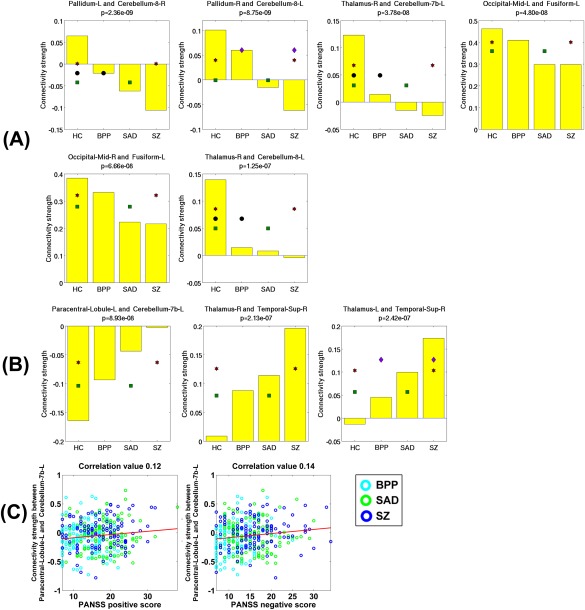
(A) Statistical analyses results of all six hypoconnectivities in the SFC analyses. (B) Statistical analyses results of all three hyperconnectivities in the SFC analyses. (C) Significant associations between FC strengths and the symptom scores of patients (P < 0.05 with Bonferroni correction). The connectivity strengths were Fisher's r‐to‐z transformed. [Color figure can be viewed at http://wileyonlinelibrary.com]
Evaluated by two‐sample t‐tests, only three FCs showed difference among patient groups using the SFC analyses. Among the three FCs, one FC showed difference between SAD and SZ, while the other two FCs were different between BPP and SZ (see Supporting Information Table S5). No SAD or SZ related alteration was found. Similar to the DFC analyses, no association was found between the FC strengths and current medication status. Taken together, more informative potential biomarkers were found using our DFC analyses, compared to the SFC analyses.
DISCUSSION AND CONCLUSIONS
Exploring neuroimaging‐based biomarkers to help differentiate BPP, SAD, and SZ patients, who display significant clinical overlap, is promising but challenging. Recently, there has been growing interest in studying brain dynamic connectivity which may uncover important dynamic‐based biomarkers. In this article, we introduced a GIG‐ICA framework to estimate both group‐level and subject‐specific connectivity states from time‐varying connectivity patterns. Our method enables performance of analyses on subject‐level features, such as identifying diseases biomarkers using statistical methods and classifying individual patients using machine learning approaches. By analyzing the whole‐brain ROIs‐based dynamic connectivity derived from resting‐state fMRI data, we examined group differences among a large sample including HCs, BPP, SAD, and SZ patients.
We observed that while the dominant group‐level state (GS 1) with the greatest contribution to time‐varying connectivity was highly consistent across groups, the non‐dominant states showed varied or disparate patterns across groups. Specifically, for GS 2 and GS 3, BPP and SZ groups showed lowest similarity, but GS 4 of SZ and GS 5 of SAD were diagnosis‐related. Interestingly, these states also showed different activation patterns among groups, suggesting the possibility of further developing these measures as diagnoses‐related biomarkers. The positively active window showed an increasing trend across BPP, SAD and SZ groups for GS 1 and GS 3. For the activation mode of GS 3, HC and BPP resembled each other more closely while SAD and SZ were more similar. Regarding the SAD (or SZ) related state, SZ (or SAD) showed significant activation difference with both HC and BPP. All the findings support the hypothesis that SAD and SZ had more abnormal patterns than BPP. It is also worth pointing out that we evaluated the reliability of each group's connectivity states by performing additional ICASSO runs and using different subsets of samples (i.e., permutations). Our results suggested that the identified states were reliable and meaningful.
Regarding the dominant state, widespread group differences lay in 166 FCs, which mainly involved the thalamus, cerebellum, frontal, temporal, occipital, fusiform, postcentral, cuneus, supramarginal, and calcarine cortices. Furthermore, there were progressive abnormalities from HCs to BPP patients to SAD patients to SZ patients with respect to hypoconnectivities and hyperconnectivities. The results are consistent with some previous studies that observed more severe gray matter deficits from BPP to SAD to SZ [Ivleva et al., 2013] and functional impairments from BPP to SZ [Argyelan et al., 2014]. Hence, our findings support the view that these chronic psychotic disorders are in a continuum of severity, with BPP closer to normality and SZ at the more severe end. Specifically, 22 FCs associated with the postcentral, frontal, and cerebellar cortices showed decreasing trends across HC, BPP, SAD, and SZ groups, while 34 FCs associated with the insular, temporal, frontal, fusiform, lingual, occipital, supramarginal cortices, as well as thalamus and cerebellum, had increasing trends across those groups. Promisingly, these FCs showing decreasing/increasing trends across groups also had negative/positive correlations with the symptom severity scores in patients, indicating the clinical relevance of these possible biomarkers. Interestingly, all hypoconnectivities that showed significantly negative correlations with symptom scores were linking the postcentral and frontal cortices. Therefore, our findings support the postcentral‐frontal connectivity strength as an underlying biomarker for psychosis severity, consistent with the previous work [Lynall et al., 2010] that also revealed reduced FCs in precentral, postcentral, frontal, temporal, and insular cortices in SZ. Noteworthy, these FC differences among patient groups were not attributable to the current medication status.
Furthermore, the psychosis groups showed between‐group difference in 52 FCs, while HCs differed from patients in 114 FCs. The results indicate that these psychotic disorders showed considerably similar alterations in connectivities, consistent with prior studies [Meda et al., 2016; Pearlson et al., 2016]. We also found that for 14 FCs involving the frontal cortex and fusiform gyrus, HCs and BPP patients were more similar to each other, while SAD resembled SZ patients. This supports common executive function (associated with frontal cortex) and face recognition (relevant to fusiform) abnormalities in SAD and SZ, consistent with previous reports from other groups [Beatty et al., 1993; Bora et al., 2009; Tang et al., 2012]. The current finding is also consistent with the results of our previous work [Du et al., 2014, 2015b], which used spatial functional networks to investigate the hierarchical inter‐group relationship and found that HCs and BPP patients clustered into one group while SAD and SZ patients clustered into another. Our finding supports the idea that SAD may be biologically similar to SZ, as classified based on symptoms in the current DSM‐5 [Heckers et al., 2013; Malaspina et al., 2013].
Our results also suggest that compared to other groups, SZ patients had significant alterations in three FCs related to the left cerebellar crus. SAD was different from all other groups in one FC linking frontal and fusiform cortices. Cerebellum is usually considered to be mostly associated with motor function, however, increasing evidence suggests that the cerebellum participates in high‐order brain function and cerebellar brain networks are impaired in SZ patients [Buckner, 2013; Collin et al., 2011; Guo et al., 2015; Koziol et al., 2014; Ramnani, 2012; Stoodley, 2012]. Previous work showed reduced gray matter volumes of fusiform in SAD [Landin‐Romero et al., 2017]. Therefore, these diagnosis‐related aberrances may help contribute to the differentiation of three disorders with overlapping symptoms.
Using the traditional static connectivity technique, we only observed 29 discriminative FCs, 28 of which overlapped with those identified using our dynamic connectivity analysis method. Among patient groups, three connectivities were different, including one FC that distinguished between SAD and SZ groups and two FCs showing differences between BPP and SZ populations. The conventional method failed to reveal any SAD‐ or SZ‐specific alteration. Superior to the SFC analysis, our DFC method is able to extract inherent connectivity states, consequently enabling us to identify biomarkers from multiple states as well as the fluctuations of those states. In summary, our approach is superior to standard SFC in identifying connectivity‐related biomarkers of the psychosis groups.
Our method is able to compute the subject‐specific states with direct correspondence across subjects, while preserving the accuracy of the subject‐specific states through optimizing their independence. Considering the subtle clinical differences among groups, we applied GIG‐ICA to dynamic connectivity patterns of each group separately rather than dynamic connectivity patterns of all groups. If all subjects’ dynamic connectivity patterns from the four groups were analyzed by one GIG‐ICA, the assumption of common states across all groups may be too strict and category‐specific group‐level states cannot be detected. Furthermore, to assess the validity of the found group differences, we also applied a permutation test with 1,000 permutation runs, each of which randomly rearranged all 623 subjects to generate four dummy groups and then investigated group differences. Results from the permutation test clearly support that the 166 discriminative FCs were driven by diseases rather than grouping. In our study, the subject‐specific states provided discriminative measures, and promisingly those measures showed reasonable associations with symptom severity scores in patients, indicating accuracy of the obtained individual features. We also noticed that there is no work that performs individual ICA on each subject's dynamic connectivity to estimate the subject‐specific states. This is probably due to the difficulty of establishing correspondence among subject‐specific states estimated using individual ICA.
Previous dynamic studies [Damaraju et al., 2014; Rashid et al., 2014] have used K‐means to compare dynamic functional network connectivity (dFNC) between SZ and BPP. In contrast, our article focused on the whole‐brain AAL ROIs‐based dynamic connectivity, and applied GIG‐ICA to estimate the subject‐specific states. Hence, the findings are not especially comparable between our work and previous dynamic studies. However, Rashid et al. [2014] also found differences between SZ and BPP in the frontal and frontal‐parietal regions.
While there is no gold standard for ROI selection, we used the canonical AAL template‐defined regions as ROIs to compute whole‐brain functional connectivity, as the template provides a clear parcellation and explicit description on whole‐brain regions. Recently, researchers have also used brain regions with functional coherence obtained from group ICA [Allen et al., 2014; Damaraju et al., 2014], clustering techniques [Craddock et al., 2012; Du et al., 2012; Thirion et al., 2014], and previous fMRI studies [Du et al., 2016] to calculate connectivities. ROIs obtained using data‐driven methods may be sensitive to the model parameters such as the number of ICs or clusters. However, dynamic analyses using ROIs with more flexible brain function also worth studying.
There are some limitations that are worth further consideration in future. First, the number of ICs was adjustable, and the change of this parameter may influence the estimated states and the identified group differences. To facilitate the comparison among the four groups, we set the number of ICs as an empirical value, five [Damaraju et al., 2014; Miller et al., 2016; Rashid et al., 2014; Yaesoubi et al., 2015], for all groups. The setting preserving enough variance in individual PCAs led to reliable performance under the conditions of different ICA runs, different ICASSO runs and different subsets of samples for all groups. Furthermore, we also investigated the states’ reliability under different numbers of ICs including 2, 4, 5, 6, and 10. Results (Supporting Information Figs. S1‐S3) show that the parameter 5 yielded relatively higher reliability than bigger number (i.e., 6 and 10) while preserving acceptable variances compared to smaller number (i.e., 2 and 4). We also found that the group differences in the dominant state identified using different settings showed similarity to some extent (see Supporting Information Fig. S7), while the P‐value maps from settings 5 and 6 were likely closest to each other. Hence, the setting 5 maintained a relatively better balance among the preserved variance, the reliability of states, and the resulting group differences in our study. However, other choices for the number of states, such as different settings for different groups, may deserve further study. In addition, effectiveness of the identified measures for distinguishing individual patients also needs to be evaluated in future work. Second, we mainly investigated the subtle group differences in connectivities based on the dominant state due to the fact that the dominant state was very consistent and comparable across all subjects in all groups. For the non‐dominant states matched approximately across groups, different groups exhibited various patterns. Therefore, we primarily compared their similarity and disparity at the group level as well as their fluctuations for those highly‐matched states, rather than conducting statistical analyses on the individual‐level states. In future, an effective method needs to be developed to investigate differences in the non‐dominant individual states. Third, the number of time points of fMRI data used in our study was relatively small. Some work [Leonardi et al., 2013] used data including more volumes to investigate dynamics; however, many studies have already shown that different connectivity states can be robustly and replicably captured using similar time points in a short period [Abrol et al., 2016; Calhoun et al., 2014; Damaraju et al., 2014; Miller et al., 2016; Rashid et al., 2014; Yaesoubi et al., 2015; Yu et al., 2015]. Fourth, we regressed out the global signal from each voxel's time series in preprocessing, as a global signal is assumed to reflect a combination of resting‐state fluctuations, physiological noise (e.g., respiratory and cardiac noise), and other noise signals with non‐neural origin. Removal of the global mean has been shown to facilitate the detection of localized neuronal signals and improve the specificity of FC analysis [Chai et al., 2012; Fox et al., 2005, 2009; Van Dijk et al., 2010], although it could result in increased negative correlations [Murphy et al., 2009]. Some previous work [Chai et al., 2012; Chang and Glover, 2009; Fox et al., 2009] reported that meaningful anti‐correlated networks may only become detectable after regressing no‐biological origins. Considering that regressing out global mean is a controversial issue [Hayasaka, 2013], it may deserve further investigation. Finally, we did not study non‐psychotic bipolar patients; whether these differ from bipolar individuals with psychotic symptoms needs to be studied separately. In addition, we investigated group differences based on the symptom‐based diagnoses that likely need more refinement. Biomarker‐based categories termed Biotypes [Clementz et al., 2016] have shown promising performance as an effort to understand neurobiological heterogeneity in psychosis. In future work, we will investigate group differences in dynamic connectivity based on novel multi‐domain biomarker batteries derived from multiple types of biological assessment [Clementz et al., 2015; Meda et al., 2016].
In summary, we propose here a novel scheme that uses GIG‐ICA method to analyze dynamic connectivity. Results showed that our approach detected group differences and associations with symptoms that were not evident using the conventional static connectivity analysis. Findings using our method suggested that the diagnosis‐related states with varied activation were present for these mental disorders. Based on the dominant state, both hypoconnectivities and hyperconnectivities were observed for these diagnoses, and interestingly these connections’ strengths had reasonable associations with the symptom scores. Our results support that SAD and SZ showed common impairments in frontal connectivities, compared to HC and BPP. Furthermore, we also found SZ‐ and SAD‐related connectivity alterations. Collectively, our work shows the promising potential of dynamic connectivity analysis for understanding these symptomatically similar disorders.
Supporting information
Supporting Information
REFERENCES
- Abrol A, Chaze C, Damaraju E, Calhoun VD (2016): The chronnectome: Replicability of dynamic connectivity patterns in 7500 resting fMRI datasets. In: 38th Annual International Conference of the IEEE Engineering in Medicine and Biology. Orlando, USA. [DOI] [PubMed]
- Allen EA, Damaraju E, Plis SM, Erhardt EB, Eichele T, Calhoun VD (2014): Tracking whole‐brain connectivity dynamics in the resting state. Cereb Cortex 24:663–676. [DOI] [PMC free article] [PubMed] [Google Scholar]
- Amari S, Cichocki A, Yang HH (1996): A new learning algorithm for blind signal separation. Adv Neural Inf Process Syst 8:757–763. [Google Scholar]
- Andreasen NC, Pressler M, Nopoulos P, Miller D, Ho BC (2010): Antipsychotic dose equivalents and dose‐years: A standardized method for comparing exposure to different drugs. Biol Psychiatry 67:255–262. [DOI] [PMC free article] [PubMed] [Google Scholar]
- Argyelan M, Ikuta T, DeRosse P, Braga RJ, Burdick KE, John M, Kingsley PB, Malhotra AK, Szeszko PR (2014): Resting‐state FMRI connectivity impairment in schizophrenia and bipolar disorder. Schizophr Bull 40:100–110. [DOI] [PMC free article] [PubMed] [Google Scholar]
- Auer DP (2008): Spontaneous low‐frequency blood oxygenation level‐dependent fluctuations and functional connectivity analysis of the 'resting' brain. Magn Reson Imaging 26:1055–1064. [DOI] [PubMed] [Google Scholar]
- Beatty WW, Jocic Z, Monson N, Staton RD (1993): Memory and frontal lobe dysfunction in schizophrenia and schizoaffective disorder. J Nerv Ment Dis 181:448–453. [DOI] [PubMed] [Google Scholar]
- Bell AJ, Sejnowski TJ (1995): An information‐maximization approach to blind separation and blind deconvolution. Neural Comput 7:1129–1159. [DOI] [PubMed] [Google Scholar]
- Bora E, Yucel M, Pantelis C (2009): Cognitive functioning in schizophrenia, schizoaffective disorder and affective psychoses: Meta‐analytic study. Br J Psychiatry 195:475–482. [DOI] [PubMed] [Google Scholar]
- Buckner RL (2013): The cerebellum and cognitive function: 25 years of insight from anatomy and neuroimaging. Neuron 80:807–815. [DOI] [PubMed] [Google Scholar]
- Calhoun VD, Miller R, Pearlson GD, Adali T (2014): The chronnectome: Time‐varying connectivity networks as the next frontier in fMRI data discovery. Neuro 84:262–274. [DOI] [PMC free article] [PubMed] [Google Scholar]
- Cardno AG, Owen MJ (2014): Genetic relationships between schizophrenia, bipolar disorder, and schizoaffective disorder. Schizophr Bull 40:504–515. [DOI] [PMC free article] [PubMed] [Google Scholar]
- Chai XQJ, Castanon AN, Ongur D, Whitfield‐Gabrieli S (2012): Anticorrelations in resting state networks without global signal regression. NeuroImage 59:1420–1428. [DOI] [PMC free article] [PubMed] [Google Scholar]
- Chang C, Glover GH (2009): Effects of model‐based physiological noise correction on default mode network anti‐correlations and correlations. NeuroImage 47:1448–1459. [DOI] [PMC free article] [PubMed] [Google Scholar]
- Clementz BA, Sweeney J, Keshavan MS, Pearlson G, Tamminga CA (2015): Using biomarker batteries. Biol Psychiatry 77:90–92. [DOI] [PubMed] [Google Scholar]
- Clementz BA, Sweeney JA, Hamm JP, Ivleva EI, Ethridge LE, Pearlson GD, Keshavan MS, Tamminga CA (2016): Identification of distinct psychosis biotypes using brain‐based biomarkers. Am J Psychiatry 173:373–384. [DOI] [PMC free article] [PubMed] [Google Scholar]
- Collin G, Hulshoff Pol HE, Haijma SV, Cahn W, Kahn RS, van den Heuvel MP (2011): Impaired cerebellar functional connectivity in schizophrenia patients and their healthy siblings. Front Psychiatry 2:73. [DOI] [PMC free article] [PubMed] [Google Scholar]
- Cordes D, Haughton VM, Arfanakis K, Carew JD, Turski PA, Moritz CH, Quigley MA, Meyerand ME (2001): Frequencies contributing to functional connectivity in the cerebral cortex in “resting‐state” data. Am J Neuroradiol 22:1326–1333. [PMC free article] [PubMed] [Google Scholar]
- Cosgrove VE, Suppes T (2013): Informing DSM‐5: Biological boundaries between bipolar I disorder, schizoaffective disorder, and schizophrenia. BMC Med 11:127. [DOI] [PMC free article] [PubMed] [Google Scholar]
- Craddock RC, James GA, Holtzheimer PE III, Hu XP, Mayberg HS (2012): A whole brain fMRI atlas generated via spatially constrained spectral clustering. Hum Brain Mapp 33:1914–1928. [DOI] [PMC free article] [PubMed] [Google Scholar]
- Damaraju E, Allen EA, Belger A, Ford JM, McEwen S, Mathalon DH, Mueller BA, Pearlson GD, Potkin SG, Preda A, Turner JA, Vaidya JG, van Erp TG, Calhoun VD (2014): Dynamic functional connectivity analysis reveals transient states of dysconnectivity in schizophrenia. NeuroImage 5:298–308. [DOI] [PMC free article] [PubMed] [Google Scholar]
- Di X, Biswal BB (2013): Dynamic brain functional connectivity modulated by resting‐state networks. Brain Struct Funct 220:37–46. [DOI] [PMC free article] [PubMed] [Google Scholar]
- Du YH, Fan Y (2013): Group information guided ICA for fMRI data analysis. NeuroImage 69:157–197. [DOI] [PubMed] [Google Scholar]
- Du YH, Li HM, Wu H, Fan Y (2012): Identification of subject specific and functional consistent ROIs using semi‐supervised learning. Proc SPIE 8314:163. [Google Scholar]
- Du YH, Liu JY, Sui J, He H, Pearlson GD, Calhoun VD (2014): Exploring difference and overlap between schizophrenia, schizoaffective and bipolar disorders using resting‐state brain functional networks. In: The 36th Annual International Conference of the IEEE Engineering in Medicine and Biology Society (EMBC). Chicago, USA. pp 1517–1520. [DOI] [PubMed]
- Du YH, He H, Wu L, Yu QB, Sui J, Calhoun VD (2015a): Dynamic default mode network connectivity diminished in patients with schizophrenia. In: IEEE 12th International Symposium on Biomedical Imaging (ISBI). New York, USA. pp 474–477.
- Du YH, Pearlson GD, Liu JY, Sui J, Yu QB, He H, Castro E, Calhoun VD (2015b): A group ICA based framework for evaluating resting fMRI markers when disease categories are unclear: Application to schizophrenia, bipolar, and schizoaffective disorders. NeuroImage 122:272–280. [DOI] [PMC free article] [PubMed] [Google Scholar]
- Du YH, Pearlson GD, Yu Q, He H, Lin DD, Sui J, Wu L, Calhoun VD (2016): Interaction among subsystems within default mode network diminished in schizophrenia patients: A dynamic connectivity approach. Schizophr Res 170:55–65. [DOI] [PMC free article] [PubMed] [Google Scholar]
- Ebert A, Bar KJ (2010): Emil Kraepelin: A pioneer of scientific understanding of psychiatry and psychopharmacology. Indian J Psychiatry 52:191–192. [DOI] [PMC free article] [PubMed] [Google Scholar]
- Fox MD, Snyder AZ, Vincent JL, Corbetta M, Van Essen DC, Raichle ME (2005): The human brain is intrinsically organized into dynamic, anticorrelated functional networks. Proc Natl Acad Sci USA 102:9673–9678. [DOI] [PMC free article] [PubMed] [Google Scholar]
- Fox MD, Zhang D, Snyder AZ, Raichle ME (2009): The global signal and observed anticorrelated resting state brain networks. J Neurophysiol 101:3270–3283. [DOI] [PMC free article] [PubMed] [Google Scholar]
- Friedman J, Hastie T, Tibshirani R (2008): Sparse inverse covariance estimation with the graphical lasso. Biostatistics 9:432–441. [DOI] [PMC free article] [PubMed] [Google Scholar]
- Friston KJ, Ashburner J, Frith CD, Poline JB, Heather JD, Frackowiak RSJ (1995): Spatial registration and normalization of images. Hum Brain Mapp 3:165–189. [Google Scholar]
- Glahn DC, Laird AR, Ellison‐Wright I, Thelen SM, Robinson JL, Lancaster JL, Bullmore E, Fox PT (2008): Meta‐analysis of gray matter anomalies in schizophrenia: Application of anatomic likelihood estimation and network analysis. Biol Psychiatry 64:774–781. [DOI] [PMC free article] [PubMed] [Google Scholar]
- Guo WB, Liu F, Chen JD, Wu RR, Zhang ZK, Yu MY, Xiao CQ, Zhao JP (2015): Resting‐state cerebellar‐cerebral networks are differently affected in first‐episode, drug‐naive schizophrenia patients and unaffected siblings. Sci Rep 5: 17275. [DOI] [PMC free article] [PubMed] [Google Scholar]
- Hayasaka S (2013): Functional connectivity networks with and without global signal correction. Front Hum Neurosci 7: 880. [DOI] [PMC free article] [PubMed] [Google Scholar]
- Heckers S, Barch DM, Bustillo J, Gaebel W, Gur R, Malaspina D, Owen MJ, Schultz S, Tandon R, Tsuang M, Van Os J, Carpenter W (2013): Structure of the psychotic disorders classification in DSM‐5. Schizophr Res 150:11–14. [DOI] [PubMed] [Google Scholar]
- Himberg J, Hyvarinen A, Esposito F (2004): Validating the independent components of neuroimaging time series via clustering and visualization. NeuroImage 22:1214–1222. [DOI] [PubMed] [Google Scholar]
- Hutchison RM, Womelsdorf T, Gati JS, Everling S, Menon RS (2013): Resting‐state networks show dynamic functional connectivity in awake humans and anesthetized macaques. Hum Brain Mapp 34:2154–2177. [DOI] [PMC free article] [PubMed] [Google Scholar]
- Ivleva EI, Bidesi AS, Keshavan MS, Pearlson GD, Meda SA, Dodig D, Moates AF, Lu H, Francis AN, Tandon N, Schretlen DJ, Sweeney JA, Clementz BA, Tamminga CA (2013): Gray matter volume as an intermediate phenotype for psychosis: Bipolar‐Schizophrenia Network on Intermediate Phenotypes (B‐SNIP). Am J Psychiatry 170:1285–1296. [DOI] [PMC free article] [PubMed] [Google Scholar]
- Kasanin J (1933): The acute schizoaffective psychoses. Am J Psychiatry 13:97–126. [DOI] [PubMed] [Google Scholar]
- Khadka S, Meda SA, Stevens MC, Glahn DC, Calhoun VD, Sweeney JA, Tamminga CA, Keshavan MS, O'Neil K, Schretlen D, Pearlson GD (2013): Is aberrant functional connectivity a psychosis endophenotype? A resting state functional magnetic resonance imaging study. Biol Psychiatry 74:458–466. [DOI] [PMC free article] [PubMed] [Google Scholar]
- Kiviniemi V, Vire T, Remes J, Elseoud AA, Starck T, Tervonen O, Nikkinen J (2011): A sliding time‐window ICA reveals spatial variability of the default mode network in time. Brain Connect 1:339–347. [DOI] [PubMed] [Google Scholar]
- Koziol LF, Budding D, Andreasen N, D'Arrigo S, Bulgheroni S, Imamizu H, Ito M, Manto M, Marvel C, Parker K, Pezzulo G, Ramnani N, Riva D, Schmahmann J, Vandervert L, Yamazaki T (2014): Consensus paper: The cerebellum's role in movement and cognition. Cerebellum 13:151–177. [DOI] [PMC free article] [PubMed] [Google Scholar]
- Landin‐Romero R, Canales‐Rodriguez EJ, Kumfor F, Moreno‐Alcazar A, Madre M, Maristany T, Pomarol‐Clotet E, Amann BL (2017): Surface‐based brain morphometry and diffusion tensor imaging in schizoaffective disorder. Aust N Z J Psychiatry 51:42–54. [DOI] [PubMed] [Google Scholar]
- Leonardi N, Richiardi J, Gschwind M, Simioni S, Annoni JM, Schluep M, Vuilleumier P, Van De Ville D (2013): Principal components of functional connectivity: A new approach to study dynamic brain connectivity during rest. NeuroImage 83:937–950. [DOI] [PubMed] [Google Scholar]
- Li X, Zhu D, Jiang X, Jin C, Zhang X, Guo L, Zhang J, Hu X, Li L, Liu T (2014): Dynamic functional connectomics signatures for characterization and differentiation of PTSD patients. Hum Brain Mapp 35:1761–1778. [DOI] [PMC free article] [PubMed] [Google Scholar]
- Lynall ME, Bassett DS, Kerwin R, McKenna PJ, Kitzbichler M, Muller U, Bullmore E (2010): Functional connectivity and brain networks in schizophrenia. J Neurosci 30:9477–9487. [DOI] [PMC free article] [PubMed] [Google Scholar]
- Ma S, Correa NM, Li XL, Eichele T, Calhoun VD, Adali T (2011): Automatic identification of functional clusters in FMRI data using spatial dependence. IEEE Trans Biomed Eng 58:3406–3417. [DOI] [PMC free article] [PubMed] [Google Scholar]
- Malaspina D, Owen MJ, Heckers S, Tandon R, Bustillo J, Schultz S, Barch DM, Gaebel W, Gur RE, Tsuang M, Van Os J, Carpenter W (2013): Schizoaffective Disorder in the DSM‐5. Schizophr Res 150:21–25. [DOI] [PubMed] [Google Scholar]
- Mathew I, Gardin TM, Tandon N, Eack S, Francis AN, Seidman LJ, Clementz B, Pearlson GD, Sweeney JA, Tamminga CA, Keshavan MS (2014): Medial temporal lobe structures and hippocampal subfields in psychotic disorders: Findings from the Bipolar‐Schizophrenia Network on Intermediate Phenotypes (B‐SNIP) study. JAMA Psychiatry 71:769–777. [DOI] [PubMed] [Google Scholar]
- Meda SA, Ruano G, Windemuth A, O'Neil K, Berwise C, Dunn SM, Boccaccio LE, Narayanan B, Kocherla M, Sprooten E, Keshavan MS, Tamminga CA, Sweeney JA, Clementz BA, Calhoun VD, Pearlson GD (2014): Multivariate analysis reveals genetic associations of the resting default mode network in psychotic bipolar disorder and schizophrenia. Proc Natl Acad Sci USA 111:6864–6864. [DOI] [PMC free article] [PubMed] [Google Scholar]
- Meda SA, Wang Z, Ivleva EI, Poudyal G, Keshavan MS, Tamminga CA, Sweeney JA, Clementz BA, Schretlen DJ, Calhoun VD, Lui S, Damaraju E, Pearlson GD (2015): Frequency‐specific neural signatures of spontaneous low‐frequency resting state fluctuations in psychosis: Evidence from Bipolar‐Schizophrenia Network on Intermediate Phenotypes (B‐SNIP) consortium. Schizophr Bull 41:1336–1348. [DOI] [PMC free article] [PubMed] [Google Scholar]
- Meda SA, Clementz BA, Sweeney JA, Keshavan MS, Tamminga CA, Ivleva EI, Pearlson GD (2016): Examining functional resting state connectivity in psychosis and its sub‐groups in the B‐SNIP cohort. Biol Psychiatry 1:488–497. [DOI] [PubMed] [Google Scholar]
- Miller RL, Yaesoubi M, Turner JA, Mathalon D, Preda A, Pearlson G, Adali T, Calhoun VD (2016): Higher dimensional meta‐state analysis reveals reduced resting fMRI connectivity dynamism in schizophrenia patients. PLoS One 11:e0149849. [DOI] [PMC free article] [PubMed] [Google Scholar]
- Murphy K, Birn RM, Handwerker DA, Jones TB, Bandettini PA (2009): The impact of global signal regression on resting state correlations: Are anti‐correlated networks introduced? NeuroImage 44:893–905. [DOI] [PMC free article] [PubMed] [Google Scholar]
- Pearlson GD (2015): Etiologic, phenomenologic, and endophenotypic overlap of schizophrenia and bipolar disorder. Annu Rev Clin Psychol 11:251–281. [DOI] [PubMed] [Google Scholar]
- Pearlson GD, Clementz BA, Sweeney JA, Keshavan MS, Tamminga CA (2016): Does biology transcend the symptom‐based boundaries of psychosis? Psychiatr Clin North Am 39:165–174. [DOI] [PMC free article] [PubMed] [Google Scholar]
- Ramnani N (2012): Frontal lobe and posterior parietal contributions to the cortico‐cerebellar system. Cerebellum 11:366–383. [DOI] [PubMed] [Google Scholar]
- Rashid B, Damaraju E, Pearlson GD, Calhoun VD (2014): Dynamic connectivity states estimated from resting fMRI Identify differences among Schizophrenia, bipolar disorder, and healthy control subjects. Front Hum Neurosci 8:897. [DOI] [PMC free article] [PubMed] [Google Scholar]
- Smith SM, Miller KL, Salimi‐Khorshidi G, Webster M, Beckmann CF, Nichols TE, Ramsey JD, Woolrich MW (2011): Network modelling methods for FMRI. NeuroImage 54:875–891. [DOI] [PubMed] [Google Scholar]
- Stoodley CJ (2012): The cerebellum and cognition: Evidence from functional imaging studies. Cerebellum 11:352–365. [DOI] [PubMed] [Google Scholar]
- Tamminga CA, Ivleva EI, Keshavan MS, Pearlson GD, Clementz BA, Witte B, Morris DW, Bishop J, Thaker GK, Sweeney JA (2013): Clinical phenotypes of psychosis in the Bipolar‐Schizophrenia Network on Intermediate Phenotypes (B‐SNIP). Am J Psychiatry 170:1263–1274. [DOI] [PubMed] [Google Scholar]
- Tang Y, Wang LF, Cao F, Tan LW (2012): Identify schizophrenia using resting‐state functional connectivity: An exploratory research and analysis. Biomed Eng Online 11:50. [DOI] [PMC free article] [PubMed] [Google Scholar]
- Thirion B, Varoquaux G, Dohmatob E, Poline JB (2014): Which fMRI clustering gives good brain parcellations? Front Neurosci 8:167. [DOI] [PMC free article] [PubMed] [Google Scholar]
- Tzourio‐Mazoyer N, Landeau B, Papathanassiou D, Crivello F, Etard O, Delcroix N, Mazoyer B, Joliot M (2002): Automated anatomical labeling of activations in SPM using a macroscopic anatomical parcellation of the MNI MRI single‐subject brain. NeuroImage 15:273–289. [DOI] [PubMed] [Google Scholar]
- van der Maaten L, Hinton G (2008): Visualizing data using t‐SNE. J Mach Learn Res 9:2579–2605. [Google Scholar]
- Van Dijk KRA, Hedden T, Venkataraman A, Evans KC, Lazar SW, Buckner RL (2010): Intrinsic functional connectivity as a tool for human connectomics: Theory, properties, and optimization. J Neurophysiol 103:297–321. [DOI] [PMC free article] [PubMed] [Google Scholar]
- Whitfield‐Gabrieli S, Thermenos HW, Milanovic S, Tsuang MT, Faraone SV, McCarley RW, Shenton ME, Green AI, Nieto‐Castanon A, LaViolette P, Wojcik J, Gabrieli JD, Seidman LJ (2009): Hyperactivity and hyperconnectivity of the default network in schizophrenia and in first‐degree relatives of persons with schizophrenia. Proc Natl Acad Sci USA 106:1279–1284. [DOI] [PMC free article] [PubMed] [Google Scholar]
- Xia M, Wang J, He Y (2013): BrainNet viewer: A network visualization tool for human brain connectomics. PLoS One 8:e68910. [DOI] [PMC free article] [PubMed] [Google Scholar]
- Yaesoubi M, Miller RL, Calhoun VD (2015): Mutually temporally independent connectivity patterns: A new framework to study the dynamics of brain connectivity at rest with application to explain group difference based on gender. NeuroImage 107:85–94. [DOI] [PMC free article] [PubMed] [Google Scholar]
- Yan CG, Zang YF (2010): DPARSF: A MATLAB toolbox for “Pipeline” data analysis of resting‐state fMRI. Front Syst Neurosci 4:13. [DOI] [PMC free article] [PubMed] [Google Scholar]
- Yu Q, Erhardt EB, Sui J, Du Y, He H, Hjelm D, Cetin MS, Rachakonda S, Miller RL, Pearlson G, Calhoun VD (2015): Assessing dynamic brain graphs of time‐varying connectivity in fMRI data: Application to healthy controls and patients with schizophrenia. NeuroImage 107:345–355. [DOI] [PMC free article] [PubMed] [Google Scholar]
- Zalesky A, Breakspear M (2015): Towards a statistical test for functional connectivity dynamics. NeuroImage 114:466–470. [DOI] [PubMed] [Google Scholar]
- Zalesky A, Fornito A, Cocchi L, Gollo LL, Breakspear M (2014): Time‐resolved resting‐state brain networks. Proc Natl Acad Sci USA 111:10341–10346. [DOI] [PMC free article] [PubMed] [Google Scholar]
- Zhou Y, Liang M, Tian L, Wang K, Hao Y, Liu H, Liu Z, Jiang T (2007): Functional disintegration in paranoid schizophrenia using resting‐state fMRI. Schizophr Res 97:194–205. [DOI] [PubMed] [Google Scholar]
- Zuo XN, Di Martino A, Kelly C, Shehzad ZE, Gee DG, Klein DF, Castellanos FX, Biswal BB, Milham MP (2010): The oscillating brain: Complex and reliable. NeuroImage 49:1432–1445. [DOI] [PMC free article] [PubMed] [Google Scholar]
Associated Data
This section collects any data citations, data availability statements, or supplementary materials included in this article.
Supplementary Materials
Supporting Information


