

Abstract
Introduction
Huntington's disease (HD) is a genetic neurodegenerative disorder that primarily affects striatal neurons. Striatal volume loss is present years before clinical diagnosis; however, white matter degradation may also occur prior to diagnosis. Diffusion‐weighted imaging (DWI) can measure microstructural changes associated with degeneration that precede macrostructural changes. DWI derived measures enhance understanding of degeneration in prodromal HD (pre‐HD).
Methods
As part of the PREDICT‐HD study, N = 191 pre‐HD individuals and 70 healthy controls underwent two or more (baseline and 1–5 year follow‐up) DWI, with n = 649 total sessions. Images were processed using cutting‐edge DWI analysis methods for large multicenter studies. Diffusion tensor imaging (DTI) metrics were computed in selected tracts connecting the primary motor, primary somato‐sensory, and premotor areas of the cortex with the subcortical caudate and putamen. Pre‐HD participants were divided into three CAG‐Age Product (CAP) score groups reflecting clinical diagnosis probability (low, medium, or high probabilities). Baseline and longitudinal group differences were examined using linear mixed models.
Results
Cross‐sectional and longitudinal differences in DTI measures were present in all three CAP groups compared with controls. The high CAP group was most affected.
Conclusions
This is the largest longitudinal DWI study of pre‐HD to date. Findings showed DTI differences, consistent with white matter degeneration, were present up to a decade before predicted HD diagnosis. Our findings indicate a unique role for disrupted connectivity between the premotor area and the putamen, which may be closely tied to the onset of motor symptoms in HD. Hum Brain Mapp 38:1460–1477, 2017. © 2017 Wiley Periodicals, Inc.
Keywords: Huntington disease, disease progression, prodromal, white matter, diffusion tractography, diffusion magnetic resonance imaging, multicenter study, image processing, computer‐assisted
INTRODUCTION
In contrast to other neurodegenerative diseases, such as Parkinson's or Alzheimer's, Huntington's Disease (HD) occurs as the result of a single known genetic mutation, which allows researchers to study individuals with the mutant Htt genotype prior to diagnosis (pre‐HD) [Long et al., 2011; Paulsen et al., 2001, 2006a, 2008; Tabrizi et al., 2009, 2011, 2012]. During the pre‐HD phase, individuals do not manifest the characteristic motor symptoms necessary for a diagnosis, but they have been shown to exhibit mild sub‐clinical cognitive, psychiatric and motor deficits [Ross et al., 2014]. Furthermore, imaging studies have shown that volume reductions in the striatum, particularly within the caudate, can be observed as many as 10 years before diagnosis in pre‐HD individuals [Bohanna et al., 2008; Harris et al., 1999; Thieben et al., 2002]. Volume reductions in the globus pallidus [Harris et al., 1999; Thieben et al., 2002] and thalamus [Harris et al., 1999; Paulsen et al., 2006b] have also been observed, but occur closer to diagnosis [Bohanna et al., 2008; Thieben et al., 2002]. It is less clear whether cortical thinning occurs in pre‐HD. While some studies have found decreased cortical thickness in pre‐HD [Bohanna et al., 2008; Nopoulos et al., 2007; Rosas et al., 2005], others have found increased grey matter volume [Aylward et al., 1996, 1998; Paulsen et al., 2006b]. The relatively large longitudinal TRACK‐HD study failed to find differences in cortical volumes at baseline and 12 months [Tabrizi et al., 2009, 2011] in pre‐HD, but did find reduced cortical thickness in occipital areas in pre‐HD individuals who were closest to diagnosis at 24 months [Tabrizi et al., 2012], suggesting that cortical thickness changes may not be tied to motor symptom onset or that they occur only as secondary collateral damage measurable late in the pre‐HD stage of the illness.
Substantial changes in cortical white matter are known to occur in pre‐HD individuals. Overall white matter has been shown to be reduced in the area surrounding the striatum [Tabrizi et al., 2009, 2011, 2012] and throughout the brain [Paulsen et al., 2006b]. Diffusion tensor imaging (DTI) studies have further provided evidence of white matter degeneration in terms of reduced fractional anisotropy (FA) and increased radial diffusivity (RD). Reduced FA has been observed in frontal white matter [Rosas et al., 2006; Phillips et al., 2013], surrounding the striatum [Magnotta et al., 2009; Rosas et al., 2006; Stoffers et al., 2010], the thalamus [Rosas et al., 2006; Stoffers et al., 2010], corpus callosum [Phillips et al., 2013; Stoffers et al., 2010], and in parietal and occipital white matter [Phillips et al., 2013]. Increased RD has been shown to accompany reduced FA in several of these regions including the corpus callosum [Phillips et al., 2013; Stoffers et al., 2010], frontal tracts [Phillips et al., 2014; Poudel et al., 2014], thalamic tracts [Phillips et al., 2014; Stoffers et al., 2010], and surrounding the striatum [Stoffers et al., 2010]. Likewise, increases in axial diffusivity (AD) have been observed in many of the same tracts [Phillips et al., 2014; Stoffers et al., 2010]. Taken together, these findings suggest that DTI differences between healthy controls and pre‐HD individuals reflect degeneration at the cellular level and impact white matter tract integrity. Furthermore, these changes may occur in the absence of volume changes within the tissue, suggesting that DTI measures may provide an earlier indicator of neurodegeneration than volume measurements.
Despite an accumulation of results showing cross‐sectional DTI white matter abnormalities in pre‐HD, longitudinal study findings have been inconsistent. Two studies failed to find abnormal 12‐ to 30‐month changes in DTI [Odish et al., 2015; Poudel et al., 2015] whereas one more recent finding showed DTI changes in 64 preHD over 2 years [Harrington et al., 2016]. The purpose of the current study was to examine cross‐sectional and longitudinal diffusion weighted imaging (DWI) in the largest sample of pre‐HD studied to date.
We assessed cortico‐striate connectivity using longitudinal DTI data collected as part of the multi‐site PREDICT‐HD study [Paulsen et al., 2014b]. Based on known changes in clinical presentations of sensory and motor symptoms, we expect that DTI indicators of WM degeneration including increased mean diffusivity (MD), decreased fractional anisotropy (FA), increased axial diffusivity (AD), and increased radial diffusivity (RD) will be present in tracts between sensory and motor regions of the cortex and the striatum in pre‐HD participants. We also expect that this degeneration will be most severe in participants who are closer to HD diagnosis (i.e., having a high probability of diagnosis). Finally, we predict that these changes will be progressive, with signs of degeneration becoming more pronounced in pre‐HD participants over time.
MATERIAL AND METHODS
Participants
Participants were a subset of the multi‐site PREDICT‐HD study [Paulsen et al., 2014b] data that included 191 individuals with pre‐manifest HD and 70 healthy controls. All participants were right handed and underwent at least two longitudinal imaging sessions, resulting in a total of 474 pre‐HD and 175 healthy control imaging sessions.
Additional demographic characteristics for this sample are shown in Table 1. Participants with pre‐HD were assigned into CAP score groups (low, medium, high) at study entry [Zhang et al., 2011]. The groups did not differ in terms of number of imaging sessions performed per participant, overall duration of time between imaging sessions, or education. Groups differed significantly with regards to both age and sex. Because age is used in the calculation of the CAP score, differences between the pre‐HD CAP groups were expected (CAP is not computed for controls). With regards to sex, the High CAP group imaging sessions had a higher proportion of males than did the other groups.
Table 1.
Demographic information
| Group | Total participants | CAP score | Total sessions | Participant sessions | Duration (years) | Age (years) | Sex | Education (years) | ||||||
|---|---|---|---|---|---|---|---|---|---|---|---|---|---|---|
| Mean | SD | Mean | SD | Mean | SD | Mean | SD | Male | Female | Mean | SD | |||
| Control | 70 | – | – | 175 | 2.5 | 0.61 | 1.49 | 1.39 | 47.97 | 12.13 | 49 | 126 | 15.1 | 2.56 |
| Low CAP | 50 | 91.98 | 50.01 | 121 | 2.42 | 0.7 | 1.39 | 1.43 | 36.26 | 8.84 | 33 | 88 | 14.36 | 2.32 |
| Med CAP | 56 | 271.56 | 64.18 | 144 | 2.57 | 0.81 | 1.46 | 1.5 | 44.06 | 10.76 | 29 | 115 | 14.54 | 2.18 |
| High CAP | 85 | 497.51 | 80.04 | 209 | 2.46 | 0.73 | 1.4 | 1.43 | 51.22 | 11.86 | 82 | 127 | 14.68 | 2.5 |
| All | 261 | – | – | 649 | 2.49 | 0.71 | 1.44 | 1.43 | 45.96 | 12.37 | 193 | 456 | 14.7 | 2.42 |
| Anova | F | P | F | P | F | P | ||||||||
| Group | 0.19 | 0.9 | 48.96 | <0.01* | 2.61 | 0.05 | ||||||||
| Post‐Hoc | Diff | P | Diff | P | Diff | P | X 2 | P | Diff | P | ||||
| Low CAP vs. HC | −0.08 | 0.93 | −0.1 | 0.93 | −11.71 | <0.01* | 0.03 | 0.86 | −0.74 | 0.05* | ||||
| Med CAP vs. HC | 0.07 | 0.94 | −0.03 | 1 | −3.91 | 0.01* | 4.41 | 0.04* | −0.56 | 0.17 | ||||
| High CAP vs. HC | −0.04 | 0.98 | −0.09 | 0.92 | 3.25 | 0.02* | 13.08 | <0.01* | −0.41 | 0.34 | ||||
| Med CAP vs. Low CAP | 0.15 | 0.69 | 0.07 | 0.98 | 7.8 | <0.01* | 3.69 | 0.05 | 0.18 | 0.93 | ||||
| High CAP vs. Low CAP | 0.04 | 0.99 | 0.01 | 1 | 14.96 | <0.01* | 15.08 | <0.01* | 0.33 | 0.63 | ||||
| High CAP vs. Med CAP | −0.11 | 0.8 | −0.06 | 0.98 | 7.16 | <0.01* | 47.38 | <0.01* | 0.15 | 0.95 | ||||
*P < 0.05.
PREDICT‐HD exclusion criteria included (a) sufficient motor signs for a motor diagnosis at study entry; (b) history of traumatic brain injury or other central nervous system injury or diseases; (c) pacemakers or metallic implants; (d) prescribed antipsychotic or phenothiazine‐derivative antiemetic medication in the past six months; and (e) clinical evidence of unstable medical or psychiatric illness.
CAP Score
The presence of the pathogenic form of the Htt gene was confirmed through genetic testing. The number of CAG repeats and subject age were used to calculate the CAG‐Age Product (CAP) score [Zhang et al., 2011] at study entry and for each imaging session using the formula CAP = Age0 × (CAG – 33.66), with Age0 indicating age in years at the time of the first diffusion‐weighted imaging (DWI) scan session (Participant may have entered PREDICT‐HD several years prior to this date). CAP score has been validated as a proxy for time‐to‐diagnosis in HD with larger scores indicating a higher probability of near‐future motor diagnosis [Zhang et al., 2011].
Consistent with previous PREDICT‐HD data analysis [Paulsen et al., 2013], the pre‐HD group was divided into three sub‐groups based on their CAP score calculated at the time of their first DWI session. The Low CAP group (CAP score < 287.16) consisted of 50 participants; the Medium CAP group (287.16 < CAP score < 367.12) included 56 participants; and the High CAP group (CAP score > 367.12) included 85 participants. Participants from the Low, Medium, and High CAP groups underwent a total of 121, 144, and 209 imaging sessions, respectively.
Imaging Parameters
A total of 649 T1 and T2‐weighted anatomical and diffusion‐weighted images were acquired on 3T scanners at 15 sites, representing 3 scanner manufacturers (GE, Phillips, and Siemens). Due to varying scanning site capabilities and support resource, a minimum set of criteria were specified for merging the DWI data sets from different sites was established: (1) Only DWI data sets with more than 28 quality approved gradients, (2) voxel volume was required to be less than 9.6 cubic mm with a maximum voxel length of 2.4mm, (3) All directional gradients needed to be within 2% of 1,000 for their B‐Value, and (4) anatomical coverage need to completely include all the tracts of interest. The most frequently used MRI acquisition parameters are provided in Table 2, and all scanner parameters are supplied as supplemental materials. After visual inspection of all images, we excluded 13 T2‐weighted MRI scans, resulting in 636 multimodal and 13 single modal inputs for structural MRI processing. Processed T2‐weighted images were then used along with DWI data in the diffusion analysis pipeline when available and the T1‐weighted images were used for the 13 sessions where the T2‐weighted images were not available.
Table 2.
Summary of the most representative used MRI parameters for each manufacturer
| Mode | Manufacturer | TR (ms) | TE (ms) | TI (ms) | Thickness (mm) | Acquisition matrix | Bandwidth (Hz/pixel) | Flip angle |
|---|---|---|---|---|---|---|---|---|
| T1 | GE | 6.5 | 2.8 | 400 | 1 | 256, 256, 216 | 244.1 | 12 |
| Philips | 7.7 | 3.5 | 1.1 | 220, 218, 164 | 241 | 8 | ||
| Siemens | 2,300 | 2.87 | 900 | 1.1 | 256, 256, 240 | 238 | 10 | |
| T2 | GE | 3,000 | 82.5 | 1.4 | 288, 288, 160 | 244.1 | 90 | |
| Philips | 2,500 | 183.6 | 1.1 | 220, 218, 164 | 583 | 90 | ||
| Siemens | 4,800 | 430 | 1.4 | 256, 250, 160 | 592 | 90 | ||
| DWI | GE | 17,000 | 87.2 | 2.4 | 128, 128 | 1,953.12 | 90 | |
| Philips | 9,679 | 92 | 2 | 128, 128 | 1,566.02 | 90 | ||
| Siemens | 12,000 | 92 | 2 | 128, 128 | 1,565 | 90 |
DWI was acquired with 32–237 directions. TR, repetition time; TE, echo time; TI, inversion time.
Image Processing
Structural and diffusion‐weighted MR images were processed using the BRAINSTools suite (https://github.com/BRAINSia/BRAINSTools.git) and ANTs packages [Avants et al., 2009]. An extensible processing pipeline was developed in Nipype [Gorgolewski et al., 2011] that utilizes high performance computing resources in order to achieve time‐efficient data processing and tractography analysis on large‐scale multicenter diffusion‐weighted images.
Structural MRI processing
Structural MR Images [T2‐weighted (T2‐w) and/or T1‐weighted (T1‐w) images] were utilized to fix susceptibility‐induced anatomical distortions in diffusion‐weighted imaging (DWI) data and provide precise anatomical labeling for DWI processing and analysis. All available structural modalities (T1‐ and when available T2‐weighted images) from each dataset were processed jointly to improve the robustness of the processing using complimentary information provided by multiple modalities. In the 13 cases where the T2 image was not available a T1‐only data processing was performed to identify anatomical brain regions. The T1‐only morphometric processing provided sufficient, albeit sub‐optimal, segmentations for the subsequent tracts of interest extraction method. First, structural MR data were spatially normalized to a common reference orientation defined by anterior commissure‐posterior commissure (AC‐PC) line and inter‐hemispheric fissure [Ghayoor et al., 2013; Lu and Johnson, 2010]. The images were then processed through an Expectation Maximization (EM) and a fuzzy k‐Nearest Neighbor (KNN) tissue classification that incorporates bias‐field correction, image registration, and tissue classification [Ghayoor et al., 2016; Kim and Johnson, 2013]. Whole brain segmentation (i.e., labeling) was performed on the bias‐field corrected T1‐w and T2‐w images using the Multi‐Atlas Label Fusion method [Kim et al., 2015]. The whole brain segmentation resulted in 180 independently labeled regions that are consistent with the FreeSurfer Atlas labeling scheme.
DWI processing
DWI processing leverages the results of structural MRI processing as illustrated in Supporting Information Figure S1. The DWI processing first employed the quality control (QC) procedures described in our previous works [Matsui, 2014; Oguz et al., 2014] to prepare DWI scans by removing slice‐wise and interlace artifacts as well as correcting for eddy‐current and motion artifacts. The QC'ed DWI scans were further processed to integrate susceptibility artifact correction using a non‐linear constrained registration in the phase‐encoding direction available from the ANTs packages [Avants et al., 2009]. The constrained registration only allows warping within the plane (i.e., within image slice) for the phase encoding direction, and is primarily used to improve anatomical alignment of the DWI to the morphometric scans.
Due to the wide range of available gradient directions and/or replicated gradient directions available from different sites, we treat each data set as a sparse sampling (or oversampling in the HARDI data sets). We used our compressed sensing algorithm [Michailovich et al., 2011] to reconstruct the DWI signal from the sparse set of measurements, acquired at all sites. Specifically, this methodology allowed us to construct a normalized data representation of canonical set of the same 81 gradient directions for each DWI image. This approach has been shown to improve measurements of multiple fiber orientations even from the few gradient directions acquired [Rathi et al., 2011].
DTI Tractography
A whole brain tractography was performed using a multi‐fiber model to improve sensitivity in anatomical regions of crossing fibers. The two‐tensor unscented Kalman filter tractography (UKFt) method was employed with free‐water elimination to address partial volume effects near ventricles or cortex [Baumgartner et al., 2012; Malcolm et al., 2010]. UKFt parameter settings were determined via empirical testing on a subset of the dataset. In order to maximize sensitivity to the cortico‐striate connections, the fractional anisotropy and generalized anisotropy thresholds for seeding/stopping tractography were set to 0.06, and 10 tractography seeds were initiated per voxel.
Reliability of DWI data is extremely important for studies that depend upon the collaboration of multiple imaging sites. All tractography results (for all subjects) underwent a quality check using the White Matter Analysis [O'Donnell and Westin, 2007] quality control tool, which enables rapid visual inspections of tractography results by human experts. All tractography results were validated by examining features in the arcuate fasciculus, uncinate fasciculus, inferior longitudinal fasciculus, cingulum, corpus callosum, corona radiata, and brain stem. Supporting Information Figure S2 shows example sagittal views for (a) correct and (b) incorrect tractography. Sessions that failed this check were excluded.
Cortico‐striatal tracts were defined using the White Matter Query Language (WMQL) [Wassermann et al., 2013, 2016] using per‐participant whole‐brain segmentation and tractography results. The morphometric whole‐brain segmentations provide anatomically relevant regions of interest, the whole‐brain tractography provides global white matter tract information, and the WMQL provides an extensible user‐friendly tool for the automated dissection of human white matter. Tracts were created for each hemisphere between cortex regions including primary motor cortex (precentral gyrus), primary somatosensory cortex (postcentral gyrus), and premotor area (posterior middle frontal gyrus and opercular region of inferior frontal gyrus); and striatal regions including the caudate and putamen, resulting in a total of 6 tracts for each hemisphere (primary motor‐caudate; primary sensory‐caudate; premotor‐caudate; primary motor‐putamen; primary sensory‐putamen; and premotor‐putamen). These tracts are shown in Figure 1. Under the assumption that the biological tract of interest is composed primarily of non‐crossing fibers, rotationally invariant measures within a given tract were computed only from the primary tensor of the 2‐Tensor model. For the remainder of this manuscript MD, FA, AD, and RD measures are computed from the primary tensor (i.e., the tensor along the tract) of the 2‐tensor model within each tract.
Figure 1.
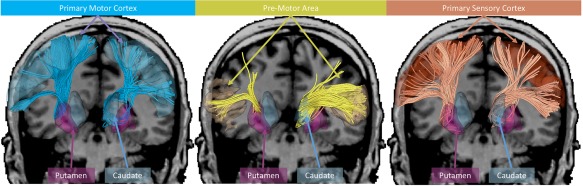
Tracts of interest shown with connections to: the primary motor cortex (blue), pre‐motor area (yellow), and primary sensory cortex (red). The tracts with putamen (left) and caudate (right) termination are presented for each cortex region of interest. Tractography visualization was performed in 3D Slicer using SlicerDMRI.
Statistical Analysis
Differences in mean baseline level (intercept) and mean rate of longitudinal change (slope) between CAP groups were analyzed using linear mixed models (LMMs) for longitudinal data [Verbeke and Molenberghs, 2000]. Two models, a full model with CAP group‐specific intercepts and slopes, and a reduced model that did not have CAP group‐specific effects (i.e., the same slope and intercept was shared amongst the groups) were fit for each outcome variable (tract of interest/DTI measure). These two models were compared via a likelihood ratio test (LRT) to address the omnibus null hypothesis of no group differences in intercepts or slopes. Measurements from tract‐DTI measure pairings where these two models did not differ were excluded from the results.
Both models included a time metric measured as years in the study (0 = study entry) and additional covariates of sex, years of education, and modality of the scan. In order to account for correlation due to repeated measurements of the same participants, random intercepts were included for each participant in the model. Furthermore, random site intercepts were included to account for correlation due to a common scanner or other common site‐specific features. Maximum likelihood methods were used for estimation under normality assumptions for the random effects and random error [Verbeke and Molenberghs, 2000]. LMMs provide unbiased estimates for the parameters of interest with missing data, provided the missing data mechanism is at least missing at random (MAR).
Baseline (intercept) and longitudinal (slope) contrasts between CAP groups were performed using general linear hypothesis testing.
Stacked analysis
In order to compare the longitudinal relationship between DTI measures and CAP group with the longitudinal relationship between striatal volume and CAP group (i.e., examining two outcomes simultaneously), we performed a second “stacked” regression analysis. Simultaneous analysis of scalar DTI and brain structural volume measurements allows the direct statistical comparison of the baseline and longitudinal values of the outcome variables by group. For example, we might examine if MD and putamen volumes deteriorate at the same absolute rate (but in different directions) in the High CAP group, but at different absolute rates in the Low CAP group.
The stacked analysis was performed for tracts where DTI differences between CAP groups were present in the first analysis. In order to analyze two outcome variables simultaneously, the outcome measures and corresponding covariate data were converted to stacked format, as discussed by Long [2011, chap. 13]. For instance, in the above example, each subject's vector of repeated MD measurements was concatenated with their vector of repeated putamen volume measurements. The same was done for the covariate matrices (design matrices), with the same covariates included in the matrices as the first analysis. Dummy variables were constructed to code for each outcome and corresponding covariates, which allows for the simultaneous estimation of baseline and longitudinal values for the two outcomes (in the above example, MD and putamen). The main advantage is that the covariance among the outcome baseline value and the outcome longitudinal value can be estimated allowing for direct statistical comparisons (e.g., a confidence interval can be computed for the difference between the MD slope and the putamen slope).
Similar to the first analyses, CAP group coding was included in the covariate matrix to examine potential group differences. The so‐called stacked LMM described above includes random effects for subject baseline values and sites of each outcome, and the random effects are assumed to have a joint‐normal distribution with a general covariance matrix. To account for different scales of the outcomes, the separate outcome vectors were standardized by subtracting the mean of the vector (computed among participants and times), and dividing by the standard deviation of the vector. The scaling was performed prior to concatenating, so that comparisons across domains were more meaningful, not being affected by the magnitude of the measurement scales (additional details of the stacked LMM can be found in the Supporting Information).
Furthermore, in order to ensure that the average trajectories of the two outcome measures in the more progressed groups (e.g., the High CAP group) were comparable, the values for MD, AD, and RD measures were multiplied by −1 when necessary. The result is that the average DTI and brain volume longitudinal changes in the High CAP group have a negative value, allowing direct comparison of differences in magnitude for longitudinal decline and baseline values by outcome within the same CAP group, while still accurately estimating parameters denoting CAP group‐specific slope and CAP group‐specific intercept within domain.
RESULTS
Regression Analysis Comparing DTI Measures with CAP Group
The relationship between each DTI measure (MD, FA, AD, RD) and CAP group (healthy control, low, medium, and high) was assessed using LMM. Here we report the results only for tracts and measures where the full model significantly differed from the null model.
Baseline (intercept) differences in DTI measures
Group differences in baseline values are reported in Table 3 and are shown in Figure 2a. These results reflect baseline differences between groups for each measure.
Table 3.
Baseline (intercept) differences in DTI measures between CAP groups
| Right M1‐C | Left PMA‐C | Right PMA‐C | Left M1‐P | Right M1‐P | Left PMA‐P | Right PMA‐P | Left S1‐P | Right S1‐P | ||||||||||
|---|---|---|---|---|---|---|---|---|---|---|---|---|---|---|---|---|---|---|
| t | P | t | P | t | P | t | P | t | P | t | P | t | P | t | P | t | P | |
| Mean MD | ||||||||||||||||||
| Low vs. Control | −0.83 | 0.41 | −0.97 | 0.33 | 0.69 | 0.49 | 0.54 | 0.59 | −0.16 | 0.87 | 1.08 | 0.28 | 0.62 | 0.53 | 0.23 | 0.82 | ||
| Med vs. Control | 1.46 | 0.14 | 0.91 | 0.37 | 1.65 | 0.1 | 2.42 | 0.02* | 1.7 | 0.09 | 0.6 | 0.55 | 1.4 | 0.16 | 2.62 | 0.01** | ||
| High vs. Control | 2.68 | 0.01** | 2.29 | 0.02* | 3.6 | 0.01** | 3.35 | 0.01** | 3.81 | 0.01** | 3.34 | 0.01** | 3.72 | 0.01** | 4.24 | 0.01** | ||
| Med vs. Low | 2.15 | 0.03* | 1.78 | 0.08 | 0.87 | 0.39 | 1.73 | 0.08 | 1.73 | 0.08 | −0.49 | 0.63 | 0.7 | 0.48 | 2.22 | 0.03* | ||
| High vs. Low | 3.36 | 0.01** | 3.15 | 0.01** | 2.62 | 0.01** | 2.55 | 0.01* | 3.71 | 0.01** | 1.99 | 0.05* | 2.81 | 0.01** | 3.71 | 0.01** | ||
| High vs. Med | 1.03 | 0.3 | 1.24 | 0.21 | 1.7 | 0.09 | 0.66 | 0.51 | 1.84 | 0.07 | 2.59 | 0.01** | 2.08 | 0.04* | 1.3 | 0.19 | ||
| Mean FA | ||||||||||||||||||
| Low vs. Control | 0.39 | 0.7 | 0.77 | 0.44 | 1.44 | 0.15 | −1.06 | 0.29 | −0.09 | 0.93 | ||||||||
| Med vs. Control | −0.78 | 0.44 | −2 | 0.05* | −1.34 | 0.18 | −1.86 | 0.06 | −0.98 | 0.33 | ||||||||
| High vs. Control | −1.93 | 0.05 | −4.08 | 0.01** | −2.26 | 0.02* | −2.66 | 0.01** | −1.63 | 0.1 | ||||||||
| Med vs. Low | −1.1 | 0.27 | −2.58 | 0.01** | −2.62 | 0.01** | −0.72 | 0.47 | −0.83 | 0.41 | ||||||||
| High vs. Low | −2.2 | 0.03* | −4.49 | 0.01** | −3.56 | 0.01** | −1.34 | 0.18 | −1.41 | 0.16 | ||||||||
| High vs. Med | −1.02 | 0.31 | −1.74 | 0.08 | −0.73 | 0.46 | −0.57 | 0.57 | −0.52 | 0.61 | ||||||||
| Mean AD | ||||||||||||||||||
| Low vs. Control | −1.16 | 0.25 | −1.55 | 0.12 | −1.25 | 0.21 | 0.97 | 0.33 | −0.56 | 0.57 | −0.07 | 0.94 | ||||||
| Med vs. Control | 0.83 | 0.41 | 0.3 | 0.76 | 0.19 | 0.85 | −0.28 | 0.78 | 1.08 | 0.28 | 1.79 | 0.07 | ||||||
| High vs. Control | 0.67 | 0.51 | 1.53 | 0.13 | 1.69 | 0.09 | 2.11 | 0.03* | 1.31 | 0.19 | 2.42 | 0.02* | ||||||
| Med vs. Low | 1.89 | 0.06 | 1.78 | 0.08 | 1.38 | 0.17 | −1.21 | 0.23 | 1.55 | 0.12 | 1.73 | 0.08 | ||||||
| High vs. Low | 1.85 | 0.06 | 3.07 | 0.01** | 2.89 | 0.01** | 0.95 | 0.34 | 1.82 | 0.07 | 2.33 | 0.02* | ||||||
| High vs. Med | −0.23 | 0.82 | 1.14 | 0.26 | 1.4 | 0.16 | 2.34 | 0.02* | 0.12 | 0.9 | 0.44 | 0.66 | ||||||
| Mean RD | ||||||||||||||||||
| Low vs. Control | −0.97 | 0.33 | −1.26 | 0.21 | 1.26 | 0.21 | 0.42 | 0.67 | 0.78 | 0.44 | 0.93 | 0.35 | 0.24 | 0.81 | ||||
| Med vs. Control | 1.75 | 0.08 | 1.28 | 0.2 | 1.36 | 0.17 | 2.01 | 0.04* | 0.88 | 0.38 | 1 | 0.32 | 1.91 | 0.06 | ||||
| High vs. Control | 3.54 | 0.01** | 2.68 | 0.01** | 3.42 | 0.01** | 3.73 | 0.01** | 2.94 | 0.01** | 3.43 | 0.01** | 3.28 | 0.01** | ||||
| Med vs. Low | 2.55 | 0.01* | 2.41 | 0.02* | 0.05 | 0.96 | 1.46 | 0.14 | 0.08 | 0.94 | 0.03 | 0.97 | 1.55 | 0.12 | ||||
| High vs. Low | 4.27 | 0.01** | 3.82 | 0.01** | 1.85 | 0.06 | 3.02 | 0.01** | 1.92 | 0.05 | 2.21 | 0.03* | 2.8 | 0.01** | ||||
| High vs. Med | 1.53 | 0.13 | 1.23 | 0.22 | 1.84 | 0.07 | 1.44 | 0.15 | 1.88 | 0.06 | 2.22 | 0.03* | 1.12 | 0.26 | ||||
* P < 0.05, ** P < 0.01.
C, caudate; P, putamen; PMA, premotor area; M1, primary motor cortex; S1, primary somatosensory cortex.
Figure 2.
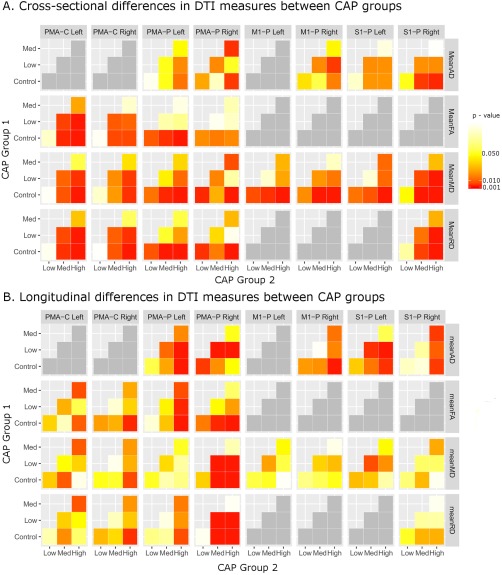
Matrix showing cross‐sectional (A) and longitudinal (B) differences in DTI measures for each tract and DTI measure illustrating contrasts between pairs of CAP groups. Significant contrasts are shown in dark red‐orange (P < 0.05) or red (P < 0.01). PMA: Premotor area, M1: Primary Motor Cortex, S1: Sensory Cortex, P: Putamen, C: Caudate.
Primary Motor‐Caudate: The High CAP group had significantly lower mean FA compared with the Low CAP group in the right primary motor cortex‐caudate tract. There were no other significant differences in the motor‐caudate tracts.
Premotor‐Caudate: The High CAP group had significantly higher MD, lower FA, and higher RD compared with the healthy control and Low CAP groups in both left and right premotor‐caudate tracts. Similarly, the Medium CAP group had significantly higher MD than the Low CAP group and lower FA than the healthy control group in the left premotor‐caudate tract as well as lower FA and higher RD than the Low CAP group in both left and right premotor‐caudate tracts.
Primary Motor‐Putamen: The High CAP group had significantly higher MD than the control and Low CAP group in both left and right primary motor‐putamen tracts. Similarly, the High CAP group had higher AD than the Low CAP group in the right primary motor‐putamen tract and higher RD than healthy controls in the left primary motor‐putamen tract.
Premotor‐Putamen: The High CAP group showed significantly greater MD than healthy controls and the Low CAP group in bilateral premotor‐putamen tracts as well as greater MD than the Medium CAP group on the right. Lower FA was only present in the High CAP group compared with healthy controls on the left, while higher AD was found in the High CAP group compared with healthy controls and the Medium CAP group on the right and in the High CAP group compared with the Low CAP group on the left. Increased RD was present in the High CAP group bilaterally compared with healthy controls and in the Medium CAP group compared with healthy controls and the High CAP group compared with the Low CAP group in the left premotor‐putamen tract.
Sensory‐Putamen: MD was significantly higher in the High CAP group compared with the healthy control group and to the Low CAP group in bilateral sensory‐putamen tracts. The High CAP group also had higher MD than the Medium CAP group in the left sensory‐putamen tract while the Medium group had higher MD than healthy controls and the Low CAP group in the right sensory‐putamen tract. The High CAP group also showed higher AD than healthy controls and the Low CAP group in the right sensory‐putamen cortex and higher RD than the healthy control group and Low CAP group in bilateral sensory‐putamen tracts and higher RD than the Medium CAP group in the left sensory‐putamen tract.
Longitudinal (slope) differences in DTI measures
Group differences in longitudinal values (i.e., slopes), or change over time are reported in Table 4 and are shown in Figure 2b. These results reflect differences in change over time between groups for each measure.
Table 4.
Longitudinal (slope) differences in DTI measures between CAP groups
| Right M1‐C | Left PMA‐C | Right PMA‐C | Left M1‐P | Right M1‐P | Left PMA‐P | Right PMA‐P | Left S1‐P | Right S1‐P | ||||||||||
|---|---|---|---|---|---|---|---|---|---|---|---|---|---|---|---|---|---|---|
| t | P | t | P | t | P | t | P | t | P | t | P | t | P | t | P | t | P | |
| Mean MD | ||||||||||||||||||
| Low vs. Control | −0.92 | 0.36 | 0.64 | 0.52 | −0.59 | 0.55 | −0.4 | 0.69 | −0.65 | 0.52 | −0.92 | 0.36 | −1 | 0.32 | −0.44 | 0.66 | ||
| Med vs. Control | −1.74 | 0.08 | 0.6 | 0.55 | 0.64 | 0.52 | 0.52 | 0.6 | 0.24 | 0.81 | 2.97 | 0.01** | 0.91 | 0.36 | −1.02 | 0.31 | ||
| High vs. Control | −0.05 | 0.96 | 1.95 | 0.05 | 0 | 1 | 0.67 | 0.5 | −0.38 | 0.71 | 2.98 | 0.01** | 0.3 | 0.77 | 0.06 | 0.95 | ||
| Med vs. Low | −0.68 | 0.49 | −0.06 | 0.95 | 1.15 | 0.25 | 0.86 | 0.39 | 0.84 | 0.4 | 3.63 | 0.01** | 1.79 | 0.07 | −0.49 | 0.62 | ||
| High vs. Low | 0.9 | 0.37 | 1.11 | 0.27 | 0.61 | 0.54 | 1.01 | 0.31 | 0.33 | 0.74 | 3.65 | 0.01** | 1.29 | 0.2 | 0.51 | 0.61 | ||
| High vs. Med | 1.75 | 0.08 | 1.25 | 0.21 | −0.66 | 0.51 | 0.11 | 0.92 | −0.61 | 0.54 | −0.19 | 0.85 | −0.66 | 0.51 | 1.12 | 0.26 | ||
| Mean FA | ||||||||||||||||||
| Low vs. Control | 0.42 | 0.67 | −0.86 | 0.39 | −1.14 | 0.25 | 0.15 | 0.88 | −1.39 | |||||||||
| Med vs. Control | 0.2 | 0.84 | 0.26 | 0.79 | −1 | 0.32 | 0.96 | 0.34 | −2.23 | |||||||||
| High vs. Control | −1.17 | 0.24 | −1.65 | 0.1 | −2.33 | 0.02* | 2.87 | 0.01** | −2.91 | |||||||||
| Med vs. Low | −0.23 | 0.82 | 1.07 | 0.29 | 0.18 | 0.85 | 0.72 | 0.47 | −0.68 | |||||||||
| High vs. Low | −1.48 | 0.14 | −0.59 | 0.55 | −0.95 | 0.34 | 2.4 | 0.02* | −1.2 | |||||||||
| High vs. Med | −1.33 | 0.18 | −1.85 | 0.06 | −1.21 | 0.23 | 1.76 | 0.08 | −0.52 | |||||||||
| Mean AD | 0.42 | 0.67 | −0.86 | 0.39 | −1.14 | 0.25 | 0.15 | 0.88 | −1.39 | |||||||||
| Low vs. Control | 0.5 | 0.62 | 1.19 | 0.23 | −0.58 | 0.56 | −2.07 | 0.04* | −0.92 | 0.36 | 0.18 | 0.86 | ||||||
| Med vs. Control | 1.25 | 0.21 | 1.23 | 0.22 | 1.11 | 0.27 | 1.25 | 0.21 | 1.44 | 0.15 | −0.15 | 0.88 | ||||||
| High vs. Control | 2.18 | 0.03* | 2.91 | 0.01** | 2.62 | 0.01** | 0.68 | 0.5 | 2.14 | 0.03* | 2.06 | 0.04* | ||||||
| Med vs. Low | 0.65 | 0.52 | −0.04 | 0.97 | 1.56 | 0.12 | 3.19 | 0.01** | 2.19 | 0.03* | −0.31 | 0.75 | ||||||
| High vs. Low | 1.43 | 0.15 | 1.37 | 0.17 | 2.92 | 0.01** | 2.78 | 0.01** | 2.86 | 0.01** | 1.65 | 0.1 | ||||||
| High vs. Med | 0.79 | 0.43 | 1.52 | 0.13 | 1.36 | 0.17 | −0.65 | 0.52 | 0.57 | 0.57 | 2.13 | 0.03* | ||||||
| Mean RD | ||||||||||||||||||
| Low vs. Control | −0.29 | 0.77 | 0.98 | 0.33 | −0.87 | 0.38 | −0.4 | 0.69 | 0.03 | 0.98 | −0.62 | 0.53 | −0.64 | 0.52 | ||||
| Med vs. Control | −1.31 | 0.19 | 0.8 | 0.43 | 0.08 | 0.94 | −0.34 | 0.73 | 3.03 | 0.01** | 0.27 | 0.79 | −1.03 | 0.3 | ||||
| High vs. Control | 0.49 | 0.62 | 2.22 | 0.03* | −0.99 | 0.32 | −1.82 | 0.07 | 3.33 | 0.01** | −0.81 | 0.42 | −1.06 | 0.29 | ||||
| Med vs. Low | −0.91 | 0.36 | −0.22 | 0.83 | 0.92 | 0.36 | 0.08 | 0.93 | 2.74 | 0.01** | 0.85 | 0.4 | −0.31 | 0.75 | ||||
| High vs. Low | 0.73 | 0.46 | 1.01 | 0.31 | 0.02 | 0.99 | −1.2 | 0.23 | 2.99 | 0.01** | −0.08 | 0.93 | −0.29 | 0.77 | ||||
| High vs. Med | 1.82 | 0.07 | 1.31 | 0.19 | −1.03 | 0.3 | −1.39 | 0.17 | 0.1 | 0.92 | −1.06 | 0.29 | 0.05 | 0.96 | ||||
* P < 0.05, ** P < 0.01
C, caudate; P, putamen; PMA, premotor area; M1, primary motor cortex; S1, primary somatosensory cortex.
Premotor‐Caudate: The High CAP group had a significantly faster decrease in FA and significantly faster increase RD compared with the healthy control group in the right premotor‐caudate tract.
Primary Motor‐Putamen: The High CAP group had a significantly faster increase in AD compared with healthy controls in bilateral primary motor‐putamen tracts.
Premotor‐Putamen: Significantly faster increases in MD and RD were present in the right premotor‐putamen tract in both the Medium and High CAP groups compared with the healthy control and Low CAP groups. The High CAP group showed a significantly faster increase in FA in the left premotor‐putamen tract compared with healthy controls and the Low CAP group, while both the Medium and High CAP groups showed a significantly faster decrease in FA compared with healthy controls in the right premotor‐putamen tract. A significantly faster increase in AD was present in the High CAP group compared with the Low CAP group bilaterally, in the High CAP group compared with healthy controls on the left, and in the Medium CAP group compared with the Low CAP group on the right. A significantly faster decrease in AD was present in the Low CAP group compared with healthy controls in the right premotor‐putamen tract.
Sensory‐Putamen: A significantly faster increase in AD was present in the High CAP group compared with healthy controls bilaterally, in both the High and Medium CAP groups compared with the Low group on the left, and in the High CAP group compared with the Medium CAP group on the right.
Stacked Regression Analysis for Comparing DTI Measures with Striatal Volume
Baseline (intercept) differences between DTI measures and striatal volume
We first consider baseline differences among pairs of outcome variables (DTI measure, striatal volume) by group (controls, low, medium, and high). The results of comparisons between the baseline values for these pairs of measures are shown in Table 5.
Table 5.
Baseline (intercept) differences between DTI measures and striatal volume for each CAP group
| Right M1‐C | Left PMA‐C | Right PMA‐C | Left M1‐P | Right M1‐P | Left PMA‐P | Right PMA‐P | Left S1‐P | Right S1‐P | ||||||||||
|---|---|---|---|---|---|---|---|---|---|---|---|---|---|---|---|---|---|---|
| t | P | t | P | t | P | t | P | t | P | t | P | t | P | t | P | t | P | |
| Mean MD | 0.24 | 0.81 | 0.62 | 0.54 | −0.48 | 0.63 | 0.01 | 0.99 | −1.09 | 0.27 | 0.15 | 0.88 | −0.67 | 0.5 | −1.27 | 0.2 | ||
| Control | −0.26 | 0.8 | −0.5 | 0.61 | −1.43 | 0.15 | −0.98 | 0.33 | −2.02 | 0.04* | −0.41 | 0.68 | −1.3 | 0.19 | −1.79 | 0.07 | ||
| Low CAP | −0.79 | 0.43 | −1.09 | 0.28 | −3.63 | 0.01** | −2.84 | 0.01** | −3.89 | 0.01** | −3.31 | 0.01** | −3.61 | 0.01** | −3.43 | 0.01** | ||
| Med CAP | −3.49 | 0.01** | −3.28 | 0.01** | −5.11 | 0.01** | −3.89 | 0.01** | −5.44 | 0.01** | −4.45 | 0.01** | −5.25 | 0.01** | −5.24 | 0.01** | ||
| High CAP | −1 | 0.32 | −1.12 | 0.26 | −4.29 | 0.01** | −3.59 | 0.01** | −3.7 | 0.01** | −5.48 | 0.01** | −4.46 | 0.01** | −3.16 | 0.01** | ||
| Med vs. Low | −5.91 | 0.01** | −5.14 | 0.01** | −6.96 | 0.01** | −5.44 | 0.01** | −6.53 | 0.01** | −7.45 | 0.01** | −7.39 | 0.01** | −6.39 | 0.01** | ||
| High vs. Low | −4.86 | 0.01** | −3.96 | 0.01** | −2.7 | 0.01* | −1.88 | 0.06 | −2.86 | 0.01** | −2.01 | 0.04* | −2.95 | 0.01** | −3.23 | 0.01** | ||
| High vs. Med | ||||||||||||||||||
| Mean FA | −1.24 | 0.21 | 0.02 | 0.98 | −0.04 | 0.97 | −1.53 | 0.13 | 0.26 | 0.8 | ||||||||
| Control | −2.42 | 0.02* | −0.4 | 0.69 | −1.16 | 0.25 | −1.77 | 0.08 | −0.46 | 0.65 | ||||||||
| Low CAP | −2.86 | 0.01** | −0.78 | 0.44 | −1.22 | 0.22 | −4.03 | 0.01** | −2.64 | 0.01* | ||||||||
| Med CAP | −5.55 | 0.01** | −3.39 | 0.01** | −4.13 | 0.01** | −6.28 | 0.01** | −5.1 | 0.01** | ||||||||
| High CAP | −0.87 | 0.38 | −0.73 | 0.46 | −0.15 | 0.88 | −4.4 | 0.01** | −4.09 | 0.01** | ||||||||
| Med vs. Low | −5.78 | 0.01** | −5.55 | 0.01** | −5.52 | 0.01** | −8.51 | 0.01** | −8.47 | 0.01** | ||||||||
| High vs. Low | −4.82 | 0.01** | −4.74 | 0.01** | −5.25 | 0.01** | −4.13 | 0.01** | −4.34 | 0.01** | ||||||||
| High vs. Med | ||||||||||||||||||
| Mean AD | −0.07 | 0.94 | −0.58 | 0.56 | 0.55 | 0.58 | 0.26 | 0.79 | −0.43 | 0.67 | −0.6 | 0.55 | ||||||
| Control | −1 | 0.32 | −1.47 | 0.14 | −0.45 | 0.65 | 0.03 | 0.97 | −0.92 | 0.36 | −0.78 | 0.44 | ||||||
| Low CAP | −2.91 | 0.01** | −3.41 | 0.01** | −2.23 | 0.03* | −2.9 | 0.01** | −3.07 | 0.01** | −2.62 | 0.01* | ||||||
| Med CAP | −5.59 | 0.01** | −5.22 | 0.01** | −4.25 | 0.01** | −4.42 | 0.01** | −4.97 | 0.01** | −4.37 | 0.01** | ||||||
| High CAP | −3.75 | 0.01** | −3.77 | 0.01** | −3.52 | 0.01** | −5.56 | 0.01** | −4.17 | 0.01** | −3.54 | 0.01** | ||||||
| Med vs. Low | −8.78 | 0.01** | −7.05 | 0.01** | −7.3 | 0.01** | −8.24 | 0.01** | −7.63 | 0.01** | −6.71 | 0.01** | ||||||
| High vs. Low | −5.01 | 0.01** | −3.29 | 0.01** | −3.78 | 0.01** | −2.71 | 0.01* | −3.47 | 0.01** | −3.18 | 0.01** | ||||||
| High vs. Med | ||||||||||||||||||
| Mean RD | 0.16 | 0.87 | 0.4 | 0.69 | −0.24 | 0.81 | −1.48 | 0.14 | 0.22 | 0.82 | −0.21 | 0.83 | −0.86 | 0.39 | ||||
| Control | −0.34 | 0.73 | −0.87 | 0.39 | −1 | 0.32 | −2.22 | 0.03* | −0.47 | 0.64 | −0.85 | 0.4 | −1.55 | 0.12 | ||||
| Low CAP | −0.63 | 0.53 | −1.05 | 0.3 | −3.46 | 0.01** | −4.23 | 0.01** | −3.19 | 0.01** | −3.29 | 0.01** | −3.4 | 0.01** | ||||
| Med CAP | −3.31 | 0.01** | −3.45 | 0.01** | −4.87 | 0.01** | −5.92 | 0.01** | −4.64 | 0.01** | −5.39 | 0.01** | −5.75 | 0.01** | ||||
| High CAP | −0.55 | 0.58 | −0.36 | 0.72 | −4.67 | 0.01** | −3.94 | 0.01** | −5.09 | 0.01** | −4.59 | 0.01** | −3.49 | 0.01** | ||||
| Med vs. Low | −5.46 | 0.01** | −4.79 | 0.01** | −7.14 | 0.01** | −6.99 | 0.01** | −7.61 | 0.01** | −8.27 | 0.01** | −7.64 | 0.01** | ||||
| High vs. Low | −4.83 | 0.01** | −4.34 | 0.01** | −2.51 | 0.01* | −3.07 | 0.01** | −2.54 | 0.01* | −3.69 | 0.01** | −4.14 | 0.01** | ||||
| High vs. Med | 0.24 | 0.81 | 0.62 | 0.54 | −0.48 | 0.63 | 0.01 | 0.99 | −1.09 | 0.27 | 0.15 | 0.88 | −0.67 | 0.5 | −1.27 | 0.2 | ||
* P < 0.05, ** P < 0.01.
C, caudate; P, putamen; PMA, premotor area; M1, primary motor cortex; S1, primary somatosensory cortex.
Healthy Controls: There were no significant differences in the baseline values between the DTI measures and striatal volume for the healthy control group.
Low CAP: In the Low CAP group, the baseline value for FA in the right primary motor‐caudate and baseline value for RD in the left premotor‐putamen tracts were significantly lower than the baseline value for striatal volume.
Medium CAP: Within the Medium CAP group, the baseline values for MD was significantly lower than baseline striatal volume in bilateral premotor‐caudate, bilateral primary motor‐putamen, bilateral premotor‐putamen, and bilateral sensory‐putamen tracts; for FA in right primary motor‐caudate, bilateral premotor‐caudate, and bilateral premotor‐putamen tracts; for AD in bilateral primary motor‐putamen, bilateral premotor‐putamen, and bilateral sensory‐putamen tracts; and for RD in bilateral premotor‐caudate, left primary motor‐putamen, bilateral premotor‐putamen, and bilateral sensory‐putamen tracts.
The difference between these measures was wider in the Medium CAP group than the Low CAP group for MD and AD in bilateral primary motor‐putamen, bilateral premotor‐putamen, and bilateral sensory‐putamen tracts; for FA in bilateral premotor‐putamen tracts; and for RD in bilateral premotor‐caudate, left primary motor‐putamen, bilateral premotor‐putamen, and bilateral sensory‐putamen tracts.
High CAP: Within the High CAP group, the baselines values for MD was significantly lower than the baseline striatal volume in bilateral premotor‐caudate, left primary motor‐putamen, bilateral premotor‐putamen, and bilateral sensory putamen tracts; for FA in right primary motor‐caudate, bilateral premotor‐caudate, and bilateral premotor‐putamen tracts; for AD in bilateral primary motor‐putamen, bilateral premotor‐putamen, and bilateral sensory‐putamen tracts; and for RD in bilateral premotor‐caudate, left primary motor‐putamen, bilateral premotor‐putamen, and bilateral sensory‐putamen tracts. The difference between these measures was wider in the High CAP group than the Low CAP group for MD in bilateral premotor‐caudate, primary motor‐putamen, premotor‐putamen, and bilateral sensory‐putamen tracts; for FA in right primary motor‐caudate, bilateral premotor‐caudate, and bilateral premotor‐putamen tracts; for AD in bilateral primary motor‐putamen, bilateral premotor‐putamen, and bilateral sensory‐putamen tracts; and for RD in bilateral premotor‐caudate, left primary motor‐putamen, bilateral premotor‐putamen, and bilateral sensory‐putamen tracts.
There was also a wider difference between the baseline values for DTI measures and striatal volume in the High CAP group compared with the Medium CAP group for MD in bilateral premotor‐caudate, left motor‐putamen, bilateral premotor‐putamen, and bilateral sensory‐putamen tracts; for FA in right motor‐caudate, bilateral premotor‐caudate, and bilateral premotor‐putamen tracts; for AD in bilateral motor‐putamen, bilateral premotor‐putamen, and bilateral sensory‐putamen tracts; and for RD in bilateral premotor‐caudate, left motor‐putamen, bilateral premotor‐putamen, and bilateral sensory‐putamen tracts.
Longitudinal (slope) differences between DTI measures and striatal volume
We now turn to longitudinal differences in pairs of variables by group. The results for these contrasts are shown in Table 6.
Table 6.
Longitudinal (slope) differences between DTI measures and striatal volume for each CAP group
| Right M1‐C | Left PMA‐C | Right PMA‐C | Left M1‐P | Right M1‐P | Left PMA‐P | Right PMA‐P | Left S1‐P | Right S1‐P | ||||||||||
|---|---|---|---|---|---|---|---|---|---|---|---|---|---|---|---|---|---|---|
| t | P | t | P | t | P | t | P | t | P | t | P | t | P | t | P | t | P | |
| Mean MD | −0.09 | 0.93 | −4.25 | 0.01** | −1.39 | 0.16 | −2.34 | 0.02* | 0.56 | 0.58 | −3.42 | 0.01** | −1.33 | 0.18 | −0.75 | 0.45 | ||
| Control | −5.99 | 0.01** | −5.28 | 0.01** | −3.59 | 0.01** | −3.32 | 0.01** | −2.57 | 0.01* | −5.29 | 0.01** | −4.7 | 0.01** | −3.84 | 0.01** | ||
| Low CAP | −6.68 | 0.01** | −5.03 | 0.01** | −1.13 | 0.26 | −2.08 | 0.04* | −2.2 | 0.03* | −0.17 | 0.87 | −1.32 | 0.19 | −3.14 | 0.01** | ||
| Med CAP | −1.71 | 0.09 | −2.18 | 0.03* | −0.74 | 0.46 | −1.91 | 0.06 | −0.54 | 0.59 | −0.59 | 0.56 | −1.1 | 0.27 | −2.22 | 0.03* | ||
| High CAP | −0.56 | 0.58 | 0.07 | 0.95 | 1.72 | 0.08 | 0.84 | 0.4 | 0.21 | 0.83 | 3.61 | 0.01** | 2.38 | 0.02* | 0.46 | 0.65 | ||
| Med vs. Low | 2.79 | 0.01* | 1.88 | 0.06 | 1.88 | 0.06 | 0.83 | 0.41 | 1.33 | 0.18 | 3.18 | 0.01** | 2.38 | 0.02* | 0.96 | 0.34 | ||
| High vs. Low | 3.29 | 0.01** | 1.79 | 0.07 | 0.23 | 0.82 | 0.02 | 0.99 | 1.11 | 0.27 | −0.32 | 0.75 | 0.09 | 0.93 | 0.51 | 0.61 | ||
| High vs. Med | ||||||||||||||||||
| Mean FA | 0.56 | 0.57 | −2.62 | 0.01* | −3.09 | 0.01** | −0.89 | 0.38 | −2.88 | 0.01** | ||||||||
| Control | −2.44 | 0.01* | −6.33 | 0.01** | −5.88 | 0.01** | −3.55 | 0.01** | −4.93 | 0.01** | ||||||||
| Low CAP | −4.4 | 0.01** | −6.73 | 0.01** | −5.87 | 0.01** | −7.09 | 0.01** | −3.52 | 0.01** | ||||||||
| Med CAP | −1.54 | 0.12 | −2.43 | 0.02* | −1.85 | 0.06 | −5.3 | 0.01** | −2.26 | 0.02* | ||||||||
| High CAP | −1.46 | 0.15 | −0.39 | 0.69 | −0.16 | 0.87 | −2.64 | 0.01* | 0.92 | 0.36 | ||||||||
| Med vs. Low | 0.49 | 0.63 | 2.44 | 0.01* | 2.5 | 0.01* | −1.57 | 0.12 | 1.68 | 0.09 | ||||||||
| High vs. Low | 1.85 | 0.06 | 2.78 | 0.01* | 2.6 | 0.01* | 0.94 | 0.35 | 0.78 | 0.44 | ||||||||
| High vs. Med | ||||||||||||||||||
| Mean AD | −2.53 | 0.01* | −2.89 | 0.01** | 0.83 | 0.41 | −2.47 | 0.01* | −1.78 | 0.07 | −1.08 | 0.28 | ||||||
| Control | −6.26 | 0.01** | −4.37 | 0.01** | −4 | 0.01** | −5.48 | 0.01** | −6.9 | 0.01** | −5.37 | 0.01** | ||||||
| Low CAP | −3.88 | 0.01** | −4.09 | 0.01** | −0.78 | 0.43 | −1.55 | 0.12 | −2.05 | 0.04* | −4.37 | 0.01** | ||||||
| Med CAP | −2.11 | 0.04* | −2.8 | 0.01* | −0.15 | 0.88 | −2.77 | 0.01* | −4.47 | 0.01** | −3.5 | 0.01** | ||||||
| High CAP | 1.61 | 0.11 | 0.13 | 0.9 | 2.25 | 0.02* | 2.75 | 0.01* | 3.39 | 0.01** | 0.65 | 0.52 | ||||||
| Med vs. Low | 2.66 | 0.01* | 0.87 | 0.38 | 2.59 | 0.01* | 1.68 | 0.09 | 1.34 | 0.18 | 1.04 | 0.3 | ||||||
| High vs. Low | 1.1 | 0.27 | 0.74 | 0.46 | 0.42 | 0.67 | −0.96 | 0.33 | −1.89 | 0.06 | 0.41 | 0.68 | ||||||
| High vs. Med | ||||||||||||||||||
| Mean RD | −0.85 | 0.4 | −4.16 | 0.01** | −0.97 | 0.33 | −0.2 | 0.84 | −3.33 | 0.01** | −1.22 | 0.22 | −0.93 | 0.35 | ||||
| Control | −6.13 | 0.01** | −5.33 | 0.01** | −3.15 | 0.01** | −2.6 | 0.01* | −5.11 | 0.01** | −3.79 | 0.01** | −3.55 | 0.01** | ||||
| Low CAP | −6.85 | 0.01** | −5.21 | 0.01** | −1.75 | 0.08 | −4.04 | 0.01** | −0.97 | 0.33 | −2.93 | 0.01** | −3.39 | 0.01** | ||||
| Med CAP | −1.31 | 0.19 | −1.54 | 0.12 | −1.9 | 0.06 | −2.12 | 0.03* | −0.74 | 0.46 | −0.98 | 0.32 | −2.73 | 0.01* | ||||
| High CAP | −0.6 | 0.55 | −0.04 | 0.97 | 0.97 | 0.33 | −1.1 | 0.27 | 2.9 | 0.01** | 0.57 | 0.57 | 0.08 | 0.94 | ||||
| Med vs. Low | 3.17 | 0.01** | 2.39 | 0.02* | 0.72 | 0.47 | 0.17 | 0.87 | 2.94 | 0.01** | 1.85 | 0.06 | 0.38 | 0.7 | ||||
| High vs. Low | 3.71 | 0.01** | 2.39 | 0.02* | −0.2 | 0.84 | 1.2 | 0.23 | 0.13 | 0.9 | 1.29 | 0.2 | 0.31 | 0.76 | ||||
| High vs. Med | −0.09 | 0.93 | −4.25 | 0.01** | −1.39 | 0.16 | −2.34 | 0.02* | 0.56 | 0.58 | −3.42 | 0.01** | −1.33 | 0.18 | −0.75 | 0.45 | ||
* P < 0.05, ** P < 0.01.
C, caudate; P, putamen; PMA, premotor area; M1, primary motor cortex; S1, primary somatosensory cortex.
Healthy Controls: There were significant longitudinal differences in healthy controls between striatal volume and DTI measures for MD in the right premotor‐caudate, right motor‐putamen, and right premotor‐putamen tracts; for FA in bilateral premotor‐caudate and right premotor‐putamen tracts; for AD in bilateral motor‐putamen and right premotor‐putamen tracts; and for RD in right premotor‐caudate and right premotor‐putamen tracts.
Low CAP: Within the Low CAP group, the longitudinal changes were smaller for MD in bilateral premotor‐caudate, bilateral motor‐putamen, bilateral premotor‐putamen, and bilateral sensory‐putamen tracts; for FA in right motor‐caudate, bilateral premotor‐caudate, and bilateral premotor‐putamen tracts; for AD in bilateral motor‐putamen, bilateral premotor‐putamen, and bilateral sensory‐putamen tracts; and for RD in bilateral premotor‐caudate, left motor putamen, bilateral premotor‐putamen, and bilateral sensory‐putamen tracts than the longitudinal change for striatal volume.
Medium CAP: Within the Medium CAP group, the longitudinal changes were smaller for MD in bilateral premotor‐caudate, right motor‐putamen, left premotor‐putamen, and right sensory‐putamen tracts; for FA in right motor‐caudate, bilateral premotor‐caudate and bilateral premotor‐putamen tracts; for AD in bilateral motor‐putamen and bilateral sensory‐putamen tracts; and for RD in bilateral premotor‐caudate, left premotor‐putamen, and bilateral sensory‐putamen tracts than the longitudinal change for striatal volume.
The difference between these measures was wider in the Medium CAP group than the Low CAP group for MD in right premotor‐putamen and left sensory‐putamen tracts; for FA in the left premotor‐putamen tract; for AD in the bilateral premotor‐putamen and left sensory‐putamen tracts; and for RD in the right premotor‐putamen tract.
High CAP: Within the High CAP group, the longitudinal changes were smaller for MD in right and right sensory‐putamen tracts; for FA in left premotor‐caudate and bilateral premotor‐putamen tracts; for AD in bilateral motor‐putamen, right premotor‐putamen, and bilateral sensory‐putamen tracts; and for RD in left premotor‐putamen and right sensory‐putamen tracts than the longitudinal change for striatal volume.
The difference between these measures was wider in the High CAP group than the Low CAP group for MD in left premotor‐caudate, right premotor‐putamen, and left sensory‐putamen tracts; for FA in bilateral premotor‐caudate tracts; for AD in left motor‐putamen and left premotor‐putamen tracts; and for RD in bilateral premotor‐caudate and right premotor‐putamen tracts.
There was also a wider baseline difference between DTI measures and striatal volume in the High CAP group compared with the Medium CAP group for MD in the left premotor‐caudate tract; for FA in bilateral premotor‐caudate tracts; and for RD in bilateral premotor‐caudate tracts.
DISCUSSION
To our knowledge, this is the largest study to examine longitudinal diffusion‐weighted imaging data in prodromal and early HD. We used data from the PREDICT‐HD study in order to test whether (a) white matter degeneration was present in the cortico‐striate tracts connecting premotor, motor, and somatosensory cortices to the caudate and putamen of pre‐HD individuals and (b) whether longitudinal worsening occurred. Our findings demonstrate that highly significant alterations in white matter tracts connecting sensory and motor cortex regions to the striatum are present in pre‐HD individuals. Our findings also demonstrate that these disease burden‐related changes accelerate as the predicted diagnosis time is approached, with pre‐HD individuals showing changes in DTI measures that indicate increasing white matter degeneration over time. Furthermore, while our findings suggest that the severity is greatest in pre‐HD individuals who are closest to diagnosis, significant baseline and longitudinal changes in DTI measures were present in both the Low and Medium CAP groups.
Reductions in striatal volume in pre‐HD are known to occur as many as 10 years before clinical diagnosis [Aylward et al., 1996; Douaud et al., 2006; Harris et al., 1999]. However, more recently it has become clear that changes in both structural [Matsui et al., 2014, 2015; Paulsen et al., 2010; Poudel et al., 2014] and functional connectivity [Dogan et al., 2015] are also present in pre‐HD. In recent work by our group, we identified altered prefrontal DTI measures [Matsui et al., 2014, 2015] in pre‐HD while, in a similar study Poudel et al. [2014] also found altered DTI measures in tracts connecting the prefrontal cortex, primary motor cortex, and striatum in pre‐HD individuals who were close to diagnosis. In this study, we expanded upon previous findings showing altered DTI in pre‐HD by investigating cortical regions involved specifically in motor function. We analyzed longitudinal data in order to test whether changes in these regions over time were related to disease progression (CAP group). Our findings showed that changes in DTI measures consistent with white matter degeneration (increased MD, RD, AD; decreased FA) are present in every stage of prodromal HD and become more pronounced as participants approach predicted diagnosis. The greatest difference in longitudinal change was between the High CAP group and healthy controls, indicating that the group with the greatest prodromal disease progression also had the fastest rate of deterioration. The longitudinal changes were also significantly different for several tracts in the Medium CAP group, which is consistent with the findings of Matsui et al. [2014, 2015] and Poudel et al. [2014]. Interestingly, we also found that the Low CAP group showed greater MD and RD than healthy controls in the right premotor area–putamen tract, suggesting that DTI changes occurred earlier than what was shown in the previous studies. Given that the estimated time to diagnosis for the Low CAP group is greater than 13 years, these findings indicated that DTI changes within these cortico‐striate tracts might begin many more years before clinical diagnosis than previously indicated.
In addition to examining the longitudinal change of individual DTI variable over time, we also compared changes of DTI and volume measures within each CAP group. Comparisons between the baseline values of these measures indicated that DWI measures showed less degeneration in all four groups. Comparisons among the longitudinal changes indicated that DWI measures changed more slowly than volume measures. In other words, reductions in striatal volume were more pronounced and worsened more quickly, even during normal aging. However, these differences were more pronounced in the Low and Medium CAP groups rather than in the High CAP group. This is consistent with our findings showing changes in DTI measures occurred most rapidly in the High CAP group. The results of this analysis also indicated that DTI measures and striatal volume measures show differential relationships with CAP group (i.e., follow a different trajectory), indicating that DTI measures may provide additional (and independent) information that is not provided by changes in striatal volume.
While we considered that DTI changes might be present before volume changes due to the difference in sensitivity of volume vs. diffusion‐weighted imaging techniques, our results instead show that striatal volume changes precede white matter changes. Anatomically, our tracts of interest are primarily comprised of striatal afferents and so our results suggest that (1) Striatal volume loss may lead to degeneration in cortical afferents several years prior to HD diagnosis and (2) that loss of striatal input may be a key aspect of motor symptom onset. Future work to disentangle the relationship between striatal afferents and efferents may be difficult, as these circuits are generally thought to form a loop (cortex → striatum → pallidum → thalamus → cortex); however these results may suggest that methods for maintaining the integrity of cortico‐striatal tracts may help to alleviate or delay the onset of motor symptoms in HD.
Differences among the three CAP groups were examined in order to determine whether there was a between‐group difference in the relationship between DTI measures and striatal volume. Overall, this analysis indicated that as the pre‐HD stage progressed, baseline differences between the measures grew larger while longitudinal change differences became smaller. That is, the High CAP group showed the greatest baseline difference, but also showed a smaller longitudinal difference between DTI and volume measures. This suggests that either striatal volume changes more slowly or that DTI measures change more rapidly in the High CAP group than the other CAP groups. However, given the baseline differences between CAP groups, it is likely that this is specifically due to changes in DTI measures, suggesting that white matter degeneration starts later and then occurs more quickly than volume changes later in the pre‐HD phase of the illness.
Anatomically, connectivity with the putamen was more disrupted than connectivity with the caudate in our tracts of interest. We observed disease‐related DTI differences within all six tracts‐of‐interest that connected our cortical regions‐of‐interest to the putamen, whereas disease‐related DTI differences were only observed in left and right premotor area‐caudate tracts. Given that neurodegeneration in HD is thought to originate in the caudate and to progress into the putamen [Aylward et al., 1996], we may have expected a greater severity of white matter degeneration in tracts connected with the caudate. However, caudate afferents primarily originate in multimodal association areas whereas the bulk of putamen afferents originate in primary and secondary sensory cortices including the premotor area, primary motor cortex, and primary somatosensory cortex [Leh et al., 2007; Purves et al., 2001]. It is therefore encouraging that our results align with known anatomical connectivity involving these regions. Furthermore, caudate degeneration has been shown to be less severe than putamen degeneration in HD [Harris et al., 1992] which may also explain these findings. Recent publications [Paulsen et al., 2006b, 2014a; Tabrizi et al., 2013] have also noted that putamen volumes are a more reliable predictor of disease state than caudate volumes, which may have introduced additional variance in volumetric assessment.
However, our findings, combined with the understanding that volume loss in the putamen occurs closer to diagnosis [Aylward et al., 1996], suggest that motor impairment due to the loss of connectivity between motor areas and the putamen may ultimately be responsible for clinical diagnosis. A few prior studies also support such an interpretation. For example, Aylward et al. [2012] found that putamen volume was the strongest predictor of disease progression when comparing CAP‐score matched prodromal and diagnosed HD individuals. Likewise, a functional connectivity study carried out by Dogan et al. [2015] showed that connectivity between the dorsolateral prefrontal cortex and the caudate was associated with cognitive deficits in pre‐HD individuals, whereas diagnosed HD participants had altered functional connectivity between the putamen and motor areas including the premotor cortex. Taken together, these findings suggest that putamen degeneration may provide a specific target for future clinical trials and may also be a putative target for intervention therapies. Alternatively, understanding of basal ganglia circuitry suggests that putamen circuitry is more involved in motor dysfunction whereas caudate circuitry may be more involved in cognitive and behavioral circuitry. It is possible that our findings would change were the diagnosis of HD based on cognitive, as well as motor, symptoms.
Our findings also underscore the importance of the premotor area, as structural connectivity between the premotor area and the striatum appears to be more severely affected than connectivity between the primary motor cortex or primary somatosensory cortex and the striatum. There were no disease‐related changes in DTI measures in tracts connecting primary motor or primary somatosensory cortex to the caudate; however disease‐progression related changes in DTI measures were present in the premotor area‐caudate tract. Similarly, while there were significant alterations in all six tracts connecting to the putamen, differences in the premotor area‐putamen tracts showed disease‐related alterations in more DTI measures for both the Medium and High CAP groups, suggesting that these tracts were particularly susceptible to disease‐related degeneration at baseline and longitudinally. Interestingly, while the right hemisphere premotor‐putamen tract did show some group differences in DTI measures at baseline, it was particularly sensitive to longitudinal changes in DTI measures related to disease state, which suggests that this tract may be of particular interest for future studies.
The simplest explanation for the predominance of the premotor area in our findings is that it may be more strongly connected to the striatum than primary motor or somatosensory cortices. However, as part of our analysis of the DTI data, we estimated the number of streamlines within each tract and found that there were fewer streamlines connecting the premotor area with the striatum than there were connecting the other cortical areas to the striatum, which suggests that premotor area tracts dominated our findings for a different reason. Another possibility is that the specific areas of the putamen that receive premotor afferents may undergo degeneration at a different rate than other areas of the putamen. For example, primary motor cortex is known to connect to lateral regions of the putamen, while the premotor area connects with medial regions [Leh et al., 2007] which have been shown to degenerate earlier [Muralidharan et al., 2014; Younes et al., 2014]. Likewise, it is possible that connectivity between the primary motor and sensory cortices and the striatum is closely tied to the direct basal ganglia pathway while the premotor cortex is more closely associated with the indirect pathway, and so may be directly affected in HD. Either of these explanations would support the idea that premotor‐putamen connectivity is particularly susceptible to degeneration in pre‐HD and would support the use of DTI measurements in this tract as a measure of disease progression.
Limitations
The main limitation of this study is that the PREDICT‐HD study required that subjects had undergone predictive testing for the CAG expansion prior to enrollment in the study. It is unknown whether the subjects who volunteered for this study represent a random sample of all pre‐HD subjects. The predictive testing rates are relatively low (10%–25%) so we cannot necessarily generalize to those who chose not to be tested prior to manifestation of the clinical phenotype.
Methodological variability due to differences in scanners, acquisition parameters, etc., presented a significant challenge. We have attempted to account for this variation with the robust and carefully considered processing methods documented in the publicly available processing pipeline (BRAINSTools suite, https://github.com/BRAINSia/BRAINSTools.git). Furthermore, careful consideration was taken in our selection of imaging data and in the selection of variables to include as co‐variates in our statistical modeling.
Conclusion
In the largest longitudinal study to date, we used longitudinal modeling to identify differences in DTI measures that were related to disease progression in pre‐HD individuals within cortico‐striate tracts originating in motor and sensory areas of the cortex. We identified differences in both the baseline and longitudinal imaging measures that were consistent with white matter degeneration and were most prevalent in pre‐HD individuals who were closest to motor diagnosis. These differences also indicated that white matter degeneration occurred more than a decade prior to motor diagnosis. These changes predominantly involved connectivity in the premotor cortex and the putamen. Given the role of these regions in motor function specifically; these findings suggest a unique role for white matter loss between the affected regions in the onset of the HD motor symptoms needed for diagnosis. Furthermore, the relationship between DTI measures and disease progression was distinct from the relationship between striatal volume and disease progression in several of our tracts of interest, suggesting that DTI measures may provide unique information about the time‐course and diagnosis of neurodegeneration in pre‐HD.
DISCLOSURE/CONFLICT‐OF‐INTEREST STATEMENT
The authors declare that the research was conducted in the absence of any commercial or financial relationships that could be construed as a potential conflict of interest. Jane Paulsen has had consulting contracts with Prophase, Roche, and CHDI. Jeffrey D. Long has a consulting contract with Neurophage Inc and is a paid consultant for Azevan Inc and Roche Pharma.
AUTHOR CONTRIBUTIONS
Joseph Shaffer Prepared manuscript, identified of tracts‐of‐interest, and implemented WMQL tract selection.
Ali Ghayoor Assisted with development of DWI processing pipeline and with HPC data processing, UKF data processing and quality control (QC) checks; also assisted with writing of DWI processing methods section.
Jeffrey D. Long Performed statistical analysis, assisted with manuscript preparation and editing, provided mentoring for team members regarding statistical interpretation.
Regina EY Kim Reviewed manuscript, assisted with data analysis and development of DWI processing pipeline and assisted with writing the DWI processing methods section.
Spencer Lourens Performed statistical analysis and model development, mentored team members regarding statistical interpretation and drafted statistical analysis section of manuscript.
Lauren J. O'Donnell Provided insight into design of data processing procedures, and assisted with understanding of DWI measures in a context outside of HD.
Carl‐Frederik Westin Provided technical expertise in diffusion MRI, and algorithm development for tractography and compressed sensing.
Yogesh Rathi Enhanced the Compressed sensing algorithm for use with this particular data set. Also helped setup and optimize the UKF tractography parameters for tracing all the fiber bundles of interest used in this work.
Vincent A. Magnotta Participated in study design and imaging protocol development for the multi‐center imaging study. Participated in manuscript preparation and revision.
Jane Paulsen Developed Predict‐HD study design and worked with Dr. Magnotta for imaging protocol development which conducted multi‐site reliability of DTI. Participated in manuscript preparation and revision.
Hans Johnson Performed algorithmic development for multi‐site DWI data processing including: whole brain tractography, data conversion, QC, initial development of analysis scripts, HPC data processing, measurement generation, study design, and writing.
Supporting information
Supporting Information 1
Supporting Information 2
Supporting Information 3
Supporting Information 4
Supporting Information 5
Supporting Information 6
Supporting Information 7
REFERENCES
- Avants BB, Tustison NJ, Song G, Gee JC (2009): ANTS: Open‐Source Tools for Normalization And Neuroanatomy. Heanet.Ie X, 1–11.
- Aylward EH, Codori AM, Barta PE, Pearlson GD, Harris GJ, Brandt J (1996): Basal ganglia volume and proximity to onset in presymptomatic huntington disease. Arch Neurol 53:1293–1296. [DOI] [PubMed] [Google Scholar]
- Aylward EH, Anderson NB, Bylsma FW, Wagster MV, Barta PE, Sherr M, Feeney J, Davis A, Rosenblatt A, Pearlson GD, Ross CA (1998): Frontal lobe volume in patients with huntington's disease. Neurology 50:252–258. [DOI] [PubMed] [Google Scholar]
- Aylward E, Liu D, Nopoulos P, Ross C, Pierson R, Mills J, Long J, Paulsen J, PREDICT‐HD (2012): Striatal volume contributes to the prediction of onset of huntington's disease in incident cases. Biol Psychiatry 71:822–828. [DOI] [PMC free article] [PubMed] [Google Scholar]
- Baumgartner C, Pasternak O, Bouix S, Westin C‐F, Rathi Y (2012): Filtered multi‐tensor tractography using free water estimation. In: Inernational Society for Magnetic Resonance in Medicine Meeting.
- Bohanna I, Georgiou‐Karistianis N, Hannan AJ, Egan GF (2008): Magnetic resonance imaging as an approach towards identifying neuropathological biomarkers for huntington's disease. Brain Res Brain Res Rev 58:209–225. [DOI] [PubMed] [Google Scholar]
- Dogan I, Eickhoff C, Fox P, Laird A, Schulz J, Eickhoff S, Reetz K (2015): Functional connectivity modeling of consistent cortico‐striatal degeneration in hungtington's disease. Neuroimage: Clin 7:640–652. [DOI] [PMC free article] [PubMed] [Google Scholar]
- Douaud G, Gaura V, Ribeiro MJ, Lethimonnier F, Maroy R, Verny C, Krystkowiak P, Damier P, Bachoud‐Levi AC, Hantraye P, Remy P (2006): Distribution of grey matter atrophy in huntington's disease patients: A combined roi‐based and voxel‐based morphometric study. Neuroimage 32:1562–1575. [DOI] [PubMed] [Google Scholar]
- Ghayoor A, Vaidya JG, Johnson HJ (2013): Development of a novel constellation based landmark detection algorithm. In: Proc. SPIE Conf. (Orlando, Florida), vol. 8669, 86693F (6 pages).
- Ghayoor A, Paulsen JS, Kim RE, Johnson HJ (2016): Tissue Classification of Large‐scale Multi‐site MR Data Using Fuzzy k‐Nearest Neighbor Method. In: Proc. SPIE Conf. (San Diego, California), vol. 9784, 9784‐66 (7 pages).
- Gorgolewski K, Burns CD, Madison C, Clark D, Halchenko YO, Waskom ML, Ghosh SS (2011): Nipype: A flexible, lightweight and extensible neuroimaging data processing framework in python. Front Neuroinform 5:13. [DOI] [PMC free article] [PubMed] [Google Scholar]
- Harrington DL, Long JD, Durgerian S, Mourany L, Koenig K, Bonner‐Jackson A, Paulsen JS, Rao SM (2016): Cross‐sectional and longitudinal multimodal structural imaging in prodromal Huntington's disease. Mov Disord 31:1664–1675. [DOI] [PMC free article] [PubMed] [Google Scholar]
- Harris GJ, Pearlson GD, Peyser CE, Aylward EH, Roberts J, Barta PE, Chase GA, Folstein SE (1992): Putamen volume reduction on magnetic resonance imaging exceeds caudate changes in mild huntington's disease. Ann Neurol 31:69–75. [DOI] [PubMed] [Google Scholar]
- Harris GJ, Codori AM, Lewis RF, Schmidt E, Bedi A, Brandt J (1999): Reduced basal ganglia blood flow and volume in preclinical, gene‐tested persons at‐risk for huntington's disease. Brain 122:1667–1678. [DOI] [PubMed] [Google Scholar]
- Kim E, Johnson H (2013): Robust multi‐site MR data processing: Iterative optimization of bias correction, tissue classification, and registration. Front Neuroinform 7:1–11. [DOI] [PMC free article] [PubMed] [Google Scholar]
- Kim EY, Lourens S, Long JD, Paulsen JS, Johnson HJ, Kim REY, Lourens S, Long JD, Paulsen JS, Johnson HJ (2015): Preliminary analysis using multi‐atlas labeling algorithms for tracing longitudinal change. Front Neurosci 9:242. [DOI] [PMC free article] [PubMed] [Google Scholar]
- Leh S, Ptito A, Chakravarty M, Strafella A (2007): Fronto‐striatal connections in the human brain: A probabilistic diffusion tractography study. Neurosci Lett 419:113–118. [DOI] [PMC free article] [PubMed] [Google Scholar]
- Long JD (2011): Longitudinal Data Analysis for the Behavioral Sciences using R. Thousand Oaks, California: SAGE Publications, Inc. [Google Scholar]
- Long JD, Paulsen JS, Predict‐HD Investigators (2015): Multivariate prediction of motor diagnosis in huntington's disease: 12 years of predict‐hd. Mov Disord 30:1664–1672. [DOI] [PMC free article] [PubMed] [Google Scholar]
- Lu W, Johnson H (2010): Introduction to ITK Resample In‐Place Image Filter. Insight J July–December:3–6. [Google Scholar]
- Magnotta VA, Kim J, Koscik T, Beglinger LJ, Espinso D, Langbehn D, Nopoulos P, Paulsen JS (2009): Diffusion tensor imaging in preclinical huntington's disease. Brain Imaging Behav 3:77–84. [DOI] [PMC free article] [PubMed] [Google Scholar]
- Malcolm JG, Shenton ME, Rathi Y (2010): Filtered multitensor tractography. IEEE Trans Med Imaging 29:1664–1675. [DOI] [PMC free article] [PubMed] [Google Scholar]
- Matsui J (2014): Development of image processing tools and procedures for analyzing multi‐site longitudinal diffusion‐weighted imaging studies. Ph.D. thesis, The University of Iowa.
- Matsui J, Vaidya J, Johnson H, Magnotta V, Long J, Mills J, Lowe M, Sakaie K, Rao S, Smith M, Paulsen J (2014): Diffusion weighted imaging of prefrontal cortex in prodromal huntington's disease. Hum Brain Mapp 35:1562–1573. [DOI] [PMC free article] [PubMed] [Google Scholar]
- Matsui J, Vaidya J, Wassermann D, Kim R, Magnotta V, Johnson H, Paulsen J, PREDICT‐HD (2015): Prefrontal cortex white matter tracts in prodromal huntington disease. Hum Brain Mapp 36:3717–3732. [DOI] [PMC free article] [PubMed] [Google Scholar]
- Michailovich O, Rathi Y, Dolui S (2011): Spatially regularized compressed sensing for high angular resolution diffusion imaging. IEEE Trans Med Imaging 30:1100–1115. [DOI] [PMC free article] [PubMed] [Google Scholar]
- Muralidharan P, Fishbaugh J, Johnson HJ, Durrleman S, Paulsen JS, Gerig G, Fletcher PT (2014): Diffeomorphic shape trajectories for improved longitudinal segmentation and statistics. In Lecture Notes in Computer Science (including subseries Lecture Notes in Artificial Intelligence and Lecture Notes in Bioinformatics) (Springer International Publishing), vol. 8675 LNCS. pp 49–56. [DOI] [PMC free article] [PubMed]
- Nopoulos P, Magnotta VA, Mikos A, Paulson H, Andreasen NC, Paulsen JS (2007): Morphology of the cerebral cortex in preclinical huntington's disease. Am J Psychiatry 164:1428–1434. [DOI] [PubMed] [Google Scholar]
- Odish OFF, Leemans A, Reijntjes RHAM, van den Bogaard SJA, Wolterbeek R, Tax CMW, Kuijf HJ, Vincken KL, van der Grond J, Roos RAC (2015): Microstructural brain abnormalities in Huntington's disease: A two‐year follow‐up. Hum Brain Mapp 36:2061–2074. [DOI] [PMC free article] [PubMed] [Google Scholar]
- O'Donnell LJ, Westin CF (2007): Automatic tractography segmentation using a high‐dimensional white matter atlas. IEEE Trans Med Imaging 26:1562–1575. [DOI] [PubMed] [Google Scholar]
- Oguz I, Farzinfar M, Matsui JT, Budin F, Liu Z, Gerig G, Johnson HJ, Styner M (2014): DTIPrep: Quality control of diffusion‐weighted images. Front Neuroinform 8:4. [DOI] [PMC free article] [PubMed] [Google Scholar]
- Paulsen J, Zhao H, Stout J, Brinkman R, Guttman M, Ross C, Como P, Manning C, Hayden M, Shoulson I, the Huntington Study Group (2001): Clinical markers of early disease in persons near onset of huntingtons disease. Neurology 57:658–662. [DOI] [PubMed] [Google Scholar]
- Paulsen J, Hayden M, Stout J, Langbehn D, Aylward E, Ross C, Guttman M, Nance M, Kieburtz K, Oakes D, Shoulson I, Kayson E, Johnson S, Penziner E, the Predict‐HD Investigators of the Huntington Study Group (2006a): Preparing for preventive clinical trials: The predict‐hd study. Arch Neurol 63:883–890. [DOI] [PubMed] [Google Scholar]
- Paulsen JS, Magnotta VA, Mikos AE, Paulson HL, Penziner E, Andreasen NC, Nopoulos PC (2006b): Brain structure in preclinical huntington's disease. Biol Psychiatry 59:57–63. [DOI] [PubMed] [Google Scholar]
- Paulsen J, Langbehn D, Stout J, Aylward E, Ross C, Nance M, Guttman M, Johnson S, MacDonald M, Beglinger L, Duff K, Kayson E, Biglan K, Shoulson I, Oakes D, Hayden M, the Predict‐HD Investigators of the Huntington Study Group (2008): Detection of huntingtons disease decades before diagnosis: The predict‐hd study. J Neurol Neurosurg Psychiatry 79:874–880. [DOI] [PMC free article] [PubMed] [Google Scholar]
- Paulsen J, Nopoulos P, Aylward E, Ross C, Johnson H, Magnotta V, Juhl A, Pierson R, Mills J, Langbehn D, Nance M, PREDICT‐HD (2010): Striatal and white matter predictors of estimated diagnosis for huntington disease. Brain Res Bull 82:201–207. [DOI] [PMC free article] [PubMed] [Google Scholar]
- Paulsen JS, Smith MM, Long JD (2013): Cognitive decline in prodromal Huntington disease: Implications for clinical trials. J Neurol Neurosurg Psychiatry 84:1233–1239. [DOI] [PMC free article] [PubMed] [Google Scholar]
- Paulsen JS, Long JD, Johnson HJ, Aylward EH, Ross CA, Williams JK, Nance MA, Erwin CJ, Westervelt HJ, Harrington DL, Bockholt HJ, Zhang Y, McCusker EA, Chiu EM, Panegyres PK (2014a): Clinical and biomarker changes in premanifest Huntington disease show trial feasibility: A decade of the PREDICT‐HD study. Front Aging Neurosci 6:1–11. [DOI] [PMC free article] [PubMed] [Google Scholar]
- Paulsen JS, Long JD, Ross CA, Harrington DL, Erwin CJ, Williams JK, Westervelt HJ, Johnson HJ, Aylward EH, Zhang Y, Bockholt HJ, Barker RA (2014b): Prediction of manifest huntington's disease with clinical and imaging measures: A prospective observational study. Lancet Neurol 13:1193–1201. [DOI] [PMC free article] [PubMed] [Google Scholar]
- Phillips O, Sanchez‐Castaneda C, Elifani F, Maglione V, Di Pardo A, Caltagirone C, Squitieri F, Sabatini U, Di Paola M (2013): Tractography of the corpus callosum in huntington's disease. PLoS One 8:e73280. [DOI] [PMC free article] [PubMed] [Google Scholar]
- Phillips O, Squitieri F, Sanchez‐Castaneda C, Elifani F, Caltagirone C, Sabatini U, Di Paola M (2014): Deep white matter in huntington's disease. PLoS One 9:e109676. [DOI] [PMC free article] [PubMed] [Google Scholar]
- Poudel G, Stout J, Domnguez D, Salmon A, L Churchyard Chua,P, Georgiou‐Karistianis N, Egan G (2014): White matter connectivity reflects clinical and cognitive status in huntington's disease. Neurobiol Dis 65:180–187. [DOI] [PubMed] [Google Scholar]
- Poudel GR, Stout JC, Dominguez DJ, Churchyard A, Chua P, Egan GF, Georgiou‐Karistianis N (2015): Longitudinal change in white matter microstructure in Huntington's disease: The IMAGE‐HD study. Neurobiol Dis 74:406–412. [DOI] [PubMed] [Google Scholar]
- Purves D, Augustine G, Fitzpatrick D, Katz L, LaMantia A‐S, McNamara J, Williams S, editors. (2001): Neuroscience, 2nd ed. Sunderland, MA: Sinauer Associates. [Google Scholar]
- Rathi Y, Michailovich O, Setsompop K, Bouix S, Shenton ME, Westin CF (2011): Medical Image Computing and Computer‐Assisted Intervention – MICCAI 2011. In: 14th International Conference, Toronto, Canada, September 18–22, 2011, Proceedings, Part II (Berlin, Heidelberg: Springer Berlin Heidelberg), chap. Sparse Multi‐ Shell Diffusion Imaging. pp 58–65. [DOI] [PMC free article] [PubMed]
- Rosas HD, Hevelone ND, Zaleta AK, Greve DN, Salat DH, Fischl B (2005): Regional cortical thinning in preclinical huntington disease and its relationship to cognition. Neurology 65:745–747. [DOI] [PubMed] [Google Scholar]
- Rosas HD, Tuch DS, Hevelone ND, Zaleta AK, Vangel M, Hersch SM, Salat DH (2006): Diffusion tensor imaging in presymptomatic and early huntington's disease: Selective white matter pathology and its relationship to clinical measures. Mov Disord 21:1317–1325. [DOI] [PubMed] [Google Scholar]
- Ross C, Aylward E, Wild E, Langbehn D, Long J, Warner J, Scahill R, Leavitt B, Stout J, Paulsen J, Reilmann R, Unschuld P, Wexler A, Margolis R, Tabrizi S (2014): Huntington disease: Natural history, biomarkers, and prospects for therapeutics. Nat Rev Neurol 10:204–216. [DOI] [PubMed] [Google Scholar]
- Stoffers D, Sheldon S, Kuperman JM, Goldstein J, Corey‐Bloom J, Aron AR (2010): Contrasting gray and white matter changes in preclinical huntington disease: An mri study. Neurology 74:1208–1216. [DOI] [PMC free article] [PubMed] [Google Scholar]
- Tabrizi SJ, Langbehn DR, Leavitt BR, Roos RAC, Durr A, Craufurd D, Kennard C, Hicks SL, Fox NC, Scahill RI, Borowsky B, Tobin AJ, Rosas HD, Johnson H, Reilmann R, Landwehrmeyer B, Stout JC (2009): Biological and clinical manifestations of huntington's disease in the longitudinal track‐hd study: Cross‐sectional analysis of baseline data. Lancet Neurol 8:791–801. [DOI] [PMC free article] [PubMed] [Google Scholar]
- Tabrizi SJ, Scahill RI, Durr A, Roos RA, Leavitt BR, Jones R, Landwehrmeyer GB, Fox NC, Johnson H, Hicks SL, Kennard C, Craufurd D, Frost C, Langbehn DR, Reilmann R, Stout JC, Investigators T‐H (2011): Biological and clinical changes in premanifest and ealy stage huntington's disease in the track‐hd study: The 12‐month longitudinal analysis. Lancet Neurol 10:31–42. [DOI] [PubMed] [Google Scholar]
- Tabrizi SJ, Reilmann R, Roos RAC, Durr A, Leavitt B, Owen G, Jones R, Johnson H, Craufurd D, Hicks SL, Kennard C, Landwehrmeyer B, Stout JC, Borowsky B, Scahill RI, Frost C, Langbehn DR (2012): Potential endpoints for clinical trials in premanifest and early huntington's disease in the track‐hd study: Analysis of 24 month observational data. Lancet Neurol 11:42–53. [DOI] [PubMed] [Google Scholar]
- Tabrizi SJ, Scahill RI, Owen G, Durr A, Leavitt BR, Roos RA, Borowsky B, Landwehrmeyer B, Frost C, Johnson H, Craufurd D, Reilmann R, Stout JC, Langbehn DR (2013): Predictors of phenotypic progression and disease onset in premanifest and early‐stage Huntington's disease in the TRACK‐HD study: Analysis of 36‐month observational data. Lancet Neurol 12:637–649. [DOI] [PubMed] [Google Scholar]
- Thieben MJ, Duggins A, Good C, Gomes L, Mahant N, Richards F, McCusker E, Frackowiak R (2002): The distribution of structural neuropathology in pre‐clinical huntington's disease. Brain 125:1815–1828. [DOI] [PubMed] [Google Scholar]
- Verbeke G, Molenberghs G (2000): Linear Mixed Models for Longitudinal Data. New York: Springer‐Verlag. [Google Scholar]
- Wassermann D, Makris N, Rathi Y, Shenton M, Kikinis R, Kubicki M, Westin C‐F (2013): On describing human white matter anatomy: The white matter query language In Medical Image Computing and Computer‐Assisted Intervention–MICCAI 2013. Springer; pp 647–654. [DOI] [PMC free article] [PubMed] [Google Scholar]
- Wassermann D, Makris N, Rathi Y, Shenton M, Kikinis R, Kubicki M, Westin C‐F (2016): The white matter query language: A novel approach for describing human white matter anatomy. Brain Struct Funct 221:4705–4721. [DOI] [PMC free article] [PubMed] [Google Scholar]
- Younes L, Ratnanather J, Brown T, Aylward E, Nopoulos P, Johnson H, Magnotta V, Paulsen J, Margolis R, Albin R, Miller M, Ross C, PREDICT‐HD (2014): Regionally selective atrophy of subcortical structures in prodromal hd as revealed by statistical shape analysis. Hum Brain Mapp 35:792–809. [DOI] [PMC free article] [PubMed] [Google Scholar]
- Zhang Y, Long JD, Mills JA, Warner JH, Lu W, Paulsen JS (2011): Indexing disease progression at study entry with individuals at‐risk for huntington disease. Am J Med Genet 156:751–763. [DOI] [PMC free article] [PubMed] [Google Scholar]
Associated Data
This section collects any data citations, data availability statements, or supplementary materials included in this article.
Supplementary Materials
Supporting Information 1
Supporting Information 2
Supporting Information 3
Supporting Information 4
Supporting Information 5
Supporting Information 6
Supporting Information 7