Abstract
Focal copy number gains or losses are important genomic hallmarks of cancer. The genomic distribution of oncogenes and tumor-suppressor genes (TSG) in relation to focal copy number aberrations is unclear. Our analysis revealed that the mean distance of TSGs from oncogenes was significantly shorter than that of noncancer genes, suggesting that oncogenes and TSGs tend to be in close physical proximity in the human genome. Such relationship was conserved in mouse and drosophila. Pan-cancer analysis using data from The Cancer Genome Atlas indicated that oncogenes without a nearby TSG are more prone to amplification. In conclusion, our study provides evidence for the nonrandom distribution of oncogenes and TSGs across different species. Our data also support that the existence of a neighboring TSG can suppress amplification of an oncogene, shedding new light on a previously unappreciated protective mechanism of TSGs.
Keywords: oncogene, tumor-suppressor gene, copy number aberration, amplification
Focal copy number aberrations (CNAs) are defined as somatic, submicroscopic gains or losses of genetic materials in a region of ∼3 Mbp (Krijgsman et al. 2014). Such genomic alterations are key to the development of different human cancers through aberrant activation of oncogenes (e.g., MYC, CCND1) via amplification or inactivation of tumor-suppressor genes (TSGs) (e.g., CDKN2A, PTEN) via hemi- or homozygous deletion (Kawate et al. 1999; Elsheikh et al. 2008; Sulong et al. 2009; Beroukhim et al. 2012; Yoshimoto et al. 2012). Several mechanisms, including nonhomologous end joining, breakage-fusion-bridge cycle and replication slippage, have been proposed to mediate CNAs (Hastings et al. 2009). Chromosome architecture, such as the presence of direct and inverted low copy repeats, also impacts on the genomic distribution of CNAs (Hastings et al. 2009). However, other factors that affect the frequency and distribution of CNAs in the human genome remain elusive.
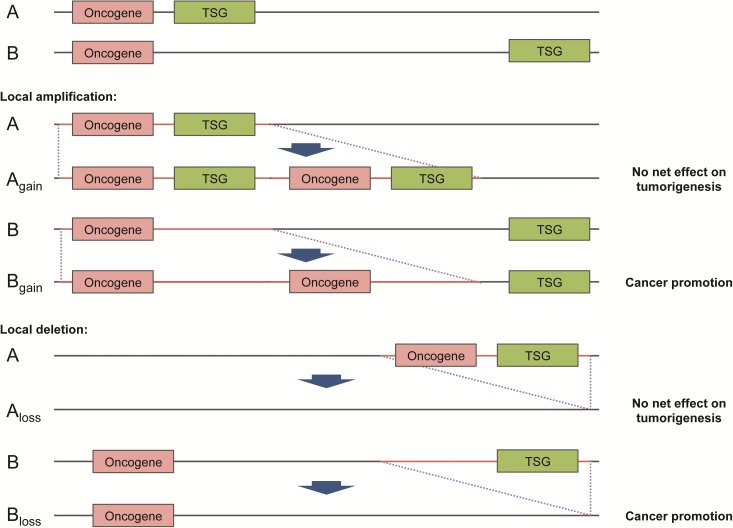
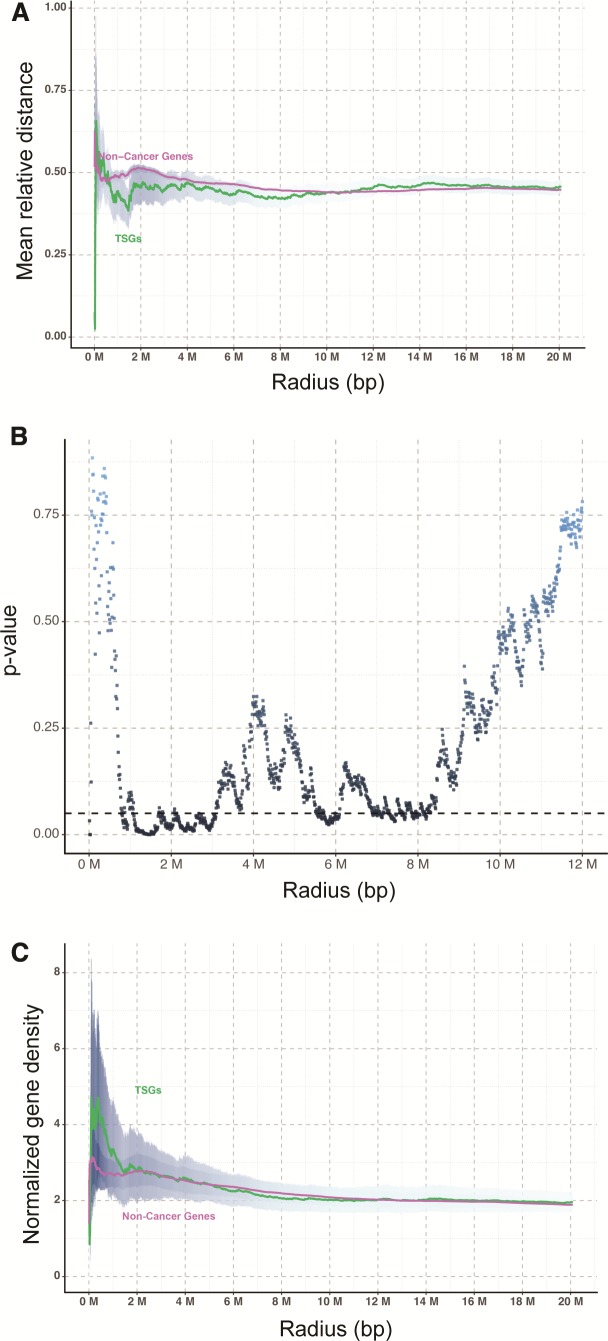
Existing literature suggested a higher intensity of purifying selection on cancer-related genes (Thomas et al. 2003). This has led us to hypothesize that oncogenes and TSGs are more closely related physically, than noncancer-related genes, as such a genomic arrangement would allow potential protumorigenic effect of focal CNAs to be nullified, by coamplification or codeletion of genes with opposite effects (fig. 1). Therefore, it is conceivable that the distance between oncogenes and TSGs in the human genome should be shorter than those among other genes owing to the survival advantage of such genomic architecture to our species. To test this hypothesis, we compiled the chromosomal locations of all oncogenes and TSGs summarized by Vogelstein et al. (2013) or curated by the TSGene database (Zhao et al. 2016) as well as those of noncancer genes from Ensembl (Flicek et al. 2014). For noncancer genes, only well-defined genes with official gene symbols (i.e., HGNC) were included. To avoid confounders, genes with reported dual oncogene/TSG function (http://bioinfo.mc.vanderbilt.edu/TSGene/dual.cgi) (Zhao et al. 2016) were excluded from our analysis. A total of 52 oncogenes, 1,043 TSGs and 34,338 noncancer genes from the human genome were analyzed. We first performed permutation tests to compare the distance of TSGs and noncancer genes from oncogenes in a radius of specified distance. It was found that the mean relative distance of TSGs from oncogenes was significantly shorter than that of noncancer genes in a radius of ∼1.1–3.0 Mbp (fig. 2A). The difference was most significant at 1.46 Mbp with a p-value = 0.0001 (fig. 2B). Concordantly, an oncogene on average had a higher density of TSGs than noncancer genes normalized by the total number of genes in each chromosome (fig. 2C), suggesting that oncogenes and TSGs tend to be in close physical proximity in the human genome.
Fig. 1.
Proposed mechanism of survival advantage underlying oncogene-TSG clustering. An oncogene and a tumor-suppressor gene (TSG) in close physical proximity (denoted by A) would have a higher chance of co-amplification or co-deletion than those far apart (denoted by B) given a fixed size of gained or lost region (red color). It is conjectured that such co-amplification or co-deletion will nullify the pro-tumorigenic effect of focal copy number aberrations.
Fig. 2.
Nonrandom distribution of oncogenes and TSGs in the human genome. (A, B) The mean relative distance of TSGs from oncogenes was significantly shorter than that of noncancer genes in a radius of ∼1.1–3.0 Mbp as confirmed by permutation tests. (C) Normalized gene density of TSGs was higher than that of noncancer genes in close proximity (i.e., <1.5 Mbp) to an oncogene. Data was expressed as mean ± S.E.M.
We next determined whether the close physical proximity between oncogenes and TSGs is conserved among species by extracting the chromosomal locations of homologous oncogenes and TSGs from the mouse (a closely related species) and drosophila (a distantly related species) genomes. Consistent with the human data, the mean relative distance of TSGs from oncogenes was significantly shorter than that of noncancer genes in both species (supplementary fig. S1, Supplementary Material online for mouse; supplementary fig. S2, Supplementary Material online for drosophila), suggesting a conserved relationship.
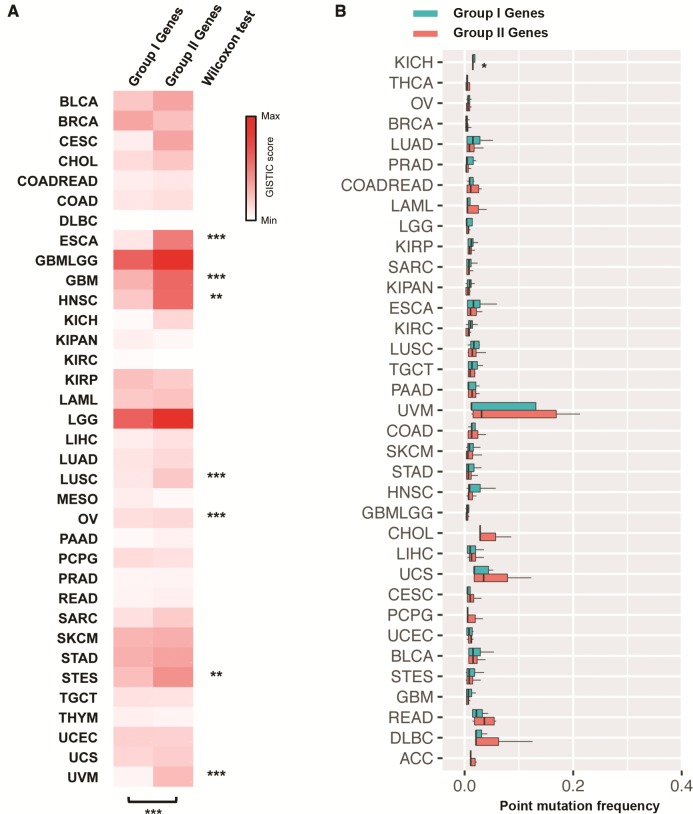
To corroborate our hypothesis, we tested whether oncogenes with one or more TSGs in a radius of 1.46 Mbp (designated as Group I oncogenes) are less prone to amplification than those without (designated as Group II oncogenes). In total, 30 out of the 52 oncogenes had at least one TSG within a 1.46-Mbp radius (supplementary table S1, Supplementary Material online). We next compared the extent of amplification in these two groups of oncogenes in terms of GISTIC score based on the segmentation data obtained from available The Cancer Genome Atlas (TCGA) studies. GISTIC is an algorithm for identifying likely driver somatic CNAs by evaluating the frequency and amplitude of observed events (Mermel et al. 2011). With this pan-cancer analysis approach, an overall significantly higher GISTIC score was observed for Group II oncogenes (P = 0.0003; Wilcoxon matched-pairs signed rank test) as compared with Group I oncogenes. GISTIC score analysis in individual cancer types also demonstrated a significantly higher score for Group II oncogenes in 7 out of the 35 cancer types (P < 0.05; Wilcoxon rank sum test; fig. 3A and supplementary table S2, Supplementary Material online). This finding suggests that oncogenes without a nearby TSG are more prone to amplification, probably as a result of positive selection during tumorigenesis of such CNAs that are presumably more oncogenic. In contrast, the frequencies of nonsynonymous point mutations between Groups I and II oncogenes were similar in all cancer types (fig. 3B) except kidney cancer (KIRC; P = 0.03). These findings suggest that proximity to a TSG only influenced the propensity of an oncogene to CNAs but not point mutations.
Fig. 3.
Effects of neighboring TSG(s) on the propensity of oncogenes to copy number alterations and nonsynonymous point mutations. (A) Oncogenes with a neighboring TSG (i.e., within a 1.46-Mbp radius; Group I oncogenes) were amplified to a lesser extent in TCGA-sequenced cancer types than those without (Group II oncogenes). Wilcoxon test was used to compare the GISTIC scores of two groups of oncogenes. *P < 0.05; **P < 0.01; ***P < 0.001 significantly different between groups. (B) Group I and Group II oncogenes exhibited similar rates of nonsynonymous point mutations in TCGA-sequenced cancer types.
In the present study, we demonstrated that oncogenes and TSGs tend to be in close physical proximity in the human, mouse, and drosophila genomes, which is reminiscent of the computational simulation results from Maley, Lewis, and Reid predicting that genome architecture is under selective pressure to move TSGs near to oncogenes (Maley et al. 2010). Nevertheless, the nature of selection on oncogene/TSG arrangements remains unclear. Oncogenes implicated in pediatric and adolescent cancers (e.g., leukemia, lymphomas, and central nervous system tumors) presumably should have been subjected to the strongest selective pressure for moving toward TSGs, implying that only a subset of cancers and genes might be relevant. The complexity is further increased by the fact that both an oncogene (e.g., MDM2) and a neighboring TSG on a neochromosome could be coamplified, but the TSG was methylated and presumably silenced (Garsed et al. 2014).
Taken together, our analysis provided the evidence of nonrandom distribution of oncogenes and TSGs in the human genome, which reiterates the importance of the dynamic interplay between oncogenesis and tumor suppression in shaping our genomic architecture. The current data also supported that the distance from a TSG is a key determinant of amplification propensity of an oncogene, shedding new light on a previously unappreciated mechanism by which TSGs antagonize oncogenes.
Materials and Methods
Calculation of Gene Distance and Permutation Test
Gene information was downloaded from Ensembl. For human genes, only genes with HGNC symbols were included for further analysis. Midpoint of each gene was determined from its start site and end site. Distance between two genes was defined as the number of base pairs between their gene midpoints. Relative distance refers to the distance of a TSG or a noncancer gene from an oncogene divided by the radius distance. The gene labels were randomly shuffled 10,000 times to generate new positions of oncogenes, TSGs and noncancer genes for the calculation of p-value.
Calculation of Normalized Gene Density
Gene density is the number of TSGs or noncancer genes in a radius of specified distance divided by the radius distance. Average density is the total number of all TSGs or noncancer genes on a particular chromosome divided by the length of that chromosome. Normalized gene density is gene density divided by average density.
Focal CNA Data
All segmentation data was collected from the TCGA open access data directory. A tumor types with CNA profiles obtained by whole-genome sequencing were included in the present study. Level 3 data was used to quantify CNA. Only amplified genes were included for GISTIC analysis.
Supplementary Material
Supplementary data are available at Molecular Biology and Evolution online.
Author Contributions
W.K.K.W. conceptualized the idea. W.K.K.W. and S.H.W. designed and managed the project. X.L. and X.W. performed bioinformatic analysis. All authors analyzed the data. W.K.K.W., X.L., X.W., and S.H.W. wrote the paper. J.Y. and M.T.V.C. revised the paper.
Supplementary Material
References
- Krijgsman O, Carvalho B, Meijer GA, Steenbergen RD, Ylstra B.. 2014. Focal chromosomal copy number aberrations in cancer-Needles in a genome haystack. Biochim Biophys Acta 1843:2698–2704. [DOI] [PubMed] [Google Scholar]
- Yoshimoto M, Ludkovski O, DeGrace D, Williams JL, Evans A, Sircar K, Bismar TA, Nuin P, Squire JA.. 2012. PTEN genomic deletions that characterize aggressive prostate cancer originate close to segmental duplications. Genes Chromosomes Cancer 51:149–160. [DOI] [PubMed] [Google Scholar]
- Beroukhim R, Mermel CH, Porter D, Wei G, Raychaudhuri S, Donovan J, Barretina J, Boehm JS, Dobson J, Urashima Met al. 2010. The landscape of somatic copy-number alteration across human cancers. Nature 463:899–905. [DOI] [PMC free article] [PubMed] [Google Scholar]
- Sulong S, Moorman AV, Irving JA, Strefford JC, Konn ZJ, Case MC, Minto L, Barber KE, Parker H, Wright SLet al. 2009. A comprehensive analysis of the CDKN2A gene in childhood acute lymphoblastic leukemia reveals genomic deletion, copy number neutral loss of heterozygosity, and association with specific cytogenetic subgroups. Blood 113:100–107. [DOI] [PubMed] [Google Scholar]
- Elsheikh S, Green AR, Aleskandarany MA, Grainge M, Paish CE, Lambros MB, Reis-Filho JS, Ellis IO.. 2008. CCND1 amplification and cyclin D1 expression in breast cancer and their relation with proteomic subgroups and patient outcome. Breast Cancer Res Treat 109:325–335. [DOI] [PubMed] [Google Scholar]
- Kawate S, Fukusato T, Ohwada S, Watanuki A, Morishita Y.. 1999. Amplification of c-myc in hepatocellular carcinoma: correlation with clinicopathologic features, proliferative activity and p53 overexpression. Oncology 57:157–163. [DOI] [PubMed] [Google Scholar]
- Hastings PJ, Lupski JR, Rosenberg SM, Ira G.. 2009. Mechanisms of change in gene copy number. Nat Rev Genet. 10:551–564. (2009). [DOI] [PMC free article] [PubMed] [Google Scholar]
- Thomas MA, Weston B, Joseph M, Wu W, Nekrutenko A, Tonellato PJ.. 2003. Evolutionary dynamics of oncogenes and tumor suppressor genes: higher intensities of purifying selection than other genes. Mol Biol Evol. 20:964–968. [DOI] [PubMed] [Google Scholar]
- Vogelstein B, Papadopoulos N, Velculescu VE, Zhou S, Diaz LA Jr, Kinzler KW.. 2013. Cancer genome landscapes. Science 339:1546–1558. [DOI] [PMC free article] [PubMed] [Google Scholar]
- Zhao M, Kim P, Mitra R, Zhao J, Zhao Z.. 2016. TSGene 2.0: an updated literature-based knowledgebase for tumor suppressor genes. Nucleic Acids Res. 44:D1023–D1031. [DOI] [PMC free article] [PubMed] [Google Scholar]
- Flicek P, Amode MR, Barrell D, Beal K, Billis K, Brent S, Carvalho-Silva D, Clapham P, Coates G, Fitzgerald Set al.. 2014. Ensembl 2014. Nucleic Acids Res. 42:D749–D755. [DOI] [PMC free article] [PubMed] [Google Scholar]
- Mermel CH, Schumacher SE, Hill B, Meyerson ML, Beroukhim R, Getz G.. 2011. GISTIC2.0 facilitates sensitive and confident localization of the targets of focal somatic copy-number alteration in human cancers. Genome Biol. 12:R41.. [DOI] [PMC free article] [PubMed] [Google Scholar]
- Maley CC, Lewis W, Reid BJ.. 2010. Has cancer sculpted the genome? Modeling linkage and the role of tetraploidy in neoplastic progression In: Diesboeck T, Stamatakos G, editors. Multiscale cancer modeling. Chapman & Hall; p. 45–66. [Google Scholar]
- Garsed DW, Marshall OJ, Corbin VD, Hsu A, Di Stefano L, Schröder J, Li J, Feng ZP, Kim BW, Kowarsky Met al.. 2014. The architecture and evolution of cancer neochromosomes. Cancer Cell 26:653–667. [DOI] [PubMed] [Google Scholar]
Associated Data
This section collects any data citations, data availability statements, or supplementary materials included in this article.


