

Summary
In eukaryotic cells, diverse stresses trigger coalescence of RNA-binding proteins into stress granules. In vitro, stress-granule-associated proteins can demix to form liquids, hydrogels, and other assemblies lacking fixed stoichiometry. Observing these phenomena has generally required conditions far removed from physiological stresses. We show that poly(A)-binding protein (Pab1 in yeast), a defining marker of stress granules, phase-separates and forms hydrogels in vitro upon exposure to physiological stress conditions. Other RNA-binding proteins depend upon low-complexity regions (LCRs) or RNA for phase separation, whereas Pab1’s LCR is not required for demixing, and RNA inhibits it. Based on unique evolutionary patterns, we create LCR mutations which systematically tune its biophysical properties and Pab1 phase separation in vitro and in vivo. Mutations which impede phase separation reduce organism fitness during prolonged stress. Poly(A)-binding protein thus acts as a physiological stress sensor, exploiting phase separation to precisely mark stress onset, a broadly generalizable mechanism.
Keywords: stress granules, membraneless organelle, heat shock, energy depletion, pH, second messenger, low-complexity region, quinary structure, RNA-binding protein, intrinsically disordered protein, poly(A)-binding protein
Introduction
Eukaryotic cells react to a wide range of stresses with a consistent set of responses: transcribing genes encoding stress-responsive proteins, slowing translation of most mRNAs, and assembling hundreds of proteins and mRNAs into massive ribonucleoprotein (RNP or mRNP) stress granules (Anderson and Kedersha, 2006; Cherkasov et al., 2013; Farny et al., 2009). Heat stress, starvation, hypoxia, treatment with sodium arsenite/arsenate/azide, and other unfavorable changes trigger stress granule formation across a wide array of organisms (Cherkasov et al., 2013; Farny et al., 2009; Jain et al., 2016; Kroschwald et al., 2015). Although stress granule composition varies somewhat by stress (Buchan et al., 2011; Wallace et al., 2015), certain proteins are consistently recruited, such as poly(A)-binding protein (PABP; Pab1 in budding yeast) (Anderson and Kedersha, 2006), an abundant RNA-binding protein which plays key roles in mRNA polyadenylation, stability, and translational control.
Stress granules fall into a large class of protein- and RNA-rich cellular structures, including germline P granules, P bodies, and nucleoli, which do not rely on membranes for their physical coherence (Brangwynne et al., 2009; Feric et al., 2016; Kroschwald et al., 2015; Molliex et al., 2015). In groundbreaking work, multiple groups have reported purified proteins (including stress-granule-associated proteins FUS, hnRNPA1/2, Whi3, and others) forming physically coherent hydrogel and phase-separated liquid states in vitro (Kato et al., 2012; Lee et al., 2015; Lin et al., 2015; Molliex et al., 2015; Mugler et al., 2016; Patel et al., 2015).
Liquids, hydrogels, dynamic fibers, colloids, and related massive networks of interacting molecules share, as a defining feature, a lack of fixed stoichiometry, unlike typical quaternary structures. Consequently, they have been termed quinary structures (Chien and Gierasch, 2014; Edelstein, 1980; Wallace et al., 2015). Formation of quinary structures often involves multivalent interactions between groups of binding partners (Li et al., 2012). Quinary interactions and colocalization into cellular-scale structures are in certain cases distinct processes. For example, stress-triggered quinary assemblies form during mild stress conditions where stress granule formation does not occur, and when stress granules are pharmacologically blocked (Wallace et al., 2015).
Many studies of quinary behaviors have focused on the role of so-called low-complexity regions (LCRs), protein sequences consisting of a biased subset of amino acids. Multivalent interactions between LCRs can suffice to cause liquid-liquid phase separation, amyloid formation, and other demixing phenomena in vitro (Boke et al., 2016; Kato et al., 2012; Lin et al., 2015; Molliex et al., 2015; Patel et al., 2015).
Phase separation by stress-granule-associated proteins in vitro have generally required conditions unrelated to stress-granule formation. Temperatures well below physiological range have been used to stimulate (Molliex et al., 2015; Mugler et al., 2016) phase separation. Hydrogel formation by RNA binding proteins (Kato et al., 2012; Molliex et al., 2015) requires high concentrations and low temperatures. These studies illuminate a range of achievable material states. However, the link between these states and physiological stresses including heat, respiratory chain inhibition, and starvation is not readily apparent.
Moreover, stress-related fitness effects arising from disrupting the quinary behavior of stress-granule-associated proteins have remained elusive. A major challenge is to identify whether and how demixing by RNA-binding proteins relates to an organism’s stress tolerance.
Toward that end, we have turned our attention to the core stress-granule marker poly(A)-binding protein itself. Like its orthologs across eukaryotes, poly(A)-binding protein (Pab1) in budding yeast consists of a short N-terminal leader sequence; four RNA-recognition motifs (RRMs); a proline-rich LCR termed the P domain that is predicted to be intrinsically disordered; and a C-terminal peptide binding domain. Pab1 is known to self-interact (Yao et al., 2007), although this behavior has not been linked to stress or to phase separation. We show that Pab1 phase-separates and gels in response to physiological thermal and pH stresses, a demixing process that is modulated by the P domain but does not require it. Extracting information from unusual evolutionary patterns, we make mutational perturbations which systematically alter the temperature onset of phase separation in vitro and demixing in vivo. Mutations which reduce the thermal and pH sensitivity of Pab1’s demixing reduce fitness during growth at high temperature and during energy depletion, indicating that demixing is adaptive. Together, our results illuminate a uniquely complete path from evolved sequence features, to phase separation, to stress-triggered demixing, and finally to organism fitness during stress.
Results
Pab1 forms RNase-resistant quinary assemblies in vivo during heat stress
Pab1 shows diffuse localization under favorable growth conditions (near 30°C), and localizes to stress granules—large cytosolic foci—within minutes of a shift to 46°C (Fig. 1A). At 42°C, Pab1 is not recruited to stress granules detectable by standard fluorescence microscopy (Fig. 1A, (Cherkasov et al., 2013; Wallace et al., 2015)).
Figure 1. Heat stress triggers formation of RNase-insensitive Pab1 quinary assemblies, separable from stress granule formation.

A, Confocal fluorescent microscopy images of diploid strains, containing Pab1-mRuby2 and Pab1-Clover, showing Pab1-mRuby2 after 8-minute incubation at the indicated temperatures. Arrow indicates a stress granule. B, Pab1 western blot after 10-minute heat shock of wild-type cells. Lysed samples were incubated with or without RNase1, then progressively fractionated at 8,000g and 100,000g yielding pellets (P8 and P100, respectively) and remaining supernatant (S). C and D, Quantification of B where each fraction is normalized to the total intensity in all fractions. Red or black indicate RNase1 or buffer treatment, respectively.
Consistent with these results, after 10 minutes at 42°C, pelletable quinary assemblies of Pab1 formed in the absence of Pab1-marked stress granules (Fig. 1). After a more severe shock at 46°C, a greater proportion of Pab1 is recruited into small and large sedimentable assemblies (Fig. 1) coincident with stress-granule formation.
Pab1 may form quinary assemblies by binding to RNA or through protein-protein interactions. To distinguish between these, we measured Pab1 pelleting after RNase treatment (Fig. 1B). Pelletable Pab1 from cells grown at 30°C was largely liberated by RNase (Fig. 1B,C). By contrast, RNase had little effect on assemblies formed at 42°C, and no effect after 46°C shock (Fig. 1D). Mirroring RNase-resistance observed in yeast and mammalian stress granules ex vivo (Jain et al., 2016), our data indicate that both pre-granular quinary assemblies and stress-granule-associated Pab1 are RNase-resistant.
Either the quinary assemblies of Pab1 in vivo do not depend on RNA for their integrity, or stabilizing RNAs are efficiently protected from RNase cleavage. We therefore asked how Pab1 demixing depended upon RNA in vitro.
Pab1 demixing is promoted by physiological stress-related conditions in vitro and inhibited by RNA
We purified recombinant yeast Pab1 from E. coli and assessed Pab1 demixing in vitro under physiological conditions (see Methods). We first asked how Pab1 responded to heat stress with and without polyadenylate RNA, monitoring the soluble fraction by gel filtration and the insoluble fraction on a denaturing gel. We found that 15μM Pab1 (physiological ~20 μM, see Methods) was soluble at 30°C, but demixed to form large particles after a 46°C, 30-minute treatment (Fig. 2A,B). Pab1 binds 12 nucleotides of poly(A) RNA with full affinity and protects a footprint of roughly 25 nucleotides (Sachs et al., 1987). To promote 1:1 binding, we incubated Pab1 with a small excess of 19-mer polyadenylate RNA (A19). After shifting to 46°C for 30 minutes, Pab1:RNA complexes partially dissociated, with the free protein demixing into large particles and the released A19 returning to the free pool (Fig. 2A,B). These results indicate that Pab1 releases RNA and demixes, forming particles stabilized by protein-protein interactions, consistent with its behavior in vivo (Fig. 1).
Figure 2. Purified Pab1 demixes in response to thermal shock, releasing RNA with small changes in secondary structure.
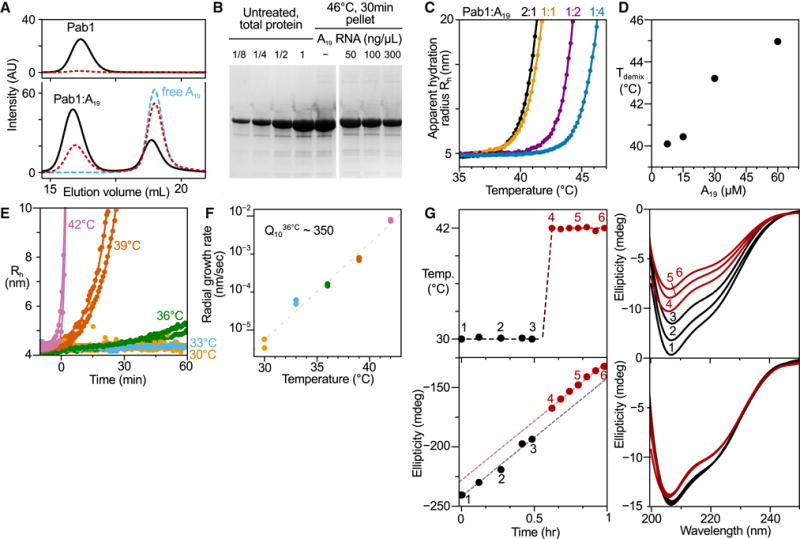
A, Top, size-exclusion chromatography trace of Pab1 after 30°C incubation (black) and after heating at 46°C for 30 min (red). Below, Pab1 with ~2:1 excess of A19 RNA treated identically. Blue trace shows A19 alone. B, Pab1 total-protein dilution for calibration (left) and pelleted material after heating with and without RNA (right), Coomassie-stained. C, DLS temperature ramp experiments of Pab1 with indicated protein to RNA ratios. D, Tdemaix at RNA concentrations from C. E, Kinetics of Pab1 assembly monitored by DLS after a temperature jump (cf. Fig. S1). F, Rate of hydration radius growth from E with the accompanying average Q1036°C value. G, Temperature jump of 0.2 μM Pab1 (top left, with numbered full-scan timepoints indicated) and accompanying CD spectra (top right). Total ellipticity between 210-250nm (bottom) shows linear temperature-independent signal attenuation used to scale scans to time zero (bottom right) (Fig. S2).
To obtain more-sensitive measurements, we used dynamic light scattering (DLS) and monitored the apparent hydration radius (Rh) of a 15 μM Pab1 solution during a slow (0.25°C/min) temperature ramp in the presence of increasing amounts of A19. Rapid particle growth in a narrow temperature window indicated the onset of demixing. We define the demixing temperature (Tdemix) as the temperature at which the apparent hydration radius doubles relative to its baseline value. Anticipating results below, Tdemix represents a measure of the lower critical solution temperature (LCST), above which the solution separates into protein-rich and protein-depleted phases. Adding RNA increasingly inhibited Pab1 demixing (Fig. 2C–D).
Alone, Pab1 remained monomeric in shifts up to 33°C (Fig. 2E); at these temperatures, S. cerevisiae grows robustly. When shifted to 36°C and above, the onset of the heat-shock response, Pab1 demixed at increasing rates such that by 42°C, where Pab1 in vivo assemblies are detectable after 10 minutes (Fig. 1B), in vitro demixing occurs within seconds (Fig. 2E). Demixing halted but did not reverse when the temperature was returned to 30°C, indicating lack of self-propagation of quinary assemblies and undetectable reversibility at these timescales (Fig. S1).
The remarkable acceleration in Pab1 demixing over a few degrees can be quantified by the temperature coefficient, Q10, the ratio of biological properties measured 10 degrees apart (see Methods) (Kang et al., 2012; Sengupta and Garrity, 2013). Typical biological processes have a Q10 of 2 to 4. The radial growth rate of Pab1 assemblies shows a Q1036°C of ~350 (Fig. 2F), placing a conservative lower bound on the volume growth rate.
Pab1 does not thermally denature prior to heat-induced demixing in vitro
To monitor temperature-dependent structural changes of Pab1 in vitro, we used far-UV circular dichroism (CD) spectroscopy. A dilute sample (0.2μM, to inhibit demixing) was scanned at 30°C for 30 minutes, shifted to 42°C, and scanned for a further 30 minutes (Fig. 2G). The CD signal linearly decreased with time at both temperatures following similar kinetics, consistent with adsorption to the cuvette (Fig. 2G). To account for this effect, we linearly extrapolated each scan to time zero yielding scaled spectra (Fig. 2G, bottom right). At both 30°C and 42°C, the CD spectrum has a broad negative signal between 200–230 nm, consistent with a largely α/β protein. The spectrum at 42°C shows slightly reduced signal between 205–230 nm, inconsistent with global denaturation but compatible with a limited conformational change. A similar decrease is seen in the corresponding measurement for RRM1-3, which also undergoes phase separation (Fig. S2A–B). In vitro demixing does not involve a cooperative global unfolding transition by the bulk of the Pab1 molecules, although different effects may occur in vivo.
Pab1 quinary assemblies form by phase separation and gel formation
To examine the physical forces contributing to Pab1 demixing, we asked how changes in ionic strength and pH affected demixing. At or below physiological ionic strength, Pab1 demixed readily at 46°C. At higher salt concentrations, however, demixing was almost completely inhibited (Fig. 3A and Fig. S3A–C), suggesting an electrostatically mediated process. Demixing was also pH-dependent, with demixing inhibited above physiological pH values (pH ~7 during exponential growth, 6.5 or lower following heat shock). Below pH 5.5, normal growth temperature (30°C) sufficed to induce demixing (Fig. 3A).
Figure 3. Pab1 demixing proceeds via liquid-liquid phase separation and gel formation, modulated but not caused by its low-complexity region.
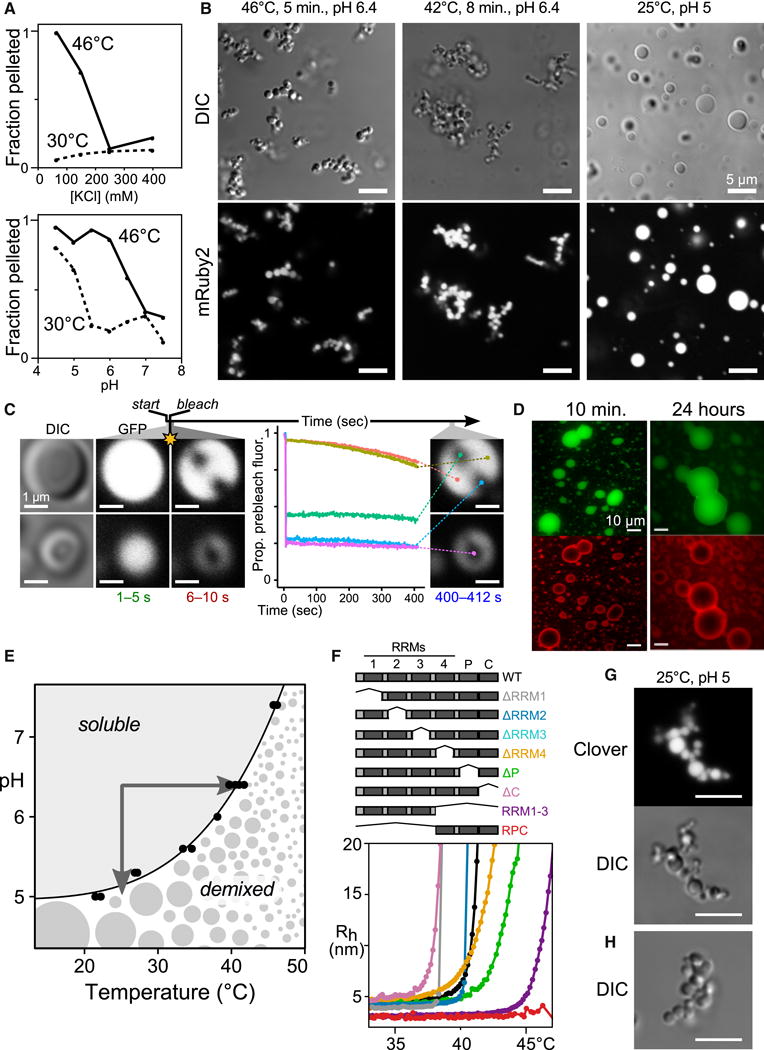
A, Demixing of purified Pab1 is sensitive to ionic strength and pH (Fig. S3) B, Morphology of 15 μM Pab1-mRuby2 assemblies. C, Fluorescence recovery after photobleaching of Pab1 droplets. D, Sequentially assembled two-color droplets remain unmixed after 24 hours. E, The Tdemix of Pab1 measured at different pH values defines a phase boundary. F, Pab1 domain deletions and corresponding DLS temperature ramps (Table S1). G, H, Morphology of Pab1ΔP quinary assemblies. G, 15 μM 100:3 Pab1ΔP:Pab1-Clover; H, 15 μM Pab1ΔP alone.
To visualize Pab1 quinary assemblies, we doped a fluorescent Pab1-mRuby2 fusion at 1:20 ratio into a solution of unlabeled Pab1, triggered demixing, and imaged the sample at room temperature within 1−2 minutes. Examination of the resulting assemblies revealed branched clusters of micron-scale spherical droplets after heat-induced demixing (Fig. 3B) which varied in size in untagged samples (Fig. S3D), and spherical droplets after pH-induced demixing (Fig. 3B). Denaturation of Pab1 at low pH produced grainy, amorphous particles rather than droplets (Fig. S3E). Spherical droplets and the appearance of droplets wetting the microscope slide (Fig. S3F) revealed the existence of a liquid phase at some time, indicating an initial phase separation.
The persistence of clusters indicated that droplets did not coalesce even when in contact, similar to behavior observed in other studies (Lin et al., 2015; Molliex et al., 2015). To measure the internal dynamics of pH-induced Pab1 droplets, we performed fluorescence recovery after photobleaching (FRAP) experiments. No significant recovery occurred over nearly 7 minutes (Fig. 3C). To examine longer timescales, we triggered phase separation in a 1:20 Clover (green):unlabeled Pab1 solution, waited 5 minutes, then added 1:20 mRuby2 (red):unlabeled Pab1 solution, forming two-layer droplets. Layers remained intact over 24 hours, indicating little or no mixing (Fig. 3D).
Plotting Pab1 demixing temperatures observed in temperature-ramp light-scattering experiments at varying pH reveals a continuous phase boundary passing through the physiological ranges of these parameters. Crossing this boundary either by raising temperature or lowering pH (Fig. 3E, arrows) causes demixing.
Deletion of the proline-rich LCR reduces Pab1 phase separation in vitro
We then probed the contributions of each of Pab1’s six domains to phase separation by purifying deletion variants (Fig. 3F, Table S1). DLS temperature-ramp experiments revealed that each construct self-associated in a narrow (~1°C) temperature range, consistent with phase separation. All single domain-deletion mutants still demixed by 50°C (Fig. 3F and Fig. S2C). Nevertheless, the deletion of the P domain had the greatest positive effect on Tdemix (Fig. 3E). We split Pab1 into its N- and C-terminal halves, RRM1-3 and RRM4-P-C (RPC). RRM1-3 demixed, whereas RPC did not up to 50°C (Fig. 3E and Fig. S2B). These observations reinforce the finding that the P domain is not required for phase separation.
Because the Pab1ΔP lacks an LCR yet retains the ability to phase-separate, we examined its assembly morphology by microscopy. Pab1ΔP assemblies largely retained the droplet-cluster morphology of full-length Pab1 quinary assemblies (Fig. 3G, H). Together, these results point to an electrostatically driven phase-separation dependent on molecular determinants in the RRM regions, which is enhanced, but not solely caused, by the P domain.
Natural selection shapes usage of hydrophobic residues in Pab1’s low-complexity region
To identify the features of the P domain that might enhance demixing, we examined its sequence (Fig. 4A). As the P domain’s name implies, this LCR is rich in proline (19% vs. a yeast-proteome-average 4%) along with methionine (10% vs. 2%) and glycine (14% vs. 5%), and depleted in charged amino acids (Fig. 4B, Fig. S4A). The rest of Pab1(Pab1ΔP) exhibits similar amino-acid frequencies to the proteome average, as did a set of intrinsically disordered regions (IDR) from DisProt (Sickmeier et al., 2007) (minimum pairwise rank correlation r=0.72, P<10−3 between each of these three sets vs. maximum r=0.19, P=0.41 between these and P domain). IDRs tend to be proline-rich (Fig. 4B). Methionine enrichment, by contrast, we found surprising. The P domain’s fractional methionine content is 5.5-fold higher than the median IDR, and greater than 97.5% of these regions.
Figure 4. Evolutionary analysis reveals rapid exchange between aliphatic residues in poly(A)-binding protein’s proline-rich low-complexity region.
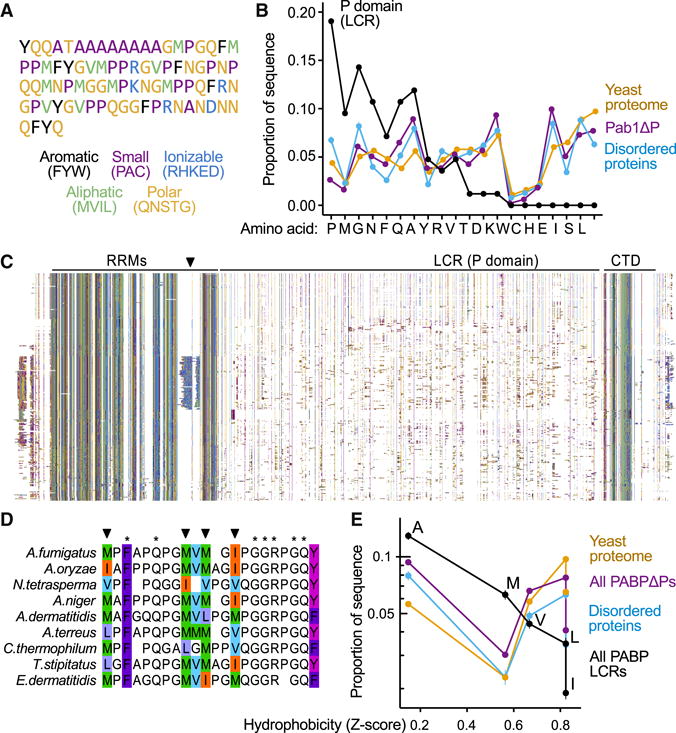
A, The low-complexity P domain of S. cerevisiae Pab1 colored by amino acid types. B, Amino acid usage in the P domain, ordered by enrichment relative to the rest of Pab1 (Pab1ΔP). Usage for all yeast proteins, and for disordered sequences curated by DisProt, are shown for comparison. C, A diverse alignment of 295 PABPs (pruned for clarity of display from 351) indicating locations of the RRMs, P domain, and CTD where each column is a residue, colored as in A, and each row is a species. White spaces are alignment gaps. The figure contains no text. A black triangle marks a clade-specific insertion in RRM4. D, A subset of fungal species and a portion of the P domain from the alignment in C containing multiple sites where aliphatic residues (colored to show differences) exchange rapidly while nearby positions (starred) remain invariant. E, In the P domain, but not in general, aliphatic residue frequency negatively correlates with residue hydrophobicity. The mean aliphatic residue usage in the aligned set of P domains, remainder of PABP, disordered sequences from DisProt, and the yeast proteome are shown, colored as in B. Cf. Fig. S4. Error bars throughout show standard error on the mean.
We turned to an evolutionary analysis, first asking whether these methionines are conserved across species. We constructed a diverse alignment of 351 poly(A)-binding protein orthologs. All but one possess a proline-enriched region, indicating that the P domain’s existence is highly conserved (Fig. 4C; Fig. S4B,C). While profound length variation in these orthologous regions (Fig. S4B) renders them unalignable, within groups of closely related species where many sites show perfect conservation, no methionine residues are conserved; instead, medium/long-chain aliphatic residues (M, V, I, L) frequently replace each other (Fig. 4D).
Rapid yet restricted exchange of aliphatic residues over evolutionary time is consistent with natural selection acting on the hydrophobicity associated with aliphatic composition, rather than site-specific residue identities. To look for a signature of selection, we examined the relationship between aliphatic amino acid frequency and hydrophobicity for the P domain finding strikingly strong log-linear negative correlation in P domains (Fig. 4E) which was consistent (Figs. S4D,E, median r = −0.82; 98% of PABP LCRs show r < −0.25) and not reflected in the rest of the polypeptide (r = −0.36; 69%), the yeast proteome (r = 0.32; 6%), or in DisProt disordered regions (r = −0.06; 31%). The correlation was reliably stronger than in any of the alternative sets (Fig. S4E, pairwise Wilcoxon rank sum tests P<10−6). These controls indicated that neither local or global biases in sequence composition, nor unusual pressures on disordered domains in general, explain the above observations. We conclude that natural selection has shaped the relationship between residue hydrophobicity and usage among aliphatic residues in the P domain, implying an accompanying fitness advantage.
Hydrophobic forces drive collapse of the proline-rich low-complexity region
The results of the evolutionary analysis above led us to ask how altering the evolutionarily conserved features of the proline-rich LCR alters its biophysical and biological properties. To systematically alter the P domain’s hydrophobic composition, we made mutant sequences in which all instances of a residue were replaced with another, such as MV→X, where all eight methionines and four valines were replaced with I (most hydrophobic), with L, V, M, and with A (least hydrophobic).
We purified the P domain in isolation and, for the wild type and mutants, as a fusion to a small expression tag, a highly stable variant of protein G (Skinner et al., 2014). The CD spectrum of the unfused wild-type P domain is typical of a denatured protein (Fig. 5A), and we observe no cooperative thermal unfolding transition from 4 to 80°C. We conclude that, like many LCRs, the P domain is disordered and lacks stable secondary structure.
Figure 5. The P domain is unstructured and displays hydrophobicity-dependent compaction.
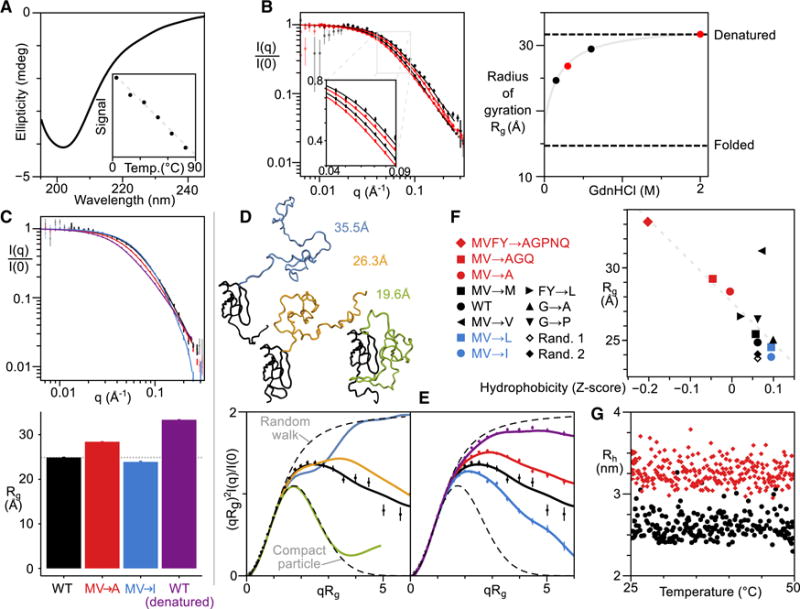
A, CD spectrum of the P domain (without His8 tag) at ~1μM, 20°C. Inset, the temperature dependence of the average CD signal from 215–235 nm. B, SAXS of P domain (with His8 tag) at denaturant (GdnHCl) concentrations shown at right. Inset highlights the mid-q region. Corresponding Rg values are plotted; gray line shows extrapolation to zero denaturant (see Methods). Dashed lines correspond to approximate values for denatured proteins and folded proteins. C, SAXS of tagged P domain for WT (black), MV→I (blue), MV→A (red), and WT in 2 M GdnHCl (purple) (the hyperstable expression tag remains folded) with corresponding Rg values below. D, Top, model fusion conformations where the P domain is extended, (self-)collapsed, or collapsed around the expression tag (black) with corresponding P domain models highlighted in blue, yellow, and green, respectively. Dashed lines show profiles expected for a random walk and compact (Guinier) particle. The Rg for the fusion is indicated. Bottom, dimensionless Kratky plots for the three models. E, Dimensionless Kratky plots for SAXS curves shown in C. F, Correlation between hydrophobicity and Rg for all P domain mutant constructs. G, DLS of WT and MVFY→AGPNQ fusion variants in black circles and red diamonds, respectively. For SAXS plots in B–E, error bars show standard error on the mean within bins spaced equally on a log (B,C) or linear scale (D,E).
Using small-angle X-ray scattering (SAXS), we then probed the size and shape of the P domain. The estimated radius of gyration (Rg) in water is roughly half that of the chain in high levels of denaturant, 2 M guanidinium chloride (GdnHCl) (Fig. 5B). The expression-tag fusion had a larger Rg than the P domain alone (Fig. 5C). To extract information about the shape of the P domain from the SAXS data, we built models of the fusion with three different P domain conformations: extended, compact, or contacting the expression tag (Fig. 5D). The SAXS data are best described by the middle option where the P domain is largely non-interacting with the expression tag, but compact. The tagged P domain has an Rg of ~20Å (Fig. 5D), matching the value for the isolated P domain. We conclude that this LCR adopts a compact conformation.
The intramolecular interactions that cause P domain compaction may also contribute to intermolecular interactions that influence phase separation. We therefore examined the influence of aliphatic composition on the degree of compaction. Reducing hydrophobicity with MV→A substitutions increased the domain’s Rg, while increasing hydrophobicity with MV→I substitutions decreased Rg (Fig. 5C). Corresponding hydrophobicity-dependent compaction is apparent in the shape of the domains (Fig. 5E).
To examine how non-aliphatic hydrophobic residues, the aromatic residues F and Y, contribute to collapse, we mutated all hydrophobic and aromatic residues to a selection of polar groups, MVFY→AGPNQ. This polar mutant had an Rg indistinguishable from that of the denaturant-treated wild-type P domain (Fig. 5F). An FY→L mutant showed only a small expansion entirely consistent with the small reduction in hydrophobicity in this mutant (Fig. 5F), ruling out strong aromatic-specific effects on compaction. Indeed, with the exception of the M→V mutant, altering the net hydrophobicity produce well-correlated changes in domain compaction across multiple sets of mutations (Fig. 5F).
Domain collapse persisted after mutation of 12 glycines to bulkier, less-flexible alanines (G→A) or prolines (G→P), and after randomization of the wild type sequence (Fig. 5F). Interactions driving compaction are not glycine-dependent and unlikely to be specific or structured.
Neither the wild-type P domain nor the MVFY→AGPNQ mutant showed significant change in Rh between 25°C and 50°C, and no evidence of self-association (Fig. 5G). This supports other results (Fig. 3E) indicating that the P domain promotes but does not cause phase separation.
In summary, intramolecular hydrophobic interactions cause biophysical collapse of the low-complexity P domain, which is itself largely temperature-insensitive. These results prompt the question of how these interactions influence stress-induced demixing.
P domain hydrophobicity modulates Pab1’s phase boundary and in vivo demixing
We measured the Tdemix of phase separation for a variety of full-length Pab1 constructs using DLS. MV→I substitutions decreased Tdemix by 1.6°C, while MV→A changes increased it by 2.2°C, virtually equivalent to the behavior seen when the P domain is deleted (Fig. 6A). Demixing temperatures of full-length Pab1 variants correlate with the corresponding P domain variants’ Rg (Spearman r=0.93, Fig. 6B, Table S1), linking monomer biophysical characteristics to demixing behavior. Measuring the demixing behavior of the MV→I and MV→A mutants as in Fig. 3E revealed that evolutionarily motivated mutations systematically shifted the phase boundary relative to the wild type, yielding greater and lesser thermal and pH sensitivity, respectively (Fig. 6C).
Figure 6. Hydrophobicity of the P domain modulates Pab1 demixing in vitro and in vivo, and alters yeast growth during stress.
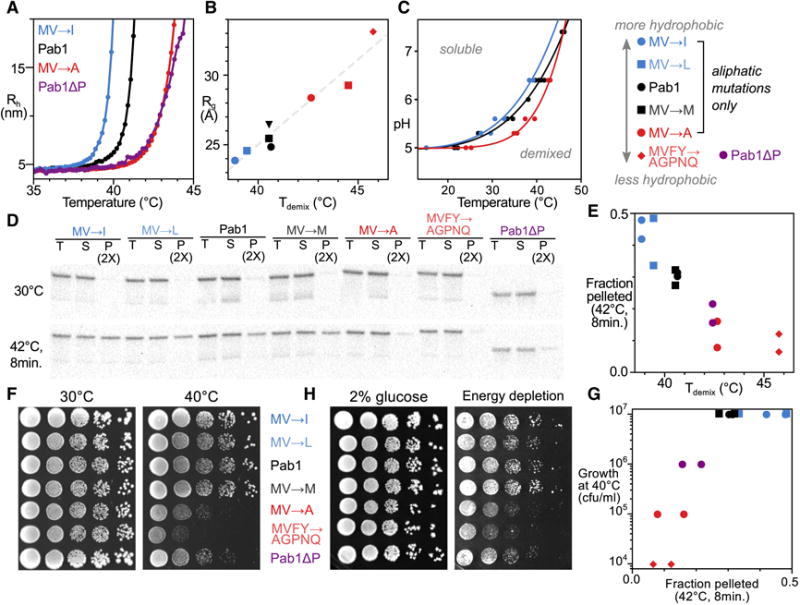
A, DLS temperature ramp experiments of listed P domain mutant constructs in Pab1 background, with Pab1 and Pab1ΔP, all at pH 6.4. B, Correlation between compaction of the P domain (Rg, Fig. 5) and Tdemix at pH 6.4 (Table S1). C, Altering the hydrophobicity of the P domain shifts the phase boundary. D, In vivo variation in Pab1 demixing between P-domain mutants assess by anti-Pab1 western blot. T(otal), S(oluble) and P(ellet) lanes are shown for yeast treated as indicated. RNase A was added to to lysates before fractionation at 20,000g. Total protein loading control and replicate in Fig. S5. E, Comparison between in vitro Tdemix of Pab1 at pH 6.4 and in vivo pellet fractions after stress as in D from two biological replicates. F, Colony formation assay of yeast strains containing mutations in the P domain. Plates were incubated at 30 and 40°C for 4 days. Columns are 10-fold dilutions. G, Comparison between in vivo pelleting of Pab1 and yeast strain growth at 40°C. H, Colony formation assay of yeast strains when challenged with energy depletion (4.2 mM 2-deoxyglucose and 0.42 μM antimycin A) grown at room temperature for 5 days (Fig. S6).
We next asked how Pab1 mutations which modulate in vitro phase separation alter in vivo demixing. After integrating P domain variants into the single chromosomal copy of the PAB1 gene (Key Resources Table), we quantified Pab1 demixing into quinary assemblies at 30°C and after a 42°C, 8-minute shock as in Fig. 1 (Fig. 6D and S5). Tdemix, which quantifies the heat-sensitivity of phase separation in vitro, correlates strongly with heat-triggered Pab1 demixing in vivo (Fig. 6E, Spearman r = −0.94). Pelleting of another assembling protein, Yef3, does not vary (Fig. S5A and B) (Wallace et al., 2015). Pab1 variants with an in vitro Tdemix above 42°C show negligible demixing after a 42°C heat shock in vivo.
Together, the tight relationships between consequences of in vitro and in vivo perturbation provide strong evidence that Pab1 phase-separates in vivo during heat shock, with temperature sensitivity modulated by its low-complexity region.
Reducing Pab1 stress-triggered phase separation reduces yeast fitness during stress
We next examined the relationship between demixing and yeast stress tolerance using our battery of P domain variants. Yeast were grown under normal (30°C) and heat-shock conditions (40°C). All six variants studied display growth behavior at 30°C equivalent to the wild type, despite Pab1’s essential role (Fig. 6F). Strikingly, only the three variants whose phase separation occurs at temperatures substantially above that of the wild type (MV→A, MVFY→AGPNQ, and ΔP) showed reduced fitness under heat shock conditions (Fig. 6G). The unperturbed behavior of MV→I and MV→L variants indicates that changing the identity of these 12 aliphatic residues is both tolerable and has no apparent stress-dependent phenotype. The phenotype emerges when these residues are mutated to reduce their hydrophobicity. Returning plates to 30°C caused all strains to resume growth, indicating that mutant cells suffer a reversible fitness defect rather than death (Fig. S6A). The mutant effects are genetically dominant (Fig. S6B).
To determine whether this effect would generalize to a non-thermal stress, we challenged cells with energy depletion by treating them with the glycolysis inhibitor 2-deoxyglucose (2-DG) and the respiratory chain inhibitor antimycin A. Dual treatment or 2-DG alone induces a cytosolic pH drop (Dechant et al., 2010; Munder et al., 2016), and glucose deprivation triggers formation of Pab1-marked stress granules in yeast (Buchan et al., 2011; Yang et al., 2014). Phase-separation-defective strains again showed stress-induced growth defects (Fig. 6H) in an inhibitor-concentration-dependent manner (Fig. S6C).
We conclude that Pab1’s phase separation during stress is an adaptive response. Altered stress tolerance correlates with altered quinary assembly formation in vivo, phase separation in vitro, P domain hydrophobicity, and P domain compaction in the monomer, revealing connections between each phenomenon.
Discussion
How do cells sense stress? What are the relationships between phase separation of individual proteins, stress granule formation, and the ability to tolerate stress? How do intrinsically disordered regions promote phase separation? We have discovered that yeast’s poly(A)-binding protein, Pab1, senses stressful temperatures and stress-associated pH changes autonomously, phase-separating in a way that helps yeast cells grow during stress. Evolutionarily tuned hydrophobic interactions in Pab1’s proline-rich, intrinsically disordered low-complexity region modulate the phase boundary rather than causing demixing.
Phase-separated Pab1 rapidly gels, mirroring the solid-like, non-amyloid character of stress granules in yeast (Kroschwald et al., 2015). Pab1 hydrogels, however, are distinct from previously reported RNA-binding-protein hydrogels (Kato et al., 2012; Molliex et al., 2015) in that they form at physiological concentrations and do not require a low-complexity region. Slow solidification of liquid phases over hours has been reported (Lin et al., 2015; Patel et al., 2015), again distinct from the rapidly forming hydrogels we observe.
That a core marker of stress granules phase-separates in response to physiological stress cues provides compelling support for the broader hypothesis that phase-separation phenomena underlie adaptive reorganization of cellular matter in response to environmental change. Groundbreaking work has focused on phase separation as a mechanism to compartmentalize an otherwise well-mixed milieu (Feric et al., 2016; Hyman et al., 2014; Li et al., 2012; Su et al., 2016). The sharp spatial boundaries delineated by phase separation serve to localize and partition molecules that may collaborate functionally, as in the case of membraneless organelles (Feric et al., 2016) or compartmentalized signaling molecules (Su et al., 2016).
Pab1’s phase separation is distinct from its coalescence into well-defined cellular bodies (stress granules). In yeast, evidence in vitro (here) and in vivo (Kroschwald et al., 2015) indicates that Pab1 does not form sustainably fluid compartments under physiological conditions. Rather than defining key spatial boundaries, we find that Pab1’s phase separation delineates sharp thermal and pH boundaries of profound biological importance to the organism.
Stress sensing by phase separation of an RNA-binding protein
We find that Pab1’s phase boundary depends strongly on temperature and pH in the physiological ranges of these parameters. Temperature is an environmental stress which Pab1 can sense directly. pH is a second messenger for glucose starvation (Dechant et al., 2010; Munder et al., 2016), and drops in cytosolic pH reliably follow a wide range of cellular stresses (Weigert et al., 2009). Pab1 LCR variants with reduced thermal and pH-dependent demixing in vitro, and reduced thermally induced demixing in vivo, show compromised growth during thermal and energy depletion stress; we speculate, but have not demonstrated, that these mutants will show differential demixing in energy-depleted cells. Using phase separation, Pab1 synthesizes varying thermal and pH signals into a unified quinary response.
The molecular processes by which eukaryotic cells sense temperature remain surprisingly murky (Sengupta and Garrity, 2013). In budding yeast, which lack the thermosensing channels found in animals, a longstanding model mechanism has been that a molecular chaperone represses the heat-shock transcription factor under non-shock conditions, and misfolded proteins titrate away this repressor, activating a response (Morano et al., 2012). Notably, misfolded proteins act as the temperature sensors in this model. However, no specific misfolded protein has been identified in eukaryotes. Stress-triggered phase separation of Pab1 and other proteins can substitute for misfolded proteins in this model.
Pab1’s thermally induced, adaptive phase separation shows temperature-sensitivity unmatched by other systems. The most sensitive previously described ratiometric change in a biological property over a 10-degree range (Q10) for a thermosensing-relevant molecular process is ~200, observed for the conductance change in the Anopheles gambiae mosquito’s AgTRPA1(B) thermosensing cation channel (Kang et al., 2012). By comparison, the Q10 of ~350 for growth rate of Pab1 quinary assemblies at the onset of heat stress is remarkable. We speculate that phase-separation-based environmental sensing may be broadly exploited by cellular life.
Discovery of quinary stress sensing may also help catalyze an ongoing conceptual shift in the study of proteotoxic stresses. The standard model holds that such stresses disrupt protein folding, producing toxic aggregates of misfolded, non-functional proteins in need of refolding or destruction (Vabulas et al., 2010). Alternatively, apparent “aggregation” may reflect the evolved, stress-responsive demixing of a wide range of cellular proteins (Cherkasov et al., 2013; Wallace et al., 2015). We have argued that the key method to distinguish misfolding from quinary assembly formation (which may involve unfolding) lies in fitness: misfolding is deleterious, whereas evolved quinary assembly formation is adaptive (Wallace et al., 2015). Here, the results are clear: impeding Pab1’s “aggregation” during stress compromises fitness during stress. Pab1 demixing is adaptive. The implication is that the dozens of other endogenous, mature proteins that form reversible assemblies during stress constitute a vast, distributed sensory system for adaptively reorganizing cellular matter.
LCRs as biophysical modulators of phase separation
A fundamental principle underlying the phase separation of biological molecules is multivalency, the capacity to interact with multiple partners simultaneously (Li et al., 2012). Previous work on RNA-binding proteins has demonstrated phase separation requiring either an LCR or RNA (Kato et al., 2012; Lin et al., 2015; Molliex et al., 2015; Mugler et al., 2016; Patel et al., 2015; Zhang et al., 2015). We find that, in contrast to these systems, RNA interferes with Pab1 phase separation, and Pab1’s LCR is both dispensable for phase separation and unable to cause phase separation under physiological conditions in the context of its flanking domains.
Atypically for intrinsically disordered regions, poly(A)-binding protein’s LCR has few charged residues, and contains many non-aromatic hydrophobic residues whose relative frequencies appear to have been shaped by natural selection. Previous work has focused on the roles of aromatic and charged-residue interactions in promoting IDR-mediated phase separation (Brangwynne et al., 2015). Complementing work demonstrating cooperativity between LCR- and RNA-mediated phase separation (Lin et al., 2015; Molliex et al., 2015), we demonstrate the ability to tune Pab1’s domain-mediated phase separation by dialing up or down the hydrophobicity of its aliphatic LCR residues. While a detailed mechanism is not yet clear, it seems plausible that temperature-dependent desolvation (Wuttke et al., 2014), charge-patch interactions (Pak et al., 2016) between multivalent RRMs enhanced by pH-modulated histidine protonation, and limited conformational change collaborate to cause phase separation.
How does Pab1’s LCR modulate demixing? Any mechanism must incorporate both the profound links between hydrophobically mediated P domain compactness and phase separation, and the lack of P domain self-association at physiological Pab1 concentrations. We propose that Pab1 phase separation brings the associated P domains to high concentration, where they swap hydrophobic intramolecular interactions for intramolecular interactions, boosting the net affinity between Pab1 molecules (Fig. 7). Enhancing hydrophobic interactions thus boosts both domain compactness and demixing, while reducing hydrophobic interactions does the opposite.
Figure 7. Model for poly(A)-binding protein stress-triggered phase separation.
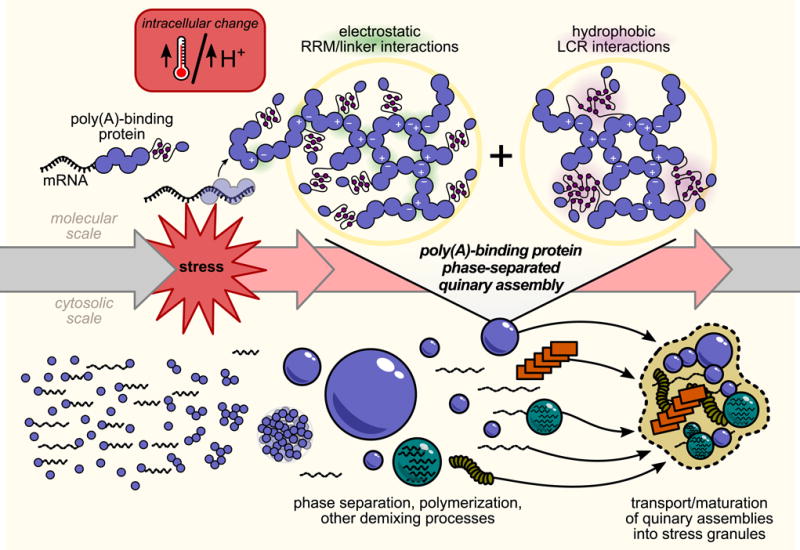
Under non-stress conditions, poly(A)-binding protein (Pab1) is bound to RNA. Either directly through thermal shock, or indirectly through a stress-induced cytosolic pH drop, stress triggers RNA release and phase separation by Pab1. Phase separation is mediated by electrostatic interactions between RNA-binding regions which compete with RNA binding. Hydrophobic residues in Pab1’s low-complexity region, intramolecularly engaged in the monomer, form intermolecular interactions which promote the phase-separated state at reduced temperatures. Under conditions of severe stress, Pab1 and other quinary assemblies are localized to stress granules in a separate cell-biological process.
An adaptive role for phase separation in stress sensing
How does Pab1 phase separation promote cellular adaptation to growth during stress? Uncovering the precise mechanism will require further study. We hypothesize that Pab1 represses mRNAs contributing to stress adaptation, that stress-induced demixing relieves this repression, and that disassembly during recovery restores repression.
Outlines of a specific mechanism emerge from four results. First, poly(A)-binding protein acts as a translational repressor of its own and other mRNAs by binding A-rich tracts in the 5’UTR (Kini et al., 2016); second, several major molecular chaperones possess evolutionarily conserved A-rich tracts in their 5’UTRs (Lindquist and Petersen, 1990); third, these molecular chaperones are required for efficient disassembly of Pab1 quinary assemblies, which precedes resumption of translation and growth (Cherkasov et al., 2013; Kroschwald et al., 2015); and fourth, our study reveals that Pab1’s phase separation competes with RNA binding, consistent with RNA release during stress.
Synthesizing these results, we speculate that upon stress, Pab1 phase-separates, releasing chaperone mRNA 5’UTRs and permitting higher levels of translation. The chaperones produced disperse Pab1 quinary assemblies. Resolubilized Pab1 rebinds 5’UTRs, represses chaperone translation, and so completes an autoregulatory circuit. If Pab1 demixing is slowed, free Pab1 continues to repress chaperone transcripts during stress, preventing dismantling of quinary assemblies of dozens of proteins required for growth. As noted above, all of these behaviors likely apply during a range of stresses, with second messengers like pH providing triggers for demixing.
Any mechanism must address an important fact: quinary assemblies of Pab1 do not observably reverse in vitro on physiological timescales, and stress-induced ATPases facilitate their dispersal in vivo. We hypothesize that facilitated dispersal will prove a common feature of stress-responsive quinary circuitry: it links resumption of normal cellular processes to the production of an effective stress response, not simply the end of stress, a crucial distinction.
STAR Methods
CONTACT FOR REAGENT AND RESOURCE SHARING
Correspondence: dadrummond@uchicago.edu (D.A.D.)
EXPERIMENTAL MODEL AND SUBJECT DETAILS
Strain construction
Pab1 P-domain swaps
Saccharomyces cerevisiae strains with substituted P-domains were created by serial lithium acetate transformation as follows. First, BY4742 was transformed with dsDNA corresponding to a URA3 expression cassette with flanking DNA for integration. This cassette integrated such that a stop codon is inserted after RRM4, the P-domain DNA was knocked out, and the C-domain DNA is preserved, but knocked out of frame. Transformants were selected on –Ura plates. This intermediate strain (yCDK059) was then transformed with dsDNA for a new P-domain with flanking DNA for homologous recombination. The flanking DNA guides integration such that the URA3 cassette is knocked out and the C domain is brought back into frame after the new P domain. Transformants were selected with 5-FOA. Transformants were confirmed by PCR and sequencing. These strains are scarless, with no leftover selectable markers and native 3’ UTRs (yCDK060, yCDK061, yCDK062, yCDK063, yCDK065, yCDK066).
Diploid strains
Diploid strains were constructed by standard mating procedure. BY4741 was streaked onto YPD plates, then appropriate BY4742-background Pab1 mutant strains were streaked through. Cells were incubated at room temperature for 5 hours, then replica-plated onto selective plates: SC -lys -met -cys. Resulting colonies were further purified by streaking onto selective plates (yCDK084, yCDK085, yCDK086, yCDK087, yCDK088, yCDK089). BY4743 was used as a control.
Plate growth
Heat sensitivity
For each strain, a dense overnight culture was diluted into fresh YPD and allowed to grow for 5 hours, when all cultures reached optical densities (OD600s) above 0.2. Cultures for each strain were diluted to matching OD600. Cultures were then serially diluted into fresh YPD. 7 μL of each dilution was spotted onto plates. For Fig. 6F, one YPD plate was incubated for four days at 30°C and another for four days at 40°C. Plates were then imaged. For Fig. S6A, one YPD plate was incubated at 30°C for 2 days, then imaged; another YPD plate was incubated at 40°C for 2 days, imaged, then shifted to a 30°C incubator for an additional 18 hours, then imaged.
For Fig. S6B, diploid cells on a YPD plate were incubated at room temperature for 3 days then imaged; another YPD plate was incubated at 40°C for 3 days then imaged.
Energy depletion
For Fig. 6H, energy depletion plates were YPD with 4.2 mM 2-deoxyglucose and 0.42 μM antimycin A added, and were grown at room temperature (~25°C) for 5 days them imaged. For concentration dependence in Fig. S6C, yeast were grown on SC plates with indicated amount of 2-deoxyglucose and antimycin A at 30°C for 60 hours then imaged.
Total/soluble/pellet (TSP) assay in vivo
Serial fractionation and RNase sensitivity
For in vivo experiments, strains were grown in YPD from OD600=0.010 and harvested starting at OD600=0.400 (~5.3 doublings) where the first 50 mL cells were harvested by 3000g spin for one minute then decanted. Then cells were subjected to 8 minute heat shock at 42°C in the tube, fluid volume less than 500 μL. Yeast were immediately put on ice and washed with ice cold soluble protein buffer (SPB: 20 mM HEPES pH 6.5, 120 mM KCl, 2 mM EDTA) and resuspended in 200 μL SPB. Then 100 μL aliquots were frozen in liquid nitrogen. Total handling time was 40 minutes. Then another 50 mL of yeast were harvested, OD600 had correspondingly increased. Cells were pelleted and mock treated for 8 minutes in 30°C incubator. Samples were collected as for 42°C. 100 μL aliquots were cryogenically lysed by pulverization: 6 cycles of 90 seconds at 30 Hz. Samples were thawed on ice in 400 μL of SPB + PMSF and 0.2 mM DTT. Lysate is clarified at 3000 g for 30 sec. 50 μL of that supernatant is taken as the total fraction.
For Fig. 1B, to 200 μL of that supernatant RNase1 was added to a concentration of 0.3U/μL and digested at room temp for 30 minutes. RNase-treated lysate was then spun at 4°C for 5 minutes at 8,000 rcf. That supernatant was separated to a new tube and spun at a 100,000 rcf for 20 minutes.
Pab1 P-domain mutant assembly
For Fig. 6D and Fig. S5, to 200 μL of that supernatant, 5 μL of RNase A (5 mg/mL) was added and digested at room temp for 20 minutes. RNase-treated lysate was then spun at 4°C for 5 minutes at 20,000 rcf. Finally, 50 μL supernatant was taken as supernatant fraction, the rest is discarded. As a wash step, the pellet was suspended in SPB and re-pelleted. The pellet was then suspended in 50 μL of SPB (4X). 50 μL of loading buffer was added to all samples, then boiled and vortexed. Samples were then diluted 4-fold in 1X loading buffer. Dilutions were run 45 minutes on TGX 4−20% acrylamide gel at 200 V. Region between 37 kDa and 150 kDa was cut out and transferred to nitrocellulose membrane, 100 V for 1 hour. Monoclonal anti-Pab1 antibody (EnCor MCA-1G1 lot #020407) was used for Western blot. Semi-quantitative lanes were included: 30°C – WT total was included at 1/4 and 1/16 dilutions; 42°C – I pellet was included at 1/4 and 1/16 dilution. Quantification of all gels was performed in ImageJ.
METHOD DETAILS
Protein sequences used in this study
Protein construct sequences
The five wild-type constructs utilized in this study were 8xHis-(TevC)-Pab1, 8xHis-hyperstable Protein G-(TevC)-P-domain, 8xHis-(TevC)-P-domain, 6xHis-(TevC)-Pab1-clover, and 6xHis-(TevC)-Pab1-mRuby2. Sequences for all constructs are listed in the Key Resources table. Final protein sequences lacked the His-tag, due to TEV protease cleavage; cleavage occurred between Q and S residues in TevC site (ENLYFQ/S).
Physiological conditions for in vitro studies
Buffering and protein concentration
Physiological conditions, unless otherwise specified, were 150mM KCl at pH 6.4 to match intracellular pH conditions within 5 min of heat shock (Weitzel et al., 1987). We used Pab1 at 15μM. Pab1 is not induced during heat shock, and has a log-phase concentration of roughly 20μM, ~120,000 molecules per cell (Csárdi et al., 2015) almost entirely in the cytosol (Wallace et al., 2015) assuming a cytosolic volume of 10 fL.
Expression and purification of proteins
Expression and purification of Pab1 and Pab1 variants
Recombinant 6× or 8×His-tagged Pab1 constructs were overexpressed in E. coli strain BL21(DE3), using a pET28a plasmid backbone (pESN07, pESN08, pJAR006, pJAR016, pJAR033, pJAR034, pJAR035, pJAR036, pJAR037, pJAR038, pJAR039). Cells were lysed via sonication on ice, in buffer containing 20 mM HEPES, pH 6.5, 150 mM KCl, 25 mM imidazole, and EDTA-free cOmplete protease inhibitor tablets (Roche 05 056 489 001). Clarified lysate was loaded onto a buffer-equilibrated 5 mL HiTrap chelating HP column (GE Healthcare Life Sciences 17-0409) on an AKTA system with automated fraction collector; bound protein was washed with loading buffer and eluted over an imidazole gradient. Fractions containing the target protein were pooled and loaded into dialysis tubing with β-mercaptoethanol and tobacco etch virus (TEV) protease, for removal of N-terminal tags and simultaneous reduction of imidazole concentration. Protein was subsequently loaded onto a second HiTrap Chelating HP column to remove tags and uncleaved protein. Fractions were pooled, then exchanged to buffer containing 20mM HEPES, pH 6.5, 50 mM KCl, and loaded onto a 1 mL HiTrap heparin HP column for removal of nucleic acid contaminants (GE Healthcare Life Sciences 17-0406-01), with elution over a KCl gradient. If needed, protein was then loaded onto a 5 mL HiTrap Q HP column, in buffer 1 pH unit above the isoelectric point of the construct, and eluted over a KCl gradient. Finally, and if needed, protein was concentrated and loaded onto a Superdex 200 10/300 GL size exclusion column.
Expression and purification of Pab1 truncation variants
Recombinant 8xHis-tagged Pab1 truncation constructs were overexpressed from a pET28a plasmid backbone (pJAR011, pJAR012, pJAR013, pJAR014, pJAR015, pJAR029, pJAR030, pJAR031) in E. coli strain BL21(DE3) and purified according to general Pab1 methodology listed above.
Expression and purification of protein G fusion constructs
Recombinant 8xHis-tagged protein G-Pab1 fusion constructs were overexpressed from a pET21 plasmid backbone (pJAR032, pJAR019, pJAR021, pJAR020, pJAR023, pJAR022, pJAR018, pJAR017, pJAR027, pJAR028, pJAR025, pJAR026, pJAR024), in E. coli strain BL21(DE3) according to the Pab1 protocol, then purified using a HiTrap Chelating HP column with subsequent TEV cleavage of tags when applicable. P domain-protein G fusion variants Randomized 1 and 2, and His-tagged P-domain were partially insoluble upon overexpression, and thus 8M urea was added to all purification buffers prior to SEC-SAXS.
Dynamic and static light scattering
SLS and DLS measurements
SLS and DLS measurements were performed in a DynaPro NanoStar. For DLS, each time point was the average of five 6 second acquisitions filtering out samples with a baseline higher than 1.003 and analyzed in the DYNAMICS software with a cumulant fit to the autocorrelation function. Measurements were performed either as a temperature fast jump (1°C/min up to a specific temperature) or a slow ramp (0.25 °C/min continuously). All experiments, unless noted, were performed at 15 μM protein in 20mM HEPES, pH 6.4 with 150mM KCl and 2.5 mM MgCl2. Samples were centrifuged for 30 minutes at 20,000g at 20°C before DLS experiments. For samples below pH 6, concentrated stocks at pH 6.4 buffered in HEPES were diluted ~10-fold into 50 mM sodium acetate, 150 mM KCL, buffered to the indicated pH and samples were spun at 4°C, 20,000g for 5 min.
Small-Angle X-ray scattering (SEC-SAXS)
Size-exclusion chromatography coupled to small-angle X-ray scattering (SEC-SAXS)
SAXS measurements were performed at the Advanced Photon Source at Argonne National Laboratory with in-line SEC columns (Superdex 75) equilibrated with 20 mM HEPES, pH 7.4, and with either 150 mM KCl (representing 0M GdnHCl) or 2M GdnHCl. We chose to include 150mM KCl in the 0M GdnHCl condition to mimic physiological ionic strength. The samples were injected onto the SEC with a starting concentration ranging from 100 μM to 1 mM. During sample concentration, prior to injection, 6M GdnHCl was added to samples to increase solubility and break up potential oligomers, as needed. Proteins were primarily eluted as monomers with some variants having large aggregates that eluted in the void volume. For the one or two mutants that expressed with a ~30% cleavage product, SEC was able to separate the two forms. Typically, samples were spun at 16,000g for 5 min before injecting.
Circular Dichroism (CD) spectroscopy
CD measurements
Experiments were performed on a Jasco J-715 CD spectrometer in a 10 mm path length cuvette with a bandwidth of 5 nm, scan speed of 20 nm/min, a 4 second integration time with data collected every 1 nm. Spectra were smoothed using the BezierFunction in Mathematica software with default settings. Experiments on isolated P domain (after TEV cleavage of the P domain fusion to the expression tag) were performed in 5 mM phosphate at pH 6.9 at ~1 μM at 20 °C. Pab1 and RRM123 wavelength spectra were in 2.5 mM phosphate at pH 6.4 and 150 mM NaF at 0.2 μM. RRM123 temperature melts were in 2.5mM phosphate at pH 6.4 and 150 mM NaF at 1 μM taken at 217 nm with temperature increasing from 15°C to 70°C in increments of 1°C/min.
Size-exclusion chromatography (SEC)
Pab1:RNA complex characterization
15 μM Pab1 was incubated alone or with 100 μg/ml A19 RNA in 120 μl reaction in 20 mM HEPES (pH 6.4), 150 mM KCl, 2.5 mM MgCl2 buffer at 30°C for 30 minutes. Pab1 and Pab1:A19 pre-formed complexes were then heated at 46°C for 30 minutes when indicated. Each reaction was centrifuged 3 minutes at 8,000g and 100 μL supernatant was subjected to size exclusion FPLC using Superose 6 10/300 GL (GE Healthcare) equilibrated with 20 mM HEPES (pH 6.4), 400 mM KCl buffer. Chromatography was carried out at 4°C by use of an AKTA Purifier P10 system (GE Healthcare).
Light and fluorescence microscopy
Live cell imaging
Diploid yeast strains (yAER77, imaged alive) and purified recombinant proteins were imaged on an Olympus DSU spinning-disk confocal microscope using a 100x oil immersion objective and FITC/Cy2 and DsRed filter sets for Clover and mRuby2, respectively. Strains used for microscopy and detailed protocols for imaging strains were identical to those previously reported (Wallace et al., 2015).
Protein assembly imaging
Purified recombinant proteins were imaged using either 63x or 100x oil immersion objectives, on a Leica SP5 II STED-CW super-resolution laser scanning confocal microscope with Gallium arsenide phosphide (GaAsP) / Photon Multiplier Tube (PMT) hybrid detectors and LAS_AF Leica proprietary software. For in vitro studies, purified recombinant protein was subjected to brief heat shock (when applicable) using an Eppendorf ThermoMixer F1.5 heat block, deposited on a slide and immediately imaged. For imaging experiments performed between pH 5.7 and pH 6.4, purified protein samples were buffered in 20mM HEPES, 150mM KCl. For imaging experiments performed between pH 5.0 and 5.6, purified protein samples were buffered in 20mM sodium acetate, 150mM KCl.
Mixing experiment
15 μM 1:20 Clover:unlabeled Pab1 was assembled, on-slide, via a 10x dilution with buffer containing 50 mM sodium acetate and 150 mM KCl. After 5 minutes, 15 μM 1:20 mRuby2:unlabeled Pab1was added to the sample slide, then imaged using an Olympus DSU spinning-disk confocal microscope, with 100x oil immersion objective and FITC/Cy2 and DsRed filter sets for Clover and mRuby2, respectively.
Fluorescence recovery after photobleaching (FRAP)
FRAP experiments were performed on a Leica SP5 II STED-CW super-resolution laser scanning confocal microscope with FRAP wizard, using a 63x oil objective. Droplet formation was triggered in a 15 μM 1:20 Clover:unlabeled Pab1 solution, either by heat treatment or a drop to pH 5 at room temperature. Pab1 droplets were imaged prior to photobleaching, bleached for 100 ms using the argon laser at 488nm, then imaged for up to 10 minutes at equal intervals. Total pixel intensity per unit area over time, in circular regions of interest drawn in ImageJ, was plotted in R.
Total/soluble/pellet (TSP) assay in vitro
Fractionation of Pab1 assemblies
Purified proteins were incubated at specified temperatures for 10 minutes, unless otherwise specified. For pH 4.5 and 5 treatments, samples were buffered in 50 mM sodium acetate. For pH 5.5, 6, and 6.5 treatments, samples were buffered in 50 mM MES. pH 7 and 7.5 samples were buffered in 20 mM HEPES. All sample buffers contained 150mM KCl and 2.5 mM MgCl2. For pH 4.5 and 5 treatments, samples were buffered in 50 mM sodium acetate. In all other cases, they were buffered in 20 mM HEPES. Samples were pelleted by sedimentation at 10,000g for 10 minutes.
Poly(A)-binding protein mutant design
P-domain mutations
Mutations to Pab1’s low-complexity region were designed by replacing all instances of a set of residues, e.g. M and V, with another set, e.g. A. Two randomized mutants were designed by reordering all residues in the LCR according to the output of a pseudorandom number generator. Two additional mutants were constructed as follows. The MV→AGQ mutant was made by pseudorandom selection of replacements of {MV} (12 instances) from the set {AGQ}. The MVFY→AGPNQ was made starting from the MV→AGQ mutant, adding pseudorandom replacements of {FY} (10 instances) from the set {AGPNQ}. The intention behind the construction of these mutants was to replace aromatic and/or hydrophobic residues with polar residues. These were the only two such mutants constructed; no selection process was imposed.
QUANTIFICATION AND STATISTICAL ANALYSIS
Unless otherwise indicated, statistical tests were employed with only an informal analysis of whether the data conformed to the assumptions of the methods, reflecting the limited assumptions of the few statistical tests employed.
Gel quantification
In vivo Total/Soluble/Pellet fractionation
Total protein Coomassie-stained gels were quantified using the gel quantification tool in ImageJ. Lanes loaded 1/4 X and 1/16 X were used to construct a standard curve for Fig. 6; total protein intensity was used to verify consistent loading.
Sensitivity of in vitro assemblies to pH and [KCl] gels were quantified in ImageJ with gel quantification tool by comparing total lane intensity. SEC pelleted material was compared to semi-quantitative lanes.
Western blot quantification
All western blots were quantified using ImageJ’s gel quantification tool. Semi-quantitative lanes (loaded with less material) were used to construct a standard curve for Fig. 6; fraction pelleted was computed as pelleted material divided by total and divided by a factor of to account for pellet loading (2X or 4X). Proportions reported in Fig. 1 is the blot intensity of the fraction divided by the sum of supernatant, 8,000g pellet, and 100,000g pellet.
DLS/SLS – Rh calculation
Calculation of Tdemix
The apparent radius of hydration (Rh) reported is the Z-average, an intensity-weighted harmonic mean size calculated using DYNAMICS software with a cumulant fit to the autocorrelation function. Tdemix is calculated as the temperature at which this Rh reaches double the value at 25°C, calculated as the mean of the first 20 points. For the phase diagrams and Pab1dRRM3, Tdemix was calculated as the temperature where the SLS normalized intensity doubled from its mean value of the first 40 points. To verify these definitions of Tdemix were compatible, we compared their values on all traces having Tdemix calculated using both methods, obtaining a standard deviation between the two methods of 0.3°C.
Kinetic data
were analyzed according to (Borzova et al., 2015). DLS Z-average Rh was fit, in Mathematica, to Rh(t)=Rh(0)*(1+a*(Exp[K*t*Log[(a+1)/a]]-1)) where k is the rate of change. The data range spanned 20 minutes before to 80 minutes after reaching the target temperature. The temperature dependence, here denoted ‘m’, was quantified by the slope of the log(k) vs. temperature. Q10~36°C was calculated as Exp[m*10]. Each kinetic experiment was done twice at each temperature.
Temperature/pH phase boundary
We fit SLS-derived Tdemix values (see Calculation of Tdemix for details) at a range of pH levels for wild type and mutant (MV→A, MV→I) Pab1 variants using nonlinear least squares in R. Starting values were the same for all constructs. The functional form was: pHdemix = a + b*Tdemixc with initial values a=4.5, b=1e-6, c=4. All fits converged within 1000 iterations. Example call in R:
fit <- nls(pHdemix~a + b*Tdemix.SLSˆc, start=list(a=4.5, b=1e-6, c=4), data=subset(x, construct==’WT’), control=list(maxiter=1000))
Each phase boundary was derived from temperature-ramp curves taken at three or more pH values with at least two replicates; all data are shown.
SAXS – Rg calculation
Calculation of Rg
Samples were analyzed with autorg and datgnom with the commands “autorg --sminrg 0.55 --smaxrg 1.1” and “datgnom ˋ1ˋ.dat -r ˋ2ˋ --skip ˋ3ˋ -o ˋ1ˋ.out”, respectively, where ˋ1ˋ is the file name, ˋ2ˋ is the Rg determined by autorg, and ˋ3ˋ is the number of points determined to skip at low q as specified from the output of autorg. For MVFY→AGPNQ, the parameter --sminrg is replaced with 0.7 due to an unphysical Rg from poor signal at low q for this mutant. Rg values and associated errors were determined in datgnom. For the P domain alone, the dependence on Rg with denaturant was fit, in Mathematica, with the functional form Rg0+a*x/(1+b*x) where a, b, and Rg0 (the extrapolated Rg without denaturant) are fit parameters and x is the denaturant concentration. This ad hoc form has been used previously (Hofmann et al., 2012) for intrinsically disordered or unfolded states. Calculated Rg expected for folded and denatured proteins given for a 108 amino acid protein, the same number as in the His-tagged P-domain construct, in Fig. 5B right are 3*1080.34~14.7Å and 2*1080.59~31.7Å (Hofmann et al., 2012). For figures, error bars represent standard error on the mean within either linearly or logarithmically spaced bins.
Protein alignment and sequence analysis
Poly(A)-binding protein alignment
Orthologs of Pab1 were retrieved from SMART (http://smart.embl.de, (Letunic et al., 2015)) on the basis of possessing a specific domain architecture: four RRM domains and a PolyA (poly(A)-binding protein C-terminal) domain, resulting in 742 sequences. No constraint for the presence or absence of a proline-rich low-complexity region was imposed. We aligned these sequences using MUSCLE (Edgar, 2004). We then filtered these sequences by identity to produce an alignment where all sequences share no more than 95% identity and each species contributes at most one sequence, resulting in 351 sequences in a master PABP alignment. For display in Fig. 4, we further filtered sequences to eliminate those inducing large gaps (e.g., due to insertion specific to small numbers of species) to 295. All quantitative analyses were performed using the full 351-species alignment.
Proteome datasets
Intrinsically disordered proteins were retrieved from DisProt (Sickmeier et al., 2007) release 6.02 after removing regions shorter than 40 residues and those with non-canonical amino acid entries (‘Z’ and ‘B’). The yeast proteome (translated coding sequences) was retrieved from the Saccharomyces Genome Database (SGD) (Engel et al., 2014), release 64-2-1.
Sequence analysis
To isolate the P domain, regions in the master PABP alignment aligned with the beginning and end of the S. cerevisiae P domain (beginning with YQQATAAAAAAAAGMP…, ending with …ANDNNQFYQ) were extracted. The remaining sequences were designated PABPΔP. Amino acid proportions (alternatively referred to as fractions) were computed by counting the number of amino-acid occurrences and dividing by the total amino-acid length of the respective subsequence, omitting gaps.
Log-linear correlations between ILMVA frequencies and hydrophobicity were performed as follows. Given the absolute amino-acid frequencies for these amino-acid types, as in the table below (data from H. sapiens):
| Amino acid | Hydrophobicity (Hopp-Woods Z score) | Frequency (n) | Frequency plus pseudocount (n+1) | Log (n+1) |
|---|---|---|---|---|
| A | 0.148 | 29 | 30 | 3.401 |
| L | 0.823 | 4 | 5 | 1.609 |
| I | 0.823 | 4 | 5 | 1.609 |
| M | 0.563 | 7 | 8 | 2.079 |
| V | 0.667 | 11 | 12 | 2.485 |
We compute the Pearson linear correlation between log-transformed frequencies and hydrophobicity. To avoid taking the logarithm of zero, a pseudocount of 1 is added to all frequencies. In the illustrated case, the correlation is r = −0.94. The proportion of variation in (log) residue frequencies explained by residue hydrophobicity is r2 = 0.89. Error bars in Fig. 4 show standard error on the mean. All statistical calculations were carried out in using the statistical package R.
As described in the main text, the Spearman rank correlation (nonparametric) was used to compare amino acid frequencies in the proline-rich domain. The Wilcoxon signed rank test (nonparametric) was used to determine whether frequency/hydrophobicity correlations were stronger in proline-rich domains than comparison sets. The Pearson correlation was used to test explicitly for a linear relationship between log-frequency and hydrophobicity.
DATA AND SOFTWARE AVAILABILITY
Example collapsed conformations
Single model P domain fusion conformations, shown in Fig. 5D, were chosen from ensembles produced by RANCH (Petoukhov et al., 2012), side chain atoms were added back using SABBAC (Maupetit et al., 2006), and SAXS curves were generated with Crysol version 2.83 (Petoukhov et al., 2012). For comparing Rgs in these models to the extrapolated His-tagged P domain Rg in water, 108 residues from the C-terminus of the model were entered into Crysol yielding an Rg.
Custom software
Availability of custom scripts used in this manuscript is described in the Key Resources Table.
Supplementary Material
Pab1 assembly followed with light scattering after temperature was shifted from 30°C (blue) to 39°C (orange), and back to 30°C (blue). Temperature equilibration period is highlighted in gold. Panels A and B differ by duration at 39°C and the extent of resulting assembly.
A, CD spectra of RRM123 at 30°C and 42°C at 0.2μM. Unlike Pab1 in Fig. 2E, no time-dependent changes were observed. B, Temperature melt of RRM123 at 1μM with best-fit line fit from 15°C to 30°C with extrapolation shown demonstrating that at 42°C RRM123 is still in the folded state baseline. At 47°C, RRM123 signal deviates from this native baseline, likely signifying the onset of RRM123 demixing and/or unfolding. C, Normalized scattering intensity from DLS and SLS shown at left and right, respectively. Pab1, ∆RRM3, RRM1-3, and RPC are shown as indicated. In the case of ∆RRM3, low-temperature aggregation results in difficult-to-purify multimeric states preventing analysis of dynamic light scattering (DLS) to determine an (intensity-weighted) average hydration radius (Rh).
Plots in A and B are reproduced from Fig. 3A, with corresponding gels used to quantify fraction pelleted, where (T) is total, (P) is 20,000g pellet fraction and (S) is supernatant. Morphology of corresponding Pab1 assemblies are shown in C. D, Variation in size of heat-induced droplets (46°C, 5 minutes) is observed from day to day, and between sample preparations, possibly due to subtle variation in salt or pH. E, At a pH of ~0.7, Pab1 denatures and has a morphology which is distinct from phase-separated Pab1 droplets. F, Image at the slide surface showing adherent Pab1-mRuby2 droplets wetting the surface.
A, Data in Fig. 4B reordered to emphasize differences in charged and hydrophobic amino acids. Error bars show standard error on the mean. B,C, Cumulative distributions for length (B) and proline fraction (C) for PABP sequences between RRM4 and the CTD (putative P domains). D, Cumulative distribution of the log(frequency)-hydrophobicity correlation for {ILVMA} residues, for sets of sequences colored as in C. E, Variance explained (r2) for correlations in D.
A and B show Coomassie-stained SDS-PAGE gel of samples quantified in Fig. 6D for replicates 1 and 2, respectively. Top and bottom correspond to cells incubated at 30°C and 42°C, respectively. Yef3 is annotated with a yellow arrow. C, Pab1 western blot for replicate 2 of yeast strains with mutated P domains; replicate 1 is shown in Fig. 6C.
A, The heat-sensitive phenotype from Fig. 6E represents growth arrest, not death, since cells resume growth when shifted down to 30°C. B, Diploid yeast expressing both wild-type Pab1 and P-domain mutant Pab1 variants show a similar pattern of heat sensitivity compared to haploid strains. C, Sensitivity of P-domain mutant strains is more pronounced with increasing concentrations of 2-deoxyglucose and antimycin A. Large colonies in the presence of drug are suppressors.
Summary of Tdemix (at pH 6.4) and Rg values calculated as described in Methods.
Acknowledgments
We are grateful to E. Wallace and members of the Drummond and Sosnick labs for helpful discussions, and thank I. Gagnon for protein purification, S. Chakravarthy, and A. Zmyslowski for assistance in SAXS measurements, and E. Nieweglowska for plasmid construction. Imaging was performed at the University of Chicago Integrated Light Microscopy Facility; we thank V. Bindokas, S. Bond and C. Labno for their help. D.A.D. is a Pew Scholar in the Biomedical Sciences. This work was funded in part by grants from the Pew Charitable Trusts; the NIH, GM105816 via the Protein Translation Research Network (D.A.D.), GM55694 and T32 EB009412-07 (T.R.S.), and T32 GM007183 (C.D.K.); the NSF, GRF DGE-1144082 (J.A.R.); and the US Army Research Office Multidisciplinary University Research Initiative Awards W911NF-14-1-0411. Use of the Advanced Photon Source, an Office of Science User Facility, operated for the Department of Energy (DOE) Office of Science by Argonne National Laboratory, was supported by the DOE under Contract No. DEAC02- 06CH11357.
Footnotes
Author contributions
Conceptualization, D.A.D.; Methodology, J.A.R., C.D.K., J.L.K.-S., E.V.P., T.R.S. and D.A.D.; Investigation, J.A.R., C.D.K., J.L.K.-S., E.V.P., A.E.R., T.R.S. and D.A.D.; Software, J.A.R. and D.A.D.; Writing – Original Draft/Review & Editing, J.A.R., T.R.S. and D.A.D.; Funding Acquisition, J.A.R., T.R.S. and D.A.D.; Resources, T.R.S. and D.A.D.; Supervision, T.R.S. and D.A.D.
References
- Anderson P, Kedersha N. RNA granules. J Cell Biol. 2006;172:803–808. doi: 10.1083/jcb.200512082. [DOI] [PMC free article] [PubMed] [Google Scholar]
- Boke E, Ruer M, Wühr M, Coughlin M, Lemaitre R, Gygi SP, Alberti S, Drechsel D, Hyman AA, Mitchison TJ. Amyloid-like Self-Assembly of a Cellular Compartment. Cell. 2016;166:637–650. doi: 10.1016/j.cell.2016.06.051. [DOI] [PMC free article] [PubMed] [Google Scholar]
- Borzova VA, Markossian KA, Kara DA, Kurganov B. Kinetic regime of dithiothreitol-induced aggregation of bovine serum albumin. Int J Biol Macromol. 2015;80:130–138. doi: 10.1016/j.ijbiomac.2015.06.040. [DOI] [PubMed] [Google Scholar]
- Brangwynne CP, Eckmann CR, Courson DS, Rybarska A, Hoege C, Gharakhani J, Jülicher F, Hyman AA. Germline P granules are liquid droplets that localize by controlled dissolution/condensation. Science. 2009;324:1729–1732. doi: 10.1126/science.1172046. [DOI] [PubMed] [Google Scholar]
- Brangwynne CP, Tompa P, Pappu RV. Polymer physics of intracellular phase transitions. Nat Phys. 2015;11:899–904. [Google Scholar]
- Buchan JR, Yoon JH, Parker R. Stress-specific composition, assembly and kinetics of stress granules in Saccharomyces cerevisiae. J Cell Sci. 2011;124:228–239. doi: 10.1242/jcs.078444. [DOI] [PMC free article] [PubMed] [Google Scholar]
- Cherkasov V, Hofmann S, Druffel-Augustin S, Mogk A, Tyedmers J, Stoecklin G, Bukau B. Coordination of translational control and protein homeostasis during severe heat stress. Curr Biol. 2013;23:2452–2462. doi: 10.1016/j.cub.2013.09.058. [DOI] [PubMed] [Google Scholar]
- Chien P, Gierasch LM. Challenges and dreams: physics of weak interactions essential to life. Mol Biol Cell. 2014;25:3474–3477. doi: 10.1091/mbc.E14-06-1035. [DOI] [PMC free article] [PubMed] [Google Scholar]
- Csárdi G, Franks A, Choi DS, Airoldi EM, Drummond DA. Accounting for Experimental Noise Reveals That mRNA Levels, Amplified by Post-Transcriptional Processes, Largely Determine Steady-State Protein Levels in Yeast. PLoS Genet. 2015;11:e1005206. doi: 10.1371/journal.pgen.1005206. [DOI] [PMC free article] [PubMed] [Google Scholar]
- Dechant R, Binda M, Lee SS, Pelet S, Winderickx J, Peter M. Cytosolic pH is a second messenger for glucose and regulates the PKA pathway through V-ATPase. EMBO J. 2010;29:2515–2526. doi: 10.1038/emboj.2010.138. [DOI] [PMC free article] [PubMed] [Google Scholar]
- Edelstein SJ. Patterns in the quinary structures of proteins. Plasticity and inequivalence of individual molecules in helical arrays of sickle cell hemoglobin and tubulin. Biophys J. 1980;32:347–360. doi: 10.1016/S0006-3495(80)84961-7. [DOI] [PMC free article] [PubMed] [Google Scholar]
- Edgar RC. MUSCLE: multiple sequence alignment with high accuracy and high throughput. Nucleic Acids Res. 2004;32:1792–1797. doi: 10.1093/nar/gkh340. [DOI] [PMC free article] [PubMed] [Google Scholar]
- Engel SR, Dietrich FS, Fisk DG, Binkley G, Balakrishnan R, Costanzo MC, Dwight SS, Hitz BC, Karra K, Nash RS, et al. The reference genome sequence of Saccharomyces cerevisiae: then and now. G3. 2014;4:389–398. doi: 10.1534/g3.113.008995. [DOI] [PMC free article] [PubMed] [Google Scholar]
- Farny NG, Kedersha NL, Silver PA. Metazoan stress granule assembly is mediated by P-eIF2alpha-dependent and -independent mechanisms. RNA. 2009;15:1814–1821. doi: 10.1261/rna.1684009. [DOI] [PMC free article] [PubMed] [Google Scholar]
- Feric M, Vaidya N, Harmon TS, Mitrea DM, Zhu L, Richardson TM, Kriwacki RW, Pappu RV, Brangwynne CP. Coexisting Liquid Phases Underlie Nucleolar Subcompartments. Cell. 2016;165:1686–1697. doi: 10.1016/j.cell.2016.04.047. [DOI] [PMC free article] [PubMed] [Google Scholar]
- Hofmann H, Soranno A, Borgia A, Gast K, Nettels D, Schuler B. Polymer scaling laws of unfolded and intrinsically disordered proteins quantified with single-molecule spectroscopy. Proc Natl Acad Sci U S A. 2012;109:16155–16160. doi: 10.1073/pnas.1207719109. [DOI] [PMC free article] [PubMed] [Google Scholar]
- Hyman AA, Weber CA, Jülicher F. Liquid-liquid phase separation in biology. Annu Rev Cell Dev Biol. 2014;30:39–58. doi: 10.1146/annurev-cellbio-100913-013325. [DOI] [PubMed] [Google Scholar]
- Jain S, Wheeler JR, Walters RW, Agrawal A, Barsic A, Parker R. ATPase-Modulated Stress Granules Contain a Diverse Proteome and Substructure. Cell. 2016;164:487–498. doi: 10.1016/j.cell.2015.12.038. [DOI] [PMC free article] [PubMed] [Google Scholar]
- Kang K, Panzano VC, Chang EC, Ni L, Dainis AM, Jenkins AM, Regna K, Muskavitch MAT, Garrity PA. Modulation of TRPA1 thermal sensitivity enables sensory discrimination in Drosophila. Nature. 2012;481:76–80. doi: 10.1038/nature10715. [DOI] [PMC free article] [PubMed] [Google Scholar]
- Kato M, Han TW, Xie S, Shi K, Du X, Wu LC, Mirzaei H, Goldsmith EJ, Longgood J, Pei J, et al. Cell-free formation of RNA granules: low complexity sequence domains form dynamic fibers within hydrogels. Cell. 2012;149:753–767. doi: 10.1016/j.cell.2012.04.017. [DOI] [PMC free article] [PubMed] [Google Scholar]
- Kini HK, Silverman IM, Ji X, Gregory BD, Liebhaber SA. Cytoplasmic poly(A) binding protein-1 binds to genomically encoded sequences within mammalian mRNAs. RNA. 2016;22:61–74. doi: 10.1261/rna.053447.115. [DOI] [PMC free article] [PubMed] [Google Scholar]
- Kroschwald S, Maharana S, Mateju D, Malinovska L, Nüske E, Poser I, Richter D, Alberti S. Promiscuous interactions and protein disaggregases determine the material state of stress-inducible RNP granules. Elife. 2015;4 doi: 10.7554/eLife.06807. [DOI] [PMC free article] [PubMed] [Google Scholar]
- Lee C, Occhipinti P, Gladfelter AS. PolyQ-dependent RNA–protein assemblies control symmetry breaking. J Cell Biol. 2015;208:533–544. doi: 10.1083/jcb.201407105. [DOI] [PMC free article] [PubMed] [Google Scholar]
- Letunic I, Doerks T, Bork P. SMART: recent updates, new developments and status in 2015. Nucleic Acids Res. 2015;43:D257–D260. doi: 10.1093/nar/gku949. [DOI] [PMC free article] [PubMed] [Google Scholar]
- Li P, Banjade S, Cheng HC, Kim S, Chen B, Guo L, Llaguno M, Hollingsworth JV, King DS, Banani SF, et al. Phase transitions in the assembly of multivalent signalling proteins. Nature. 2012;483:336–340. doi: 10.1038/nature10879. [DOI] [PMC free article] [PubMed] [Google Scholar]
- Lin Y, Protter DSW, Rosen MK, Parker R. Formation and Maturation of Phase-Separated Liquid Droplets by RNA-Binding Proteins. Mol Cell. 2015 doi: 10.1016/j.molcel.2015.08.018. [DOI] [PMC free article] [PubMed] [Google Scholar]
- Lindquist S, Petersen R. Selective translation and degradation of heat-shock messenger RNAs in Drosophila. Enzyme. 1990;44:147–166. doi: 10.1159/000468754. [DOI] [PubMed] [Google Scholar]
- Maupetit J, Gautier R, Tufféry P. SABBAC: online Structural Alphabet-based protein BackBone reconstruction from Alpha-Carbon trace. Nucleic Acids Res. 2006;34:W147–W151. doi: 10.1093/nar/gkl289. [DOI] [PMC free article] [PubMed] [Google Scholar]
- Molliex A, Temirov J, Lee J, Coughlin M, Kanagaraj AP, Kim HJ, Mittag T, Taylor JP. Phase Separation by Low Complexity Domains Promotes Stress Granule Assembly and Drives Pathological Fibrillization. Cell. 2015;163:123–133. doi: 10.1016/j.cell.2015.09.015. [DOI] [PMC free article] [PubMed] [Google Scholar]
- Morano KA, Grant CM, Moye-Rowley WS. The response to heat shock and oxidative stress in Saccharomyces cerevisiae. Genetics. 2012;190:1157–1195. doi: 10.1534/genetics.111.128033. [DOI] [PMC free article] [PubMed] [Google Scholar]
- Mugler CF, Hondele M, Heinrich S, Sachdev R, Vallotton P, Koek AY, Chan LY, Weis K. ATPase activity of the DEAD-box protein Dhh1 controls processing body formation. Elife. 2016;5 doi: 10.7554/eLife.18746. [DOI] [PMC free article] [PubMed] [Google Scholar]
- Munder MC, Midtvedt D, Franzmann T, Nüske E, Otto O, Herbig M, Ulbricht E, Müller P, Taubenberger A, Maharana S, et al. A pH-driven transition of the cytoplasm from a fluid- to a solid-like state promotes entry into dormancy. eLife Sciences. 2016;5:e09347. doi: 10.7554/eLife.09347. [DOI] [PMC free article] [PubMed] [Google Scholar]
- Pak CW, Kosno M, Holehouse AS, Padrick SB, Mittal A, Ali R, Yunus AA, Liu DR, Pappu RV, Rosen MK. Sequence Determinants of Intracellular Phase Separation by Complex Coacervation of a Disordered Protein. Mol Cell. 2016;63:72–85. doi: 10.1016/j.molcel.2016.05.042. [DOI] [PMC free article] [PubMed] [Google Scholar]
- Patel A, Lee HO, Jawerth L, Maharana S, Jahnel M, Hein MY, Stoynov S, Mahamid J, Saha S, Franzmann TM, et al. A Liquid-to-Solid Phase Transition of the ALS Protein FUS Accelerated by Disease Mutation. Cell. 2015;162:1066–1077. doi: 10.1016/j.cell.2015.07.047. [DOI] [PubMed] [Google Scholar]
- Petoukhov MV, Franke D, Shkumatov AV, Tria G, Kikhney AG, Gajda M, Gorba C, Mertens HDT, Konarev PV, Svergun DI. New developments in the ATSAS program package for small-angle scattering data analysis. J Appl Crystallogr. 2012;45:342–350. doi: 10.1107/S0021889812007662. [DOI] [PMC free article] [PubMed] [Google Scholar]
- R Core Team. R: A Language and Environment for Statistical Computing 2016 [Google Scholar]
- Sachs AB, Davis RW, Kornberg RD. A single domain of yeast poly(A)-binding protein is necessary and sufficient for RNA binding and cell viability. Mol Cell Biol. 1987;7:3268–3276. doi: 10.1128/mcb.7.9.3268. [DOI] [PMC free article] [PubMed] [Google Scholar]
- Sengupta P, Garrity P. Sensing temperature. Curr Biol. 2013;23:R304–R307. doi: 10.1016/j.cub.2013.03.009. [DOI] [PMC free article] [PubMed] [Google Scholar]
- Sickmeier M, Hamilton JA, LeGall T, Vacic V, Cortese MS, Tantos A, Szabo B, Tompa P, Chen J, Uversky VN, et al. DisProt: the Database of Disordered Proteins. Nucleic Acids Res. 2007;35:D786–D793. doi: 10.1093/nar/gkl893. [DOI] [PMC free article] [PubMed] [Google Scholar]
- Skinner JJ, Yu W, Gichana EK, Baxa MC, Hinshaw JR, Freed KF, Sosnick TR. Benchmarking all-atom simulations using hydrogen exchange. Proc Natl Acad Sci U S A. 2014;111:15975–15980. doi: 10.1073/pnas.1404213111. [DOI] [PMC free article] [PubMed] [Google Scholar]
- Su X, Ditlev JA, Hui E, Xing W, Banjade S, Okrut J, King DS, Taunton J, Rosen MK, Vale RD. Phase separation of signaling molecules promotes T cell receptor signal transduction. Science. 2016;352:595–599. doi: 10.1126/science.aad9964. [DOI] [PMC free article] [PubMed] [Google Scholar]
- Vabulas RM, Raychaudhuri S, Hayer-Hartl M, Hartl FU. Protein folding in the cytoplasm and the heat shock response. Cold Spring Harb Perspect Biol. 2010;2:a004390. doi: 10.1101/cshperspect.a004390. [DOI] [PMC free article] [PubMed] [Google Scholar]
- Wallace EWJ, Kear-Scott JL, Pilipenko EV, Schwartz MH, Laskowski PR, Rojek AE, Katanski CD, Riback JA, Dion MF, Franks A, et al. Reversible, specific, active aggregates of endogenous proteins assemble upon heat stress. Cell. 2015;162:1286–1298. doi: 10.1016/j.cell.2015.08.041. [DOI] [PMC free article] [PubMed] [Google Scholar]
- Weigert C, Steffler F, Kurz T, Shellhammer TH, Methner FJ. Application of a Short Intracellular pH Method to Flow Cytometry for Determining Saccharomyces cerevisiae Vitality. Appl Environ Microbiol. 2009;75:5615–5620. doi: 10.1128/AEM.00650-09. [DOI] [PMC free article] [PubMed] [Google Scholar]
- Weitzel G, Pilatus U, Rensing L. The cytoplasmic pH, ATP content and total protein synthesis rate during heat-shock protein inducing treatments in yeast. Exp Cell Res. 1987;170:64–79. doi: 10.1016/0014-4827(87)90117-0. [DOI] [PubMed] [Google Scholar]
- Wuttke R, Hofmann H, Nettels D, Borgia MB, Mittal J, Best RB, Schuler B. Temperature-dependent solvation modulates the dimensions of disordered proteins. Proc Natl Acad Sci U S A. 2014;111:5213–5218. doi: 10.1073/pnas.1313006111. [DOI] [PMC free article] [PubMed] [Google Scholar]
- Yang X, Shen Y, Garre E, Hao X, Krumlinde D, Cvijović M, Arens C, Nyström T, Liu B, Sunnerhagen P. Stress Granule-Defective Mutants Deregulate Stress Responsive Transcripts. PLoS Genet. 2014;10:e1004763. doi: 10.1371/journal.pgen.1004763. [DOI] [PMC free article] [PubMed] [Google Scholar]
- Yao G, Chiang YC, Zhang C, Lee DJ, Laue TM, Denis CL. PAB1 self-association precludes its binding to poly(A), thereby accelerating CCR4 deadenylation in vivo. Mol Cell Biol. 2007;27:6243–6253. doi: 10.1128/MCB.00734-07. [DOI] [PMC free article] [PubMed] [Google Scholar]
- Zhang H, Elbaum-Garfinkle S, Langdon EM, Taylor N, Occhipinti P, Bridges AA, Brangwynne CP, Gladfelter AS. RNA Controls PolyQ Protein Phase Transitions. Mol Cell. 2015;60:220–230. doi: 10.1016/j.molcel.2015.09.017. [DOI] [PMC free article] [PubMed] [Google Scholar]
Associated Data
This section collects any data citations, data availability statements, or supplementary materials included in this article.
Supplementary Materials
Pab1 assembly followed with light scattering after temperature was shifted from 30°C (blue) to 39°C (orange), and back to 30°C (blue). Temperature equilibration period is highlighted in gold. Panels A and B differ by duration at 39°C and the extent of resulting assembly.
A, CD spectra of RRM123 at 30°C and 42°C at 0.2μM. Unlike Pab1 in Fig. 2E, no time-dependent changes were observed. B, Temperature melt of RRM123 at 1μM with best-fit line fit from 15°C to 30°C with extrapolation shown demonstrating that at 42°C RRM123 is still in the folded state baseline. At 47°C, RRM123 signal deviates from this native baseline, likely signifying the onset of RRM123 demixing and/or unfolding. C, Normalized scattering intensity from DLS and SLS shown at left and right, respectively. Pab1, ∆RRM3, RRM1-3, and RPC are shown as indicated. In the case of ∆RRM3, low-temperature aggregation results in difficult-to-purify multimeric states preventing analysis of dynamic light scattering (DLS) to determine an (intensity-weighted) average hydration radius (Rh).
Plots in A and B are reproduced from Fig. 3A, with corresponding gels used to quantify fraction pelleted, where (T) is total, (P) is 20,000g pellet fraction and (S) is supernatant. Morphology of corresponding Pab1 assemblies are shown in C. D, Variation in size of heat-induced droplets (46°C, 5 minutes) is observed from day to day, and between sample preparations, possibly due to subtle variation in salt or pH. E, At a pH of ~0.7, Pab1 denatures and has a morphology which is distinct from phase-separated Pab1 droplets. F, Image at the slide surface showing adherent Pab1-mRuby2 droplets wetting the surface.
A, Data in Fig. 4B reordered to emphasize differences in charged and hydrophobic amino acids. Error bars show standard error on the mean. B,C, Cumulative distributions for length (B) and proline fraction (C) for PABP sequences between RRM4 and the CTD (putative P domains). D, Cumulative distribution of the log(frequency)-hydrophobicity correlation for {ILVMA} residues, for sets of sequences colored as in C. E, Variance explained (r2) for correlations in D.
A and B show Coomassie-stained SDS-PAGE gel of samples quantified in Fig. 6D for replicates 1 and 2, respectively. Top and bottom correspond to cells incubated at 30°C and 42°C, respectively. Yef3 is annotated with a yellow arrow. C, Pab1 western blot for replicate 2 of yeast strains with mutated P domains; replicate 1 is shown in Fig. 6C.
A, The heat-sensitive phenotype from Fig. 6E represents growth arrest, not death, since cells resume growth when shifted down to 30°C. B, Diploid yeast expressing both wild-type Pab1 and P-domain mutant Pab1 variants show a similar pattern of heat sensitivity compared to haploid strains. C, Sensitivity of P-domain mutant strains is more pronounced with increasing concentrations of 2-deoxyglucose and antimycin A. Large colonies in the presence of drug are suppressors.
Summary of Tdemix (at pH 6.4) and Rg values calculated as described in Methods.