Summary
Reactive astrocytes are strongly induced by central nervous system (CNS) injury and disease but their role is poorly understood. Here we show that A1 reactive astrocytes are induced by classically-activated neuroinflammatory microglia. We show that activated microglia induce A1s by secreting Il-1α, TNFα, and C1q, and that these cytokines together are necessary and sufficient to induce A1s. A1s lose the ability to promote neuronal survival, outgrowth, synaptogenesis and phagocytosis, and induce death of neurons and oligodendrocytes. Death of axotomized CNS neurons in vivo is prevented when A1 formation is blocked. Finally, we show that A1s are highly present in human neurodegenerative diseases including Alzheimer’s, Huntington’s, Parkinson’s, ALS, and Multiple Sclerosis. Taken together these findings explain why CNS neurons die after axotomy, strongly suggest that A1s help to drive death of neurons and oligodendrocytes in neurodegenerative disorders, and point the way forward for developing new treatments of these diseases.
Introduction
Astrocytes are abundant cells in the central nervous system (CNS) that provide trophic support for neurons, promote formation and function of synapses, and prune synapses by phagocytosis, in addition to fulfilling a range of other homeostatic maintenance functions1–4. Astrocytes undergo a dramatic transformation called “reactive astrocytosis” after brain injury and disease and up-regulate many genes5,6 and form a glial scar after acute CNS trauma1,6,7. Functions of reactive astrocytes have been a subject of some debate, with previous studies showing they both hinder and support CNS recovery1,6–9. It has not been clear under what contexts they may be helpful or harmful and many questions remain about their functions.
We previously purified and gene profiled reactive astrocytes from mice treated either with a systemic injection of lipopolysaccharide (LPS), or received middle cerebral artery occlusion to induce ischemia5. We found neuroinflammation and ischemia induced two different types of reactive astrocytes that we termed “A1” and “A2” respectively (in analogy to the “M1”/“M2” macrophage nomenclature, a nomenclature under current refinement because macrophages clearly can display more than two polarization states8,9). A1s highly up-regulate many classical complement cascade genes previously shown to be destructive to synapses, so we postulated that A1s might be harmful. In contrast, A2s up-regulated many neurotrophic factors and we thus postulated that A2s are protective. Consistent with this latter possibility, previous studies have provided evidence that reactive astrocytes induced by ischemia promote CNS recovery and repair1,10,11.
Here we show that A1 reactive astrocytes are induced by activated microglia. A1s lose most normal astrocyte functions but gain a new neurotoxic function, rapidly killing neurons and mature differentiated oligodendrocytes. We show A1s rapidly form in vivo after CNS injury and are highly present in many human neurodegenerative diseases. Lastly we show that inhibition of A1 reactive astrocyte formation after acute CNS injury, prevents death of axotomized neurons. Thus A1 reactive astrocytes are harmful, contributing to neuron death after acute CNS injury. Understanding the multidimensional roles of reactive astrocytes has great potential to contribute to development of new treatment strategies to reduce CNS cell loss and neurological impairment after acute CNS injury as well as in neurodegenerative diseases.
1. Screen for cellular and molecular inducers of the A1 phenotype
We first investigated whether microglia induce A1 reactive astrocytes because LPS is a strong inducer of A1s1 and is an activator of TLR4 signaling, a receptor expressed specifically by microglial in the rodent CNS12–15. We took advantage of Csf1r−/− knock-out mice that lack microglia16 (Extended Data Fig. 1) to ask whether A1s can be produced without microglia. To assess astrocyte reactivity, we used a microfluidic qPCR screen to determine gene expression changes in astrocytes purified by immunopanning from saline- and LPS-treated wild type control or Csf1r−/− mice. As expected, wild-type littermate controls had a normal response to LPS injection5,17, with robust induction of an A1 response (Fig. 1a), however astrocytes from Csf1r−/− mice failed to activate A1s. These findings show reactive microglia are required to induce A1 reactive astrocytes in vivo.
Figure 1. Serum-free culture model for A1 reactive astrocytes.
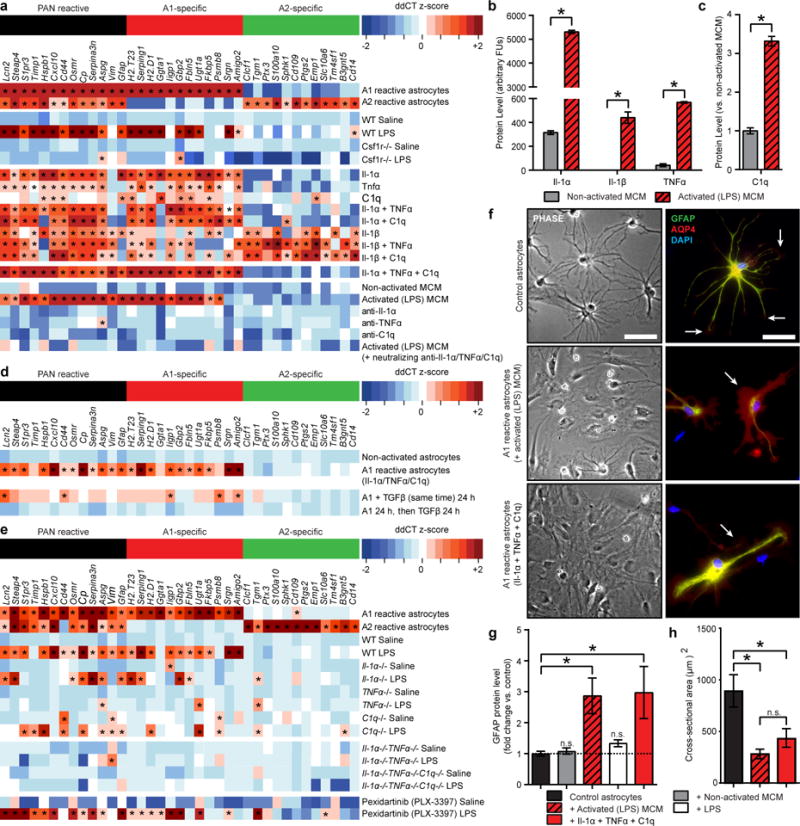
a, Heat map of reactive transcripts. Csf1r−/− mice (which lack microglia) fail to produce A1 astrocytes following LPS injection. LPS-activated microglia, or a combination of Il-1α, TNFα, and C1q are able to induce A1s in culture. b, Cytokine array analysis of LPS-activated microglia conditioned media (MCM) with increases in Il-1α, Il-1β and TNFα (Il-1β was not A1-specific). c, Western blot analysis of LPS-activated MCM for C1q protein. d, TGFβ was able to reset A1 reactive astrocytes to a non-reactive state. e, Individual knock-out (Il-1α−/−, TNFα−/−, C1q−/−), double (Il-1α−/−TNFα−/−), and triple knock-out (Il-1α−/−TNFα−/−C1q−/−) mice fail to produce A1s following LPS injection. Mice treated with Pexidartinib (PLX-3397) for 7 days to deplete 95% of microglia (Extended Data Fig. 1) still respond to LPS by producing A1s. f, Representative phase and fluorescent immunohistochemistry micrographs for GFAP and AQP4 of control and A1 reactive astrocytes. g, Western blot analysis of GFAP protein in cultured astrocytes showing approximate 3-fold increase in A1s compared to control. h, Measurements of cross-sectional area of astrocytes stained with GFAP. n = 6–8 for each experiment. * p < 0.05, one-way ANOVA. Error bars indicate s.e.m. Scale bar: 50 μm.
To determine what microglia-secreted signals induce A1s, we next performed a screen to individually test various candidate molecules. We used immunopanning18 to prepare highly pure populations of resting (non-reactive) astrocytes (Extended Data Fig. 2a,b). We cultured purified astrocytes in serum-free conditions and tested effects of various molecules on gene expression using our microfluidic assay. As a control, we first investigated if astrocytes in culture can respond to LPS and found they do not (Extended Data Fig. 2). This was expected as rodent astrocytes lack receptors and downstream signaling components required for LPS-activation (TLR4 and MYD88)12–14. We found however, that several cytokines could induce some, but not all, A1 reactive genes. Our best inducers of a partial A1 phenotype were interleukin 1 alpha (Il-1α), tumor necrosis factor alpha (TNFα), and complement component 1, q subcomponent (C1q,). When purified astrocytes were cultured with all three cytokines, astrocytes exhibited an A1 phenotype nearly identical to the A1 phenotype induced by LPS in vivo (Fig. 1a). All three of these cytokines are highly expressed specifically by microglia13,15, again suggesting a critical role for microglia in inducing A1 reactive astrocytes.
2. Reactive microglia induce A1 reactive astrocytes by secreting Il-1α, TNFα and C1q
To further confirm that microglia induce A1 reactive astrocytes, we purified microglia by immunopanning and cultured astrocytes in control microglia conditioned medium (MCM) or MCM from microglia that had first been made reactive with LPS. LPS-activated MCM, but not resting MCM, strongly induced A1 reactive astrocytes (Fig. 1a). The level to which these transcripts were induced was comparable to that seen in vivo following systemic LPS injection5 (Extended Data Fig. 3).
To verify which cytokines microglia use to signal A1 induction, we purified microglia by immunopanning and determined which cytokines are secreted by resting and LPS-activated microglia. Levels of Il-1α, TNFα and C1q were all significantly elevated after microglial activation (Fig. 1b, c). Il-1β secretion also increased in LPS-activated MCM, but was unable to induce expression of A1 transcripts (Fig. 1a). We also tested a range of other microglia-secreted cytokines that were unable to induce A1s (Extended Data Fig. 2). The combination of Il-1α, TNFα and C1q however, closely mimicked that of LPS-reactive MCM (Fig. 1a).
To ensure no other factors secreted by LPS-activated microglia could also make A1s, we collected LPS-activated MCM and pre-treated it with neutralizing antibodies to Il-1α, TNFα, and C1q. This pre-treated MCM was unable to induce reactive astrocyte genes (Fig. 1a, Extended Data Fig. 3e). Thus Il-1α, TNFα and C1q together are sufficient to induce the A1 phenotype, and are necessary for LPS-reactive microglia to induce A1s in vitro.
Does cessation of Il-1α, TNFα, and C1q signaling enable A1 reactive astrocytes in vitro to revert back to resting astrocytes or is the A1 phenotype stable? To find out, we removed all three cytokines from A1 cultures, and added neutralizing antibodies to all three to make sure they were fully inhibited. After 7 days, we assessed levels of A1 transcripts and found the A1 phenotype remained. As a proof of principal, we also investigated if additional molecules could revert A1s to a non-reactive phenotype. We tested the anti-inflammatory cytokine TGFβ and FGF (as it has been previously shown that astrocyte activation is suppressed in the injured brain by FGF signaling19). We grew A1s in culture, then treated with TGFβ or FGF and found both significantly decreased reactive astrocyte transcript levels (Fig. 1d, Extended Data Fig. 3). Whether or not there are additional signaling processes that can revert A1s in vivo is an important question for future studies.
We next investigated if genetic deficiency of Il-1α, TNFα, or C1q would be sufficient to prevent A1 astrocyte reactivity in vivo. First we checked if single knock mice (Il-1α−/−, TNFα−/−, or C1q−/−) were still able to produce neuroinflammatory reactive microglia following systemic LPS injection. Using qPCR we saw microglia from these animals still had many reactive transcripts15 highly upregulated 24 h following LPS injection (Extended Data Fig. 4). We next used astrocytes purified from these same mice and used our microfluidic qPCR screen to determine whether they were reactive. Each knock-out mouse had significantly decreased A1 astrocyte reactivity (Fig. 1e). Additionally, we looked at double (Il-1α−/−TNFα−/−) and triple knock-out mice (Il-1α−/−TNFα−/−C1q−/−) and saw decreases in A1 reactivity, with triple knock-out animals having no response following systemic LPS injection (Fig. 1e). Microglia from these same knock-out mice still upregulate inflammatory mediators in response to LPS injection, but simply fail to release A1 initiators (Extended Data Fig. 4). Taken together our data show that microglia-derived Il-1α, TNFα, and C1q work together to mediate A1 reactive astrocytes.
3. A1 reactive astrocytes lose many normal astrocyte functions
A1 reactive astrocytes have decreased synaptic functions
Can A1 reactive astrocytes induce formation of functional synapses in vitro? We cultured purified retinal ganglion cells (RGCs) with resting or A1 reactive astrocytes and quantified synapse number by double immunostaining for pre- and post-synaptic proteins (Fig. 2a, Extended Data Fig. 5). RGCs cultured with A1s had 50% less synapses compared to those grown with control astrocytes (Fig. 2b). When RGCs were cultured with control astrocytes to induce synapse formation and then cultured with A1s, synapse number significantly decreased by about 40%, suggesting that A1s are either unable to maintain these synapses or actively disassemble them.
Figure 2. A1 reactive astrocytes do not promote synapse formation or function.
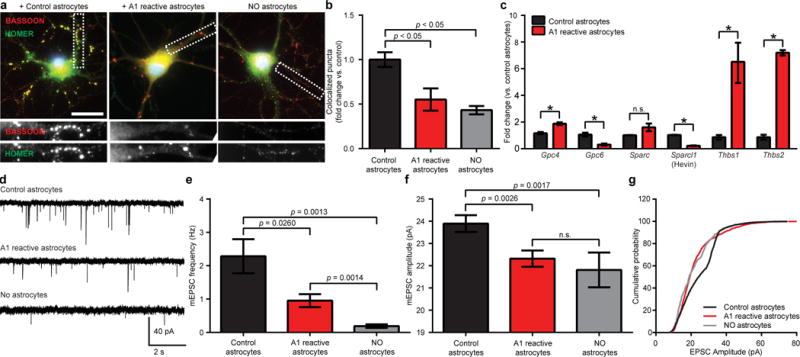
a, Representative images of retinal ganglion cells (RGCs) grown without astrocytes, or with control or A1 reactive astrocytes, immunostained with pre- and post-synaptic markers HOMER (green) and BASSOON (red). Co-localization (yellow puncta) was counted as a structural synapse. b, Total number of synapses normalized per each individual RGC, n = 50 neurons in each treatment. c, Quantitative PCR for astrocyte secreted synaptogenic factors. d, Representative traces of whole-cell patch clamp mEPSC recordings from RGCs. e, Frequency of mEPSCs was significantly decreased in presence of A1s (RGCs without astrocytes: 0.19 ± 0.05 Hz n = 12 neurons, RGCs with resting astrocytes: 2.28 ± 0.51 Hz n = 14 neurons, RGCs with A1s: 0.95 ± 0.19Hz n = 16 neurons). f, A1s significantly decreased mean amplitude of mEPSCs (RGCs without astrocytes: 21.81 ± 0.78 pA n = 12 neurons, RGCs with resting astrocytes: 23.89 ± 0.38 pA n = 14 neurons, RGCs with A1s: 22.32 ± 0.37 pA n = 16 neurons). g, RGCs cultured with A1s had significantly more small amplitude mEPSCs in cumulative probability histograms (p < 0.0001 Kolmogorov-Smirnov test, n = 12–16 neurons per condition). * p < 0.05, one-way ANOVA. Error bars indicate s.e.m. Scale bar: 10 μm.
Astrocytes induce formation of excitatory synapses by secreting GPCG4/620, SPARCL121, and thrombospondins (THBS1/2)22, so we next investigated whether reactive astrocytes still produce these factors. Quantitative PCR showed decreased Gpc6 and Sparcl1, while simultaneously showing increased expression of Thbs1/2 (Fig. 2c). This increase in thrombospondins (which should increase synaptic number) suggests the decreased synapse number may reflect an A1-induced toxicity to synapses (see below). To determine effects of A1 reactive astrocytes on synapse function we used whole-cell patch clamp recording on RGCs cultured with resting astrocytes or A1s. RGCs cultured with A1s had significantly decreased frequency and amplitude of miniature excitatory postsynaptic currents when compared to RGCs cultured with resting astrocytes (Fig. 2d–g). Taken together these results show A1 reactive astrocytes induce formation of fewer synapses, and the few synapses they do induce are significantly weaker when compared to those produced by healthy resting astrocytes.
A1 reactive astrocytes have decreased phagocytic capacity
To compare phagocytic ability of normal and A1 astrocytes, we measured engulfment of purified synaptosomes. A1s engulfed 50–75% fewer synaptosomes than control astrocytes (Fig. 3a,b). Similarly, we found control astrocytes are able to robustly phagocytose myelin debris, but upon conversion to an A1 reactive phenotype almost completely lose this capacity (Fig. 3a,c). This phagocytic deficit corresponded with a 90% decrease in Mertk and 60% decrease in Megf10 mRNA, phagocytic receptors we have previously found mediate synaptic phagocytosis3 (Fig. 3f). To determine whether A1s also display decreased phagocytic ability in vivo, we used Aldh1l1-eGFP transgenic mice and LPS injection (Extended Data Fig. 6) to visualize phagocytosis of Alexa594-conjugated cholera toxin-β, CTB-594, labelled synapses by control and A1 astrocytes. Confocal microscopy was used to visualize engulfed CTB-labelled synapses inside Aldh1l1-eGFP fluorescent astrocytes as we previously reported3. We found A1 reactive astrocytes in the LGN in vivo show the same significant loss of synaptic engulfment ability (around 50% compared to astrocytes in saline-treated control animals) as was seen in our in vitro assay (Fig. 3a,b,d,e). Combined, these data show A1 reactive astrocytes have deficiencies in phagocytosis of both synaptosomes and myelin debris in culture, that this deficiency can also influence efficiency of synaptic pruning in vivo, and suggest that A1s may well lose the capacity to clear myelin debris in vivo, an important area for future investigation.
Figure 3. A1 astrocytes lose phagocytic capacity.
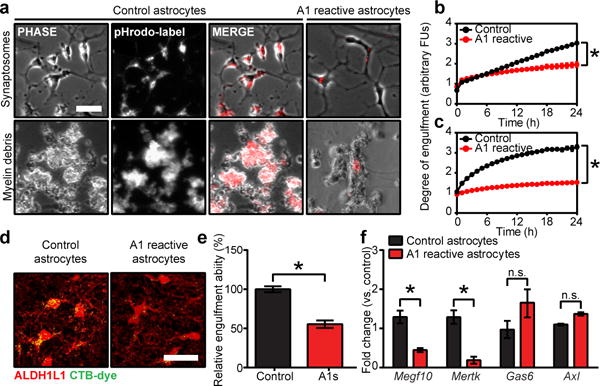
a, Phase and fluorescent images of cultured astrocytes engulfing pHrodo-conjugated synaptosomes (quantification in b) and myelin debris (quantification in c). d, Representative confocal reconstruction showing cholera toxin B, CTB-labelled retinal ganglion cell projections engulfed by control and A1 astrocytes in dorsal lateral geniculate nucleus. Quantification in e, n = 4 per group. f, Quantitative PCR analysis of astrocyte-specific phagocytic receptors (Megf10 and Mertk, decreased in A1 reactive astrocytes) and bridging molecules (Gas6 and Axl, unchanged). * p < 0.05, one-way ANOVA, or Student’s t-test as appropriate. Error bars indicate s.e.m. Scale bar: 15 μm (a); 10 μm (f).
4. A1 reactive astrocytes are powerfully neurotoxic
Normally astrocytes promote CNS neuronal survival23. To determine whether A1s also promote neuronal survival, we co-cultured control and A1 reactive astrocytes with purified RGCs and measured viability. We found RGCs rapidly died when grown with increasing concentrations of A1 reactive astrocyte conditioned media (ACM, Fig. 4a,c). At the highest concentrations there was almost 100% death of cells (Fig. 4c). A1s were similarly toxic to cortical neurons, embryonic spinal motor neurons, and mature differentiated oligodendrocytes (Fig. 4b,d), however even at high doses spinal motor neurons remained around 20% viable; we found that preganglionic and gamma motor neurons were not susceptible to A1-induced toxicity (Extended Data Fig. 7m). Although not toxic to oligodendrocyte precursor cells, A1s were able to slow their differentiation and division (Extended Data Fig. 8). In addition, we tested susceptibility of human dopaminergic neurons to A1-induced toxicity and found that, like rodent cells, they also showed decreased viability with 25% of human dopaminergic cells dying due to A1-induced toxicity (Fig. 4e). This death could not be attributed to Il-1α, TNFα, and C1q alone, which did not cause death of cells in purified cultures. Death was blocked by caspase-2/-3 inhibitors but not by necrostatin or glutamate blockers and thus appeared to be due to apoptosis (Extended Data Fig. 9). Thus, A1s secrete a soluble toxin that rapidly kills a subset of CNS neurons and mature oligodendrocytes, but not other CNS cell types.
Figure 4. Astrocyte-derived toxic factor promoting cell death.
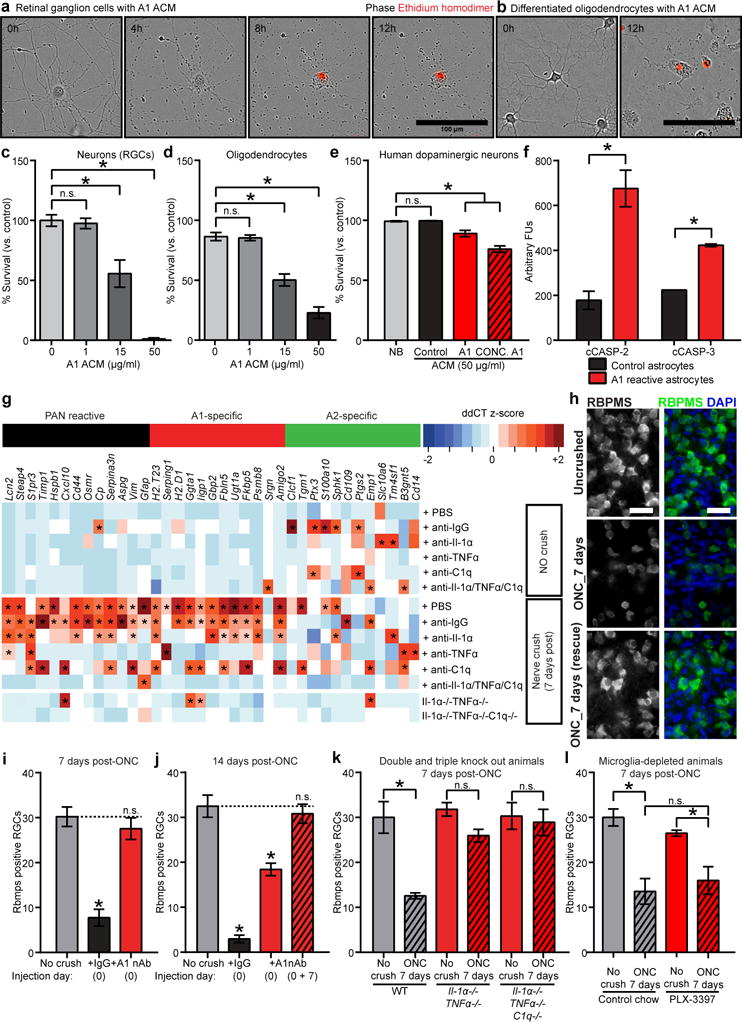
Representative phase image showing death of purified retinal ganglion cells (RGCs) in culture (ethidium homodimer stain in red shows DNA in dead cells (a, 24 h quantification in c), and differentiated oligodendrocytes (b, 24 h quantification in d). e, Quantification of A1-induced cell death in human dopaminergic neurons (5 days). f, Western blot analysis for cleaved caspase-2 and -3 in RGCs treated with control and A1 ACM. g, retro-orbital optic nerve crushes (ONC) produced A1s in the retina. Intravitreal injection of neutralizing antibodies to Il-1α, TNFα, and C1q blocked A1 production. h, RBPMS (RNA-binding protein with multiple splicing, an RGC marker) immunostaining of whole-mount retinas showed decreased number of RGCs in ONC, rescued with neutralizing antibody treatment. Quantification is shown post ONC at 7 days (i), 14 days (j) using neutralizing antibodies, and at 7 days using Il1α−/−TNFα−/− and Il1α−/−TNFα−/− C1q−/− animals (k), and microglia-depleted (PLX-3397-treated) animals (l). * p < 0.05, one-way ANOVA. n = 8 in each instance. Error bars indicate s.e.m. Scale bar: 100 μm (a,b); 20 μm (k).
5. Death of CNS neurons after axotomy in vivo is prevented by inhibiting A1 reactive astrocyte formation
It has been a longstanding mystery why CNS neurons die after axotomy. One idea has been that axotomy interrupts a retrograde neurotrophic signal. Because injured spinal cords contain neuroinflammatory microglia and/or macrophages24, we hypothesized axotomy could also induce formation of A1s which in turn kill axotomized neurons. We used optic nerve crush (ONC) in postnatal rats and mice as a model system. ONC rapidly induced robust A1 generation that was temporally paired with death of RGCs (Fig. 4i–o). Weekly injection of neutralizing antibodies to Il-1α, TNFα, and C1q together into the vitreous of the eye from the time of injury inhibited A1 formation and prevented death of RGCs at least as long as 14 days post-ONC (Fig. 4g–j). Finally, we performed optic nerve crushes in double (Il-1α−/−TNFα−/−) and triple (Il-1α−/−TNFα−/−C1q−/−) knock-out mice that fail to generate A1s, and found that 7 days following optic nerve crush RGCs remained viable unlike their wild-type control counterparts (Fig. 4k). These data provide strong evidence that death of RGCs after axotomy is not due to trophic deprivation but is instead due to release of a toxic signal from nearby neurotoxic A1 reactive astrocytes.
6. A1 reactive astrocytes in human disease
Because A1s are induced after injury and by LPS (a well-described neurodegeneration sensitizer that causes extensive neuroinflammation25,26), and because reactive microglia are found in neurodegenerative diseases, we investigated whether A1s are present in human neuroinflammatory and neurodegenerative diseases. Because complement component C3 is one of the most characteristic and highly upregulated genes in A1s and is not expressed by ischemic A2 reactive astrocytes (Extended Data Fig. 10), we carried out in-situ hybridization and immunochemistry on post-mortem tissue from patients with Alzheimer’s disease (AD), Huntington’s disease (HD), Parkinson’s disease (PD), amyotrophic lateral sclerosis (ALS), and Multiple Sclerosis (MS) to identify whether there are C3-expressing A1 astrocytes in these diseases. We found many GFAP and S100β positive astrocytes that were C3 positive (either in situ or immunofluorescent) in regions traditionally associated with each disease (Fig. 5), and qPCR analysis confirmed upregulation of C3 in postmortem tissue samples. In demyelinating lesions of MS, C3-positive astrocytes were typically closely associated with CD68 positive activated microglia/macrophages (Fig. 5; Extended Data Fig. 11). In human AD, nearly 60% of GFAP positive astrocytes in the prefrontal cortex were positive for C3, suggesting that A1 activated astrocytes make up a large proportion of astrocytes in AD in CNS regions affected by neurodegeneration, and may thus be integral for disease initiation and progression. In addition to C3, reactive astrocytes in these diseases were also immunoreactive for several other A1 specific markers (Extended Data Fig. 11). These findings demonstrate that A1-like reactive astrocytes are present in most major neurodegenerative diseases, where they are likely to help to drive neurodegeneration.
Figure 5. A1 (C3 positive) reactive astrocytes in human disease.
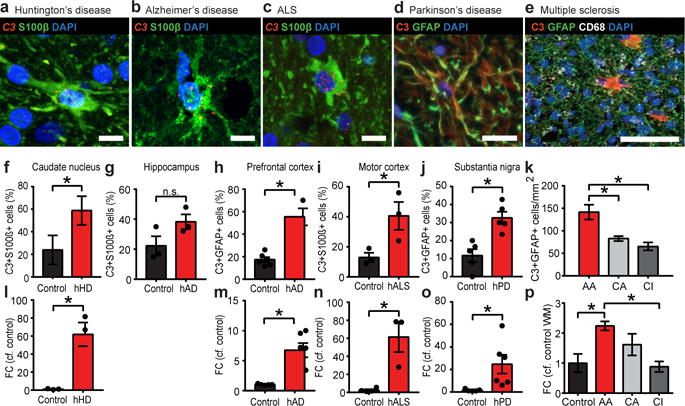
Representative in situ hybridization for C3 and immunofluorescent staining for S100β in Huntington’s (HD, a) and Alzheimer’s (AD, b) diseases, and amyotrophic lateral sclerosis (ALS, c), and co-immunofluorescent staining for C3 and GFAP in Parkinson’s disease (PD, d) and multiple sclerosis (MS, e). Quantification in HD (f), AD in both hippocampus (g) and prefrontal cortex (h), ALS (i), PD (j) and MS (k) shows around 30–60% of astrocytes in brain regions specific to each disease in humans are C3 positive A1s. l–p, Increase in expression of C3 transcript in all diseases (by qPCR). N=3–8 disease and 5–8 control in each instance. Quantification was carried out on 5 fields of view and approximately 50 cells were surveyed per sample. Scale bar: 100 μm (n,o), 20 μm (d,p–t), 10 μm (a–c). Error bars indicate s.e.m. * p < 0.05, Student’s T-test (f–j, l–o), one-way ANOVA (k,p) compared to age-matched control.
7. Concluding Remarks
Here we have identified A1 neurotoxic reactive astrocyte formation as a fundamental pathological response of the CNS to LPS-induced neuroinflammation, acute CNS injury, and most or all neurodegenerative diseases. Our findings identify a new role for activated microglia in inducing A1s via secretion of Il-1α, TNFα, and C1q in vitro and in vivo. In contrast to A2 reactive astrocytes, which are induced by ischemia5 and strongly promote neuronal survival and tissue repair10,27–29, A1s secrete a neurotoxin that induces rapid death of neurons and oligodendrocytes. A1s have lost many characteristic astrocyte functions including: ability to promote neuronal survival and outgrowth, promote synapse formation and function, and to phagocytose synapses and myelin debris. A1s are rapidly induced after acute CNS injury and responsible for the death of axotomized RGCs. A1s are also highly present in neurodegenerative diseases where their presence may well contribute to neurodegeneration and help to drive disease progression.
These findings raise important questions. First, what is the identity of the neurotoxin? We are presently using biochemical approaches to purify and characterize it. Second, to what extent are A1s present in spinal cord injury, CNS brain trauma, and other neuroinflammatory and neurodegenerative diseases, and are A1s actively driving death of neurons, axons, and synapses and/or oligodendrocytes in these diseases? Astrocytes have been found to be toxic to spinal motor neurons in ALS30,31 – do they have an A1 phenotype? In Alzheimer’s disease, oligomeric amyloid beta is a strong activator of microglia32 and our findings provide evidence that A1s are present in regions of neurodegeneration in human post mortem tissue. Although we found that activated microglia were insufficient by themselves to kill neurons, they strongly induce A1s, which could drive neurodegeneration not only by secreting a neurotoxin but by releasing multiple complement components that help to drive synapse degeneration33. In acute relapsing and remitting MS, we also observed C3-expressing A1s in demyelinating plaques. This suggests the possibility that demyelinating lesions, which generally also contain unmyelinated axons and OPCs, fail to remyelinate because A1s inhibit OPC proliferation and differentiation and kill any newly-generated oligodendrocytes (in the chronic progressive phase of the disease A1s might also drive axon degeneration). Would drugs that prevent or revert A1 formation or block action of the A1 neurotoxin prevent neurodegeneration in these diseases and stimulate spontaneous remyelination in MS and new synapse formation in diseases such as Alzheimer’s? Similarly, would drugs that prevent or revert A1s save axotomized CNS neurons after spinal cord injury and promote regeneration by stimulating growth and allowing these astrocytes to clear myelin debris? Future studies should test these possibilities in animal models, as antibody drugs that inhibit human IL-1α and TNFα are already FDA approved and in use for other medical conditions. Lastly, do epithelial cells outside the CNS undergo an A1-like neurotoxic transformation after injury or disease that contributes to cell death of non-CNS cell types, for instance beta islet cells in diabetes?
A mystery is why the injured and diseased CNS would ever produce a neurotoxic reactive astrocyte. Although A1s are not directly toxic to bacteria, they do secrete many classical complement cascade components that are expected to greatly enhance clearance of bacteria by the immune system. Similarly, future studies should address whether A1s can recognize and kill virally-infected neurons in order to prevent spread of CNS viral infections, and whether A1s might control CNS immune response by recruiting or killing specific infiltrating immune cell types. Whatever the answers, new drugs that prevent A1 formation, promote A1 reversion, or block the A1 neurotoxin, hold great potential to treat a variety of chronic neurological diseases and acute CNS injuries.
Methods
Methods Summary
All Procedure were conducted in accordance with the animal care standards of the National Institute of Health and approved by Stanford University’s Administrative Panel on Laboratory Animal Care. Astrocytes and all other CNS cells were purified from postnatal day 5 rat or mouse cortex and cultured in serum-free conditions. All experiments with mutants were performed blindly without knowledge of their genotype.
Animals
Sprague Dawley rats were from Charles River. TNFα−/− (B6.129S-Tnftm1Gkl/J) transgenic mice and wild type C57BL/6J mice were from Jackson Laboratories. C1q(a)−/− (C57BL/6) were from previous studies in our lab34. Il-1α−/− mice were a gift from Dr Russell E. Vance, UC Berkeley. Tg(Aldh1l1-EGFP)OFC789Gsat/Mmucd mice were used to visualize astrocytes in in vivo phagocytic assays. Double (Il-1α−/− TNFα−/−) and triple (Il-1α−/− TNFα−/−C1q−/−) animals were developed in-house. All lines were maintained by breeding with C57BL/6 mice. Animals were randomly assigned numbers and evaluated thereafter blind (to both experimental condition and genotype).
Immunopanning and cell culture
Astrocytes were purified by immunopanning from postnatal day 5 rats or mice (see above) forebrains and cultured as previously described18. Briefly, cortices were enzymatically (papain) then mechanically dissociated to generate a single cell suspension that was incubated on successive negative immunopanning plates to remove microglia, endothelial cells, and oligodendrocyte lineage cells before positively selecting for astrocytes with an Itgb5-coated panning plate. Isolated astrocytes were cultured in a defined, serum-free base media containing 50% neurobasal, 50% DMEM, 100 U/ml penicillin, 100 μg/ml streptomycin, 1 mM sodium pyruvate, 292 μg/ml L-glutamine, 1× SATO and 5 μg/ml of N-acetyl cysteine. This media was supplemented with the astrocyte-required survival factor HBEGF (Peprotech, 100–47) at 5ng/ml as previously descried18. A similar immunopanning protocol was used for other central nervous system cell types, with positive selection using THY1 (cortical neurons), 192 hybridoma clone (embryonic spinal motor neurons35), CD31 (endothelial cells36), O4 (oligodendrocyte lineage cells), PDGFRβ (pericytes37), CD45 (microglia/macrophages). A1 reactive astrocytes were generated in vitro by growing purified astrocytes for 6 days and then treating for 24 h with Il-1α (3 ng/ml, Sigma, I3901), TNFα (30 ng/ml, Cell Signaling Technology, 8902SF), and C1q (400 ng/ml, MyBioSource, MBS143105).
Microfluidic qPCR (pooled cell samples)
Total RNA was extracted from immunopanned cells using the RNeasy Plus kit (Qiagen) and cDNA synthesis performed using the SuperScript® VILO cDNA Synthesis Kit (Invitrogen, Grand Island, NY, USA) according to supplier protocols. We designed primers using NCBI primer blast software (http://www.ncbi.nlm.nih.gov/tools/primer-blast/) and selected primer pairs with least probability of amplifying nonspecific products as predicted by NCBI primer blast. All primers had 90–105% efficiency. We designed primer pairs to amplify products that span exon–exon junctions to avoid amplification of genomic DNA. We tested the specificity of the primer pairs by PCR with rat and mouse whole-brain cDNA (prepared fresh), and examined PCR products by agarose gel electrophoresis. For microfluidic qRT-PCR, 1.25 μl of each cDNA sample was pre-amplified using 2.5 μl of 2× Taqman pre-amplification master mix (Applied Biosystems, Waltham, MA, USA) and 1.25 μl of the primer pool (0.2 pmol each primer/μl, primer sequences for rat and mouse are provided in Supplemental Data Tables 1–2). Pre-amplification was performed using a 10 min 95 °C denaturation step and 14 cycles of 15 s at 95 °C and 4 min at 60 °C. Reaction products were diluted 5 times in TE Buffer (Teknova, Hollister, CA, USA). Five microliters from a sample mix containing pre-amplified cDNA and amplification Master mix (20 mm Mgcl2, 10 mm dNTPs, FastStart Taq polymerase, DNA binding Dye loading reagent, 50× ROX, 20× Evagreen) was loaded into each sample inlet of a 96.96 Dynamic Array chip (Fluidigm Corporation, San Francisco, CA, USA) and 5 μl from an assay mix containing DNA assay loading reagent, as well as forward and reverse primers (10 pmol/μl) was loaded into each detector inlet. The chip was then placed in the NanoFlexTM 4-IFC Controller (Fluidigm) for loading and mixing. After loading, the chip was processed in the BioMark™ Real-Time PCR System (Fluidigm) using a cycling program of 10 min at 95 °C followed by 40 cycles of 95 °C for 15 s and 60 °C for 30 s and 72 °C for 30 s. After completion of qPCR, a melting curve of amplified products was determined. Data were collected using BioMark™ Data Collection Software 2.1.1 build 20090519.0926 (Fluidigm) as the cycle of quantification (Cq), where the fluorescence signal of amplified DNA intersected with background noise. Fluidigm data were corrected for differences in input RNA using the geometric mean of three reference genes Aldh1l1, Gapdh, Rplp0. Data preprocessing and analysis was completed using Fluidigm Melting Curve Analysis Software 1.1.0 build 20100514.1234 (Fluidigm) and Real-time PCR Analysis Software 2.1.1 build 20090521.1135 (Fluidigm) to determine valid PCR reactions. Invalid reactions were removed from later analysis. Quantitative RT-PCR was conducted following the MIQE (minimum information for publication of quantitative real-time PCR experiments) guidelines38. The array accommodated reactions for 96 samples and 96 genes in total. The pre-amplified cDNA samples from the stimulation experiments were measured together with no reverse transcriptase and no template controls on 96.96 Dynamic Array chips (Fluidigm). Cell-type specific transcripts were also detected for microglia, oligodendrocyte lineage cells, and neurons, with any astrocyte samples containing measurable levels of other cell types removed from further analysis. All primer sequences for rat and mouse are listed in Supplemental Data Tables 1 and 2.
Microfluidic qPCR (single cell samples)
Experiments were performed on mice from the transgenic mouse line Tg(Aldh1l1-EGFP)OFC789Gsat/Mmucd. For neuroinflammatory injury, postnatal day 5 (P5) mice received a single intraperitoneal injection of either endotoxin-free PBS, or the endotoxin lipopolysaccharide (LPS) from E. coli O55:B55 (Sigma-Aldrich) dissolved in normal saline and diluted into endotoxin-free PBS (5 mg/kg).
For ischemic injury, published protocols39 for middle cerebral artery occlusion (MCAO) were modified as follows for P5 mice. Pups were anesthetized and maintained with 2–3% isoflurane in O2 on a rectal thermometer feedback heat pad at 37 °C. The animal’s heads were shaved, and cleaned with chlorhexidine, then sterile saline. Mice were injected subcutaneously with antibiotic (25 mg/kg cefazolin) and analgesic (0.1 mg/kg buprenorphine). A 4 mm horizontal incision and a 4 mm vertical incision were made to create a skin flap over the temporalis muscle. The temporalis muscle was also incised in a similar manner so that the skull was exposed. A micro drill was used to create a 2 mm diameter hole directly over the middle cerebral artery, the meninges were removed, and the middle cerebral artery was cauterized. The brain surface was rinsed with saline, and the temporalis muscle was folded back in to place and the skin was sealed with surgical glue. Animals were placed in a warm cage to recover from anesthesia until awake and ambulatory. Animals were left for 24 hours, at which time animals were killed by decapitation and single-cell suspensions for each control and experimental condition were made for downstream FACS analysis (see below).
For both treatment groups, cortices from individual animals were collected separately from four LPS-injected or saline-injected control animals. The hippocampus, cerebellum, and olfactory bulbs were removed, as were the meninges. For the MCAO model, the ipsilateral cortex was collected, while the contralateral cortex, and other brain regions were discarded. Four mice that had undergone MCAO and four sham-operated control surgery were used. Dissected tissue was treated as described previously12 – briefly, dissected tissue was first diced to 1–3 mm and then digested with 200 U of papain enzyme for 90 min at 34 °C in bicarbonate-buffered Earle’s balanced salt solution with 0.46% glucose, 26 mM sodium bicarbonate, 0.5 mM EDTA, and 125 U/ml DNase I (Worthington Biochemicals). Digested tissues were dissociated into single-cell suspensions by gentle trituration, and myelin removed using O4, Mog, and GalC supernatants (1:30 at room temperature for 30 minutes). Myelin and larger tissue clumps were removed by filtering through 3 layers of Nitex mesh, and cells collected by centrifugation, before resuspension in Dulbecco’s PBS (DPBS) containing 0.02% BSA and 125 U/ml DNase I and with LIVE/DEAD® Fixable Far Red Dead Cell Stain Kit (ThermoFisher, L34973) for fluorescence-activated cell sorting (FACS).
For FACS analysis live astrocytes were isolated at room temperature by FACS at the Stanford Shared FACS Facility on the basis of their GFP expression on a BD Aria II or BD Influx. Cell suspensions were sorted twice sequentially using forward light scatter and SSC to gate single cells, followed by gating for GFP fluorescence in the absence of LIVE/DEAD stain to select live astrocytes. Individual cells were collected directly into 96-well PCR plates containing RT-STA Mix solution (see below) for microfluidic qPCR. Flowjo software (Treestar) was used to analyze purity of final astrocyte populations.
For single cell microfluidic qPCR Fluidigm Advanced Development Protocol #41 for single cell gene expression using SsoFast Evagreen Supermix with Low ROX was used. Single cells were collect by FACS into a solution containing 5 μl CellsDirect™ 2× Reaction Mix (Thermo Scientific, 11753100), 1.0 μl Superscript® III RT Platinum® Taq Mix, 2.0 μl 10× primer mix (as for other microfluidic assays, primers at 500 nM), and 2.0 μl nuclease-free water, and frozen at -20 °C until processed.
For microfluidic qPCR, cells were defrosted on ice and preamplification PCR completed using the following thermocycling protocol: 50 °C for 15 minutes, 95 °C for 2 minutes, 18 cycles of 95 °C for 15 s and 60 °C for 4 minutes, hold at 4 °C. Excess primers were removed with 3.6 μl of Exonuclease I from E. Coli according to manufacturer protocol (New England BioLabs, M0293S): 37 °C for 30 minutes, 80 °C for 15 minutes, hold at 4 °C. This final preamplified sample was diluted 5-fold in TE Buffer (TEKnova, T0224). Five microliters of diluted sample were loaded into each sample inlet of a 96.96 Dynamic Array chip (Fluidigm Corporation, San Francisco, CA, USA) and 5 μl from an assay mix containing DNA assay loading reagent as well as forward and reverse primers (10 pmol/μl), was loaded into each detector inlet. The chip was then placed in the NanoFlexTM 4-IFC Controller (Fluidigm) for loading and mixing. After loading, the chip was processed in the BioMarkTM Real-Time PCR System (Fluidigm) using a cycling program of 10 min at 95 °C followed by 40 cycles of 95 °C for 15 s and 60 °C for 30 s and 72 °C for 30 s. After completion of qPCR, a melting curve of amplified products was determined. Data were collected using BioMarkTM Data Collection Software 2.1.1 build 20090519.0926 (Fluidigm) as the cycle of quantification (Cq), where the fluorescence signal of amplified DNA intersected with background noise. Data preprocessing and analysis was completed using Fluidigm Melting Curve Analysis Software 1.1.0 build 20100514.1234 (Fluidigm) and Real-time PCR Analysis Software 2.1.1 build 20090521.1135 (Fluidigm) to determine valid PCR reactions. Invalid reactions were removed from later analysis. Data was analyzed following published protocols for single cell RT-qPCR40.
Standard qRT-PCR
Total RNA was extracted and cDNA synthesized as above. Quantitative RT-PCR was run using 2 μl cDNA and SYBR green chemistry (Applied Biosystems/ThermoFisher Scientific, 4334973) using supplier protocol and a cycling program of 2 min at 95 °C followed by 40 cycles of 95 °C for 3 s and 60 °C for 30 s on a Mastercycler epgradient S (Eppendorf). After completion of qPCR, a melting curve of amplified products was determined. Data were collected using Eppendorf Mastercycler ep realplex v2.2 (Eppendorf). Primer sequences for rat and mouse are listed in Supplemental Data Tables 1,2. Primer sequences for human as follows: hALDH1L1 (FWD – AGGGGCTGTTTTTCTCTCGG, REV – CATGGTAGCAGGAGGGTTGG), hC3 (for AD, HD, PD, ALS, FWD – AAAAGGGGCGCAACAAGTTC, REV – GATGCCTTCCGGGTTCTCAA; for MS, FWD – CCCTGGCTCCACAGTTCTCT, REV – CAAGGAGTCCTGCTTGACCG), hRPLP0 (FWD – GAAACTCTGCATTCTCGCTTCC, REV – GATGCAACAGTTGGGTAGCCA), hS100A10 (FWD – CACGTACTAAGGAAGGCGCA, REV – TGTGGTCCGTTGAAGCCTTG).
Western blot
Protein samples (conditioned growth media) were collected at 4 °C in PBS buffer containing Complete Protease Inhibitor Cocktail (Roche) and concentrated with Amicon Ultra-15 centrifugal filter units, with a 30kDa size exclusion (EMD Millipore). Total protein concentration of samples was determined via Bradford assay (Sigma) and equal amounts of total protein were loaded onto 12% Tris-HCl gels (Bio-Rad). Following electrophoresis (100 V for 45 minutes), proteins were transferred to Immobilon-P membranes (EMD Millipore). Blots were probed overnight at 4 °C with 1:200 rabbit anti-GLYPICAN2 (abcam, ab129526), 1:200 rabbit anti-VERSICAN (abcam ab19345), 1:1000 rabbit anti-SYNDECAN1 (Invitrogen, 36-2900), 1:1000 rabbit anti-BREVICAN (MyBioSource, MBS710876), 1:1000 mouse anti-NEUROCAN (EMD Millipore, MAB5234), 1:200 mouse anti-NG2 (abcam, ab50009), 1:50 goat anti-mouse C1q (Santa Cruz Biotechnology, sc-365301). Blots were incubated with HRP-conjugated secondary antibodies at 1:5000 for 2 hours at room temperature and developed using ECL Prime Western Blotting Detection Reagent (GE Healthcare). Visualization and imaging of blots was performed with a FluorochemQ System (ProteinSimple).
Cytokine array screen
Conditioned media from immunopanned purified and cultured microglia grown in non-reactive, or LPS-induced reactive state was collected as above and 100 μg of total protein was incubated with a Rat Cytokine Antibody Array Kit (R&D Systems, ARY008) according to manufacturer protocols.
Immunohistochemistry – rodent
Animals were anaesthetized with a ketamine (100 mg/kg)/xylazine (20 mg/kg) cocktail, and perfused with ice-cold PBS followed by ice-cold 4% paraformaldehyde at approximately 70% cardiac output. Dissected brains were post-fixed overnight in 4% paraformaldehyde at 4 °C, and cryoprotected in 30% sucrose. For retinal immunohistochemistry, whole eyeballs were dissected and placed in ice-cold 4% paraformaldehyde for 10 minutes, and then washed in dPBS before dissecting the retina away from the rest of the eyeball and post-fixing in 4% paraformaldehyde overnight a 4 °C. Both brains and whole retinas were embedded in O.C.T. compound (Tissue-Tek) and 10 μm tissue sections were prepared with a Leica cryostat. The following antibodies were used: 1:5000 rabbit anti-GFAP (DAKO, Z0334), 1:500 rat anti-GFAP (Invitrogen, clone 2.2B10), rabbit anti-AQP4 (Sigma, HPA014784), 1:500 rabbit anti-RBPMS (PhosphoSolutions, 1830-RBPMS), 1:500 mouse anti-CD68 (AbD Serotec, clone 514H12), 1:500–1500 rabbit anti-hC3D (DAKO, A0063). Primary antibodies were visualized with appropriate secondary antibodies conjugated with Alexa fluorophore (Invitrogen).
Immunohistochemistry – human
Immunohistochemistry of human post mortem MS tissue (see Supplemental Data Table 3) was completed on 20 μm thick snap-frozen sections, fixed with ice-cold methanol. Blocking steps included peroxidase blocking with H2O2, avidin and biotin blocking (Vector), and normal serum blocking with 10% serum of species in which secondary antibodies were raised, diluted in 1× phosphate-buffered saline (PBS) with 0.01% Triton-X (PBST). Incubations with primary antibodies diluted in PBST were overnight at 4 °C (mouse anti-rat MOG, Millipore MAB5680 1:1000; MHC-II, abcam HLA DR ab80658 1:50; mouse anti-human CD68, AbD Serotec MCA1815 1:200; rat anti-GFAP, Invitrogen MA5-12023 1:500; mouse anti-human S100A10, Invitrogen MA5-15326 1:1000; rabbit anti-human C3D, DAKO A0063 1:1000), and detection was achieved by signal amplification using biotinylated secondary antisera (Vector) followed by avidin–peroxidase (Vectastain ABC; Vector). Diaminobenzidine (DAKO) was used as chromogenic substrate. Negative control sections without primary antibodies were processed in parallel. Sections were counterstained with either hematoxylin, or 4′,6-diamidino-2-phenylindole (DAPI). Double and triple fluorescence staining was performed with fluorochromes tagged to streptavidin and secondary antibodies (Alexa Fluor 488, 594, and 647, Invitrogen).
Immunofluorescent double labelling for GFAP and C3 of human postmortem AD tissue (see Supplemental Data Table 4) and PD tissue (see Supplemental Data Table 5) was completed on 16 μm thick snap-frozen sections, fixed with ice-cold 1:1 methanol:acetone for 5 minutes at room temperature. Endogenous protein activity was blocked with 10% serum of species in which secondary antibodies were raised, diluted in 1× PBST for 2 hours at room temperature. Primary antibody incubations were made overnight at 4 °C – for AD, rat anti-mouse GFAP (1:1000, Sigma G3893) and for PD, mouse anti-porcine GFAP (1:1000, Millipore MAB360), and rabbit anti-human C3D (1:1000, DAKO A0063). Detection was achieved with appropriate Alexa fluorescent secondaries for 3 hours at room temperature (diluted 1:5000 in PBST, Invitrogen).
Fluorescence in situ hybridization of human post mortem tissue
Immunofluorescent double labelling for S100β and Fluorescent In Situ Hybridization (FISH) for C3 on 10 μm thick frozen sections of human tissue fixed with 4% PFA and cryopreserved in 30% sucrose (see tissue sample details in Supplemental Data Tables 4, 6, 7). To generate the C3 antisense RNA probe C3 was synthesized from the pCMV SPORT6 C3 plasmid (Open Biosystems reference MHS6278-202800305), digested with SalI and RNA was transcribed from the T7 promoter. Dioxigenin labeling was carried out using an RNA labeling kit (Roche) before performing alkaline hydrolysis at 60°C for 16 min. A sense probe was also generated from the same plasmid but in this case digestion was carried out with Xhol and RNA transcribed form the SP6 promoter. For ISH tissue sections were incubated with RNA probes overnight at 64 °C, and then detected with anti-Digoxigenin antibodies (Roche). Staining was amplified using a TSA staining Kit (Perkin Elmer). Immunostaining for S100β (1:1000 DAKO Z0311) was subsequently performed as described above for IHC with GFAP and C3.
Synapse formation assay
We purified retinal ganglion cells from postnatal day 5 rats by sequential immunopanning to greater than 99% purity and cultured them in serum-free medium as previously described41. Control and A1 reactive astrocytes were plated on inserts and co-cultured with RGCs for 5–10 days. For quantification of structural synapses, RGCs were fixed and stained with antibodies against the presynaptic marker Bassoon and postsynaptic marker Homer. Synapse number and size were quantified by a custom-written MATLAB program14.
Survival/cell toxicity assay
Control or A1 reactive astrocytes (see above) were grown for 7 d in serum-free media supplemented with 5 ng/ml HBEGF18. Cells were then treated with Il-1α, TNFα, and C1q or an equivalent volume of 1× dPBS and cells left for an additional 24 h. At this time, conditioned media was collected with cOmplete™, Mini, EDTA-free protease inhibitor cocktail (Sigma/Roche, 04693159001) and concentrated at 30kDa with Amicon Ultra-15 Centrifugal Filter Units (Millipore, UFC903024) until approximately 30–50× concentrated. A Bradford assay was performed to determine total protein concentration, and 1–50 μg/ml total protein was added to purified cell cultures of neurons, oligodendrocytes, OPCs, endothelial cells, astrocytes, pericytes or microglia (plated at 1,000 cells/well in poly-d-lysine-coated (PDL) 96-well plates, grown for 5 days in serum-free base media) and viability assed using the LIVE/DEAD® Kits for mammalian cells (Thermo Fisher Scientific, L3224). Additional experiments were done on RGCs and oligodendrocytes using heat inactivated A1 ACM (20-minute treatment at 60 °C) or protease treatment of A1 ACM (0.01 U/ml plasmin from human plasma, Sigma – P1867), 2 h at room temperature. Protease treatment was halted with phenylmethylsulfonyl fluoride (Sigma, 78830) and aprotinin (Sigma, A4529) – final concentrations: 2 mM and 0.55 TIU/ml, respectively. Equivalent amounts of astrocyte base media proteins (BSA, transferrin, HBEGF etc.) were added back to protease-treated A1 ACM before treating cells). Viability was again assessed at 24 h as before. At least 6 independent experiments were conducted for each condition. For each experiment, 4 non-overlapping 20× fields per well were quantified in six wells.
Motor neuron subtype toxicity assays
Motor neurons were purified using immunopanning (192 hybridoma clone)35, plated at 1,000 cells/well in poly-d-lysine-coated (PDL) 96-well plates and grown for 5 days in serum-free base media. At this time cells were treated with A1 ACM (50 μg/ml total protein) and cells left until maximum death was seen (approximately 72–120 h), as determined by LIVE/DEAD® Kit for mammalian cells (Thermo Fisher Scientific, L3224). Total RNA from remaining (resistant) cells was extracted using the RNeasy Plus kit (Qiagen) and cDNA synthesis performed using the SuperScript® VILO cDNA Synthesis Kit (Invitrogen, Grand Island, NY, USA) according to supplier protocols, and RT-PCR for motor neuron subtype specific transcripts completed: all motor neurons, Ngfr (FWD – CTGCTGCTGATTCTAGGGATGT, REV – ATCTGCACACTGCATCGTCT), FoxP1 (FWD – CAACGTGCCCATTTCTTCAGC, REV – AGATTCAAGAATGGCCTGCCT); pre-ganglionic motor neurons, Ne2f2 (FWD – AAGCACTACGGCCAGTTCAC, REV – CCTCTGTACAGCTTCCCGTC); alpha motor neurons, Rbfox (FWD – CTTGTCCGTTTGCTTCCAGG, REV – GGAAGGTTTCACATGGTTCCG); gamma motor neurons, Wnt7a (FWD – CGGACGCCATCATCGTCATA, REV – CTCCCGACTCCCCACTTTGA), Esrrg (FWD – TTGAACCCGAGACTCTCCCA, REV – GCAGAGAAGCCTTTCCGACT).
Bacteria cultures and killing assays
Bacterial strains include Salmonella typhimurium (SL1344), Burkholderia thailandensis (E264), and Shigella flexneri (M90T). S. typhimurium was grown in LB broth (BD Biosciences, San Jose, CA). B. thailandensis and S. flexneri were grown in tryptic soy broth (TSB; BD Biosciences). All strains were grown in 2 mL broth overnight from a frozen stock with aeration at 37°C. Bacteria were subcultured 1:1000 into broth (S. typhimurim and S. flexneri into Mgm-MES media42 and B. thailandensis into TSB) and 50% supernatant from control astrocytes or A1 (bad) astrocytes at serial dilutions from 0–100 μg/mL. At 16 hours of growth the OD600 was recorded.
Differentiation of hES cells to dopaminergic neurons
H1 human embryonic stem cells (hES, Wi Cell, Madison, WI) were cultured using standard protocols on inactivated mouse embryonic fibroblasts. Differentiation of hES cells to dopamine neurons was done as described previously43. Human ES cells were cultured on matrigel (Corning, CB-40234)-coated plates at a density of 40,000 cells/cm2 in SRM media containing growth factor and small molecule including FGF8a (100ng/ml, R&D Systems, 423-F8-025/CF), SHH C25II (100ng/ml, R&D Systems, 464-SH-025/CF), LDN193189 (100nM, Stemgent Inc., 04-0074-02), SB431542 (10μM, Stemgent Inc., 04-0010), CHIR99021 (3μM, Stemgent Inc., 04-0004-02) and Purmorphine (2μM, Stemgent Inc., 04-0009) for first five days. For the next six days’ cells were maintained in neurobasal medium containing B27 minus vitamin A (Life Technologies, 12587-010), N2 supplement (Life Technologies, 17502048) along with LDN193189 and CHIR99021. In the final stage cultures were lifted and replated at a density of 400,000/cm2 on polyornithine- and laminin-coated plate in a neurobasal media containing B27 minus Vitamin A, BDNF (20ng/ml, R&D Systems, 248-BD-025/CF), GDNF (20ng/ml, R&D Systems, 212-GD-010/CF), TGFβ (1ng/ml, R&D Systems, 243-B3-002/CF) ascorbic acid (0.2mM, Sigma, A4034), cAMP (0.5mM, Sigma D0627) and DAPT (10μM, Stemgent, 04-0041) till maturation. Once mature (approximately 60 days) toxicity assays with A1 ACM were performed as outlined above.
TUNEL staining of apoptotic cells in mouse hippocampus
Neuronal cell death was detected in vivo in wildtype and single knock-out animals (Il1α−/−, TNFα−/−, or C1q−/−) using TUNEL staining of 12 μm 4% paraformaldehyde fixed frozen sections of hippocampus using the in situ cell death detection kit, TMR red (Roche, 12156792910) using supplier protocol.
Depletion of microglia using Pexidartinib (PLX-3397)
Pexidartinib (PLX-3397, SelleckChem, S7818), a CSF1R inhibitor, was administered ad libitum to P21 wildtype C57Bl/6 mice at 290 mg/kg in AIN-76A Rodent Diet (Research Diets Inc., D10001) for 7 days to eliminate microglia44. At this stage flow cytometry showed around 95% decrease in microglia cell number (Extended Data Fig. 1). These microglia-depleted animals were used for optic nerve crush (see below) and neuroinflammatory investigation (with i.p. injection of 5 mg/kg LPS).
Flow cytometry analysis of Csf1r−/− and PLX-3397-treated animals
Both Csf1r−/− and PLX-3397 treated animals (and appropriate controls: Csf1r+/+, control chow-treated animals) received an i.p. injection of LPS (5 mg/kg). Twenty-four hours after LPS injection, animals were killed and brains prepared for downstream processing (see below).
For P28 PLX-3397-treated animals, brain cell dissociation and staining were performed as described previously15 with minor changes, specifically the addition of cold PBS intravascular perfusion, dissection of cortex rather than whole brain, and the use of a different fluorophore panel. Briefly, cortices from PLX-3397 and control treatments were dissected from anesthetized, cold PBS-perfused mice at P28. Cortices were homogenized in ice cold HBSS supplemented with 15mM HEPES and 0.5% glucose by 5 gentle strokes in a 7 mL glass dounce homogenizer. Dissociated cell suspensions were run through MACS myelin depletion columns, stained with a dead cell marker (LIVE/DEAD, Life Technologies, L23101), and then immunostained using antibodies specific to TMEM119 (custom antibody15, secondary Ab Biolegend 406410), CD45 (eBioscience 25-0451-82), and CD11b (Biolegend 101228). Samples were analyzed on an LSR II (Becton Dickinson), and data processed using Flowjo software (Treestar). Data was collected on an instrument in the Stanford Shared FACS Facility obtained using NIH S10 Shared instrument Grant (S10RR027431-01). Debris, doublets, and dead cells were excluded using fsc/ssc, fsc-h/fsc-w, and green florescence gates, respectively.
For P8 Csf1r−/− animals, brains were processed identically except that the myelin depletion step was removed and cells were passed through fine nylon mesh to filter debris (Tetko HC3-20).
Retro-orbital nerve crushes
Postnatal day 14 Sprague Dawley rats or P21-28 mice were anaesthetized with 2.5% inhaled isoflurane in 2.0 L O2/min. Without incision to the orbital rim, the supero-external orbital contents were blunt-dissected, the superior and lateral rectis muscles teased apart, and the left optic nerve exposed. The nerve was crushed for 3–5 seconds at approximately 2 mm distal to the lamina cribrosa. After surgery, the eye fundi were checked to ensure retinal blood flow was intact. Some rats also received a 2 μl intravitreal injection of neutralizing antibodies to Il-1α (150 μg/μl, abcam, ab9614), TNFα (150 μg/μl, Cell Signaling Technology, #7321), and C1q (Quidel, A301), rabbit IgG control (150 μg/μl, abcam, ab27472), or PBS at day 0 (the time of optic nerve crush, for 7 and 14 day experiments) or day 7 (for some 14 day experiments). Retinas were collected for qPCR analysis and immunofluorescent analysis at 7 and 14 days.
Synaptosome/myelin purification and in vitro engulfment assay
Synaptosomes45 and crude CNS myelin46 were purified as described previously, and conjugated with pHrodo™ Red, succinimidyl ester (Thermo Fisher Scientific, P36600) in 0.1 M sodium carbonate (pH 9.0) at room temperature with gentle agitation. After two-hour incubation, unbounded pHrodo was washed-out by multiple rounds of centrifugation and pHrodo-conjugated synaptosomes/myelin were re-suspended with isotonic buffer containing 5% DMSO for subsequent freezing. Purified control and A1 reactive astrocytes from P6 rat pups (see above) were incubated with 5 μl pHrodo-conjugated synaptosomes for 24 h, or 800 μg/ml media pHrodo-conjugated myelin debris and imaged at 1 h intervals. Live astrocytes were imaged with epifluorescence time lapse microscope (IncuCyte Zoom ® System) to reveal engulfed pHrodo-conjugated particles. For image processing analysis, we took 9 images/well using 20× objective lens from random areas of the 24 well plates and calculated the phagocytic index (PI) by measuring the area of engulfed synaptosomes/myelin (fluorescent signal) normalized to the area of astrocytes, using ImageJ. Relative engulfment ability was calculated by normalizing the PI of control (non-reactive) astrocytes by that of A1 reactive astrocytes3.
In vivo synapse engulfment assay
Tg(Aldh1l1-EGFP)OFC789Gsat/Mmucd transgenic mice were used to visualize astrocytes in all in vivo engulfment assays. Pups were anaesthetized with isoflurane and 5 mg/kg LPS was injected i.p. at postnatal day 3. Twenty hours later 1 μl of cholera toxin-β subunit (CTB) conjugated with Alexa594 (Invitrogen, 1 mg/ml in normal saline) was injected into the contralateral eye. After 24 h mice were sacrificed and half had the dorsal LGN dissected out for microfluidic qPCR analysis, while the remainder were perfused with PBS followed by 4% paraformaldehyde at 70% cardiac output and brains were dissected, post-fixed overnight for 4 °C and transferred to 15% and 30% sucrose for 24 h each at 4 °C. Brains were sectioned at 50 μm and floating coronal sections containing dLGN were mounted on slide glasses and used for analysis of the dLGN. For each dLGN, two fields (the tip and medial portions of dLGN that contain both contra- and ipsilateral projections) were imaged using Zeiss LSM510 inverted confocal microscopy to obtain 50–70 consecutive optical sections with 0.3 μm interval thickness. ImageJ was used to remove outliers (radius 2.0 pixels and threshold 20) from all channels and subtract background from CTB images (rolling bar radius 50 pixels). An image-processing algorithm (MATLAB, Mathworks) was used to localize CTB-labelled RGC projections engulfed by astrocytes by subtracting CTB-labelled projections outside of the Aldh1l1-eGFP positive cells. The phagocytic index was calculated by measuring the total volume of engulfed CTB-labelled RGC projections normalized to the total volume of astrocytes in a given z-stack. Relative engulfment ability was calculated by normalizing the phagocytic index of experimental groups to control group3.
Electrophysiology
Whole-cell patch-clamp recordings from cultured RGC neurons were performed at room temperature in an isotonic saline solution (in mM: NaCl 125, NaHCO3 25, KCl 2.5, NaH2PO4 1.25, glucose 25, MgCl2 1, CaCl2 2). Patch electrodes with resistances of 2.5–3.5 MΩ were pulled from thick-walled borosilicate glass capillaries and were filled with an internal solution containing (in mM) potassium gluconate 130, NaCl 4, EGTA 5, CaCl2 0.5, 10 HEPES, MgATP 4, Na2GTP 0.5 (pH 7.2 with KOH). Miniature excitatory postsynaptic currents (mEPSCs) were recorded in TTX (1 μM, Alomone) from a holding potential of -70 mV. Series resistance was monitored throughout the recording and was <20 MΩ. Data were sampled at 50 kHz and filtered at 1 kHz using pClamp 9.2, and offline analysis of mEPSCs was performed using Clampfit 10.3 (Molecular Devices).
Proliferation, differentiation and motility assays
Cultures of oligodendrocyte precursor cells (OPCs) were prepared by immunopanning and grown as outlined in Methods. To measure proliferation, OPCs were grown for 24 hours in OPC proliferation media47 and then changed into OPC media containing 10μM EdU (ThermoFisher, C10339) and varying concentrations of A1 or resting ACM (0–50 μg/ml total protein). After 5 days, the cells were fixed, permeabilized, and stained for EdU and DNA (Hoechst 33342) according to the protocol for the Click-It® Edu Imaging Kit. To measure differentiations of OPCs into mature OLs, 1ug/ml A1 ACM was added to OPC cultures and they were imaged at 24 h intervals with phase time lapse microscope (IncuCyte Zoom ® System). Images were analyzed and number of primary processes extending from the cell soma were counted. A cell was considered an OPC with 0–2 processes, a differentiating OL with 4–5 processes, and a mature OL with 5+ primary processes. Before differentiation into mature OLs, OPC migration was measured using the Template Matching and Slice Alignment and MTrackJ plugins for ImageJ. Astrocyte motility was measured using the same ImageJ plugin, with cells grown at a density of 5000 cells/cm2 in HBEGF-containing astrocyte growth media.
Statistical analysis and power calculations
All statistical analyses were done using GraphPad Prism 7.00 software. Most data were analyzed by one-way ANOVA followed by Dunnett’s multiple post-hoc test for comparing more than three samples, and two-sample unpaired t-test for comparing two samples with 95% confidence. Two-sample Kolmogorov–Smirnov test with 95% confidence was used for electrophysiology experiments in Fig. 2g. Power calculations were performed using G*Power Software V 3.1.9.248. Group sizes were used to provide at least 80% calculable power with the following parameters: probability of Type I error (0.05), conservative effect size (0.25). Four to eight treatment groups with multiple measurements were obtained per replicate.
Extended Data
EXTENDED DATA FIGURE 1. Csf1r−/− mice lack microglia and have no compensatory increase in brain myeloid cell populations after LPS or vehicle control injections.
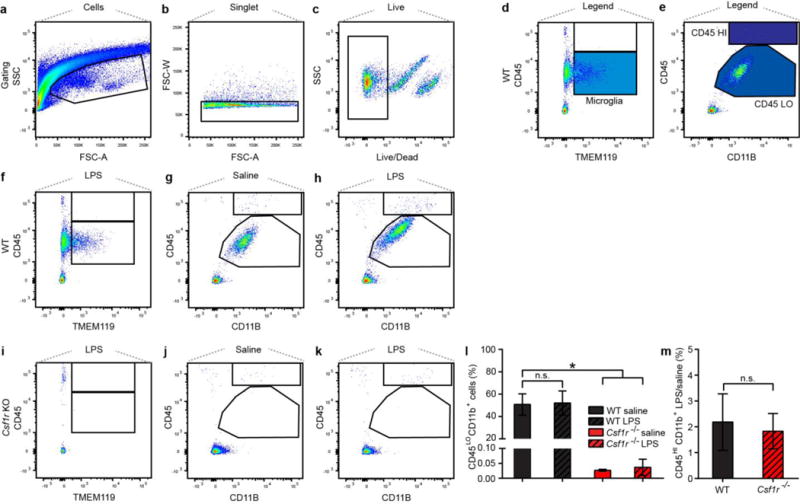
a–c, gating strategy (live, single cells) for subsequent analysis of surface protein immunostainng. d,e, gating strategy for TMEM119+ (microglia) and CD45L°CD11b+ cells used for further analysis. f–h, representative plots showing abundant macrophage populations in P8 WT mice: CD45L° TMEM119+/TMEM119-, and CD45HI brain macrophages (f), CD11B+/CD45L° and CD11B+/CD45HI cells after saline (g) and LPS (h) injection. i, representative plots showing near-complete absence of brain macrophages in Csf1r−/− mice: CD45L° TMEM119-/TMEM119-, and CD45HI brain macrophages (i), CD11B+/CD45L° and CD11B+/CD45HI cells after saline (j) and LPS (k) injection. l, relative abundance of CD11B+/CD45L° macrophages after LPS or control injection in WT compared to Csf1r−/− mice, expressed as percent of total gated events shown in a. m, relative abundance of CD11B+/CD45HI cells after LPS treatment, normalized to saline control injection in WT and Csf1r−/− animals. N = 3 individual animals per treatment condition and genotype, error bars expressed as s.e.m. * p < 0.05, one-way ANOVA (l); p = 0.77, Student’s T-test (m), compared to age-matched wild type control.
EXTENDED DATA FIGURE 2. Pexinartinib (PLX-3397)- treated adult mice have dramatic reduction in number of microglia and no increase in myeloid cell infiltration after LPS compared to vehicle control treatment.
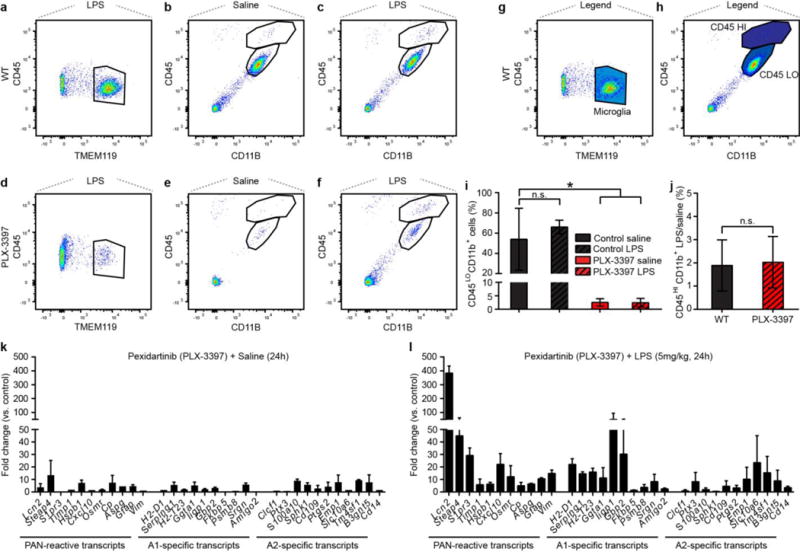
a–c, representative plots showing abundant macrophage populations in P28 WT control mice: TMEM119+ microglia (a), CD11B+/CD45L° and CD11B+/CD45HI cells after saline (b) and LPS (right plot) injection. d–f, representative plots showing large reduction in macrophage populations after PLX-3397 treatment: TMEM119- microglia (d), CD11B+/CD45L° and CD11B+/CD45HI cells after saline (e) and LPS (f) injection. g,h, gating strategy for TMEM119+ (microglia) and CD45L°CD11b+ cells used for analysis. i, relative abundance of CD11B+/CD45L° macrophages in WT compared to PLX-3397 mice, expressed as percent of total gated events. j, relative abundance of CD11B+/CD45HI cells after LPS treatment, normalized to saline control injection in WT and PLX-3397 treated animals. k, l, Fold change data from microfluidic qPCR analysis of WT and PLX-3397-treated mouse immunopanned astrocytes collected 24 hours following i.p. injection with saline or lipopolysaccharide (LPS, 5mg/kg). N = 3–6 individual animals per treatment condition and genotype, error bars expressed as SEM. * p < 0.05, one-way ANOVA (i); p = 0.90, Student’s T-test (j), compared to age-matched wild type control.
EXTENDED DATA FIGURE 3. Screen for A1 reactive mediators.
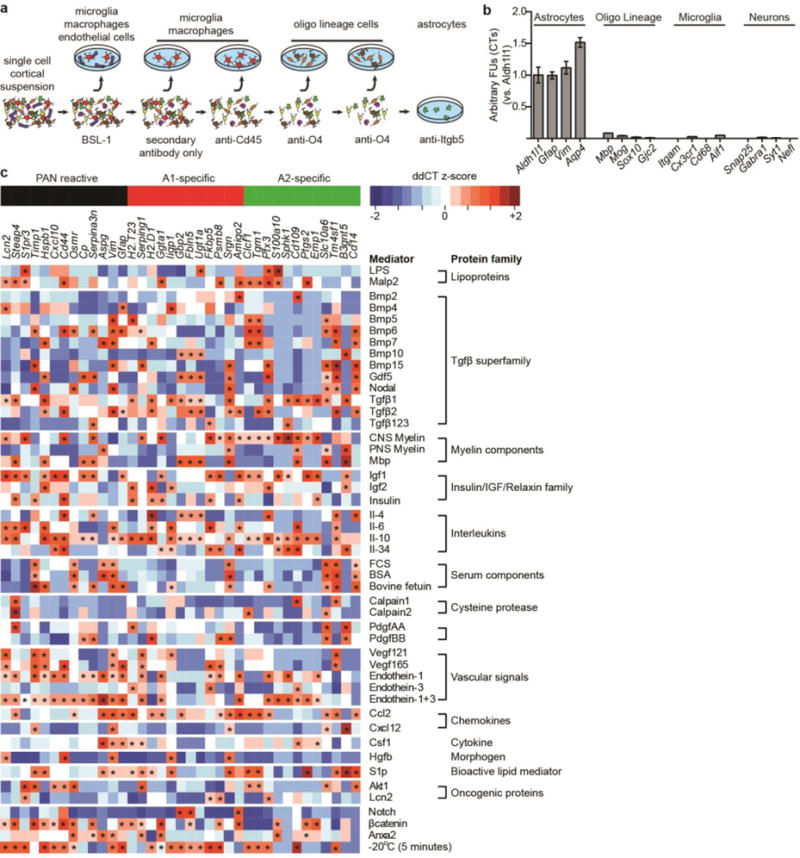
a, Immunopanning schema for purification of astrocytes. These astrocytes retain their non-activated in vivo gene profiles. b, Purified cells were 99+% pure with very little contamination from other central nervous system cells, as measured by qPCR for cell-type specific transcripts. c, Heat map of PAN reactive and A1- and A2-specific reactive transcript induction following treatment with a wide range of possible reactivity inducers. N = 8 per experiment. * p < 0.05, one-way ANOVA (increase compared to non-reactive astrocytes).
EXTENDED DATA FIGURE 4. Screen for A1 reactive mediators.
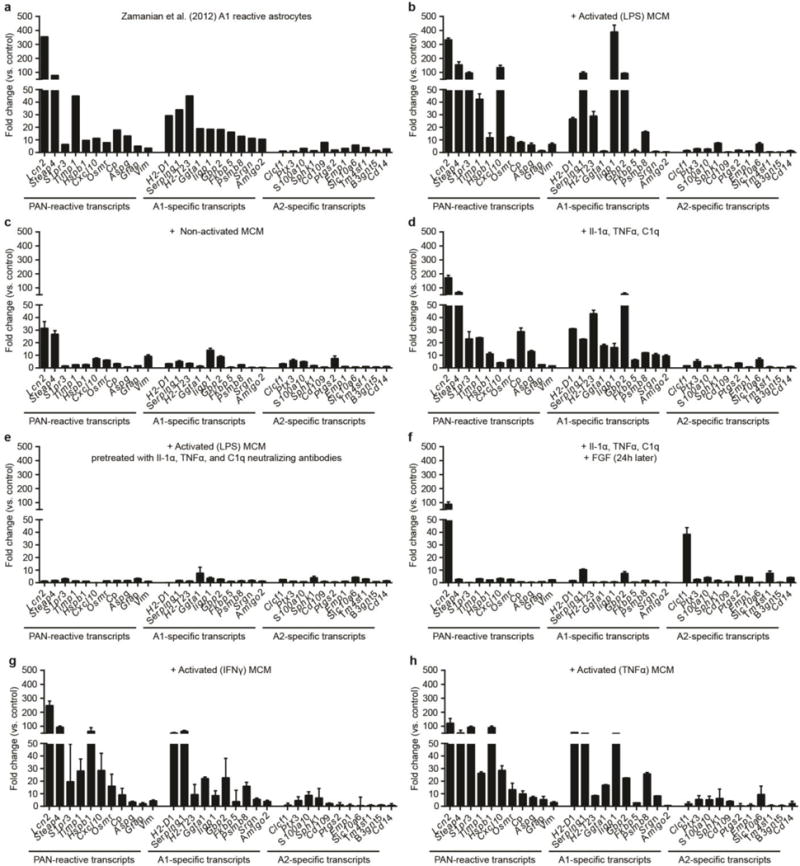
Fold change data from published microarray datasets of A1 (neuroinflammatory) reactive astrocytes (panel a), and microfluidic qPCR analysis of purified astrocytes treated with lipopolysaccharide (LPS)-activated microglia conditioned media (panel b), non-activated microglia conditioned media (panel c), Il-1α, TNFα and C1q (panel d), LPS-activated microglia conditioned media pre-treated with neutralizing antibodies to Il-1α, TNFα and C1q (panel e), astrocytes treated with Il-1α, TNFα and C1q and post-treated with FGF (panel f), microglia conditioned media activated with interferon gamma (IFNγ, panel g), and with TNFα (panel h). N = 6 per experiment. Error bars indicate s.e.m.
EXTENDED DATA FIGURE 5. A1 astrocytes are morphologically simple.
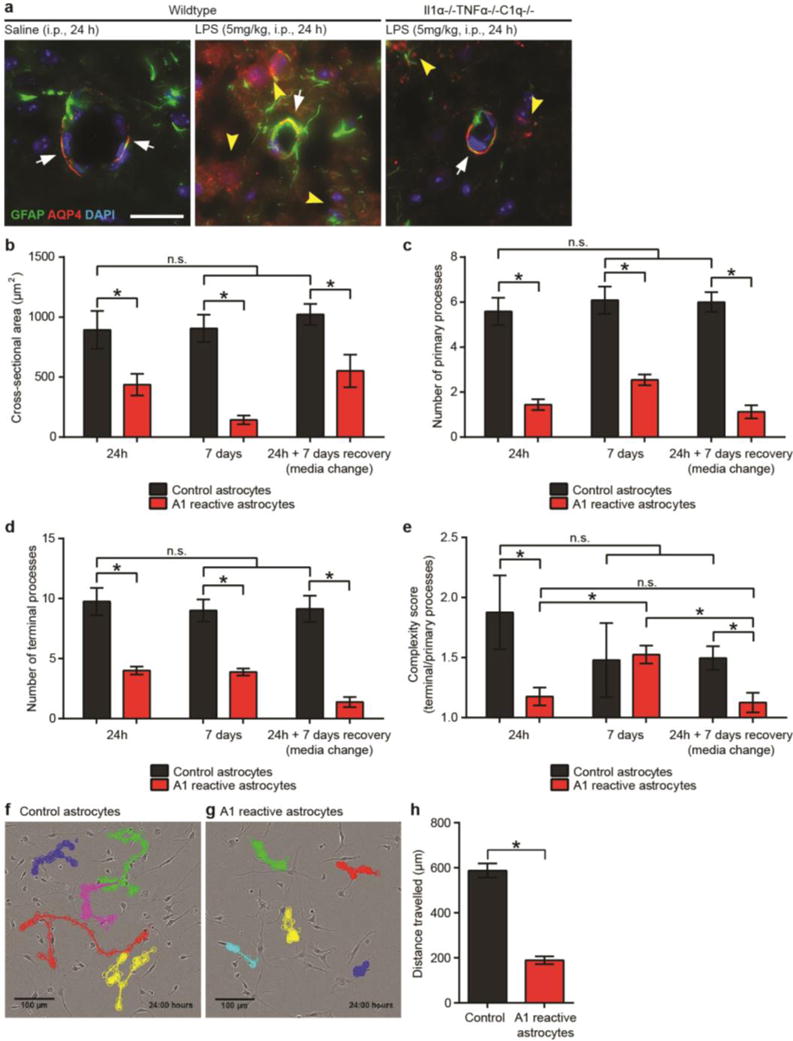
a, in vivo immunoflourescent staining for the water channel AQP4 and GFAP. Saline injected (control) mice had robust AQP4 protein localization to astrocytic endfeet on blood vessels (red stain, white arrows), while LPS injected mice had loss of polarization of AQP4 immunoreactivity, with bleeding of immunoreactivity away from endfeet (white arrows) and increased staining in other regions of the astrocyte (yellow arrowheads). Triple knock-out mice (Il1α−/−TNFα−/−C1q−/−) did retained AQP4 immunoreactivity in endfeet following LPS-induced neuroinflammation (white arrows), though some low-level ectopic immunoreactivty was still seen (yellow arrowheads). b–e, Quantification of cell morphology of GFAP-stained cultured astrocytes in resting or A1 reactive state: cross-sectional area (b), number of primary processes extending from cell soma (c), number of terminal branchlets (d), ratio of terminal to primary processes (complexity score, e). f, g, time-lapse tracing of control (f) and A1 reactive (g) astrocytes. Quantification shown in panel (h). A1 reactive astrocytes migrated approximately 75% less than control astrocytes over a 24 h period. * p < 0.05, one-way ANOVA. Error bars indicate s.e.m.
EXTENDED DATA FIGURE 6. A1 reactive astrocytes do not promote synapse formation or neurite outgrowth.
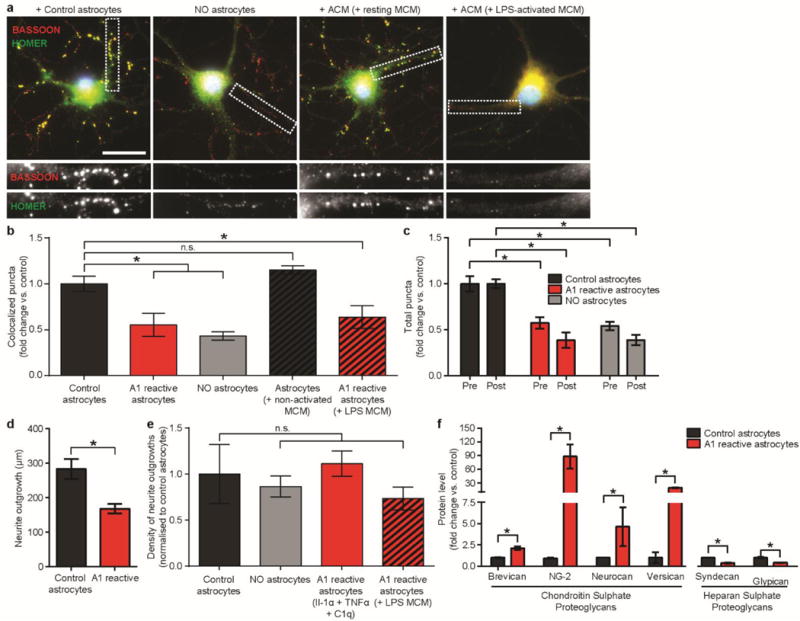
a, Representative images of retinal ganglion cells (RGCs) grown without astrocytes, or with control or A1 reactive astrocytes, stained with pre- and post-synaptic markers HOMER (green) and BASSOON (yellow). Colocalization of these markers (yellow puncta) was counted as a structural synapse. b, Total number of synapses normalized per each individual RGC. The number of synapses decreased after growth of RGCs with LPS-activated microglial conditioned media (MCM)-activated A1 reactive astrocyte conditioned media (ACM), or Il-1α, TNFα, C1q-activated A1 reactive astrocytes was not different. N = 50 neurons in each treatment. c, Quantification of individual pre- and post-synaptic puncta. d, Total length of neurite growth from RGCs. e, Density of RGC processes in cultures used in measurement of synapse number. There was no difference in neurite density close to RGC cell bodies (where synapse number measurements were made). f, Western blot analysis of proteoglycans secreted by control and A1 reactive astrocytes. Conditioned media from control astrocytes contained less chondroitin sulphate proteoglycans Brevican, Ng2, Neurocan and Versican, while simultaneously having higher levels of heparan sulphate proteoglycans Syndecan and Glypican. * p < 0.05, one-way ANOVA, except d (Student’s t-test). Scale bar: 10 μm. Error bars indicate s.e.m.
EXTENDED DATA FIGURE 7. P4 lateral geniculate nucleus astrocytes become A1 reactive following systemic LPS injection.
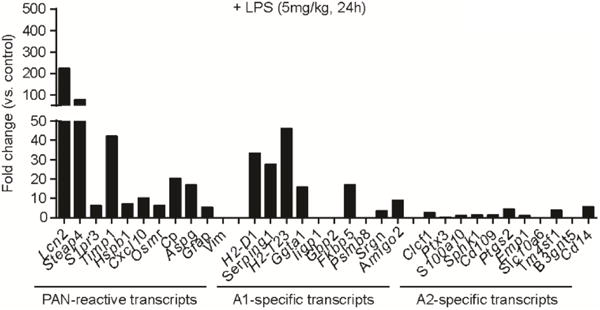
Fold change data from microfluidic qPCR analysis of astrocytes purified from dorsal lateral geniculate nucleus, 24 h after systemic injection with lipopolysaccharide (5mg/kg). N = 2.
EXTENDED DATA FIGURE 8. Astrocyte-derived toxic factor promoting cell death.
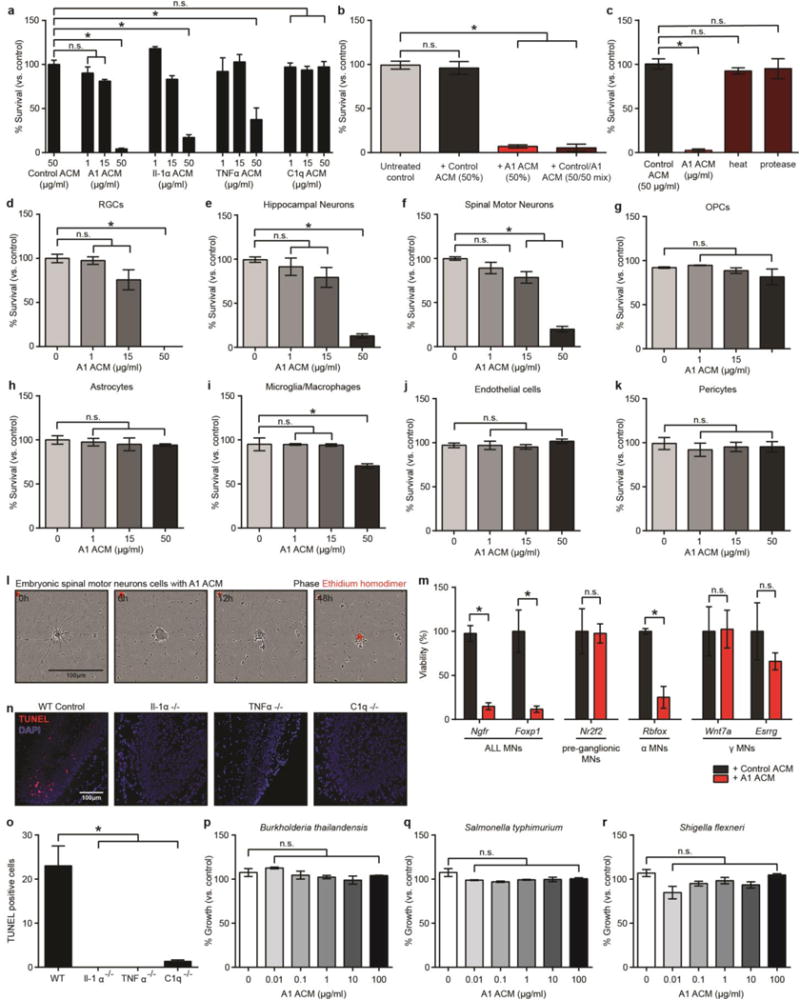
a, Quantification of dose-responsive cell death in retinal ganglion cells (RGCs) treated with astrocyte conditioned media from cells treated with Il-1α, TNFα, or C1q alone, or combination of all three (A1 astrocyte conditioned media, ACM) for 24 h. b, Death of RGCs was not due to a loss of trophic support, as treatment with 50% Control ACM did not decrease viability. Similarly, treatment with a 50/50 mix of Control and A1 ACM did not increase viability compared to A1 ACM only treated cells. c, A1-ACM-induced RGC toxicity could be removed by heat inactivation, or protease treatment. d–k, Cell viability of purified central nervous system cells treated with A1 ACM for 24 h: RGCs (d), hippocampal neurons (e), embryonic spinal motor neurons (f), oligodendrocyte precursor cells (OPCs, g), astrocytes (h), microglia/macrophages (i), endothelial cells (j), and pericytes (k). N = 4 for each experiment. l, Representative phase image showing death of purified embryonic spinal motor neurons in culture over 18 h (ethidium homodimer stain in red shows DNA in dead cells). m, qPCR for motor neuronal subtype-specific transcripts after 120h treatment with A1 ACM (50μg/ml). There was no decrease in levels of transcript for Nr2f2 (pre-ganglionic specific) and Wnt7a and Esrrg (γ specific), suggesting these motor neuron subtypes are immune to A1-induced toxicity. n, representative images with terminal deoxynucleotidyl transferase (TdT) dUTP nick-end labeling (TUNEL) staining in the dentate gyrus for wild type and Il1α−/−, TNFα−/−, or C1q−/− individual knockout animals following systemic LPS injection. Individual knock-out animals had far less TUNEL+ cells in the dentate gyrus (no cells in Il1α−/− or TNFα−/− animals) than wild type animals, suggesting A1-induced toxicity may be apoptosis. p–r, Percentage growth rate of gram negative bacterial cultures treated with A1 ACM for 16 h: B. thaliandensis (p), S. typhimurium (q), S. flexneri (r). N = 3. * p < 0.05, one-way ANOVA. Error bars indicate s.e.m.
EXTENDED DATA FIGURE 9. Pharmacological blockade of astrocyte-derived toxic factor promoting cell death.
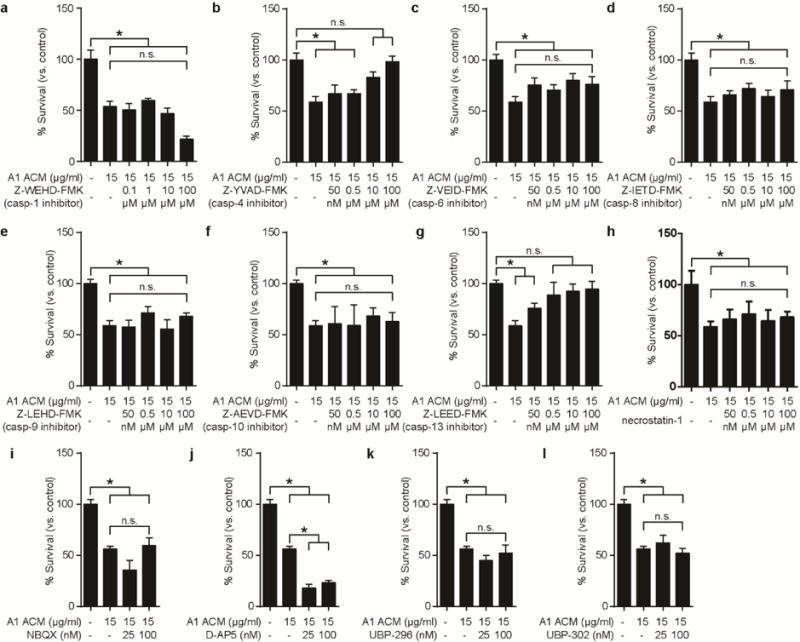
Specific caspase inhibitory agents tested to block retinal ganglion cell (RGC) cell death: a, caspase-1. b, caspase-4. c, caspase-6. d, caspase-8. e, caspase-9. f, caspase-10. g, caspase-13. Only caspase-4 and caspase-13 inhibition was able to minimize RGC toxicity to A1 ACM (in addition to caspase-2 and -3, see Fig. 4 in main text). There was no cleaved caspase-4 or -13 detected in these cells. h, Necrostatin did not preserve RGC viability when cells were treated with A1 astrocyte conditioned media (ACM). i, j, k, l, glutamate excitotoxicity was checked by blocking AMPA receptors with antagonist NBQX (h), or NMDA antagonist D-AP5 (i), or kainite receptors with antagonist UBP-296 (GluR5 selective, j) and UBP-302 (k) – all of which were ineffective. * p < 0.05, one-way ANOVA. N = 4 in each. Error bars indicate s.e.m.
EXTENDED DATA FIGURE 10. A1 reactive astrocytes inhibit oligodendrocyte precursor cell proliferation, differentiation and migration.
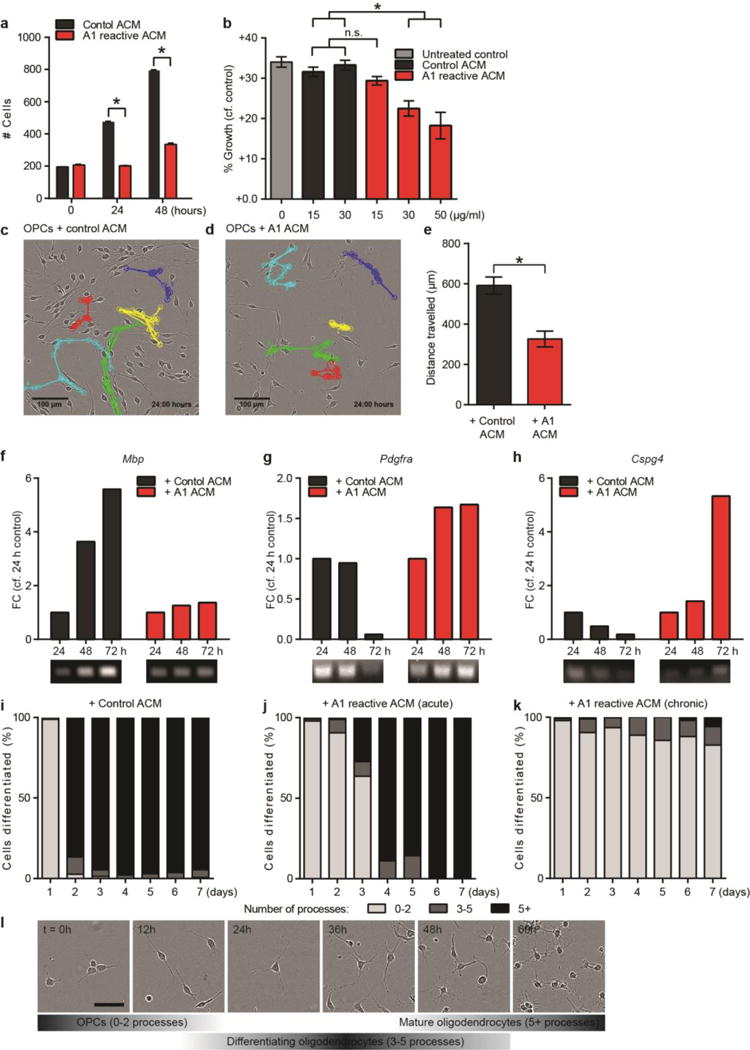
a, Number of cells counted from phase-contrasted images of oligodendrocyte precursor cells (OPCs) treated with control and A1 reactive conditioned media (ACM). b, EdU ClickIt® assay determined growth of OPCs treated with increasing concentration of control and A1 ACM for 7 days. Both a and b show A1 ACM decreases OPC proliferation compared to control. c, d, Representative images of tracked OPC migration following treatment with control (c) and A1 (d) ACM, quantified in e. N = 100 cells from 10 separate experiments. f–h, Representative RT-PCR ethidium bromide gel showing no increase in mature OL marker Mbp transcript in OPCs treated with A1 ACM, with no change in OPC marker Pdgfra and Cspg4 expression – evidence of a lack of differentiation into mature oligodendrocytes. Treatment of OPCs with control ACM did not delay their differentiation into mature oligodendrocytes. N = 2. i–k, Total number of terminal process of oligodendrocyte lineage cells were counted as a measure of differentiation. Over 90% of cells differentiated by 24 h after removal of PDGFα when treated with control ACM (i). In contrast, treatment with a single dose (j) or daily doses (k) of A1 ACM delayed this level of differentiation by 72 h following a single dose, or indefinitely with chronic treatment. N = 6 separate experiments. l, representative phase images and time scale for oligodendrocyte differentiation assay (treated with control ACM). Scale bar: 100 μm (c,d), 25 μm (l). * p < 0.05, one-way ANOVA, except panel e (Student’s t-test). Error bars indicate s.e.m.
EXTENDED DATA FIGURE 11. Activation of microglia following lipopolysaccharide injection in knockout mice.
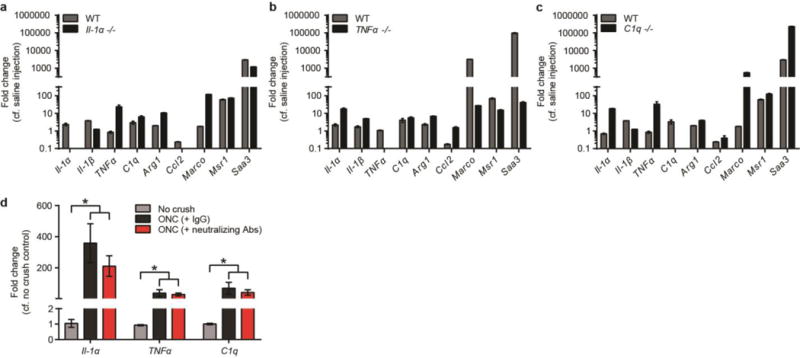
Mice from single global knock-outs of Il-1α (a), TNFα (b), and C1q (c) were treated with lipopolysaccharide (5 mg/kg, i.p.) and microglia collected 24 h later. Single knock-out animals still showed upregulation of many markers of microglial activation, as determined by qPCR. N = 3 for Il-1α and C1q, N = 5 for TNFα. d, quantitative PCR for microglia-derived A1-inducing molecules in the optic nerve of mice that received an optic nerve crush. Following crush, optic nerve contained neuroinflammatory microglia, while injection of A1 astrocyte-neutralizing antibodies into the vitreous of the eye did not decrease microglial activation (however it did halt A1 astrocyte activation in the retina – see Fig. 4). Error bars indicate s.e.m. * p < 0.05, one-way ANOVA.
EXTENDED DATA FIG 12. Single cell analysis of C3 expression following neuroinflammatory and ischemic injury.
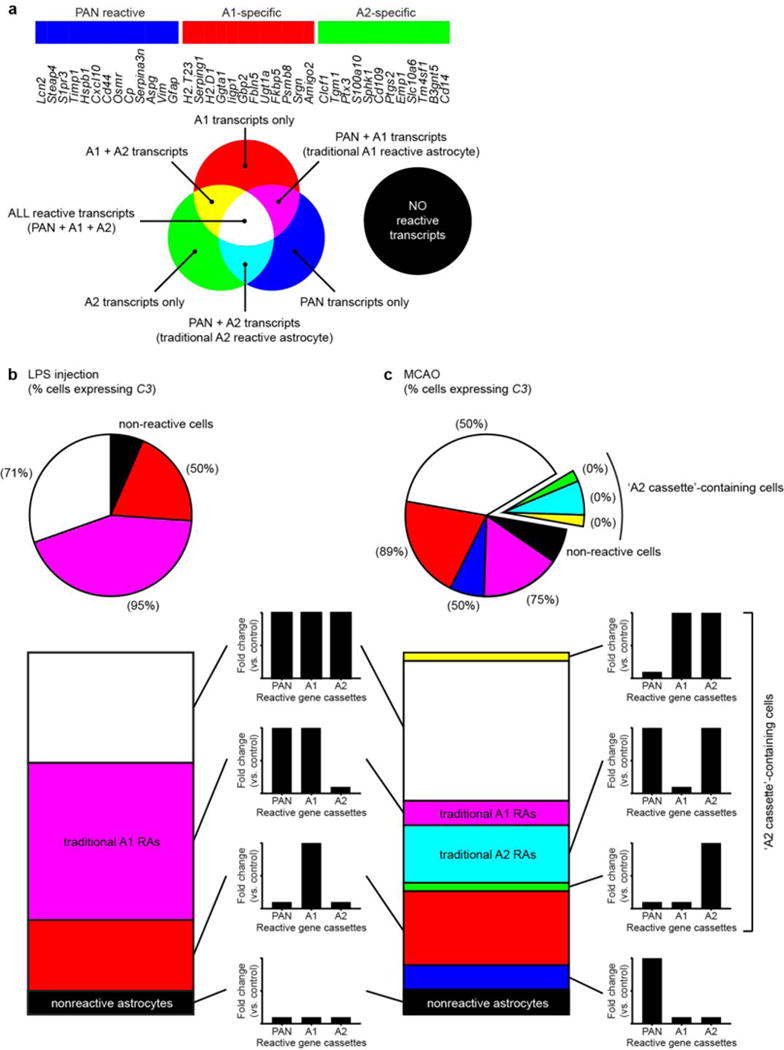
a, cassettes of PAN-, A1-, and A2-specific gene transcripts used to determine polarization state of astrocyte reactivity. Upregulation of combinations of each of these cassettes of genes produces different 8 possible gene profiles for astrocytes following injury. b, 24 hours following LPS-induced systemic neuroinflammation, astrocytes were either non-reactive (no reactive genes upregulated), or fell into three forms of reactivity – all with A1 reactive cassette genes upregulated. Numbers in parenthesis state what percentage of individual cells for each subtype express C3. c, 24 hours following middle cerebral artery occlusion, both neuroinflammatory (A1 and A1-like) and ischemic (A2 and A2-like) reactive cells were detected. No cells expressing A2 cassette transcripts were C3 positive – validating C3 as an appropriate marker for visualizing A1 reactive astrocytes in disease. Segments of piecharts represent relative amounts of each subtype of astrocyte (control or reactive).
EXTENDED DATA FIG 13. Additional markers for reactive astrocytes in human multiple sclerosis post mortem tissue samples.
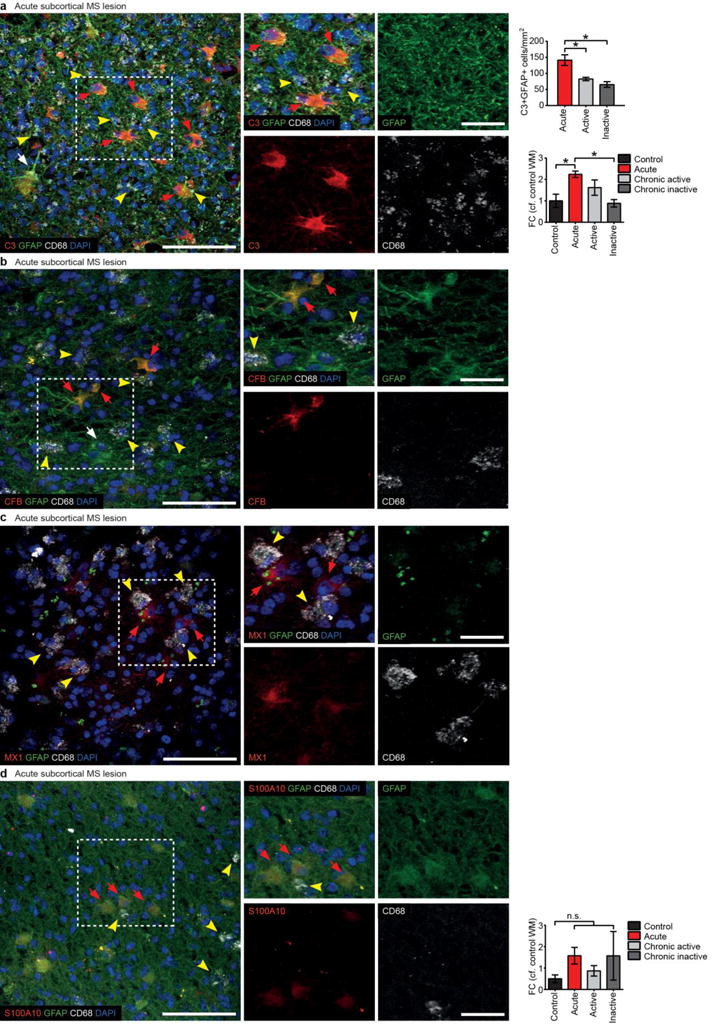
a, (same data as Fig. 5o–v – provided again here for comparison) Immunofluorescent staining showing C3 co-localized with GFAP in cell bodies of reactive astrocytes in acute MS lesions (red arrows). Note presence of A1-specific GFAP+ reactive astrocytes (C3+, CFB+, MX1+; red arrows) in close proximity to CD68+ phagocytes (activated microglia, macrophages; yellow arrowheads); A1-specific astrocytes are predominantly seen in high CD68+ density areas. C3-GFAP+ astrocyte (white arrow). Single channels and higher magnification are of selected area in a. Number of C3+GFAP+ colabelled cells is quantified and was highest in acute active demyelinating lesions, however they were still present in chronic active and inactive lesions. There was also a matching increase in C3 transcript in brains of patients with acute active demyelinating lesions compared to age-matched controls. Additional markers of A1 reactive astrocytes include complement factor B (CFB, b), and myxovirus (influenza virus) resistance gene MX dynamin Like GTPase 1 (MX1, c). Both CFB and MX1 co-localised 100% with C3, and were found in close association with CD68+ reactive microglia (yellow arrowheads). d, a single marker was found for A2 (ischemic) reactive astrocytes – S100 calcium-binding protein A10 (S100A10). S100A10 positive, GFAP colabelled astrocytes (red arrows) were only faintly labelled, and total numbers were very low. Note presence of A2-specific GFAP+ reactive astrocytes (S100A10; red arrows) in low CD68+ density areas (phagocytes; yellow arrowheads). The expression levels of S100a10, determined by qPCR, was not significantly altered at different stages of MS. N=3–8 disease and 5–8 control in each instance. Quantification was carried out on 5 fields of view and approximately 50 cells were surveyed per sample. Scale bar: 100 μm (a, b, c, d), 20 μm (enlarged inserts). Error bars indicate s.e.m. * p < 0.05, one-way ANOVA, compared to age-matched control. Abbreviations: FC, fold change; WM, white matter.
Extended Data Table 1.
Rat primer sequences.
| ID | FWD | REV | PRODUCT SIZE | |||
|---|---|---|---|---|---|---|
| Aif1 | AAGGATTTGCAGGGAGGAAAAGC | CTCCATGTACTTCGTCTTGAAGG | 156 | |||
| Aldh1l1 | AGTGAAGGAGCTGTGTGACG | TCCATCCGTTGGGTTGATGG | 253 | |||
| Amigo2 | GTTCGCCACAACAACATCAC | GTTTCTGCAAGTGGGAGAGC | 211 | |||
| Aqp4 | AACCCCAGAAGACAGCACCT | ACACTTACAGCTGTCCAGGGTTG | 76 | |||
| Aspg | CAGGTGCCCAGGTTCCTATC | GTCCACCTTGGTTGTCCGAT | 152 | |||
| Axl | GACACCCCCGAGGTACTTATG | TGGGGGTTCACTCACTGGG | 177 | |||
| B3gnt5 | TGCTCCTGGATGAAAGGTCC | ACATGCTTGATCCGTGTGGT | 161 | |||
| Cd109 | GTCGCTCACAGGTACCTCAA | CTGTGAAGTTGAGCGTTGGC | 116 | |||
| Cd14 | TCAGAATCTACCGACCATGAAGC | GGACACTTTCCTCGTCCTGG | 119 | |||
| Cd44 | TCAGGATAGCCCCACAACAAC | GACTCCGTACCAGGCATCTTC | 159 | |||
| Cd68 | CGCATCTTGTACCTGACCCA | TTCTGCGCTGAGAATGTCCA | 254 | |||
| Clcf1 | GACTCGTGGGGGATGTTAGC | CCCCAGGTAGTTCAGGTAGGT | 180 | |||
| Cp | GATGTTTCCCCAAACGCCTG | GTAGCTCTGAGACGATGCTTGA | 118 | |||
| Cx3cr1 | TTCCTGCAGAAGTCCCCGT | CCGAACGTGAAGACAAGGGA | 179 | |||
| Cxcl10 | TGCAAGTCTATCCTGTCCGC | ACGGAGCTCTTTTTGACCTTC | 140 | |||
| Emp1 | ACCATTGCCAACGTCTGGAT | TGGAACACGAAGACCACGAG | 188 | |||
| Fbln5 | AGGGGGTTAAGCGAAACCAG | GTGAGTATCCTTTTAATCCTGGCA | 198 | |||
| Fkbp5 | TGCAGTGTCGGCAGTTGTAT | GGGTCGCCCAAGTTAGAACA | 112 | |||
| Gabra1 | TCCATGATGGCTCAAACCGT | TCTTCATCACGGGCTTGTCC | 183 | |||
| Gapdh | GTGCCAGCCTCGTCTCATAG | AGAGAAGGCAGCCCTGGTAA | 91 | |||
| Gas6 | ACCTCGTCCAGAAGATTAAC | TCCGGGTGTAGTTGAGGCTA | 189 | |||
| Gbp2 | TAAAGGTCCGAGGCCCAAAC | AACATATGTGGCTGGGCGAA | 192 | |||
| Gfap | AACCGCATCACCATTCCTGT | TCCTTAATGACCTCGCCATCC | 146 | |||
| Ggta1 | TCTCAGGATCTGGGAGTTGGA | GAGTTCTATGGAGCTCCCGC | 84 | |||
| Gjc2 | GGAAGGGCTCATCAGAAGGT | CCGTTAGCACAATGCGGAAG | 179 | |||
| Gpc4 | TGGACCGACTGGTTACTGATG | CCCTGGTTGGCTAATCCGTT | 190 | |||
| Gpc6 | TTTCGACCCTACAACCCGGA | GTCTGTGACACTGTGCTGCAT | 102 | |||
| H2-D1 | ATGGAACCTTCCAGAAGTGGG | GAAGTAAGTTGGAGTCGGTGGA | 144 | |||
| H2-T23 | ATTGGAGCTGTTGTGAGGAGG | CCACGAGGCAACTGTCTTTTC | 130 | |||
| Hsbp1 | GAGATCACTGGCAAGCACGA | ATTGTGTGACTGCTTTGGGC | 172 | |||
| Iigp1 | ATTTGGCTCGAAGCCTTTGC | ACGGCATTTGCCAGTCCTTA | 169 | |||
| Itgam | GACTCCGCATTTGCCCTACT | TGCCCACAATGAGTGGTACAG | 109 | |||
| Lcn2 | CCGACACTGACTACGACCAG | AATGCATTGGTCGGTGGGAA | 197 | |||
| Mbp | AGGCGTAGAGGAACTATGGGT | TCACCACTGTCCAATCAGGG | 125 | |||
| Megf10 | TACCGCCATGGGGAGAAAAC | TTATCAGCGCAGTGAGGGAC | 98 | |||
| Mertk | CTGCTTCTGCGGGTTTGTTC | GGCTTTGCAAGGTAAGCTCG | 179 | |||
| Mog | AACTCCGTGCAGAAGTCGAG | TCACTCAAAAGGGGTTTCTTAGC | 195 | |||
| Nefl | AAGCACGAAGAGCGAGATGG | ACCTGCGAGCTCTGAGAGTA | 177 | |||
| Osmr | GTCATTCTGGACATGAAGAGGT | AATCACAGCGTTGGGTCTGA | 144 | |||
| Psmb8 | TATCTGCGGAATGGGGAACG | AAAGTCCCGGTCCCTTCTTG | 136 | |||
| Ptgs2 | CTCAGCCATGCAGCAAATCC | GGGTGGGCTTCAGCAGTAAT | 172 | |||
| Ptx3 | CATCCCGTTCAGGCTTTGGA | CACAGGGAAAGAAGCGAGGT | 104 | |||
| Rplp0 | CCCACTGGCTGAAAAGGTCA | TTGGTGTGAGGGGCTTAGTC | 192 | |||
| S100a10 | GAAAGGGAGTTCCCTGGGTT | CCCACTTTTCCATCTCGGCA | 98 | |||
| S1pr3 | CTTGCAGAACGAGAGCCTGT | CCTCAACAGTCCACGAGAGG | 70 | |||
| Serpina3n | GTCTTTCAGGTGGTCCACAAGG | GCCAATCACAGCATAGAAGCG | 297 | |||
| Serping1 | TGGCTCAGAGGCTAACTGGC | GAATCTGAGAAGGCTCTATCCCCA | 122 | |||
| Slc10a6 | TCCATAGAGACCGGAGCACA | ATGCCTGATATGCTGCGACA | 157 | |||
| Snap25 | GGATGAGCAAGGCGAACAAC | TCCTGATTATTGCCCCAGGC | 180 | |||
| Sox10 | GACCCTATTATGGCCACGCA | GCCCCTCTAAGGTCGGGATA | 182 | |||
| Sparc | AAAACGTCCTGGTCACCTTG | TGGGACAGGTACCCATCAAT | 232 | |||
| Sparcl1 | CAGTCCCGACAACGTTTCTCT | CTGTCGACTGTTCATGGGCT | 186 | |||
| Sphk1 | AAAGCGAGACCCTGTTCCAG | CAGTCTGCTGGTTGCATAGC | 231 | |||
| Srgn | GTTCAAGGTTATCCTGCTCGGA | AAACAGGATCGGTCATCGGG | 151 | |||
| Steap4 | CAAACGCCGAGTACCTTGCT | CAGACAAACACCTGCCGACT | 121 | |||
| Syt1 | AGCCATAGTTGCGGTCCTTT | TCAGTCAGTCCGGTTTCAGC | 189 | |||
| Tgm1 | AGACCCAATTTTCCTGGGGC | AGCGAGGACCTTCCATTGTG | 100 | |||
| Thbs1 | TCGGGGCAGGAAGACTATGA | ACTGGGCAGGGTTGTAATGG | 118 | |||
| Thbs2 | CGTGAGCGATGAGAAGGACA | CGATCTGTGCTTGGTTGTGC | 122 | |||
| Timp1 | CGCTAGAGCAGATACCACGA | CCAGGTCCGAGTTGCAGAAA | 140 | |||
| Tm4sf1 | CTGAGGGACAGTACCTTCTGGATTC | GGCTAGGCCTCAACACAGTTA | 225 | |||
| Ugt1a | GGAAGCTGTTAGTGATCCCC | TGCTATGACCACCACTTCGT | 101 | |||
| Vim | GAGGAGATGAGGGAGTTGCG | CTGCAATTTTTCTCGCAGCC | 117 | |||
Extended Data Table 2.
Mouse primer sequences.
| ID | FWD | REV | PRODUCT SIZE | |||
|---|---|---|---|---|---|---|
| Aif1 | GGATCAACAAGCAATTCCTCGA | CTGAGAAAGTCAGAGTAGCTGA | 247 | |||
| Aldh1l1 | GCAGGTACTTCTGGGTTGCT | GGAAGGCACCCAAGGTCAAA | 86 | |||
| Amigo2 | GAGGCGACCATAATGTCGTT | GCATCCAACAGTCCGATTCT | 263 | |||
| Aqp4 | CTGGGCATCCTGTCACAACA | CAGGAATGTCCACACTTAGACAC | 94 | |||
| Arg1 | TTTTAGGGTTACGGCCGGTG | CCTCGAGGCTGTCCTTTTGA | 146 | |||
| Aspg | GCTGCTGGCCATTTACACTG | GTGGGCCTGTGCATACTCTT | 133 | |||
| B3gnt5 | CGTGGGGCAATGAGAACTAT | CCCAGCTGAACTGAAGAAGG | 207 | |||
| C1q | TCTGCACTGTACCCGGCTA | CCCTGGTAAATGTGACCCTTTT | 232 | |||
| Ccl2 | CACTCACCTGCTGCTACTCA | GCTTGGTGACAAAAACTACAGC | 117 | |||
| Cd109 | CACAGTCGGGAGCCCTAAAG | GCAGCGATTTCGATGTCCAC | 147 | |||
| Cd14 | GGACTGATCTCAGCCCTCTG | GCTTCAGCCCAGTGAAAGAC | 232 | |||
| Cd44 | ACCTTGGCCACCACTCCTAA | GCAGTAGGCTGAAGGGTTGT | 299 | |||
| Cd68 | ACTGGTGTAGCCTAGCTGGT | CCTTGGGCTATAAGCGGTCC | 85 | |||
| Celf4 | TGCGCTTTCCTCACCTACTG | TTTCTATGTGAAGGGGGCTGG | 111 | |||
| Clcf1 | CTTCAATCCTCCTCGACTGG | TACGTCGGAGTTCAGCTGTG | 176 | |||
| Cp | TGTGATGGGAATGGGCAATGA | AGTGTATAGAGGATGTTCCAGGTCA | 282 | |||
| Cx3cr1 | CAGCATCGACCGGTACCTT | GCTGCACTGTCCGGTTGTT | 65 | |||
| Cxcl10 | CCCACGTGTTGAGATCATTG | CACTGGGTAAAGGGGAGTGA | 211 | |||
| Emp1 | GAGACACTGGCCAGAAAAGC | TAAAAGGCAAGGGAATGCAC | 183 | |||
| Fbln5 | CTTCAGATGCAAGCAACAA | AGGCAGTGTCAGAGGCCTTA | 281 | |||
| Fkbp5 | TATGCTTATGGCTCGGCTGG | CAGCCTTCCAGGTGGACTTT | 194 | |||
| Gabra1 | GCTTCCTAGCTTGCGTTCATT | AACTTGCACTCTGGCCCTAA | 293 | |||
| Gapdh | AAGAGGGATGCTGCCCTTAC | TACGGCCAAATCCGTTCACA | 119 | |||
| Gbp2 | GGGGTCACTGTCTGACCACT | GGGAAACCTGGGATGAGATT | 285 | |||
| Gfap | AGAAAGGTTGAATCGCTGGA | CGGCGATAGTCGTTAGCTTC | 299 | |||
| Gfap | AGAAAGGTTGAATCGCTGGA | CGGCGATAGTCGTTAGCTTC | 299 | |||
| Ggta1 | GTGAACAGCATGAGGGGTTT | GTTTTGTTGCCTCTGGGTGT | 115 | |||
| Gjc2 | CTTGTGCATCTCCAGGTCCCA | TGTCAGCACAATGCGGAAGA | 151 | |||
| H2-D1 | TCCGAGATTGTAAAGCGTGAAGA | ACAGGGCAGTGCAGGGATAG | 204 | |||
| H2-T23 | GGACCGCGAATGACATAGC | GCACCTCAGGGTGACTTCAT | 212 | |||
| Hsbp1 | GACATGAGCAGTCGGATTGA | GGATGGGGTGTAGGGGTACT | 265 | |||
| Iigp1 | GGGGCAATAGCTCATTGGTA | ACCTCGAAGACATCCCCTTT | 104 | |||
| Il1a | CGCTTGAGTCGGCAAAGAAAT | CTTCCCGTTGCTTGACGTTG | 271 | |||
| Il1b | TGCCACCTTTTGACAGTGATG | TGATGTGCTGCTGCGAGATT | 138 | |||
| Itgam | TGGCCTATACAAGCTTGGCTTT | AAAGGCCGTTACTGAGGTGG | 93 | |||
| Lcn2 | CCAGTTCGCCATGGTATTTT | CACACTCACCACCCATTCAG | 206 | |||
| Marco | TTCTGTCGCATGCTCGGTTA | CAGATGTTCCCAGAGCCACC | 71 | |||
| Mbp | GAGACCCTCACAGCGATCCAAG | GGAGGTGGTGTTCGAGGTGTC | 282 | |||
| Mog | CACCGAAGACTGGCAGGACA | CCACAGCAAAGAGGCCAATG | 129 | |||
| Msr1 | CCAGCAATGACAAAAGAGATGACA | CTGAAGGGAGGGGCCATTTT | 150 | |||
| Nefl | CAAGGACGAGGTGTCGGAAA | TGATTGTGTCCTGCATGGCG | 152 | |||
| Osmr | GTGAAGGACCCAAAGCATGT | GCCTAATACCTGGTGCGTGT | 199 | |||
| Psmb8 | CAGTCCTGAAGAGGCCTACG | CACTTTCACCCAACCGTCTT | 121 | |||
| Ptgs2 | GCTGTACAAGCAGTGGCAAA | CCCCAAAGATAGCATCTGGA | 232 | |||
| Ptx3 | AACAAGCTCTGTTGCCCATT | TCCCAAATGGAACATTGGAT | 147 | |||
| S100a10 | CCTCTGGCTGTGGACAAAAT | CTGCTCACAAGAAGCAGTGG | 238 | |||
| S1pr3 | AAGCCTAGCGGGAGAGAAAC | TCAGGGAACAATTGGGAGAG | 197 | |||
| Saa3 | GGGTCTAGAGACATGTGGCG | TCTGGCATCGCTGATGACTT | 150 | |||
| Serpina3n | CCTGGAGGATGTCCTTTCAA | TTATCAGGAAAGGCCGATTG | 233 | |||
| Serping1 | ACAGCCCCCTCTGAATTCTT | GGATGCTCTCCAAGTTGCTC | 299 | |||
| Slc10a6 | GCTTCGGTGGTATGATGCTT | CCACAGGCTTTTCTGGTGAT | 217 | |||
| Snap25 | AGCAAGGCGAACAACTCGAT | AGGCCACAGCATTTGCCTAA | 106 | |||
| Sphk1 | GATGCATGAGGTGGTGAATG | TGCTCGTACCCAGCATAGTG | 135 | |||
| Srgn | GCAAGGTTATCCTGCTCGGA | TGGGAGGGCCGATGTTATTG | 134 | |||
| Steap4 | CCCGAATCGTGTCTTTCCTA | GGCCTGAGTAATGGTTGCAT | 262 | |||
| Syt1 | CGCTCCAGTTTCCCTCTGAAT | GGATGTTGGTTGTTCGAGCG | 126 | |||
| Tgm1 | CTGTTGGTCCCGTCCCAAA | GGACCTTCCATTGTGCCTGG | 97 | |||
| Timp1 | AGTGATTTCCCCGCCAACTC | GGGGCCATCATGGTATCTGC | 123 | |||
| Tm4sf1 | GCCCAAGCATATTGTGGAGT | AGGGTAGGATGTGGCACAAG | 258 | |||
| Tmem119 | GTGTCTAACAGGCCCCAGAA | AGCCACGTGGTATCAAGGAG | 119 | |||
| Tnfa | TGTGCTCAGAGCTTTCAACAA | CTTGATGGTGGTGCATGAGA | 88 | |||
| Ugt1a | CCTATGGGTCACTTGCCACT | AAAACCATGTTGGGCATGAT | 136 | |||
| Vim | AGACCAGAGATGGACAGGTGA | TTGCGCTCCTGAAAAACTGC | 169 | |||
Extended Data Table 3.
Clinical and pathological characteristics of human post mortem tissue samples from multiple sclerosis patients and age-matched controls.
| Sex | Age (years) | PMD (hours) | Disease duration (years) | Disease course | FDX |
|---|---|---|---|---|---|
| F | 51 | 10 | 23 | SP | active |
| F | 35 | 9 | 5 | SP | active |
| M | 40 | 27 | 16 | SP | active |
| F | 50 | 22 | 23 | SP | active, chronic inactive |
| F | 42 | 11 | 6 | PP | chronic active |
| F | 34 | 12 | 11 | SP | chronic active |
| F | 59 | 21 | 39 | SP | chronic active |
| F | 59 | 21 | 39 | SP | chronic active |
| F | 53 | 17 | 28 | SP | chronic inactive |
| M | 53 | 13 | 16 | SP | chronic inactive |
| F | 57 | 12 | 19 | SP | chronic inactive |
| M | 82 | 21 | NA | NA | control, unknown |
| M | 35 | 22 | NA | NA | control, carcinoma of the tongue |
| M | 84 | 5 | NA | NA | control, carcinoma of the bladder |
| M | 82 | 21 | NA | NA | control, myelodysplastic syndrome |
Inflammatory staging of subcortical MS lesions was carried out according to established histological criteria: active – presence of MOG+/LFB+ phagocytes and strong microglia activation; early inactive – presence of PAS+ phagocytes and strong microglia activation; late inactive – no macrophages and diffuse microglia activation7–9. Abbreviations: F, female; FDX, functional diagnosis; LFB, Luxol fast blue; M, male; MOG, myelin oligodendrocyte glycoprotein; MS, multiple sclerosis; NA, not applicable; PAS, periodic acid Schiff; PMD, postmortem delay; PP, primary progressive MS; SP, secondary progressive MS.
Extended Data Table 4.
Clinical and pathological characteristics of human post mortem tissue samples from Alzheimer’s disease patients and age-matched controls.
| Sex | Age (years) | PMD (hours) | FDX | Brain region |
|---|---|---|---|---|
| M | 89 | 8.75 | AD | PFC |
| F | 80 | 7 | AD | PFC |
| F | 79 | 9.5 | AD | PFC |
| M | 79 | – | control, unknown | PFC |
| M | 80 | – | control, unknown | PFC |
| F | 82 | – | control, unknown | PFC |
| M | 81 | – | control, unknown | PFC |
| M | 84 | – | control, unknown | PFC |
| F | 90 | – | control, unknown | PFC |
| F | 61 | 6 | AD | Hippocampus |
| F | 85 | 14 | AD | Hippocampus |
| F | 76 | 23 | AD | Hippocampus |
| F | 56 | 12 | control, unknown | Hippocampus |
| – | – | – | control, unknown | Hippocampus |
| – | – | – | control, unknown | Hippocampus |
Abbreviations: AD, Alzheimer’s disease; F, female; FDX, functional diagnosis; M, male; PFC, prefrontal cortex; PMD, post mortem delay.
Extended Data Table 5.
Clinical and pathological characteristics of human post mortem tissue samples from Parkinson’s disease patients and age-matched controls.
| Sex | Age (years) | Race | PMD (hours) | FDX | CERAD | BRAAK | Brain region |
|---|---|---|---|---|---|---|---|
| M | 76 | W | 18 | PD | 0 | 2 | SN |
| M | 86 | W | 19 | Lewy body disease, incipient AD | 0 | 2 | SN |
| M | 90 | W | 7 | PD, neurofibrillary tangles and tau pathology BRAAK 4, TBI possible | 0 | 4 | SN |
| M | 92 | W | 17 | PD, dementia | 0 | 3 | SN |
| M | 80 | W | 9.5 | PD, dementia | 0 | 3 | SN |
| F | 85 | W | 19 | PD, dementia, FTD, cerebrovascular disease | 0 | 4 | SN |
| M | 76 | W | 13.5 | PD | 0 | 1 | SN |
| M | 76 | W | 25 | Control | NA | NA | SN |
| M | 82 | W | 20 | Control | NA | NA | SN |
| M | 81 | W | 26 | Control | NA | NA | SN |
| M | 76 | W | 9 | Control | NA | NA | SN |
| M | 83 | W | 25 | Control, vascular disease | NA | NA | SN |
Abbreviations: AD, Alzheimer’s disease; BRAAK, Braak staging10; CERAD, Consortium to Establish a Registry for Alzheimer’s Disease (CERAD) neurocognitive test battery result; F, female; FDX, functional diagnosis; FTD, Frontotemporal dementia; M, male; PMD, post mortem delay; SN, substantia nigra; NA, not applicable; TBI, traumatic brain injury; W, white (Caucasian).
Extended Data Table 6.
Clinical and pathological characteristics of human post mortem tissue samples from Huntington’s disease patients and age-matched controls.
| Sex | Age (years) | PMD (hours) | FDX | CAG Number | Vonsattel grade | Brain region |
|---|---|---|---|---|---|---|
| F | 59 | 7 | HD | 47 | HD4 | Caudate nucleus |
| M | 54 | 8 | HD | 46 | HD4 | Caudate nucleus |
| F | 45 | 16 | HD | Unknown | HD4 | Caudate nucleus |
| M | 51 | 16 | Control | Unknown | N/A | Caudate nucleus |
| M | 54 | 6.5 | Control | Unknown | N/A | Caudate nucleus |
| F | 63 | 16 | Control | 16 | N/A | Caudate nucleus |
| M | 60 | 17 | Control | 17 | N/A | Caudate nucleus |
| M | 41 | 16 | Control | 22 | N/A | Caudate nucleus |
Abbreviations: HD, Huntington’s disease; CAG Number, number of CAG repeats in the huntingtin gene; F, female; M, male; FDX, functional diagnosis; PMD, post mortem delay
Extended Data Table 7.
Clinical and pathological characteristics of human post mortem tissue samples from amyotrophic lateral sclerosis patients and age-matched controls.
| Sex | Age (years) | PMD (hours) | FDX | Brain Atrophy | Dementia | Brain region |
|---|---|---|---|---|---|---|
| F | 67 | 19 | ALS | None | No | Motor cortex |
| M | 67 | 8 | ALS | None | No | Motor cortex |
| M | 56 | 4 | ALS | Severe | No | Motor cortex |
| F | 56 | 12 | Control | None | No | Motor cortex |
| – | – | – | Control | None | No | Motor cortex |
| – | – | – | Control | None | No | Motor cortex |
Abbreviations: ALS, Amyotophic lateral sclerosis; F, female; FDX, functional diagnosis; M, male; PMD, post mortem delay.
Supplementary Material
Acknowledgments
See Supplementary Notes for funding information.
Footnotes
Author Contributions
See Supplementary Notes for author contributions.
Data Availability:
The data that support the findings of this study are available from the corresponding author upon reasonable request.
References
- 1.Sofroniew MV, Vinters HV. Astrocytes: biology and pathology. Acta Neuropathol. 2010;119:7–35. doi: 10.1007/s00401-009-0619-8. [DOI] [PMC free article] [PubMed] [Google Scholar]
- 2.Clarke LE, Barres BA. Emerging roles of astrocytes in neural circuit development. Nat Rev Neurosci. 2013;14:311–21. doi: 10.1038/nrn3484. [DOI] [PMC free article] [PubMed] [Google Scholar]
- 3.Chung WSS, et al. Astrocytes mediate synapse elimination through MEGF10 and MERTK pathways. Nature. 2013;504:394–400. doi: 10.1038/nature12776. [DOI] [PMC free article] [PubMed] [Google Scholar]
- 4.Liddelow S, Barres B. SnapShot: Astrocytes in Health and Disease. Cell. 2015;162:1170–1170 e1. doi: 10.1016/j.cell.2015.08.029. [DOI] [PubMed] [Google Scholar]
- 5.Zamanian JL, et al. Genomic analysis of reactive astrogliosis. J Neurosci. 2012;32:6391–410. doi: 10.1523/JNEUROSCI.6221-11.2012. [DOI] [PMC free article] [PubMed] [Google Scholar]
- 6.Anderson MA, et al. Astrocyte scar formation aids central nervous system axon regeneration. Nature. 2016;532:195–200. doi: 10.1038/nature17623. [DOI] [PMC free article] [PubMed] [Google Scholar]
- 7.Sofroniew MV. Astrogliosis. Cold Spring Harb Perspect Biol. 2015;7:a020420. doi: 10.1101/cshperspect.a020420. [DOI] [PMC free article] [PubMed] [Google Scholar]
- 8.Martinez FO, Gordon S. The M1 and M2 paradigm of macrophage activation: time for reassessment. F1000Prime Rep. 2014;6:13. doi: 10.12703/P6-13. [DOI] [PMC free article] [PubMed] [Google Scholar]
- 9.Heppner FL, Ransohoff RM, Becher B. Immune attack: the role of inflammation in Alzheimer disease. Nat Rev Neurosci. 2015;16:358–72. doi: 10.1038/nrn3880. [DOI] [PubMed] [Google Scholar]
- 10.Bush TG, et al. Leukocyte infiltration, neuronal degeneration, and neurite outgrowth after ablation of scar-forming, reactive astrocytes in adult transgenic mice. Neuron. 1999;23:297–308. doi: 10.1016/s0896-6273(00)80781-3. [DOI] [PubMed] [Google Scholar]
- 11.Zador Z, Stiver S, Wang V, Manley GT. Role of aquaporin-4 in cerebral edema and stroke. Handb Exp Pharmacol. 2009:159–70. doi: 10.1007/978-3-540-79885-9_7. [DOI] [PMC free article] [PubMed] [Google Scholar]
- 12.Cahoy JD, et al. A transcriptome database for astrocytes, neurons, and oligodendrocytes: a new resource for understanding brain development and function. J Neurosci. 2008;28:264–78. doi: 10.1523/JNEUROSCI.4178-07.2008. [DOI] [PMC free article] [PubMed] [Google Scholar]
- 13.Zhang Y, et al. An RNA-sequencing transcriptome and splicing database of glia, neurons, and vascular cells of the cerebral cortex. J Neurosci. 2014;34:11929–47. doi: 10.1523/JNEUROSCI.1860-14.2014. [DOI] [PMC free article] [PubMed] [Google Scholar]
- 14.Zhang Y, et al. Purification and Characterization of Progenitor and Mature Human Astrocytes Reveals Transcriptional and Functional Differences with Mouse. Neuron. 2016;89:37–53. doi: 10.1016/j.neuron.2015.11.013. [DOI] [PMC free article] [PubMed] [Google Scholar]
- 15.Bennett ML, et al. New tools for studying microglia in the mouse and human CNS. Proc Natl Acad Sci USA. 2016;113:E1738–46. doi: 10.1073/pnas.1525528113. [DOI] [PMC free article] [PubMed] [Google Scholar]
- 16.Ginhoux F, et al. Fate mapping analysis reveals that adult microglia derive from primitive macrophages. Science. 330:841–5. doi: 10.1126/science.1194637. [DOI] [PMC free article] [PubMed] [Google Scholar]
- 17.Cartmell T, Luheshi GN, Rothwell NJ. Brain sites of action of endogenous interleukin-1 in the febrile response to localized inflammation in the rat. J Physiol. 1999;518:585–94. doi: 10.1111/j.1469-7793.1999.0585p.x. [DOI] [PMC free article] [PubMed] [Google Scholar]
- 18.Foo LC, et al. Development of a method for the purification and culture of rodent astrocytes. Neuron. 2011;71:799–811. doi: 10.1016/j.neuron.2011.07.022. [DOI] [PMC free article] [PubMed] [Google Scholar]
- 19.Kang W, et al. Astrocyte activation is suppressed in both normal and injured brain by FGF signaling. Proc Natl Acad Sci USA. 2014;111:E2987–95. doi: 10.1073/pnas.1320401111. [DOI] [PMC free article] [PubMed] [Google Scholar]
- 20.Allen NJ, et al. Astrocyte glypicans 4 and 6 promote formation of excitatory synapses via GluA1 AMPA receptors. Nature. 2012;486:410–4. doi: 10.1038/nature11059. [DOI] [PMC free article] [PubMed] [Google Scholar]
- 21.Kucukdereli H, et al. Control of excitatory CNS synaptogenesis by astrocyte-secreted proteins Hevin and SPARC. Proc Natl Acad Sci USA. 2011;108:E440–9. doi: 10.1073/pnas.1104977108. [DOI] [PMC free article] [PubMed] [Google Scholar]
- 22.Christopherson KS, et al. Thrombospondins are astrocyte-secreted proteins that promote CNS synaptogenesis. Cell. 2005;120:421–33. doi: 10.1016/j.cell.2004.12.020. [DOI] [PubMed] [Google Scholar]
- 23.Banker GA. Trophic interactions between astroglial cells and hippocampal neurons in culture. Science. 1980;209:809–10. doi: 10.1126/science.7403847. [DOI] [PubMed] [Google Scholar]
- 24.Kigerl KA, et al. Identification of two distinct macrophage subsets with divergent effects causing either neurotoxicity or regeneration in the injured mouse spinal cord. J Neurosci. 2009;29:13435–44. doi: 10.1523/JNEUROSCI.3257-09.2009. [DOI] [PMC free article] [PubMed] [Google Scholar]
- 25.Castrano A, Hererra AJ, Cano J, Machado A. Lipopolysaccharide intranigral injection induces inflammatory reaction damage in nigrostriatal dopaminergic system. J Neurochem. 1998;70:1584–92. doi: 10.1046/j.1471-4159.1998.70041584.x. [DOI] [PubMed] [Google Scholar]
- 26.Liu Y, et al. Dextromethorplan protects dopaminergic neurons against inflammation-mediated degeneration through inhibition of microglial activation. J Pharmacol Exp Ther. 2003;305:212–18. doi: 10.1124/jpet.102.043166. [DOI] [PubMed] [Google Scholar]
- 27.Faulkner JR, et al. Reactive astrocytes protect tissue and preserve function after spinal cord injury. J Neurosci. 2004;24:2143–55. doi: 10.1523/JNEUROSCI.3547-03.2004. [DOI] [PMC free article] [PubMed] [Google Scholar]
- 28.Okada S, et al. Conditional ablation of Stat3 or Socs3 discloses a dual role for reactive astrocytes after spinal cord injury. Nat Med. 2006;12:829–34. doi: 10.1038/nm1425. [DOI] [PubMed] [Google Scholar]
- 29.Herrmann JE, et al. STAT3 is a critical regulator of astrogliosis and scar formation after spinal cord injury. J Neurosci. 2008;28:7231–43. doi: 10.1523/JNEUROSCI.1709-08.2008. [DOI] [PMC free article] [PubMed] [Google Scholar]
- 30.Di Giorgio FP, Boulting GL, Bobrowicz S, Eggan KC. Human embryonic stem cell-derived motor neurons are sensitive to the toxic effect of glial cells carrying an ALS-causing mutation. Cell Stem Cell. 2008;3:637–48. doi: 10.1016/j.stem.2008.09.017. [DOI] [PubMed] [Google Scholar]
- 31.Nagai M, et al. Astrocytes expressing ALS-linked mutated SOD1 release factors selectively toxic to motor neurons. Nat Neurosci. 2007;10:615–22. doi: 10.1038/nn1876. [DOI] [PMC free article] [PubMed] [Google Scholar]
- 32.Reed-Geaghan EG, Savage JC, Hise AG, Landreth GE. CD14 and toll-like receptors 2 and 4 are required for fibrillar A{beta}-stimulated microglial activation. J Neurosci. 2009;29:11982–92. doi: 10.1523/JNEUROSCI.3158-09.2009. [DOI] [PMC free article] [PubMed] [Google Scholar]
- 33.Stevens B, et al. The classical complement cascade mediates CNS synapse elimination. Cell. 2007;131:1164–78. doi: 10.1016/j.cell.2007.10.036. [DOI] [PubMed] [Google Scholar]
- 34.Stephan AH, et al. A dramatic increase of C1q protein in the CNS during normal aging. J Neurosci. 2013;33:13460–74. doi: 10.1523/JNEUROSCI.1333-13.2013. [DOI] [PMC free article] [PubMed] [Google Scholar]
- 35.Graber DJ, Harris BT. Purification and culture of spinal motor neurons from rat embryos. Cold Spring Harb Protoc. 2013;2013:319–26. doi: 10.1101/pdb.prot074161. [DOI] [PubMed] [Google Scholar]
- 36.Zhou L, Sohet F, Daneman R. Purification of endothelial cells from rodent brain by immunopanning. Cold Spring Harb Protoc. 2014;2014:65–77. doi: 10.1101/pdb.prot074963. [DOI] [PubMed] [Google Scholar]
- 37.Zhou L, Sohet F, Daneman R. Purification of pericytes from rodent optic nerve by immunopanning. Cold Spring Harb Protoc. 2014;2014:608–17. doi: 10.1101/pdb.prot074955. [DOI] [PubMed] [Google Scholar]
- 38.Bustin SA, et al. The MIQE guidelines: minimum information for publication of quantitative real-time PCR experiments. Clin Chem. 2009;55:611–22. doi: 10.1373/clinchem.2008.112797. [DOI] [PubMed] [Google Scholar]
- 39.Doyle KP, Buckwalter MS. A mouse model of permanent focal ischemia: distal middle cerebral artery occlusion. Methods Mol Biol. 2014;1135:103–110. doi: 10.1007/978-1-4939-0320-7_9. [DOI] [PubMed] [Google Scholar]
- 40.Ståhlberg A, Rusnakova V, Forootan A, Anderova M, Kubista M. RT-qPCR work-flow for single-cell data analysis. Methods. 2013;59:80–88. doi: 10.1016/j.ymeth.2012.09.007. [DOI] [PubMed] [Google Scholar]
- 41.Winzeler A, Wang JT. Purification and culture of retinal ganglion cells from rodents. Cold Spring Harb Protoc. 2013;2013:643–52. doi: 10.1101/pdb.prot074906. [DOI] [PubMed] [Google Scholar]
- 42.Yu XJJ, Liu M, Holden DW. SsaM and SpiC interact and regulate secretion of Salmonella pathogenicity island 2 type III secretion system effectors and translocators. Mol Microbiol. 2004;54:604–19. doi: 10.1111/j.1365-2958.2004.04297.x. [DOI] [PubMed] [Google Scholar]
- 43.Kriks S, et al. Dopamine neurons derived from human ES cells efficiently engraft in animal models of Parkinson’s disease. Nature. 2011;480:547–5. doi: 10.1038/nature10648. [DOI] [PMC free article] [PubMed] [Google Scholar]
- 44.Elmore MR, Lee RJ, West BL, Green KN. Characterizing newly repopulated microglia in the adult mouse: impacts on animal behavior, cell morphology, and neuroinflammation. PLoS ONE. 2015;10:e0122912. doi: 10.1371/journal.pone.0122912. [DOI] [PMC free article] [PubMed] [Google Scholar]
- 45.Dunkley PR, Jarvie PE, Robinson PJ. A rapid Percoll gradient procedure for preparation of synaptosomes. Nat Protoc. 2008;3:1718–28. doi: 10.1038/nprot.2008.171. [DOI] [PubMed] [Google Scholar]
- 46.Larocca JN, Norton WT. Isolation of myelin. Curr Protoc Cell Biol. 2007;25 doi: 10.1002/0471143030.cb0325s33. Chapter 3, Unit3. [DOI] [PubMed] [Google Scholar]
- 47.Zuchero JB, et al. CNS myelin wrapping is driven by actin disassembly. Dev Cell. 2015;34:152–67. doi: 10.1016/j.devcel.2015.06.011. [DOI] [PMC free article] [PubMed] [Google Scholar]
- 48.Faul F, Erdfelder E, Lang AGG, Buchner AG. G*Power 3: a flexible statistical power analysis program for the social, behavioral, and biomedical sciences. Behav Res Methods. 2007;39:175–91. doi: 10.3758/bf03193146. [DOI] [PubMed] [Google Scholar]
Associated Data
This section collects any data citations, data availability statements, or supplementary materials included in this article.


