

Abstract
Introduction
Hypovitaminosis D affects one-third to two-thirds of children and pregnant women from the Middle East and North Africa (MENA) region.
Objective
To evaluate in infants, children, adolescents and pregnant women, from the MENA region, the effect of supplementation with different vitamin D doses on the change in 25-hydroxyvitamin D [25(OH)D] level reached, and other skeletal and non-skeletal outcomes.
Methods
This is a systematic review of randomized controlled trials of vitamin D supplementation conducted in the MENA region. We conducted a comprehensive literature search in 7 databases, without language or time restriction, until November 2016. Two reviewers abstracted data from the included studies, independently and in duplicate. We calculated the mean difference (MD) and 95% CI of 25(OH)D level reached when at least 2 studies were eligible in each comparison (low (< 800 IU), intermediate (800–2,000 IU) or high (> 2,000 IU) daily dose of vitamin D, or placebo). We pooled data using RevMan version 5.3.
Results
We identified a total of 15 eligible trials: one in infants, 4 in children and adolescents and 10 in pregnant women.
In children and adolescents, an intermediate vitamin D dose (1,901 IU/d), resulted in a mean difference in 25(OH)D level of 13.5 (95% Confidence Interval (CI) 8.1;18.8) ng/ml, compared to placebo, favoring the intermediate dose (p < 0.001). The proportion of children and adolescents reaching a 25(OH)D level ≥ 20 ng/ml was 74% in the intermediate dose group.
In pregnant women, four trials started supplementation at 12–16 weeks of gestation and continued until delivery, and six trials started supplementation at 20–28 weeks gestation and stopped it at delivery. The MD in 25(OH)D level reached was 8.6 (95% CI 5.3–11.9) ng/ml (p <0.001) comparing the high dose (3,662 IU/d) to the intermediate dose (1,836 IU/d), and 12.3 (95% CI 6.4–18.2) ng/ml (p <0.001), comparing the high dose (3,399 IU/d) to the low dose (375 IU/d). Comparing the intermediate (1,832 IU/d) to the low dose (301 IU/d), the MD in 25(OH)D level achieved was 7.8 (95% CI 4.5–10.8) ng/ml (p < 0.001). The proportion of pregnant women reaching a 25(OH)D level ≥ 20 ng/ml was 80–90%, 73% and 27–43% in the high, intermediate, and low dose groups, respectively.
The risk of bias in the included studies, for children, adolescents and pregnant women, ranged from low to high.
Conclusion
In children, adolescents and pregnant women from the MENA, an intermediate vitamin D dose of 1,000–2,000 IU seems necessary to allow for the majority of the population to reach a desirable 25(OH)D level of 20 ng/ml. Further high quality RCTs are required to confirm/refute the beneficial impact of vitamin D supplementation on various clinically important outcomes.
Keywords: Vitamin D, Middle East and North Africa, meta-analysis, pregnant women, children and adolescents
1. Introduction
Hypovitaminosis D is a global public health problem, affecting children, adults and elderly [1]. In the Middle East and North Africa (MENA) region, 30–75% of children have a 25-hydroxyvitamin D [(OH)D] level less than 20 ng/ml [2], the desirable level set by the National Academy of Medicine (NAM) [Institute Of Medicine (IOM)] [3]. Such findings are close to those reported in US children [4]. In pregnant women, a systematic review of 18 observational studies showed that, during the first trimester, mean 25(OH)D level ranged between 11 ng/ml and 29 ng/ml in Caucasians, and 6 ng/ml and 17 ng/ml, in non-Caucasians, including Turkish, Moroccan, and other non-Western women [5]. Another recent systematic review comparing maternal and neonatal vitamin D status in different regions worldwide, showed that the prevalence of a 25(OH)D of < 20 ng/ml is 46% and 60% in Middle Eastern pregnant women and their neonates, respectively [6]. In addition to the well-known risk factors for vitamin D deficiency in adults, including older age, female gender, higher latitude, and dark skin pigmentation, other risk factors specific to the MENA region has been identified [2]. Multiparity, veiling of women, the winter season in the Mediterranean countries and the summer in gulf countries, low socio-economic and educational status, urban living, low dietary vitamin D intake, and genetic polymorphism of vitamin D metabolizing enzymes, have been identified as significant predictors of hypovitaminosis D [2].
Vitamin D was traditionally labeled as an important factor for bone formation and regulation of mineral hemostasis in infants and children [7]. Vitamin D deficiency in the pediatric population results in the development of rickets, characterized by hypocalcemia, growth retardation and long bones deformities [7, 8]. In addition, the potential extra-skeletal consequences of vitamin D deficiency were illustrated in several observational studies conducted in children, whereby hypovitaminosis D was associated with an increased risk of asthma, infections and auto-immune diseases, specifically type 1 diabetes [4, 9].
Pregnant women represent another vulnerable population, in whom hypovitaminosis is associated with adverse outcomes, such as gestational diabetes mellitus (GDM), preeclampsia, C-section and bacterial vaginosis [10]. Vitamin D deficiency affects not only the mothers, but also their offsprings [10]. Maternal 25-hydroxyvitamin D [25(OH)D] levels directly correlate with venous cord 25(OH)D levels [11]. Indeed, vitamin D plays a significant role in the development of fetal bone and muscle mass [12, 13]. Maternal hypovitaminosis D is associated with neonatal complications, including preterm birth and small for gestational age [14], in addition to long term complications, such as a reduced bone mass in children at 4 and 9 years [13, 15].
Vitamin D replacement guidelines in infants, children and adolescents differ between societies (Appendix 1A). The NAM (IOM) recommends in infants 400 IU/d (as adequate intake), and 600 IU/d in children and adolescents [as the Recommended Dietary Allowance (RDA)], allowing to 97.5% of the population to reach a target 25(OH)D level of 20 ng/ml [3]. The Endocrine Society (ES) recommends higher doses, of 400–1,000 IU/d in infants and 600–1,000 IU/d in children and adolescents, aiming at a desirable level of 30 ng/ml [16]. Similarly, vitamin D replacement guidelines in pregnant women vary widely (Appendix 1B). While the NAM (IOM) recommends 600 IU/d to reach the target 25(OH)D level of 20 ng/ml [3], the ES recommends 1,500–2,000 IU/d to reach a 25(OH)D level of 30 ng/ml [16]. Conversely, the WHO recommends no supplementation unless the pregnant woman has a dark skin or is from a population with a high prevalence of vitamin D deficiency [17]. Noteworthy that all these guidelines have been derived from studies conducted in Western populations and may not be applicable to the MENA region, where vitamin D deficiency is prevalent [2].
The objectives of this paper are to evaluate the following, in infants, children, adolescents and pregnant women, from the MENA region:
The mean difference in 25(OH)D level reached with low (< 800 IU), intermediate (800–2,000 IU) or high (> 2,000 IU) daily dose of vitamin D, and the estimated proportion of individuals reaching a 25(OH)D level ≥ 20 ng/ml at the end of the intervention.
The effect of vitamin D supplementation, by dose category, on the skeletal and extra-skeletal outcomes: fractures, bone mineral density (BMD), fall and muscle parameters, kidney stones, hypercalcemiemia/hypercalciuria, metabolic parameters, and mortality.
The dose response of vitamin D in individuals in this region, and identify the potential predictors affecting 25(OH)D level reached following intervention.
Findings from this systematic review will guide region specific recommendations on vitamin D replacement in infants, children, adolescents and in pregnant women.
2. Methods
The protocol of this systematic review is available online on PROSPERO; registration number CRD42014010488 [18].
2.1. Eligibility criteria
2.1.1. Inclusion criteria
We included Randomized Controlled Trials (RCTs) conducted in healthy infants, children, adolescents or pregnant women, from the MENA region (MENA countries as defined by the World Bank [19]: Algeria, Bahrain, Djibouti, Egypt, Jordan, Iran, Iraq, Kuwait, Lebanon, Libya, Malta, Morocco, Oman, Palestine/Israel, Qatar, Saudi Arabia, Syria, Tunisia, United Arab Emirates (UAE) and Yemen. We included RCTs administering vitamin D2 or D3, of any dose, given at least once monthly and for at least a 3-month duration (full details have been published elsewhere [18, 20]).
2.1.2. Exclusion criteria
We excluded studies conducted in children with rickets, in institutionalized/hospitalized individuals, those with chronic illnesses (kidney, liver or heart failure), and in the presence of conditions or drug therapy that affect vitamin D metabolism (malabsorption, anticonvulsants, steroids, anti-fungal medications). We excluded also studies administering vitamin D supplementation as a fortified food or in the active form.
2.2. Search strategy
We conducted a comprehensive literature search until 2015 and a search update in November 2016, in seven electronic databases: Medline, Embase, PubMed, Cochrane Library, in addition to Popline, Index Medicus for WHO Eastern Mediterranean (IMEMR), and Global Health Library, without time or language restriction. We used MeSH terms and keywords related to Vitamin D and MENA countries, and we applied an RCT filter [18, 20]. We identified additional trials by searching trial registries, including the ClinicalTrial.gov., and the WHO International Clinical Trials Registry (ICTRP), and by screening the references lists of recent systematic reviews on vitamin D trials.
2.3. Study selection
Teams of two reviewers (MC, SEG, KS) screened the titles and abstracts of all the retrieved citations, in duplicate, and independently. We obtained the full texts of references judged as potentially eligible by at least one reviewer. Similarly, we screened the full text of retained articles independently for eligibility. We resolved disagreements by discussion or with the help of a content expert (GEHF). In order to standardize the screening methodology, we conducted a calibration exercise on a sample of abstracts and full articles.
2.4. Data collection
We prepared data collection forms a priori and pilot tested them, in duplicate and independently. These forms included the following variables: author, journal name, publication year, city, country and latitude, sampling method, intervention details, number of participants per arm, age [mean (Standard Deviation (SD), or median (range)], Body Mass index (BMI) [mean (SD), or median (range)], baseline and post-intervention 25(OH)D level [mean (SD), or median (range)], vitamin D assay, co-morbidities, compliance and adverse events. With the exception of venous cord variables, all data collection variables were defined a priori.
2.5. Risk of bias assessment
We assessed in duplicate and independently the risk of bias for the primary outcome, the mean difference in 25(OH)D level achieved following the intervention, in the included studies using the Cochrane Collaboration’s tool for bias assessment [21]. This tool includes 5 domains, and these are: sequence generation, allocation concealment, blinding, incomplete outcome data and selective outcome reporting [21]. We resolved disagreement by discussion with experts (GEHF, EA). The risk of bias in the study by El Hajj Fuleihan et al. was assessed by 2 other reviewers (EA and LK; LK is the coordinator of the Clinical Epidemiology Unit at AUB-MC). We did not assess publication bias given the small number of studies included [21].
2.6. Statistical analysis
We conducted a random-effects meta-analysis, if 2 or more studies were included in each age and dose category, for each outcome. Using RevMan (version 5.3), we calculated the mean difference (MD) and 95% Confidence Interval (CI) of 25(OH)D level achieved following the intervention. Similarly, in each comparison, we calculated the MD or Relative Risk (RR), and 95% CI, for the other continuous and categorical outcomes, respectively, when sufficient data were available. In children and adolescents, we performed a pre-specified sub-group analysis based on gender. All variables are expressed as mean and standard deviation.
In each comparison study arms, we calculated the weighted mean (WM) and pooled standard deviation (Sdp) of the following variables: vitamin D administered dose, baseline 25(OH)D, and 25(OH)D level achieved following the intervention. The weights were based on the number of participants in the included studies arms (further details are published elsewhere [20]). Such variables allow to compare results in different dose categories. Using the aforementioned weighted means and Sdp, and assuming normality of the distribution of 25(OH)D level, we calculated the proportion (%), and 95% CI, of subjects reaching a 25(OH)D ≥ 20 ng/ml, at the end of the intervention in each dose category. We calculated 95% CI of the proportions using an online calculator [22]. In case of missing data, we based our analysis on a complete case scenario (excluding participants for whom data was missing). We assessed statistical heterogeneity between studies using the I2 and Chi square, with significance at a p-value ≤ 0.05.
3. Results
The search strategy yielded 4,949 citations. 4,691 citations were excluded and 259 full text articles were assessed for eligibility. We excluded 244 articles for various reasons, as detailed in Figure 1 diagram. We included 10 studies in pregnant women, 4 in children and adolescents and one study in infants.
Figure 1.
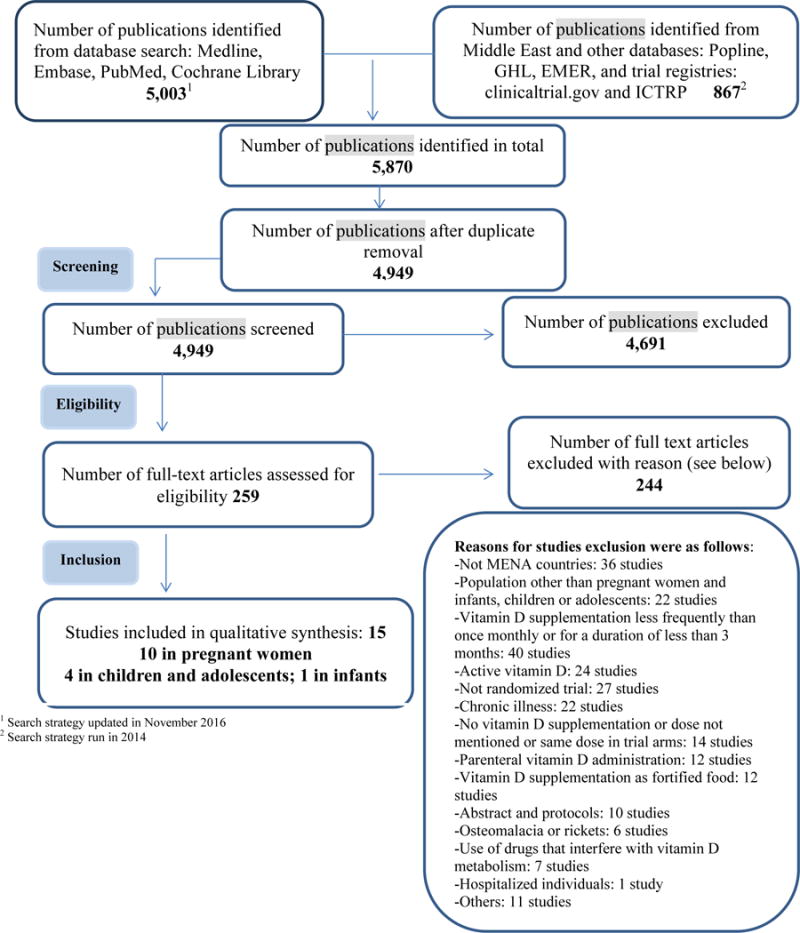
Flow diagram of the different phases of the systematic review
3.1. Effect of vitamin D replacement on 25(OH)D level
3.1. 1. Infants
We identified only one trial in infants from Iran, comparing 2 low doses of vitamin D, 400 IU versus 200 IU daily, administered in drops, and foodlet or sprinkles, respectively [23]. The baseline 25(OH)D level was 82–88.9 ng/ml (Table 1, Appendix 2). At the end of the study, 25(OH)D level was significantly higher in the group that received drops, 96.4(32.1) ng/ml, versus 88.5(28.4) ng/ml and 87.4(32) ng/ml, in the groups that received foodlet and sprinkles, respectively [23]. 25(OH)D level was measured using a radioimmunoassay.
Table 1.
Characteristics of included studies
| Author Journal Year Country | Sampling method/setting | Interventi on Duration | Ca su pp | Nb of subjects random ized per arm | Nb of subje cts lost to follo w up | Gen der (% Male per arm) | Age Mean (SD) or median (range) (years) | BMI Mean (SD) or median(ra nge) (kg/m2) | Baseli ne 25(O H)D mean (SD) or media n (range) (ng/ml) | Achie ved 25(O H)D mean (SD) or media n (range) (ng/ml) | Vitamin D assay |
|---|---|---|---|---|---|---|---|---|---|---|---|
| Infants | |||||||||||
| Samadp our Eur J Clin Nutr 2011 [23] Iran | Three urban health centers and two health posts | I1: D3 200 IU/d (Foodlet) I2: D3 200 IU/d (Sprinkles) I3: D3 400 IU/d (Drops) Duration: 4 months |
No | I1: 121 I2: 120 I3: 121 |
I1: 28 I2: 16 I3: 17 |
I1: 59.2 I2: 58.7 I3: 55.4 |
Age in months I1: 12.2 (3.6) I2: 12 (3.8) I3: 12.4 (3.3) |
Weight (kg) I1: 9.2 (1.3) I2: 9.2 (1.4) I3: 9.4 (1.3) Height (cm) I1: 74.3 (4.6) I2: 74 (5.3) I3: 74.7 (4.9) |
I1: 86.7 (27.8) I2: 82.0 (28.5) I3: 88.9 (31.1) |
I1: 88.6 (28.4) I2: 87.4 (32.0) I3: 96.4 (32.1) |
RIA (BioSource Europe S.A., Belgium |
| Children and adolescents | |||||||||||
| El Hajj Fuleihan JCEM 20061 [24] Maalouf JCEM 2008 [25] Lebanon | School children and adolescents | I1: D3 1,400 IU/week (= 200 IU/d) I2: D3 14,000 IU/week (=2,000 IU/d) C: Placebo Duration: 12 months |
No | Girls I1:58 I2: 55 C: 55 Boys I1: 56 I2: 60 C: 56 |
Girls I1: 4 I2: 4 C : 3 Boys I1: 3 I2: 4 C : 5 |
I1: 49 I2: 52 C : 50 |
Girls 13.2 (2.1) Boys 13.0 (1.9) |
Girls 20.1 (3.6) Boys 21.1 (4.2) |
Girls I1: 14 (9) I2: 13 (8) C: 14 (7) Boys: I1: 16 (7) I2: 16 (7) C: 16 (6) |
Girls: I1: 17 (6) I2: 38 (31) C: 16 (8) Boys: I1: 20 (7) I2: 35 (9) C: 17 (6) |
DiaSorin RIA (Diasorin, Incstar, Sallugia, Italy) |
| Ghazi Eur J Clni Nutr 2010 [27] Iran | School children (no other details) | I: D3 50,000U/month (=1,667 IU/d)2 C: placebo monthly Duration: 6 months in boys and 5 months in girls |
No | Girls I: 35 C: 35 Boys I: 35 C: 34 |
3 from the whole study | I : 50 C : 49 |
Girls I : 16.0 (1.0) C: 16.2 (1.2) Boys I : 16.5 (1.4) C: 16.6 (1.4) |
Girls I: 21.8 (3.1) C: 20.7 (2.9) Boys I: 22.3 (4.6) C: 21.9 (4.4) |
Girls I: 8.2 (9) C: 7.9 (5.9) Boys I: 17.5 (5.6) C: 15.5 (6.4) |
Girls at 5 mo I1: 19.2 (9.4) C : 8 (5.6) Boys at 6 mo I1: 29 (10.5) C : 15.6 (6.4) |
ELISA kits (Immuno-diagnostic Systems, Boldon, UK) |
| Mayan IMAJ 2015 [26] Israel | Sheba Medical Center | I:D3 2,000 IU/d C: Placebo Duration: 3 months |
No | I : 28 C: 27 |
None | I : 61 C : 67 |
I : 14 (13–15) C: 13 (12–16) |
NA | I : 24.7 (20.4–28.6) C: 25.0 (21.4–28.3) |
I : 29.7 (24.0–35.3) C: 20.6 (18.3–23.1) |
RIA (Diasorin, Stillwater, Minnesota, USA) |
| Neyestani J Hum Nutr Diet 2013 [28] Iran | 6 primary schools | I :D3200 IU/d C: placebo Duration: 3 months |
Yes | I : 67 C: 60 |
I : 6 C: 7 |
I : 24 C: 32 |
I : 10.4 (0.6) C: 9.8 (0.8) |
I : 18.2 (3.3) C: 18.7 (3.9) |
I : 9.5 (4.6) C: 10.1 (4.3) |
I : 17.5 (4.6) C: 9.6 (3.4) |
HPLC |
| Pregnancy3 | |||||||||||
| Sabet Acta Endocrinol 2012 [29] Iran | Mahdieh Hospital | I:D3 100,000 IU/month (=3,333 IU/d) C: Placebo Duration: 27 weeks gestation until delivery |
No | I : 25 C: 25 |
NA | 0 | I : 26.6 (4.7) C: 26 (6.2) |
Weight I : 72 (10) C: 70 (9) |
I : 33.5 (21.4) C: 38.3 (23.2) |
Maternal I : 61.4 (30) C: 29.4 (16) Venous cord I : 52 (40.5) C: 26 (21.3) |
EIA (Immune diagnostic system Ltd, Bolden, UK |
| Dawodu JCEM 2013 [30] United Arab Emirates | Primary health care clinics, affiliated with Tawam Hospital Pregnant women | I1: D3 3,600 IU/d I2: D3 1,600 IU/d C: Placebo All received also 400 IU/d as prenatal vitamins Duration: 12–16 weeks gestation till delivery |
No | I1: 63 I2: 65 C : 64 |
I1 : 8 I2:13 C : 9 |
0 | I1: 25.6 (5.5) I2: 27.3 (4.9) C : 27.5 (5.5) |
I1: 26.3 (5.4) I2: 26.3 (6.4) C : 25.8 (6.3) |
I1:7.8 (3.1) I2:8.2 (4.8) C: 8.6 (5.2) |
I1: 35.9 (12.1) I2: 25.9 (12.2) C : 19.3 (19.3) |
RIA (DiaSorin, Stillwater, Minnesota) |
| Shakiba Sing Med J 2013 [31] Iran | Two primary care clinics | I1: D3 50,000 IU/month (=1,667 IU/d) I2: 50,000 IU every two weeks (=3,571 IU/d)4 Duration: second trimester until delivery |
No | I1: 17 I2: 17 |
0 | 0 | 25 (3) (all arms) | NA | I1: 16 (7.4) I2: 18 (7.8) |
In neonates: I1: 25 (7) I2: 32 (12) |
Chemilumine sce-nce IA (DiaSorin, spA, Via Crescentino, Vercelli, Italy) |
| Soheilykhah Gynecol Endocrinol 2013 [32] Iran | Two prenatal clinics (Mojibian Hospital and Shahid Sadoughi Hospital) | I1: D2 200 IU/d I2: D2 50,000 IU/month (=1,666 IU/d) I3: D2 50,000 IU every 2 weeks (=3,571 IU/d). Duration: 12 weeks gestation until delivery |
No | I1: 40 I2: 40 I3: 40 |
I1: 5 I2: 2 I3: 0 |
0 | I1: 25 (4.3) I2: 26.5 (4.5) I3: 26.3 (4.8) |
I1: 26.2 (4.5) I2: 25 (3.8) I3: 25.9 (4.6) |
I1: 8.3 (7.8) I2: 7.3 (5.3) I3: 7.3 (5.9) |
I1: 17.7 (9.3) I2: 27.2 (10.7) I3: 34.1 (11.5) |
Chemilumine scence assay5 |
| Etemadifar Iran J Neurol 2015 [33] Iran | MS outpatient clinics of Isfahan University of Medical Sciences | I: D3 50,000 IU/week (7,142 IU/d) C: Placebo Duration: form 12 to 16 weeks gestation till delivery |
No | I : 21 C: 22 |
I : 15 C: 13 |
0 | I : 27.7 (2.4) C: 30.0 (3.9) |
NA | I : 15.3 (2.9) C: 18.3 (19) |
I: 33.7 (15.2) C: 14.6 (1.3) (levels checked at 6 months post-partum) |
RIA kit (DiaSorin, Stillwater, MN, USA) |
| Karamali Horm Metabol Res 2015 [34] Iran | Not detailed | I: D3 50,000 IU every 14 days (3,571 IU/d) C: Placebo All were on multivitamins including vitamin D 400 IU/d Duration: from 20 till 32 weeks of gestation |
No | I : 30 C: 30 |
0 | 0 | 27.4 (5.2) both arms | 25.9 (4.6) both arms | I:17 (1.4) C: 17.1(2.2) |
I : 34.9 (2.4) C:17.4 (4.0) |
ELISA kit (IDS, Boldon, UK) |
| Samimi J Hum Nutr Diet 2015 [35] Iran | Women at risk for preeclampsia, and lived approxim ately 20 km or less from the clinic and hospital | I: D3 50,000 IU every 14 days (3,571 IU/d) C: Placebo All were on multivitam ins including vitamin D 400 IU/d and 500 mg of Calcium, and 108 IU/d dietary vitamin D Duration: from 20 till 32 weeks of gestation |
Ye s (only in I arm) | I : 30 C: 30 |
I : 1 C: 1 |
0 | I : 27.3 (3.7) C: 27.1 (5.2) |
I : 27.4 (3.3) C: 25.6 (4.0) |
I : 13.1 (6.4) C: 16.2 (3.5) |
I : 21.3 (8.4) C: 16.3 (4.9) |
ELISA kit (IDS, Boldon, UK |
| Samimi Glob J Health Sci 2016 [38] Iran | Women with unexplained recurrent spontaneous abortion | I : D3 400 IU/d C: Placebo Duration: until 20 weeks gestation |
No | I : 39 C: 38 |
0 | 0 | I : 26.1 (4.3) C: 26.3 (4.4) |
NA | I : 11.6 (3.8) C: 11.5 (2.4) |
I : 13.2 (3.5) C: 11.1 (2.8) |
NA |
| Shahgheibi J Res Med Sci 2016 [36] Iran | Obstetrics and Gynecology section of Be’sat hospital clinic offices | I: D 5,000 IU weekly (714 IU/d) C: Placebo Duration: from the first trimester till 26 weeks of gestation |
No | I : 50 C: 50 |
I : 4 C: 5 |
0 | NA | I : 28.7 (4.63) C: 28.7 (5.46) |
I : 13.5 (7.6) C: 17.4 (14.9)6 |
NA | NA |
| Vaziri Early Hum Dev and BMC Chil 2016 [37] Iran | prenatal care in Hafez teaching hospital in Shiraz, Iran. | I: D3 2,000 IU/d C: Placebo All participants received multivitamins with vitamin D content of 200–400 IU/d Total vitamin D intake, as reported: I : 2345.16 (240.68) C: 430.79 (230.80) Duration: 26–28 weeks of gestation until delivery |
No | I : 78 C: 75 |
I : 16 C: 10 |
0 | I : 26.82 (4.92) C: 26.00 (4.34) |
I : 26.59 (3.97) C: 26.48 (3.60) |
I : 11.62 (5.59) C: 12.72 (8.37) |
I : 18.04 (9.59) C: 12.02 (5.82) |
CLIA |
Abbreviations: EIA: enzyme immunoassay; ELISA: enzyme-linked immunosorbent assay; HPLC: high pressure liquid chromatography; IA: immunoassay; RIA: radio-immunoassay.
El Hajj Fuleihan 2006 and Maalouf 2008 are same trial.
A third arm was excluded from analysis as vitamin D was given less frequently than once monthly.
Section adapted from Chakhtoura et al, BMJ Open. 2016 Mar 8;6(3):e0108
A third arm not included as it did not include randomized participants but those who are vitamin D deficient.
Manufacturer not mentioned
25(OH)D level unit not mentioned
3.1. 2. Children and adolescents
We identified 4 studies conducted in children and adolescents [24–28]. Two studies were from Iran [27, 28], one study from Lebanon [24] and one study from Israel [26]. The four studies were conducted in healthy school children, girls and boys, and the range of mean age of participants was 9.8–16.6 years. The baseline mean 25(OH)D level ranged between 7.9 and 25 ng/ml (Table 1, Appendix 2). The vitamin D assay used was high pressure liquid chromatography (HPLC) in one study [28], and immune-assays were used in the other three [24, 26, 27]. Concomitant calcium supplementation was administered in one study [28]. Compliance with vitamin D supplementation was described in one study only, ranging between 97–98% in the low, intermediate, and placebo arms [24]. The reported rates of loss to follow up were less than 15% in three studies [24, 27, 28], and no loss to follow up was reported in one study [26]. The risk of bias assessed by the Cochrane Tool was judged as high in the trial by Neyestani et al (mostly related to inadequate allocation concealment and performance bias) [28], unclear in the trials by Ghazi et al [27] and Mayan et al [26], and low in the trial by El Hajj Fuleihan et al [24, 25], respectively (Figure 2A, Appendix 3A).
Figure 2. Risk of bias assessment for included studies.
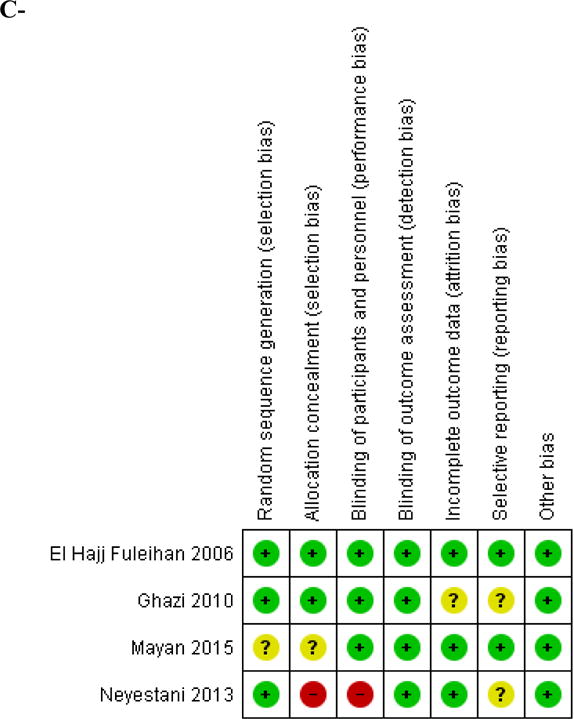
A- Children and adolescents
B- Pregnant women
A green color and (+) sign represent a low risk of bias; A yellow color and (?) sign represent an unclear risk of bias; A red color and a (−) sign represent a high risk of bias.
Vitamin D intermediate dose (800–2,000 IU/d) versus placebo comparison
Three studies were included in this comparison, the trial by El Hajj Fuleihan et al. extended over 12 months [24, 25], the one by Ghazi et al. extended over 6 months [27], and the study by Mayan et al extended over 3 months (Table 1, Appendix 2). The total number of participants was 211 in the intermediate dose group and 206 in the placebo group (Figure 3A). The weighted mean intermediate dose was 1,901 IU daily. The MD in 25(OH)D level achieved was 13.5 (95% CI 8.15;18.8), favoring the intermediate dose, p < 0.001 (Figure 3A), with high heterogeneity (I2 86%, p <0.001). The calculated WM baseline 25(OH)D level was 15.2 ng/ml, the WM vitamin D dose administered was 1,901 IU/d, and the calculated WM 25(OH)D level achieved post-intervention was 31.4 (Sdp=17.7) ng/ml in the intermediate dose group. Such supplementation allowed to 74% of children and adolescents to reach a 25(OH)D level of 20 ng/ml in this group, and 53% to reach a target level of 30 ng/ml, in the intermediate dose group (Table 2). In the placebo arm, WM increase in 25(OH)D level was 0.4 ng/ml and the proportion of subjects reaching the target 25(OH)D level of 20 ng/ml was estimated at 26%.
Figure 3. Effect of vitamin D supplementation on 25(OH)D level in children and adolescents.
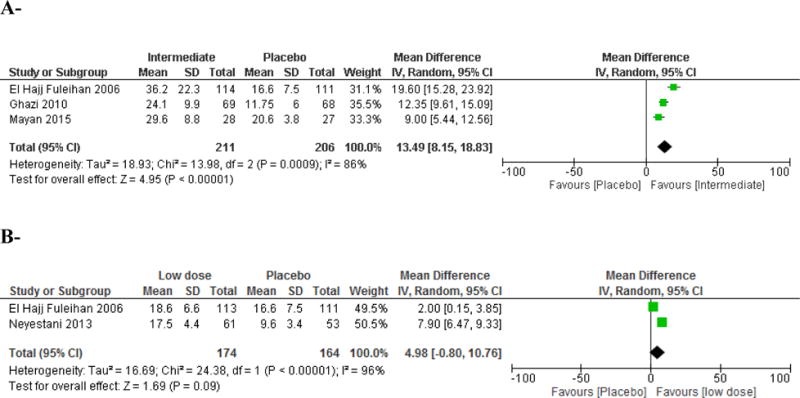
A- Intermediate dose (800–2,000 IU/d) versus placebo comparison
Vitamin D equivalent daily doses administered in the intermediate dose group were as follows: El Hajj Fuleihan 2006: 2,000 IU/d; Ghazi 2010: 1,667 IU/d; Mayan 2015: 2,000 IU.
B- Low dose (< 800 IU/d) versus placebo comparison
Vitamin D equivalent daily doses administered in the intermediate dose group were as follows: El Hajj Fuleihan 2006: 200 IU/d; Neyestani 2013: 200 IU/d.
Table 2.
Summary of results across all age groups
| Category (number of studies) | Dose category | Number of subjects by dose category | Baseline 25(OH)D (ng/ml) | Increase per 100 IU vitamin D (ng/ml)1 | Proportion (%) ≥ 20 ng/ml | Proportion (%) ≥ 30 ng/ml |
|---|---|---|---|---|---|---|
| Children [24–27] | Intermediate (1,901 IU/d) | 211 | 15.2 | 0.85 | 74 (67.7–79.4) | 53 (46.3–59.6) |
| Pregnancy 3studies [30,32,34,35,37] | Low (300 IU/d) | 201 | 8.52–12.23 | 13–3.42 | 27 (21.3–33.5)3–43 (36.3–49.9)2 | 1.7 (0.6–4.6)3–13.5 (9.5–18.9)2 |
| Intermediate (1,840 IU/d) | 79 | 7.9 | 1 | 73 (62.3–81.5) | 37 (27.2–48) | |
| High (3,399–3662 IU/d) | 204 | 7.62–113 | 0.53–0.72 | 80 (74–84.9)3–90 (85.1–93.4)2 | 40 (33.5–46.8)3–66.3 (59.6–72.4)2 |
Results on the effect of a low dose vitamin D in children are not added to this summary table as they were not significant.
Calculated as follows: [(WM 25(OH)D level achieved–WM 25(OH)D level at baseline)/vitamin D dose IU/d] × 100.
Including 2 studies Dawodu 2013 and Soheilykhah 2013 (intermediate dose versus low dose comparison or intermediate dose versus high dose comparison)
Including 3 studies Dawodu 2013, Soheilykhah 2013, Karamali 2015, Samimi 2016, Vaziri 2016 (high dose versus low dose comparison)
A subgroup analysis by gender, in the intermediate vitamin D dose versus placebo comparison, did not show any significant difference in the MD of 25(OH)D achieved; data not shown.
Vitamin D low dose (<800 IU/d) versus placebo comparison
We included 2 studies comparing a low dose (same dose in both studies of 200 IU daily) versus placebo [24, 25, 28] (Table 1, Appendix 2). The total number of participants was 174 in the low dose group, and 164 in the placebo group. The WM baseline 25(OH)D was 13.4 ng/ml. There was no significant difference in the achieved 25(OH)D level between low dose and placebo (Figure 3B).
3.1.3. Pregnant women
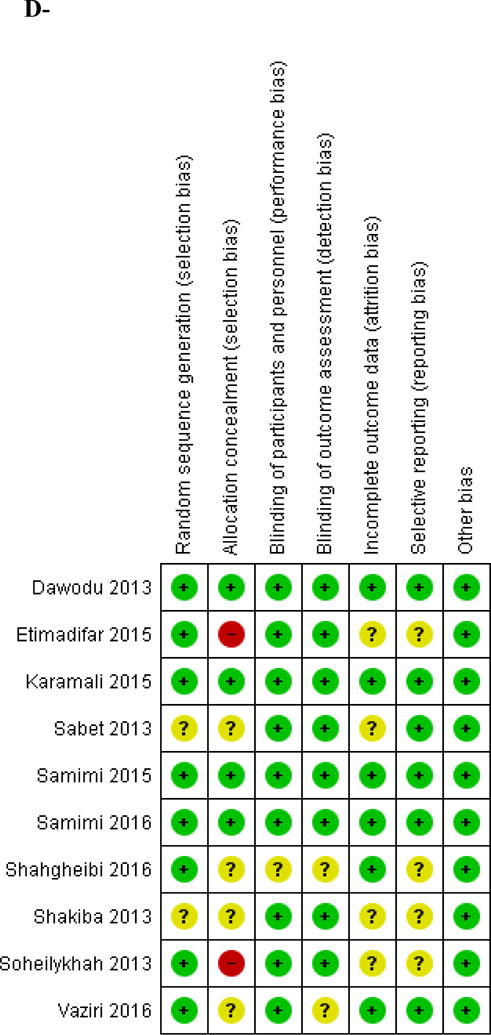
We identified 10 eligible studies conducted in pregnant women [29–38] (Table 1, Appendix 2). Nine studies were from Iran and one study was from UAE. Five studies were conducted in healthy pregnant women, while the others were conducted in women with multiple sclerosis (MS) [33], at risk of preeclampsia [34, 35], gestational diabetes mellitus [36], or recurrent unexplained abortions [38]. The mean BMI of participants varied between 25 and 28.7 kg/m2. Only one study administered calcium supplementation as part of the intervention [35]. Vitamin D supplementation was started at 12–20 weeks of gestation, with the exception of two studies, where vitamin D supplementation was started at 26–28 weeks of gestation [29, 37], and another one where supplementation started as soon as pregnancy was confirmed by abdominal US and βhCG level [38] (Table 1, Appendix 2). All studies administered vitamin D until delivery, except the trials by Karamali et al., Shahgheibi et al. and Samimi et al. where supplementation was stopped in the third trimester [34, 36, 38]. In four trials comparing a high dose to placebo, all participants received additional vitamin D supplementation of 200–400 IU daily [30, 34, 35, 37]. Therefore, the control arms in these studies were considered as administering a low vitamin D dose [30, 34, 35, 37]. Maternal 25(OH)D level at delivery was reported in five studies, one of them reported also results on venous cord 25(OH)D level [29]. Etemadifar et al reported maternal 25(OH)D levels at 6 months post-partum and not at delivery [33]. In the trial assessing the effect of vitamin D on unexplained recurrent abortions, Samimi et al reported 25(OH)D level at 20 weeks gestation, rather than at delivery [38]. Shakiba et al. reported only on 25(OH)D levels in venous cord blood [31]. Karamali et al. assessed 25(OH)D levels at 32 weeks gestation [34]. The achieved 25(OH)D level following the intervention was missing in one of the studies [36]. The vitamin D assays used were variable and none of the studies used the accurate method HPLC. Compliance rate was described in 3 studies only. Dawodu et al reported a compliance rate of 86% in the high dose arm, 87% in the intermediate arm, and 82% in the low dose arm [30]. Karamali et al reported a 100% compliance rate in both groups [34]. Samimi et al reported a compliance > 90% in the study assessing the effect of vitamin D supplementation during pregnancy on metabolic profile [35]. Vaziri et al excluded participants who were not compliant [37]. A very high proportion of participants was lost to follow up in one trial, ranging between 59 and 71% [33]. In the remaining studies, the loss to follow up varied between 0 and 20%. The risk of bias assessment showed that two studies were at low risk of bias across all domains [34, 35]. Two studies were open label, and thus at high risk of selection and performance bias [32, 33]. The remaining studies were rated as having unclear risk of bias because they did not describe any details related to sequence generation, allocation concealment, blinding and/or incomplete outcome data (Figure 2B, Appendix 3B).
Vitamin D low dose (<800 IU/d) versus Placebo
We identified two studies were identified in this category [36, 38]. Samimi et al administered 400 IU/d vitamin D to deficient pregnant women early in their first trimester and assessed response at 20 weeks gestation [38]. Shahgheibi et al started vitamin D supplementation in the first trimester until 26 weeks gestation [36]. The latter study did not report on the achieved 25(OH)D levels at the end of the intervention [36]. Therefore, we were not able to conduct a meta-analysis in this comparison.
Vitamin D intermediate dose (800–2,000 IU/d) versus low dose (<800 IU/d) comparison
Two studies were included in this comparison [30, 32] (Table 1, Appendix 2). The total number of participants was 79 in the intermediate dose group and 77 in the low dose group. The weighted mean intermediate dose administered was 1,832 IU daily and the weighted mean low dose 301 IU daily, started at 12–16 weeks of gestation and continued until delivery. The MD in 25(OH)D level achieved was 7.8(95% CI 4.5–10.8) ng/ml, p < 0.001, with low heterogeneity (I2 0%, p <0.35) (Figure 4A). The calculated weighted mean 25(OH)D level at baseline was 7.9 ng/ml in the intermediate dose group and 8.5 ng/ml in the low dose group, and the calculated mean weighted level reached in the intermediate dose group was 26.5(Sdp =10.4) ng/ml and 18.6(Sdp =10.4) ng/ml in the low dose group. The proportion of pregnant women who reached the target 25(OH)D level of 20 ng/ml was estimated at 73% and 43%, in the intermediate and low dose groups, respectively. Aiming at a target 25(OH)D level of 30 ng/ml, the proportion of pregnant women would be 37% and 13.5% in the intermediate and low dose groups, respectively (Table 2).
Figure 4. Effect of vitamin D supplementation on 25(OH)D level in pregnant women.
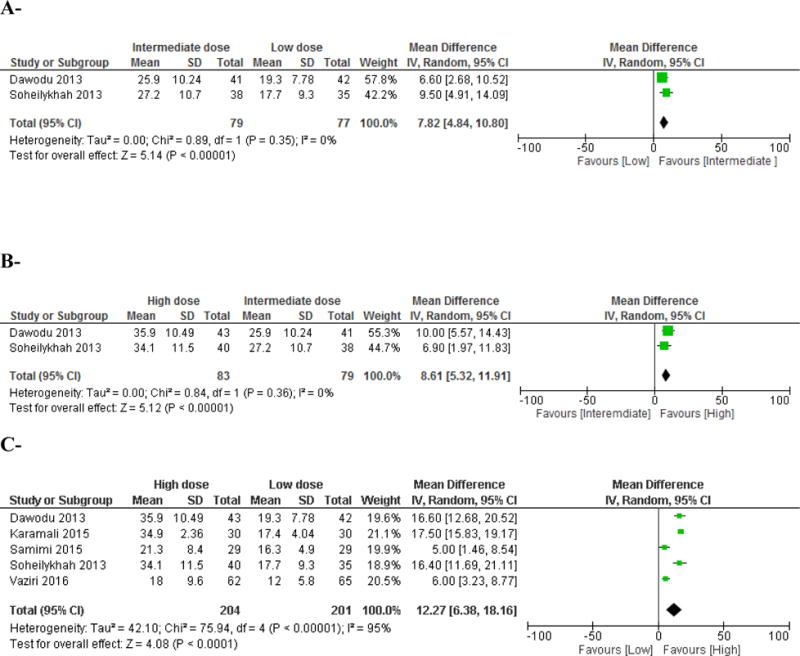
A-Intermediate dose (800–2,000 IU/d) versus low dose (<800 IU/d) comparison
Vitamin D supplementation started early second trimester and continued until delivery. Vitamin D equivalent daily doses were as follows: Dawodu 2013: 2,000 IU/d versus 400 IU/d; Soheilykhah 2013: 1,660 IU/d versus 200 IU/d.
B- High dose (>2,000 IU/d) versus intermediate dose (800–2,000 IU/d) comparison
Vitamin D supplementation started early second trimester and continued until delivery. Vitamin D equivalent daily doses were as follows: Dawodu 2013: 4,000 IU/d versus 2,000 IU/d; Soheilykhah 2013: 3,571 IU/d versus 1,667 IU/d.
C- High dose (>2,000 IU/d) versus low dose (<800 IU/d) comparison
Vitamin D supplementation started early second trimester and continued until delivery in 2 studies (Dawodu 2013 and Soheilykhah 2013). Vitamin D supplementation started at 20 weeks gestation and continued until 32 weeks gestation in 2 other studies (Karamali 2015 and Samimi 2015). The study by Vaziri et al administered vitamin D supplementation from 26–28 weeks gestation until delivery (Vaziri 2016).
Vitamin D equivalent daily doses were as follows: Dawodu 2013: 4,000 IU/d versus 400 IU/d; Karamali 7,540 IU/d versus 400 IU/d; Samimi 2015: 3,971 IU/d versus 400 IU/d; Soheilykhah 2013: 3,571 IU/d versus 200 IU/d; Vaziri 2016: 2345 IU/d versus 431 IU/d; in the latter study, the total vitamin D dose administered included dietary vitamin D.
Vitamin D high dose (> 2,000 IU/d) versus intermediate dose (800–2,000 IU/d) comparison
Two studies compared an intermediate versus a high vitamin D dose [30, 32] (Table 1, Appendix 2). The total number of subjects was 83 in the high dose group, and 79 in the intermediate dose group. The weighted mean high dose administered was 3,662 IU daily, and the weighted mean intermediate dose 1,836 IU daily, started at 12–16 weeks of gestation and continued until delivery. The MD in 25(OH)D level reached between arms was 8.6 (95% CI 5.3–11.9) ng/ml, p < 0.001 (Figure 4B). The calculated weighted 25(OH)D level reached in the high dose group was 35 (Sdp=11.8) ng/ml, and 26.5 (Sdp=10.4) ng/ml in the intermediate dose group. The proportion of pregnant women who reached the target of 20 ng/ml, at delivery, was estimated to be 90 % and 73%, in the high and intermediate dose groups, respectively; aiming at a target 25(OH)D level of 30 ng/ml, the proportion of pregnant women would be 66% and 37% in the high and intermediate dose groups, respectively (Table 2).
Vitamin D high dose (>2,000 IU/d) versus low dose (<800 IU/d) comparison
Five studies were included in the high versus low dose comparison [30, 32, 34, 35, 37] (Table 1, Appendix 2). The total number of pregnant women was 204 in the high dose group, and 201 in the low dose group. The weighted mean high dose was 3,399 IU daily and the weighted mean low dose administered was 375 IU daily, started in the second trimester and continued until delivery, with the exception of 2 trials [34, 35] where the intervention stopped at 32 weeks of gestation. The MD in 25(OH)D level reached was 12.3(95% CI 6.4–18.2) ng/ml, favoring the high dose, p < 0.001, with high heterogeneity (I2 95%, p <0.001) (Figure 4C). The calculated weighted baseline 25(OH)D level was 12.2 and 11 ng/ml, in the low and high dose arms, respectively. The calculated weighted mean 25(OH)D level achieved post-intervention was 27.9 (Sdp=9.4) ng/ml in the high dose group and 15.9 (Sdp=6.7) ng/ml in the low dose group. The proportions of subjects who reach the target 25(OH)D of 20 ng/ml was 80% in the high dose group and 27% in the low dose group. Aiming at a target 25(OH)D level of 30 ng/ml, the proportion of pregnant women would be 40% and 1.7% in the high and low dose groups, respectively (Table 2).
A sensitivity analysis in the high versus low dose comparison, including only the studies with low risk of bias [30, 34, 35], showed a MD in 25(OH)D level of 13.1 (95% CI 5.4–20.7) ng/ml, favoring the high dose, with high heterogeneity (I2 95%, p <0.001).
Vitamin D high dose (>2,000 IU/d) versus placebo comparison
Two studies were identified in this comparison [29, 33] (Table 1, Appendix 2). However, results could not be pooled together as Etemadifar et al presented results at 6 months post-partum, rather than at delivery [33].
3.1.4. Neonates
Vitamin D high dose (> 2,000 IU/d) versus intermediate dose (800–2,000 IU/d) comparison Two studies allowed a comparison of the effect of a high dose versus an intermediate dose of vitamin D administered during pregnancy, on the venous cord blood 25(OH)D level [30, 31]. The total number of participants was 59 and 56, in the high and intermediate dose groups, respectively. The weighted mean intermediate dose was 1,930 IU daily and the weighted mean high dose was 3,908 IU daily, started in the second trimester until delivery. The MD was 7.1 (95% CI 3.9–10.4) ng/ml favoring the high dose, p < 0.001, with a low heterogeneity (I2 0%, p =0.96) (Figure 5). The estimated proportion of neonates reaching a 25(OH)D level of 20 ng/ml at birth was 80% in the high dose and 55% in the intermediate dose; aiming at a target 25(OH)D level of 30 ng/ml, the proportion of neonates would be 42% and 24% in the high and intermediate dose groups, respectively.
Figure 5. Effect of vitamin D supplementation on 25(OH)D level in venous cord - high versus intermediate dose comparison.
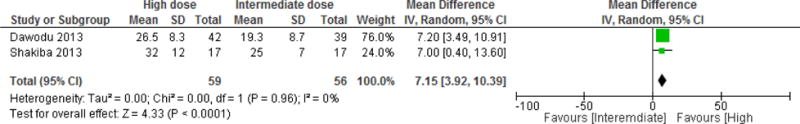
Vitamin D equivalent daily doses were as follows: Dawodu 2013: 4,000 IU/d versus 2,000 IU/d; Shakiba 2013: 1,667 IU/d vs 3,571 IU/d.
3.2. Effect of vitamin D replacement on other outcomes
3.2.1. Children and adolescents
The effect of vitamin D supplementation on PTH level was assessed in children and adolescents. While an intermediate dose (weighted mean dose of 1,870 IU/d), significantly reduced PTH level, compared to placebo, with a MD in PTH level achieved of −7.0 (95% CI −7.4;−6.6) pg/ml, a low dose did not have any effect on PTH levels. The effect of an intermediate dose of vitamin D on serum calcium level was not significant (Table 3A).
Table 3.
Effect of vitamin D supplementation on other skeletal outcomes
| A- Children and adolescents | ||
|---|---|---|
| Intermediate dose (800–2,000 IU/d) versus placebo | ||
| Outcome | Result | Studies included |
| Calcium level (mg/dl) | 0.01 [−0.28, 0.31] | El Hajj Fuleihan [24] (same trial Maalouf 2008 [25]) Ghazi 2010 [27] |
| PTH (pg/ml) | −7.00 [−7.38, −6.62]* | El Hajj Fuleihan [24] (same trial Maalouf 2008 [25]) Ghazi 2010 [27] |
| Low dose (<800 IU/d) versus placebo | ||
|---|---|---|
| Outcome | Result | Studies included |
| PTH (pg/ml) | −8.18 [−22.68, 6.32] | El Hajj Fuleihan [24] (same trial Maalouf 2008 [25]) Neyestani 2013[28] |
| B- Pregnant women | ||
|---|---|---|
| Intermediate (800–2,000 IU/d) versus low dose (< 800 IU/d) | ||
| Outcome | Result | Studies included |
| Calcium level (mg/dl) | 0.06 [−0.06, 0.18] | Dawodu 2013 [30] Soheilykhah 2013 [32] |
| High (>2,000 IU/d) versus intermediate dose (800–2,000 IU/d) | ||
|---|---|---|
| Outcome | Result | Studies included |
| Calcium level (mg/dl) | −0.05 [−0.41, 0.30] | Dawodu 2013 [30] Soheilykhah 2013 [32] |
| High (>2,000 IU/d) versus low dose (<800 IU/d) | ||
|---|---|---|
| Outcome | Result | Studies included |
| Calcium level (mg/dl) | −0.05 [−0.29, −0.19]* | Dawodu 2013 [30] Soheilykhah 2013 [32] Samimi 2015 [35] |
| Insulin level (IU/ml) | −6.66 [−8.65, −4.67]* | Soheilykhah 2013 [32] Karamali 2015 [34] Samimi 2015 [35] |
| HOMA-IR | −1.52 [−1.99, −1.05]* | Soheilykhah 2013 [32] Karamali 2015 [34] Samimi 2015 [35] |
| Fasting Blood Glucose (mg/dl) | −3.04 [−5.79, −0.29]* | Soheilykhah 2013 [32] Karamali 2015 [34] Samimi 2015 [35] |
| Total cholesterol (mg/dl) | −3.26 [−17.38, 10.86] | Karamali 2015 [34] Samimi 2015 [35] |
| Triglycerides (mg/dl) | 8.85 [−13.25, 30.96] | Karamali 2015 [34] Samimi 2015 [35] |
| HDL (mg/dl) | 4.11 [0.38, 7.84]* | Karamali 2015 [34] Samimi 2015 [35] |
| LDL (mg/dl) | −9.62 [−22.13, 2.90] | Karamali 2015 [34] Samimi 2015 [35] |
| hs CRP (mg/dl) | −1350.78 [−2669.18, −32.39]* | Karamali 2015 [34] Samimi 2015 [35] |
| Systolic blood pressure (mmHg) | −1.92 [−4.32, 0.48] | Karamali 2015 [34] Samimi 2015 [35] |
| Diastolic blood pressure (mmHg) | −3.46 [−5.77, −1.15]* | Karamali 2015 [34] Samimi 2015 [35] |
| C- Children and adolescents | ||
|---|---|---|
| Intermediate dose (800–2,000 IU/d) versus placebo | ||
| Outcome | Result | Studies included |
| Calcium level (mg/dl) | 0.01 [–0.28, 0.31] | El Hajj Fuleihan [24] (same trial Maalouf 2008 [25]) Ghazi 2010 [27] |
| PTH (pg/ml) | −7.00 [−7.38, −6.62]* | El Hajj Fuleihan [24] (same trial Maalouf 2008 [25]) Ghazi 2010 [27] |
| Low dose (<800 IU/d) versus placebo | ||
|---|---|---|
| Outcome | Result | Studies included |
| PTH (pg/ml) | −8.18 [−22.68, 6.32] | El Hajj Fuleihan [24] (same trial Maalouf 2008 [25]) Neyestani 2013[28] |
| D- Pregnant women | ||
|---|---|---|
| Intermediate (800–2,000 IU/d) versus low dose (< 800 IU/d) | ||
| Outcome | Result | Studies included |
| Calcium level (mg/dl) | 0.06 [−0.06, 0.18] | Dawodu 2013 [30] Soheilykhah 2013 [32] |
| High (>2,000 IU/d) versus intermediate dose (800–2,000 IU/d) | ||
|---|---|---|
| Outcome | Result | Studies included |
| Calcium level (mg/dl) | −0.05 [−0.41, 0.30] | Dawodu 2013 [30] Soheilykhah 2013 [32] |
| High (>2,000 IU/d) versus low dose (<800 IU/d) | ||
|---|---|---|
| Outcome | Result | Studies included |
| Calcium level (mg/dl) | −0.05 [−0.29, −0.19]* | Dawodu 2013 [30] Soheilykhah 2013 [32] Samimi 2015 [35] |
| Insulin level (IU/ml) | −6.66 [−8.65, −4.67]* | Soheilykhah 2013 [32] Karamali 2015 [34] Samimi 2015 [35] |
| HOMA-IR | −1.52 [−1.99, −1.05]* | Soheilykhah 2013 [32] Karamali 2015 [34] Samimi 2015 [35] |
| Fasting Blood Glucose (mg/dl) | −3.04 [−5.79, −0.29]* | Soheilykhah 2013 [32] Karamali 2015 [34] Samimi 2015 [35] |
| Total cholesterol (mg/dl) | −3.26 [−17.38, 10.86] | Karamali 2015 [34] Samimi 2015 [35] |
| Triglycerides (mg/dl) | 8.85 [−13.25, 30.96] | Karamali 2015 [34] Samimi 2015 [35] |
| HDL (mg/dl) | 4.11 [0.38, 7.84]* | Karamali 2015 [34] Samimi 2015 [35] |
| LDL (mg/dl) | −9.62 [−22.13, 2.90] | Karamali 2015 [34] Samimi 2015 [35] |
| hs CRP (mg/dl) | −1350.78 [−2669.18, −32.39]* | Karamali 2015 [34] Samimi 2015 [35] |
| Systolic blood pressure (mmHg) | −1.92 [−4.32, 0.48] | Karamali 2015 [34] Samimi 2015 [35] |
| Diastolic blood pressure (mmHg) | −3.46 [−5.77, −1.15]* | Karamali 2015 [34] Samimi 2015 [35] |
significant results.
3.2.2. Pregnant women
The effect of vitamin D supplementation on serum calcium level was assessed in trials conducted in pregnant women. The MD in serum calcium level achieved across various comparisons did not reach statistical significance, except in the high versus low dose comparison, whereby the serum calcium level was lower in the high dose group, compared to the low dose by the end of the intervention, with a drop by 0.05 mg/dl (Table 3B).
Three studies, comparing a high versus low vitamin D dose, assessed the effect of supplementation on glycemic indices, and showed a significant decrease in fasting blood glucose (a drop by 3 mg/dl), in HOMA-IR (a drop by 1.5), and in insulin levels (a drop by 6.7 IU/ml), favoring the high dose group [32, 34, 37]. Two studies assessed the effect of a high vitamin D dose compared to a low dose on lipid profile and inflammatory markers (hs-CRP). A high vitamin D dose resulted in a significant increase in HDL level (by 4.1 mg/dl), a significant decrease in hs-CRP (by 1,350.7 ng/ml) and a decrease in diastolic blood pressure (by −3.5 mmHg) (Table 3B).
3.3. Vitamin D dose response
We could not assess the vitamin D dose response, given the small number of studies included in each comparison.
4. Discussion
In children and adolescents, an intermediate vitamin D dose (~1,900 IU daily) increased the weighted mean 25(OH)D level from 15.2 ng/ml to 31.4 ng/ml, an increase equivalent to 0.85 ng/ml per 100 IU/d vitamin D, and brought 74% of the participants to the NAM (IOM) 25(OH)D target of 20 ng/ml. The effect of a low dose of 300 IU/d did not differ significantly from the placebo. However, in the latter comparison, the high quality trial by El Hajj Fuleihan et al. showed that a low dose of 400 IU daily resulted in a significant increment in 25(OH)D level, by 4 ng/ml (increment equivalent to 1 ng/ml per 100 IU/d vitamin D), allowing 42% of children to reach the target level of 20 ng/ml.
Cashman et al pooled the results of 2 RCTs from Finland and Denmark, conducted in adolescent girls with baseline 25(OH)D level of 22.7 ng/ml, and compared the effect of 2 low doses of vitamin D (200 and 400 IU daily), to placebo [39]. The increment in 25(OH)D level paralleled the increment in the vitamin D supplementation dose, and was equivalent to 2.4 ng/ml for every 100 IU/d [39]. Based on his findings, a vitamin D dose around 750 IU/d, that is 25% higher than the NAM (IOM) RDA, is needed to allow to 97.5% of European adolescent girls to reach the target of 20 ng/ml [39]. Interestingly, a study from the US, administering increasing doses of vitamin D 400 IU/d, 1,000 IU/d, 2,000 IU/d and 4,000 IU/d, compared to placebo, to white and black children (baseline 25(OH)D level 26.4–28 ng/ml), demonstrated that, in white children, the 25(OH)D level achieved with low dose was not significantly different from placebo, while in black it was sufficient to prevent a drop in 25(OH)D level during winter [40]. In the same study, a vitamin D dose of 2,000 IU/d allowed an increase in 25(OH)D level by around 15 ng/ml, using a radioimmunoassay [40], an increment that is very close to our results in the intermediate dose versus placebo comparison, where the MD was 15.8 (8.7–22.9) ng/ml. A meta-analysis by McNally et al, compiling results from studies conducted in pediatrics and adolescents, from US, Europe and Asia, showed that a cumulative dose of vitamin D over 30 days increases 25(OH)D by 0.36 ng/ml per 100 IU; age was a negative predictor of 25(OH)D level achieved post supplementation, every 1 year increase in age resulted in a reduction in 25(OH)D by 0.005 ng/ml [41].
The trial by El Hajj Fuleihan was the only one to assess the effect of vitamin D supplementation on musculo-skeletal parameters in children and adolescents [24, 25]. While supplementation in boys did not yield any significant effect [42], low and high vitamin D doses resulted in a significant improvement in lean mass and total hip bone mineral content (BMC) in girls [24]; interestingly, this effect persisted after 1 year of discontinuation of trial supplementation [43]. Bone specific alkaline phosphatase (BAP) was assessed in 2 studies in children and adolescents [27, 28], falling into 2 different comparisons. Therefore, we were not able to pool their results. Both studies showed a trend toward an increase in BAP by the end of the intervention [27, 28]. Similar changes were reported in the osteocalcin level [27, 28]. El Hajj Fuleihan assessed alkaline phosphatase and showed a decrease in the level by the end of the intervention (a decrease by 17–24% in girls, and 10–11.7% in boys, but not-significantly different from placebo) [24, 25]. Ghazi et al evaluated the changes in bone resorptive markers [C-Telopeptide (CTX)] and found a variable change in CTX level in response to vitamin D supplementation [27]. We did not identify any trial evaluating the effect of vitamin D supplementation on adiposity, insulin resistance or any other metabolic parameters in the pediatric age category.
In pregnant women, the weighted mean 25(OH)D level increased from 7.9 ng/ml (at baseline) to 26.5 ng/ml with an intermediate vitamin D dose (~1,800 IU/d); an increase equivalent to 1 ng/ml per 100 IU/d vitamin D. Starting at a similar baseline level, the increase was equivalent to 1–3.4 ng/ml per 100 IU/d vitamin D with a low dose and 0.5–0.7 ng/ml per 100 IU vitamin D with a high dose. The proportions of pregnant women reaching the target of 20 ng/ml were 27–43%, 73%, and 80–90% in the low, intermediate and high dose groups, respectively. A recently completed double blind RCT form UK enrolling pregnant women early in their second trimester, with a baseline 25(OH)D level of 18 ng/ml, showed that a vitamin D dose of 1,000 IU daily increased 25(OH)D level to 27 ng/ml at 34 weeks of gestation, implying an increase of around 0.9 ng/ml per 100 IU vitamin D [44]. Another RCT conducted on American pregnant women, with baseline 25(OH)D level of 23–24 ng/ml, comparing 3 doses of vitamin D (400, 2,000 and 4,000 IU/d), showed that, after 6 months of intervention, 25(OH)D levels at delivery were 31.6 (14.6), 39.4 (13.7), 44.5 (16.2) ng/ml, in the low, intermediate and high dose, respectively [45]. The estimated proportion of women reaching the target level of 20 ng/ml were 78%, 92%, 93%, in the aforementioned doses, respectively. In another three-arm study (600, 1,200 and 2,000 IU/d) from Turkey, starting at a lower baseline 25(OH)D of 9.9–11 ng/ml, the highest dose allowed for 80% of pregnant women to reach the target level of 20 ng/ml, while the other doses allowed less than 50% of the participants to do so [46]. All these findings from Western and Non-Western populations show that the increments in 25(OH)D level following supplementation seem comparable, and at least an intermediate dose of 1,000–2,000 IU daily is needed to allow to the majority of pregnant women to reach the desirable NAM (IOM) 25(OH)D level. In fact, even in Western countries, a low dose of vitamin D did not allow for the majority of pregnant women to reach the NAM (IOM) desirable level [45]. Therefore, an intermediate dose of 1,000–2,000 IU daily is required to allow for the majority of the population to become vitamin D replete.
A recent meta-analysis of 13 RCTs conducted during pregnancy (from Iran, UK, US, France, India, Pakistan and Bangladesh; literature search until 2014) showed that vitamin D supplementation, compared to no supplementation, increases 25(OH)D level by 26.6 (26.5–26.7) ng/ml, with high heterogeneity (I2 100%), using a fixed effect model. The equivalent daily vitamin D (D2 or D3) doses administered in the included studies varied between 400 and 7,140 IU [47]. Noteworthy that in this meta-analysis, the participants of some placebo arms included were on vitamin D supplementation, administered outside the study intervention [47]. Another recent Cochrane systematic review of RCTs (from Bangladesh, Brazil, China, France, India, Iran, UK and US; literature search until 2015), using a random-effects model, showed that vitamin D supplementation (dose range 200–2,000 IU/d, or a single loading dose in few trials) compared to placebo resulted in a significant increase in the 25(OH)D level with a MD of 22 ng/ml [48]. Unfortunately, we could not compare these findings to ours, since our comparisons in pregnant women did not include a placebo arm.
In the MENA region, data on the effect of vitamin D supplementation on other neonatal and maternal skeletal outcomes are scarce. There is no fracture data, and one study only assessed the effect of vitamin D supplementation on maternal and neonatal bone density and did not detect any significant difference between the high and the low dose groups [37, 49]. Similarly, there was no significant effect of a high vitamin D on neonatal and infant anthropometric measures [30, 35, 49]. These findings replicate the results of a large randomized controlled trial in UK, comparing a daily vitamin D dose of 1,000 IU to placebo [44]. None of the studies conducted in pregnant women reported on changes in bone markers.
Four trials assessed the effect of vitamin D replacement during pregnancy on metabolic outcomes. A high vitamin D dose compared to a low dose resulted in a significant reduction in glycemic and inflammatory indices (Table 2).
Our results show that the vitamin D doses needed to reach desirable levels in the MENA region seem higher compared to the doses recommended by the NAM (IOM) for Northern America and Canada [3, 16, 50]. The prevalence of hypovitaminosis D is the highest in the MENA, compared to other Western countries [1, 51]. Several specific risk factors for hypovitaminosis D have been described in our region, including low intake of vitamin D fortified food, veiling, low socio-economic status, genetic polymorphism of metabolizing enzymes, implying lower baseline vitamin D status and potentially higher vitamin D requirements. Whether genetic and environmental factors affect the response to vitamin D supplementation still needs to be confirmed.
Strengths and limitations
This is the first systematic review of vitamin D RCTs in children, adolescents and pregnant women, conducted in the MENA region, based on an extensive search in 7 databases. It identifies the available evidence and describes knowledge gaps revolving around this topic.
Our review suffers from several limitations, in large part due to the nature of the studies and the data available. There was a limited number of studies identified in the pediatric group. We identified a single study in infants and 4 studies in children and adolescents. Findings in children and adolescents showed high heterogeneity, related to variability in several factors, including age, duration of supplementation, vitamin D assays used, to name few. The majority of included studies in all categories were conducted in Iran (2/4 in children and adolescents; 9/10 in pregnant women), and therefore, the derived results are not generalizable to other MENA countries. The effect of vitamin D supplementation on skeletal and extra-skeletal outcomes was poorly assessed, and when done, only surrogate outcomes were evaluated. In pregnant women, findings on the metabolic effects of vitamin D supplementation were derived from 3 studies, 2 of them were conducted by the same research group, with a very similar profile of the enrolled participants. There was a large variability in the vitamin D assays used, and this could have significantly affected the results. Data on the safety of high doses in the pediatric population are still lacking, since none of the studies identified used a high dose. In pregnancy, although all the included studies administered a high dose, reporting of adverse events was inconsistent, and available only in half of them.
5. Conclusion
In children, adolescents and pregnant women from the MENA, an intermediate vitamin D dose of 1,000–2,000 IU daily seems necessary to allow for the majority of the population to reach the desirable 25(OH)D level of 20 ng/ml, as recommended by the NAM (IOM). Data on the skeletal and extra-skeletal outcomes and on the long term safety of high vitamin D doses in our region are scarce. Further high quality RCTs are required to confirm/refute the beneficial impact of vitamin D supplementation on various outcomes.
Supplementary Material
Highlights.
1,000–2,000 IU/d of vitamin D seem necessary for pregnant women to reach desirable levels.
Similar findings are demonstrated in children and adolescents.
Data on the other skeletal and extra-skeletal outcomes of vitamin D are scarce.
Acknowledgments
The authors would like to thank Miss Aida Farha, Medical Information Specialist, Saab Medical Library at the American University of Beirut - Lebanon, for her advice and assistance in designing comprehensive and complex searches of the various medical literature resources and for the provision of select articles. The authors would like to thank experts in the field, involved in the development of international vitamin D guidelines, Professors Paul Lips, Michael Holick and Roger Bouillon, for input on trials that could be relevant to our review and that may not have been caught by our search.
The authors would like to thank the corresponding authors of several RCTs, Drs Adekunle Dawodu, Mehrdad Shakiba, for sharing with us additional information on their trials, and Dr Azemi Zatollah for answering our queries.
The authors would like to thank Miss Lara Kahale for providing the risk of bias assessment on the trial by El Hajj Fuleihan et al.
Funding
This work was supported by a grant from the Medical Resource Plan at the American University of Beirut - Lebanon and made possible thanks to the support from the National Council for Scientific Research (CNRS). Research reported in this publication was supported in part by the Fogarty International Center and Office of Dietary Supplements of the National Institutes of Health under Award Number D43 TW009118. The content is solely the responsibility of the authors and does not necessarily represent the official views of the National Institutes of Health.
Footnotes
Publisher's Disclaimer: This is a PDF file of an unedited manuscript that has been accepted for publication. As a service to our customers we are providing this early version of the manuscript. The manuscript will undergo copyediting, typesetting, and review of the resulting proof before it is published in its final citable form. Please note that during the production process errors may be discovered which could affect the content, and all legal disclaimers that apply to the journal pertain.
Authors’ contribution
GEHF, MC and EA designed the research; MC, SEG and KS screened title and abstract, full texts, and abstracted data; MC and ZM performed statistical analysis; GEHF, EA, AA, ZM and RH provided input on statistical methods and analysis; MC wrote the paper, GEHF provided major input on the paper; GEHF and MC had the primary responsibility of the final content of the manuscript; HH translated articles from Persian to English. All authors read and approved the final manuscript.
Declaration of interest
The authors declare no conflict of interest.
References
- 1.Hilger J, Friedel A, Herr R, Rausch T, Roos F, Wahl DA, et al. A systematic review of vitamin D status in populations worldwide. Br J Nutr. 2014;111(01):23–45. doi: 10.1017/S0007114513001840. [DOI] [PubMed] [Google Scholar]
- 2.Bassil D, Rahme M, Hoteit M, El Hajj Fuleihan G. Hypovitaminosis D in the Middle East and North Africa: Prevalence, risk factors and impact on outcomes. Dermatoendocrinol. 2013;5(2):274–98. doi: 10.4161/derm.25111. [DOI] [PMC free article] [PubMed] [Google Scholar]
- 3.IOM (Institute of Medicine) Dietary Reference Intakes for Calcium and Vitamin D. Washington, DC: The National Academies Press; 2011. [PubMed] [Google Scholar]
- 4.Palermo NE, Holick MF. Vitamin D, bone health, and other health benefits in pediatric patients. J Pediatr Rehabil Med. 2014;7(2) doi: 10.3233/PRM-140287. [DOI] [PubMed] [Google Scholar]
- 5.Nassar N, Halligan GH, Roberts CL, Morris JM, Ashton AW. Systematic review of first-trimester vitamin D normative levels and outcomes of pregnancy. Am J Obstet Gynecol. 2011;205(3):208e1–e7. doi: 10.1016/j.ajog.2011.03.058. [DOI] [PubMed] [Google Scholar]
- 6.Saraf R, Morton S, Camargo CA, Grant CC. Global summary of maternal and newborn vitamin D status–a systematic review. Matern Child Nutr. 2016;12(4):647–68. doi: 10.1111/mcn.12210. [DOI] [PMC free article] [PubMed] [Google Scholar]
- 7.Bickle B. Vitamin D and bone. Curr Osteoporos Rep. 2012;10(2):151–9. doi: 10.1007/s11914-012-0098-z. [DOI] [PMC free article] [PubMed] [Google Scholar]
- 8.Holick MF. Vitamin D deficiency. N Engl J Med. 2007;357(3):266–81. doi: 10.1056/NEJMra070553. [DOI] [PubMed] [Google Scholar]
- 9.Holick MF. Vitamin D: a D-Lightful health perspective. Nutr Rev. 2008;66(suppl 2):S182–S94. doi: 10.1111/j.1753-4887.2008.00104.x. [DOI] [PubMed] [Google Scholar]
- 10.Hollis BW, Wagner CL. Vitamin D and pregnancy: skeletal effects, nonskeletal effects, and birth outcomes. Calcif Tissue Int. 2013;92(2):128–39. doi: 10.1007/s00223-012-9607-4. [DOI] [PubMed] [Google Scholar]
- 11.Karras SN, Anagnostis P, Bili E, Naughton D, Petroczi A, Papadopoulou F, et al. Maternal vitamin D status in pregnancy and offspring bone development: the unmet needs of vitamin D era. Osteoporos Int. 2014;25(3):795–805. doi: 10.1007/s00198-013-2468-5. [DOI] [PubMed] [Google Scholar]
- 12.Martin R, Harvey N, Crozier S, Poole J, Javaid M, Dennison E, et al. Placental calcium transporter (PMCA3) gene expression predicts intrauterine bone mineral accrual. Bone. 2007;40(5):1203–8. doi: 10.1016/j.bone.2006.12.060. [DOI] [PubMed] [Google Scholar]
- 13.Harvey NC, Moon RJ, Sayer AA, Ntani G, Davies JH, Javaid MK, et al. Maternal antenatal vitamin D status and offspring muscle development: findings from the Southampton Women’s Survey. J Clin Endocrinol Metab. 2013;99(1):330–7. doi: 10.1210/jc.2013-3241. [DOI] [PMC free article] [PubMed] [Google Scholar]
- 14.Wei S-Q, Qi H-P, Luo Z-C, Fraser WD. Maternal vitamin D status and adverse pregnancy outcomes: a systematic review and meta-analysis. J Matern Fetal Neonatal Med. 2013;26(9):889–99. doi: 10.3109/14767058.2013.765849. [DOI] [PubMed] [Google Scholar]
- 15.Javaid M, Crozier S, Harvey N, Gale C, Dennison E, Boucher B, et al. Maternal vitamin D status during pregnancy and childhood bone mass at age 9 years: a longitudinal study. Lancet. 2006;367(9504):36–43. doi: 10.1016/S0140-6736(06)67922-1. [DOI] [PubMed] [Google Scholar]
- 16.Holick MF, Binkley NC, Bischoff-Ferrari HA, Gordon CM, Hanley DA, Heaney RP, et al. Evaluation, treatment, and prevention of vitamin D deficiency: an Endocrine Society clinical practice guideline. J Clin Endocrinol Metab. 2011;96(7):1911–30. doi: 10.1210/jc.2011-0385. [DOI] [PubMed] [Google Scholar]
- 17.WHO Guideline Vitamin D supplementation in Pregnant Women. available from: http://www.who.int/nutrition/publications/micronutrients/guidelines/vit_d_supp_pregnant_women/en/ (accessed in December 2016)
- 18.Effects of different doses of Vitamin D replacement in Middle Eastern and North African population: a systematic review and meta-analysis - Protocol. available from: http://www.crd.york.ac.uk/PROSPERO/display_record.asp?ID=CRD42014010488 (accessed in December 2016)
- 19.World Band definition of Middle East and North Africa countries. available from: http://data.worldbank.org/about/country-and-lending-groups (accessed in December 2016)
- 20.Chakhtoura M, Ghandour S, Shawwa K, Akl E, Arabi A, Mahfoud Z, Habib R, Hoballah H, El-Hajj Fuleihan G. Impact of Vitamin D Replacement in Adults and Elderly in the Middle East and North Africa: A Systematic Review and Meta-analysis of Randomized Controlled Trials. Osteoporos Int. 2016 Nov 22; doi: 10.1007/s00198-016-3837-7. [Epub ahead of print] [DOI] [PubMed] [Google Scholar]
- 21.Green S. Cochrane handbook for systematic reviews of interventions version 5.1.0 [updated March 2011] The Cochrane Collaboration; 2011. available from http://handbook.cochrane.org/ (accessed in December 2016) [Google Scholar]
- 22.Online Confidence Interval Calculator. available from: https://www.mccallumlayton.co.uk/tools/statistic-calculators/confidence-interval-for-proportions-calculator/ (accessed in December 2016)
- 23.Samadpour K, Long K, Hayatbakhsh R, Marks G. Randomised comparison of the effects of Sprinkles and Foodlets with the currently recommended supplement (Drops) on micronutrient status and growth in Iranian children. Eur J Clin Nutr. 2011;65(12):1287–94. doi: 10.1038/ejcn.2011.124. [DOI] [PubMed] [Google Scholar]
- 24.El-Hajj Fuleihan G, Nabulsi M, Tamim H, Maalouf J, Salamoun M, Khalife H, et al. Effect of vitamin D replacement on musculoskeletal parameters in school children: a randomized controlled trial. J Clin Endocrinol Metab. 2006;91(2):405–12. doi: 10.1210/jc.2005-1436. [DOI] [PubMed] [Google Scholar]
- 25.Maalouf J, Nabulsi M, Vieth R, Kimball S, El-Rassi R, Mahfoud Z, et al. Short-and long-term safety of weekly high-dose vitamin D3 supplementation in school children. J Clin Endocrinol Metab. 2008;93(7):2693–701. doi: 10.1210/jc.2007-2530. [DOI] [PMC free article] [PubMed] [Google Scholar]
- 26.Mayan I, Somech R, Lev A, Cohen AH, Constantini NW, Dubnov-Raz G. Thymus Activity, Vitamin D, and Respiratory Infections in Adolescent Swimmers. IMAJ. 2015;17(9):571–5. [PubMed] [Google Scholar]
- 27.Ghazi A, Hosseinpanah F, Ardakani EM, Ghazi S, Hedayati M, Azizi F. Effects of different doses of oral cholecalciferol on serum 25 (OH) D, PTH, calcium and bone markers during fall and winter in schoolchildren. Eur J Clin Nutr. 2010;64(12):1415–22. doi: 10.1038/ejcn.2010.169. [DOI] [PubMed] [Google Scholar]
- 28.Neyestani T, Hajifaraji M, Omidvar N, Nikooyeh B, Eshraghian M, Shariatzadeh N, et al. Calcium-vitamin D-fortified milk is as effective on circulating bone biomarkers as fortified juice and supplement but has less acceptance: a randomised controlled school-based trial. J Hum Nutr Diet. 2014;27(6):606–16. doi: 10.1111/jhn.12191. [DOI] [PubMed] [Google Scholar]
- 29.Sabet Z, Ghazi A, Tohidi M, Oladi B. Vitamin D supplementation in pregnant Iranian women: effects on maternal and neonatal vitamin D and parathyroid hormone status. Acta Endocrinol. 2012;8(1):59–66. [Google Scholar]
- 30.Dawodu A, Saadi HF, Bekdache G, Javed Y, Altaye M, Hollis BW. Randomized controlled trial (RCT) of vitamin D supplementation in pregnancy in a population with endemic vitamin D deficiency. J Clin Endocrinol Metab. 2013;98(6):2337–46. doi: 10.1210/jc.2013-1154. [DOI] [PubMed] [Google Scholar]
- 31.Shakiba M, Iranmanesh MR. Vitamin D requirement in pregnancy to prevent deficiency in neonates: a randomised trial. Singapore Med J. 2013;54(5):285–8. doi: 10.11622/smedj.2013110. [DOI] [PubMed] [Google Scholar]
- 32.Soheilykhah S, Mojibian M, Moghadam MJ, Shojaoddiny-Ardekani A. The effect of different doses of vitamin D supplementation on insulin resistance during pregnancy. Gynecol Endocrinol. 2013;29(4):396–9. doi: 10.3109/09513590.2012.752456. [DOI] [PubMed] [Google Scholar]
- 33.Etemadifar M, Janghorbani M. Efficacy of high-dose vitamin D3 supplementation in vitamin D deficient pregnant women with multiple sclerosis: preliminary findings of a randomized-controlled trial. Iran J Neurol. 2015;14(2):67. [PMC free article] [PubMed] [Google Scholar]
- 34.Karamali M, Beihaghi E, Mohammadi A, Asemi Z. Effects of High-Dose Vitamin D Supplementation on Metabolic Status and Pregnancy Outcomes in Pregnant Women at Risk for Pre-Eclampsia. Horm Metab Res. 2015;47(12):867–72. doi: 10.1055/s-0035-1548835. [DOI] [PubMed] [Google Scholar]
- 35.Samimi M, Kashi M, Foroozanfard F, Karamali M, Bahmani F, Asemi Z, et al. The effects of vitamin D plus calcium supplementation on metabolic profiles, biomarkers of inflammation, oxidative stress and pregnancy outcomes in pregnant women at risk for pre-eclampsia. J Hum Nutr Diet. 2016;29(4):505–15. doi: 10.1111/jhn.12339. [DOI] [PubMed] [Google Scholar]
- 36.Shahgheibi S, Farhadifar F, Pouya B. The effect of vitamin D supplementation on gestational diabetes in high-risk women: Results from a randomized placebo-controlled trial. J Res Med Sci. 2016;21(1):2. doi: 10.4103/1735-1995.175148. [DOI] [PMC free article] [PubMed] [Google Scholar]
- 37.Vaziri F, Nasiri S, Tavana Z, Dabbaghmanesh MH, Sharif F, Jafari P. A randomized controlled trial of vitamin D supplementation on perinatal depression: in Iranian pregnant mothers. BMC Pregnancy and Childbirth. 2016;16(1):239. doi: 10.1186/s12884-016-1024-7. [DOI] [PMC free article] [PubMed] [Google Scholar]
- 38.Samimi M, Foroozanfard F, Amini F, Sehat M. Effect of Vitamin D Supplementation on Unexplained Recurrent Spontaneous Abortion: A Double-Blind Randomized Controlled Trial. Glob J Health Sci. 2016;9(3):95. [Google Scholar]
- 39.Cashman KD, FitzGerald AP, Viljakainen HT, Jakobsen J, Michaelsen KF, Lamberg-Allardt C, et al. Estimation of the dietary requirement for vitamin D in healthy adolescent white girls. Am J Clin Nutr. 2011;93(3):549–55. doi: 10.3945/ajcn.110.006577. [DOI] [PubMed] [Google Scholar]
- 40.Lewis R, Laing E, Hill Gallant K, Hall D, McCabe G, Hausman D, et al. A randomized trial of vitamin D3 supplementation in children: dose-response effects on vitamin D metabolites and calcium absorption. J Clin Endocrinol Metab. 2013;98(12):4816–25. doi: 10.1210/jc.2013-2728. [DOI] [PMC free article] [PubMed] [Google Scholar]
- 41.McNally JD, Iliriani K, Pojsupap S, Sampson M, O’Hearn K, McIntyre L, et al. Rapid normalization of vitamin D levels: a meta-analysis. Pediatrics. 2015;135(1):e152–e66. doi: 10.1542/peds.2014-1703. [DOI] [PubMed] [Google Scholar]
- 42.Winzenberg T, Powell S, Shaw KA, Jones G. Effects of vitamin D supplementation on bone density in healthy children: systematic review and meta-analysis. BMJ. 2011;342:c7254. doi: 10.1136/bmj.c7254. [DOI] [PMC free article] [PubMed] [Google Scholar]
- 43.Ghazal N, Al-Shaar L, Maalouf J, Nabulsi M, Arabi A, Choucair M, et al. Persistent Effect of Vitamin D Supplementation on Musculoskeletal Parameters in Adolescents One Year After Trial Completion. J Bone Miner Res. 2016;31(7):1473–80. doi: 10.1002/jbmr.2802. [DOI] [PubMed] [Google Scholar]
- 44.Cooper C, Harvey NC, Bishop NJ, Kennedy S, Papageorghiou AT, Schoenmakers I, et al. Maternal gestational vitamin D supplementation and offspring bone health (MAVIDOS): a multicentre, double-blind, randomised placebo-controlled trial. Lancet Diabetes Endocrinol. 2016;4(5):393–402. doi: 10.1016/S2213-8587(16)00044-9. [DOI] [PMC free article] [PubMed] [Google Scholar]
- 45.Hollis BW, Johnson D, Hulsey TC, Ebeling M, Wagner CL. Vitamin D supplementation during pregnancy: Double-blind, randomized clinical trial of safety and effectiveness. J Bone Miner Res. 2011;26(10):2341–57. doi: 10.1002/jbmr.463. [DOI] [PMC free article] [PubMed] [Google Scholar]
- 46.Yesiltepe Mutlu G, Ozsu E, Kalaca S, Yuksel A, Pehlevan Y, Cizmecioglu F, et al. Evaluation of vitamin D supplementation doses during pregnancy in a population at high risk for deficiency. Horm Res Paediatr. 2014;81(6):402–8. doi: 10.1159/000358833. [DOI] [PubMed] [Google Scholar]
- 47.Pérez-López FR, Pasupuleti V, Mezones-Holguin E, Benites-Zapata VA, Thota P, Deshpande A, et al. Effect of vitamin D supplementation during pregnancy on maternal and neonatal outcomes: a systematic review and meta-analysis of randomized controlled trials. Fertil Steril. 2015;103(5):1278–88.e4. doi: 10.1016/j.fertnstert.2015.02.019. [DOI] [PubMed] [Google Scholar]
- 48.De-Regil LM, Palacios C, Lombardo LK, Peña-Rosas JP. Vitamin D supplementation for women during pregnancy. Cochrane Database Syst Rev. 2016;(1):CD00887349. doi: 10.1002/14651858.CD008873.pub3. [DOI] [PubMed] [Google Scholar]
- 49.Vaziri F, Dabbaghmanesh MH, Samsami A, Nasiri S, Shirazi PT. Vitamin D supplementation during pregnancy on infant anthropometric measurements and bone mass of mother-infant pairs: A randomized placebo clinical trial. Early Hum Dev. 2016;103:61–8. doi: 10.1016/j.earlhumdev.2016.07.011. [DOI] [PubMed] [Google Scholar]
- 50.Wagner CL, Greer FR. Prevention of rickets and vitamin D deficiency in infants, children, and adolescents. Pediatrics. 2008;122(5):1142–52. doi: 10.1542/peds.2008-1862. [DOI] [PubMed] [Google Scholar]
- 51.Mithal A, Wahl D, Bonjour J-P, Burckhardt P, Dawson-Hughes B, Eisman J, et al. Global vitamin D status and determinants of hypovitaminosis D. Osteoporos Int. 2009;20(11):1807–20. doi: 10.1007/s00198-009-0954-6. [DOI] [PubMed] [Google Scholar]
Associated Data
This section collects any data citations, data availability statements, or supplementary materials included in this article.