

Abstract
BACKGROUND
[18F]fluorocholine PET/CT can detect hepatocellular carcinoma (HCC) based on imaging the initial steps of phosphatidylcholine synthesis. To relate the diagnostic performance of [18F]fluorocholine PET/CT to the phospholipid composition of liver tumors, radiopathologic correspondence was performed in patients with early-stage liver cancer who had undergone [18F]fluorocholine PET/CT before tumor resection.
METHODS
Tumor and adjacent liver were profiled by liquid chromatography mass spectrometry, quantifying phosphatidylcholine species by mass-to-charge ratio. For clinical-radiopathologic correlation, HCC profiles were reduced to two orthogonal principal component factors (PCF1 and PCF2) accounting for 80% of total profile variation.
RESULTS
Tissues from 31 HCC patients and 4 intrahepatic cholangiocarcinoma (ICC) patients were analyzed, revealing significantly higher levels of phosphocholine, CDP-choline, and highly-saturated phosphatidylcholine species in HCC tumors relative to adjacent liver and ICC tumors. Significant loading values for PCF1 corresponded to phosphatidylcholines containing poly-unsaturated fatty acids while PCF2 corresponded only to highly-saturated phosphatidylcholines. Only PCF2 correlated significantly with HCC tumor-to-liver [18F]fluorocholine uptake ratio (ρ = 0.59, p < 0.0005). Sensitivity for all tumors based on an abnormal [18F]fluorocholine uptake ratio was 93%, while sensitivity for HCC based on increased tumor [18F]fluorocholine uptake was 84%, with lower levels of highly-saturated phosphatidylcholines in tumors showing low [18F]fluorocholine uptake.
CONCLUSION
Most HCC tumors contain high levels of saturated phosphatidylcholines, supporting their dependence on de-novo fatty acid metabolism for phospholipid membrane synthesis. While [18F]fluorocholine PET/CT can serve to identify these lipogenic tumors, its imperfect diagnostic sensitivity implies metabolic heterogeneity across HCC and a weaker lipogenic phenotype in some tumors.
Keywords: fluorocholine, positron emission tomography, hepatocellular carcinoma, phosphatidylcholine, fatty acids
INTRODUCTION
Liver cancer is the 3rd leading cause of cancer death worldwide and is expected to surpass breast, prostate, and colorectal cancer to become the 3rd leading cause of cancer death in the United States by 2030 (1). Surgery is the most effective treatment for early-stage liver cancer but accurate tumor characterization and staging is necessary to select appropriate surgical candidates. To this end, imaging techniques such as ultrasound, X-ray computed tomography (CT), and magnetic resonance imaging have assumed important roles in evaluating possible liver cancer (2). There is also growing interest in molecular imaging of the liver, since techniques such as positron emission tomography (PET) can potentially detect molecular biological changes antecedent to tumor growth and invasion. However, imaging with 2-deoxy-2-[18F] fluoro-D-glucose (FDG), the predominant oncologic PET tracer, may not be well-suited for liver cancer, since its diagnostic sensitivity for hepatocellular carcinoma (HCC), the most common primary liver cancer, has been estimated in the range of 50%–60% (3).
Liver tissues have an enormous proliferative capacity due in part to an ability to synthesize large quantities of phosphatidylcholine (PtC), the most abundant membrane phospholipid (4). Some of this capacity is likely preserved in liver cancer to support tumor cell proliferation (5). Hepatocytes also utilize PtC to produce lipid particles and bile solvents, and liver dysfunction is known to involve significant changes in phospholipid metabolism (4, 6). Thus, phospholipids such as PtC might be able to serve as chemical biomarkers for a variety of liver diseases including liver cancer (6).
PtC is composed of two fatty acids and one phosphocholine moiety bound to a glycerol backbone. Molecular species of PtC vary by the length and degree of saturation of their fatty acyl components, resulting in broad functional variations (7, 8). Higher levels of PtC species containing saturated fatty acyl groups have been found in many cancers (9), and are associated with biological aggressiveness in breast and thyroid cancer (10, 11). There are several potential mechanisms to explain how phospholipids may influence tumor biology. First, fatty acyl group saturation may directly influence phospholipid membrane fluidity, potentially protecting tumors from exogenous insults while facilitating malignant invasion (11, 12). Second, phospholipid composition can also affect membrane protein distribution, and thus modulate intracellular transport and cell signaling (8). And third, saturated fatty acids are less susceptible to peroxidation, potentially rendering tumors more resilient to oxidative stress (12). Thus, a non-invasive means to characterize tumor phospholipids may have diagnostic, prognostic, and possibly therapeutic predictive value in cancer.
Results from a recent single-institution trial indicate that PET/CT using [18F] fluoromethyl-dimethyl-2-hydroxyethylammonium ([18F]fluorocholine) is more sensitive than FDG PET/CT for detecting HCC (13). As a synthetic tracer, [18F]fluorocholine behaves as a substrate for choline kinase (CK) (14), enabling PET to image the initial steps of choline metabolism leading to PtC synthesis. While variability in tumor [18F]fluorocholine uptake has been associated to some extent with histopathologic features of liver tumors (13, 15), the association between tumor phospholipid composition and [18F]fluorocholine uptake has not yet been extensively investigated. In the present study, a targeted metabolomics approach was used to profile the phospholipids of resected tumor specimens imaged pre-operatively with [18F]fluorocholine PET/CT to investigate the relationship between [18F]fluorocholine uptake and phospholipid composition in liver cancer.
METHODS
Patients
Patients undergoing partial hepatectomy for liver cancer were prospectively enrolled to this single-institution study. All patients gave written informed consent under an institutional review board approved clinical research protocol. De-identified data obtained from medical records included cancer-specific variables such as tumor size and serum alpha-fetoprotein level.
Fluorine-18 Fluorocholine Synthesis and PET/CT Imaging
[18F]fluorocholine was synthesized by fluorinating ditosylmethane with fluorine-18 and alkylating the fluorotosylmethane intermediate with dimethylethanolamine in a chemical process control unit (CTI/Siemens CPCU, CTI/Siemens, Knoxville, TN) (16). All radiopharmaceuticals passed standard assays for purity, radionuclidic identity, and non-pyrogenicity before injection, with radiochemical purity exceeding 99%.
PET/CT images were obtained using a Philips Gemini TF-64 PET/CT (Philips Healthcare, Andover, MA). For attenuation correction, a CT transmission scan of the abdomen was performed in the supine position. The 64-channel helical CT scanning parameters were: 120 kV, 50 mA/slice, rotation time 0.75 seconds, slice thickness/interval 5.0mm. No iodinated intravenous contrast was used for CT. Afterwards, dynamic PET was performed over 30 minutes in 31 dynamic-imaging frames upon injection of 2.2 to 3.0 MBq/kg of [18F]fluorocholine through a peripheral vein. Static scans of the torso were subsequently acquired at 2-minutes per bed position. Image reconstruction, corrected for radioactive decay, dead-time, random coincidences, scatter, and non-uniform attenuation, produced 144×144×45 PET image matrices with a voxel size of 4 mm × 4 mm × 4 mm. A 3-dimensional Gaussian kernel at 6 mm full width at half maximum was used to smooth individual dynamic frames.
Image Analysis
PET/CT images were reviewed on a multimodality workstation (Hermes Hybrid, Hermes Medical Solutions, Stockholm, Sweden) alongside available CT and MRI examinations. After tumor areas were identified, a region of interest (ROI) was drawn on PET images over the most active tumor region. The maximum standardized uptake value (SUVmax) of each tumor ROI, defined as maximum ROI radioactivity divided by injected radioactivity normalized to body weight, was obtained. Tumor to adjacent liver ratio (TLRSUV) was also calculated by dividing tumor maximum SUV by the average SUV of a 2 cm ROI placed in liver parenchyma adjacent to the tumor, with a TLRSUV > 1.2 defined as [18F]fluorocholine-avid.
Dynamic PET data was analyzed using PKIN 3.6 (PMOD Technologies, Zurich, Switzerland), applying a 2-tissue compartment model to characterize the tissue kinetics of [18F]fluorocholine (17). Because of the rapid blood clearance of [18F]fluorocholine, an image-derived input function was used in lieu of direct arterial blood sampling by placing an 8 mm diameter ROI over the descending aorta and fitting the ROI time-activity curve (TAC) with a three-exponential decay function (18, 19). Tumor and liver TAC data were generated using the ROIs defined for static measurements. The following rate constants were analyzed: K1 and k2, representing transport into and out of cells, respectively; k3 and k4, representing intracellular phosphorylation and dephosphorylation of [18F]fluorocholine, respectively.
Tissue Sampling
Tissue samples were collected immediately after surgical procurement of the tumor-bearing hepatic segment, avoiding areas of necrosis and hemorrhage. A section from each sample was placed in liquid nitrogen and transported in a cryogenic dewar to a central biorepository for storage at −196° Celsius. There were no thaw-freeze cycles prior to chemical extraction. Sections from each sample were also placed in formalin for histopathology and liver tissue grading.
Chemical Extraction
Tissue extracts were partitioned between an aqueous and chloroform phase using previously published methods (20, 21). Briefly, tissue was freeze-dried and homogenized with a mortar and pestle, combined with isotopically labeled internal standards (~10uL of a 10000 ng/mL solution), and triple extracted with 400 μL MeOH/CHCl3 (2:1) containing 1 μg/mL butylated hydroxytoluene. The extracts combined with the solids were stored at −20° Celsius over night. After vortexing and centrifugation, the liquid phase was separated, and the residue was vortexed with 500 μL MeOH/CHCl3/H2O (2:1:0.8) and centrifuged. The supernatant was combined with the liquid phase for analysis of lipophilic PtC metabolites.
Phospholipid Profiling
Tissues were analyzed using liquid chromatography-mass spectrometry (LCMS) by injecting 10 μL of tissue extract via a PAL autosampler onto a Luna HILIC column (150mm × 3mm; 3 μm; Phenomenex) containing a pre-column filter (0.2 μm; Thermo). A linear gradient elution was performed using MeCN (solvent A) and 40mM aqueous ammonium acetate at pH 3.5 (solvent B) at 0.5 mL/minute as follows: 0–10 minutes from 5% to 30% B, then hold at 30% B for 16 minutes before equilibrating with 5% B for 7 minutes. A hybrid quadrupole-orbitrap mass spectrometer (Q-Exactive 2.3; Thermo Scientific, Waltham, MA) was used for quantitation after electrospray ionization in negative and positive mode with spray voltage 5 kv, capillary transfer temperature 320°C, heater temperature 45°C, sheath gas flow rate 40 units, auxiliary gas 5 units, in-source CID 0 eV, scan range 75–1125, AGC target 3e6, maximum injection time 200 milliseconds, resolution 70,000, and microscan 1.
Quantitation using Xcalibur™ software v3.0.63 (Thermo Scientific, Waltham, MA) was within 5 ppm of calculated exact mass. Intra-day CV for QC samples ranged from 1–16% and spiking recovery ranged from 79–94%. Molecular species of PtC were quantified in area units per mg fresh tissue at the following mass to charge ratios (m/z): 732.5537, 734.5667, 758.5677, 760.5814, 780.5573, 782.5692, 784.5815, 786.6014, 788.6106, 806.5683, 808.5808, 810.5967, 812.6067, 832.5772, 834.5969, and 836.6099 (21). Classes of phospholipids were quantified in ng/mg of tissue using authentic standards. Tissue levels of phosphocholine, glycerophosphocholine, and CDP-choline were analyzed based on published methods (22).
Statistics and informatics
Paired results were assessed by Wilcoxon signed rank test. Correlations were assessed by the Spearman coefficient. A principal component analysis (PCA) was conducted to reduce the dimensionality of raw LCMS data and facilitate clinical and radiopathologic correspondence. Principal components with eigenvalues greater than 1.5 were considered significant. Following standard varimax rotation, component scores derived from the rotated factor loading coefficients were evaluated for correlations with PET and clinical data.
To obtain chemical data associated with each principal component factor (PCF), the Human Metabolome Database (http://www.hmdb.ca) was queried over the range of mass-to-charge (m/z) ratios (732.5537 to 836.6099) corresponding to the PtC class of phospholipids (21). Queries were conducted in ESI-positive mode and adduct type M+H with a molecular weight tolerance of +/− 5 ppm. All statistical and principal component analyses were performed using SAS 9.3 and JMP Pro 12.0.1 (SAS Institute, Inc., Cary, NC). All tests were two-tailed with a p < 0.05 accepted as the threshold for statistical significance.
RESULTS
Patients
Forty-two patients underwent [18F]fluorocholine PET/CT within 2 weeks of surgery. Their clinical characteristics are summarized in Table 1. One patient underwent transarterial chemotherapy embolization in preparation for liver transplantation, with PET/CT revealing no focal increased liver uptake and the explanted liver revealing no viable tumor. Excluding this case, there were 37 HCC and 4 intrahepatic cholangiocarcinoma (ICC) tumors confirmed histopathologically.
Table 1.
Patient characteristics (n=42).
| Characteristic | Values |
|---|---|
| Mean age, years (range) | 64 (35–89) |
| Gender | |
| males | 32 |
| females | 10 |
| Childs-Pugh classification | |
| A | 37 |
| B | 5 |
| Mean tumor diameter, cm (range) | 6.7 (1.3–22) |
| Histopathologic Diagnosis | |
| Hepatocellular Carcinoma | 37 |
| ES 1, well-differentiated | 2 |
| ES 2, moderately-differentiated | 22 |
| ES 3, poorly-differentiated | 11 |
| ES 4, undifferentiated | 2 |
| Intrahepatic cholangiocarcinoma | 4 |
ES, Edmondson-Steiner Grade
PET/CT results
No multifocal or extrahepatic tumors were identified in any patient. Relative to adjacent liver tissue, HCC tumors demonstrated increased, decreased, and iso-intense [18F]fluorocholine uptake in 31, 4, and 2 cases, respectively. No ICC tumors demonstrated increased [18F]fluorocholine uptake (3 demonstrated decreased uptake and 1 demonstrated iso-intense uptake).
HCC tumors demonstrated a mean SUVmax of 12.6 (range 1.5 to 25.5) with a mean TLRSUV of 1.6 (range 0.2 to 3.8). SUVmax and TLRSUV correlated with K1 (ρ = 0.51, p < 0.01; ρ = 0.56, p < 0.001) and k3 (ρ = 0.33, p < 0.05; ρ = 0.44, p < 0.01), but not k2 or k4. Thirty-one of the HCC tumors were [18F]fluorocholine-avid with TLRSUV ranging from 1.3 to 3.8, thus the sensitivity of PET for primary HCC based on increased tumor uptake of [18F]fluorocholine was 84% (31/37). Largest HCC tumor diameter on gross pathology ranged from 1.3 cm to 22.0 cm (mean 7.1 cm), with no significant difference between [18F]fluorocholine-avid and non-avid tumors (6.9 cm vs 8.5 cm, p = 0.60). Of 7 HCC tumors measuring < 2 cm in largest diameter, 4 were detected (ie. [18F]fluorocholine-avid) and 3 were not detected (ie. [18F]fluorocholine non-avid). No PET imaging parameter correlated with tumor size, Edmondson-Steiner grade, or serum alpha fetoprotein level. The clinical characteristics of the 6 HCC patients with [18F]fluorocholine non-avid tumors are summarized in Table 2. Imaging examples of [18F]fluorocholine-avid and non-avid tumors are shown in Figures 1 and 2.
Table 2.
Clinical characteristics of HCC patients with [18F]fluorocholine non-avid tumors.
| Patient No. | Childs-Pugh Class | SUV max | TLR | Diameter (cm) | E-S | Necrosis Present | Micro-vascular Invasion |
|---|---|---|---|---|---|---|---|
| 1 | A | 8.9 | 1.2 | 1.5 | 2 | No | No |
| 2 | A | 5.6 | 0.6 | 13.8 | 3 | No | No |
| 3 | A | 2.2 | 0.4 | 3.7 | 2 | Yes | No |
| 4 | A | 8.6 | 1.0 | 16.0 | 4 | Yes | Yes |
| 5 | A | 7.6 | 1.0 | 1.6 | 4 | Yes | Yes |
| 6 | B | 1.5 | 0.2 | 1.7 | 2 | No | No |
SUV, standardized uptake value; TLR, tumor-liver uptake ratio; E-S, Edmondson-Steiner grade
Fig. 1.
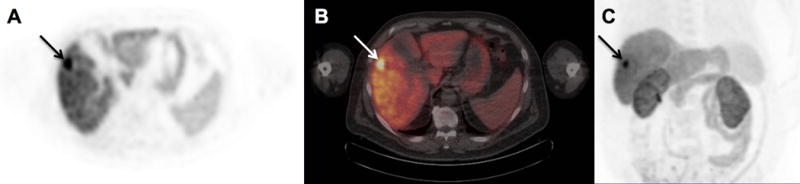
[18F]-fluorocholine PET/CT detection of primary hepatocellular carcinoma in the right hepatic lobe. Transverse PET (A) and PET/CT (B) images of the liver, and a maximum intensity projection of the torso (C), are shown. A 2.2 cm diameter tumor (arrows) confirmed histopathologically as Edmondson-Steiner grade 3 hepatocellular carcinoma demonstrates significantly increased tracer uptake relative to the liver with SUVmax of 22.3. Corresponding tissue profiling revealed increased tumor tissue levels of phosphocholine, CDP-choline, and highly-saturated PtC relative to the adjacent liver tissue.
Fig. 2.
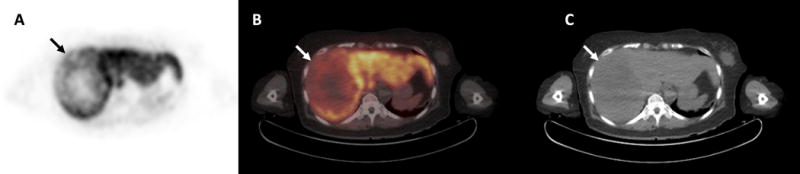
Hepatocellular carcinoma showing diminished [18F]-fluorocholine uptake. Transverse PET (A) and PET/CT (B) images of the liver demonstrate a 14cm diameter area of heterogeneously diminished uptake in the right hepatic lobe (arrow). A mass (arrow) with hypodense regions can be seen on the corresponding non-contrast CT image (C). This mass was determined histopathologically to be Edmondson-Steiner grade 3 hepatocellular carcinoma. While there were necrotic regions within this large mass, non-necrotic tissues obtained from areas showing low uptake on PET were profiled, revealing decreased levels of phosphocholine, CDP-choline and highly-saturated phosphatidylchoines relative to adjacent liver tissue.
The mean SUVmax for ICC was 5.4 (range 4.1 to 7.8) with a mean TLRSUV of 0.81 (range 0.65 to 0.96). Largest ICC tumor diameter on gross pathology ranged from 1.2 cm to 5.5 cm (mean 3.1 cm). Applying criteria taken from Talbot et al. (13), which designated an increase or decrease in tumor [18F]fluorocholine uptake as abnormal, the sensitivity of [18F]fluorocholine PET/CT for HCC and ICC was 93% (38/41). Alternatively, if only hypermetabolism (ie. a TLRSUV > 1.2) was considered abnormal, sensitivity for all primary liver cancers was 76% (31/41).
Histopathologic analysis
Only a single tumor was identified in each partial hepatectomy specimen. Areas of necrosis were noted on histology in 8 HCC specimens (5 moderately differentiated tumors and 3 undifferentiated tumors). Vascular invasion was identified in 8 HCC specimens (3 moderately differentiated tumors, 3 poorly differentiated tumors, and 2 undifferentiated tumors). There was not enough tumor tissue available for tissue profiling in 6 patients with HCC: 4 with small tumors (largest diameters from 1.3 cm to 1.8 cm) and 2 with necrotic tumors. Therefore, tumor and adjacent liver tissues from only 31 HCC cases could be profiled, although 5 of the 6 tumors not profiled were detectable on [18F]fluorocholine PET/CT, including 2 necrotic tumors showing focal areas of increased [18F]fluorocholine uptake.
Phospholipids analysis
PtC was found to be the most abundant phospholipid in the HCC tumor samples, accounting for 70% of total phospholipids, followed by phosphatidylethanolamine (15%), phosphatidylinositol (14%), lysophosphatidylcholine (<1%), and sphingomyelins (<1%). Compared to adjacent liver tissue, HCC tumor tissues contained significantly higher levels of phosphocholine and CDP-choline, as well as PtC species corresponding to m/z 732.5537, 734.5667, 788.6106, but lower levels of PtC species at other m/z values. Total PtC levels did not differ significantly between HCC tissue and adjacent liver tissue (16.7 mcg/mg tissue vs. 18.3 mcg/mg tissue, p = 0.1233). Paired comparisons of the metabolites from tumor and adjacent liver tissues are summarized in Table 3. Several PET parameters were significantly correlated with tumor levels of phosphocholine and total PtC, as shown in Table 4.
Table 3.
Paired tumor and adjacent liver analyses of choline and PtC metabolite levels in HCC (n = 31)
| Metabolite | Mean value in tumors | Mean value in liver tissue | Wilcoxon p-value |
|---|---|---|---|
| Phosphocholine (pmol/mg tissue) | 3538.04 | 1141.77 | <0.0001 |
| CDP-choline (ng/mg tissue) | 72.61 | 46.31 | 0.0017 |
| Total PtC (mcg/mg tissue) | 16.7 | 18.3 | 0.1233 |
| PtC species at: | (log area units/mg tissue) | log area units/mg tissue) | |
| m/z 732.5537 | 7.51 | 7.11 | <0.0001 |
| m/z 734.5667 | 7.40 | 7.20 | <0.0001 |
| m/z 758.5677 | 8.08 | 8.30 | <0.0001 |
| m/z 760.5814 | 8.10 | 8.05 | 0.2151 |
| m/z 780.5573 | 6.73 | 6.99 | <0.0001 |
| m/z 782.5692 | 7.66 | 7.84 | 0.0010 |
| m/z 784.5815 | 7.65 | 7.66 | 0.9390 |
| m/z 786.6014 | 7.88 | 7.95 | 0.1388 |
| m/z 788.6106 | 7.33 | 7.17 | 0.0011 |
| m/z 806.5683 | 7.14 | 7.52 | <0.0001 |
| m/z 808.5808 | 7.18 | 7.34 | 0.0004 |
| m/z 810.5967 | 7.47 | 7.54 | 0.0414 |
| m/z 812.6067 | 7.14 | 7.06 | 0.0355 |
| m/z 832.5772 | 6.38 | 6.49 | 0.0204 |
| m/z 834.5969 | 6.80 | 7.04 | <0.0001 |
| m/z 836.6099 | 6.47 | 6.61 | 0.0002 |
PtC, phosphatidylcholine; CDP-choline, citidine diphosphate choline; m/z, mass-to-charge ratio.
Table 4.
Correlation of HCC tumor choline phospholipid levels and PET parameters
| PET Parameter | phosphocholine, ρ (p-value) | total phosphatidylcholine, ρ (p-value) |
|---|---|---|
| SUVmax | 0.41 (0.0234) | 0.46 (0.0094) |
| TLRSUV | 0.48 (0.0065) | 0.43 (0.0167) |
| K1/k2 | 0.44 (0.0132) | 0.51 (0.0035) |
Principal components analysis
Scree and variance plots for PCA of the 31 HCC samples are shown in Figure 3. The first two PCA eigenvectors accounted for approximately 80% of total profile variation (Table 5).
Fig. 3.
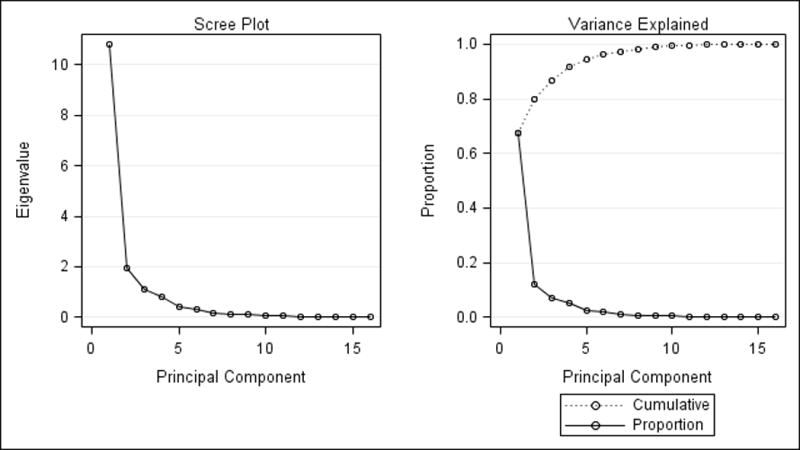
Scree (left) and variance (right) plots from principal components analysis of HCC tumor samples. The first two eigenvalues accounted for 80% of total profile variation.
Table 5.
Eigenvalues from principal component analysis
| No. | HCC Tumors (n=31) | ||
|---|---|---|---|
| Eigen-value | % | Cumulative % | |
| 1 | 10.817 | 67.608 | 67.608 |
| 2 | 1.9558 | 12.224 | 79.832 |
| 3 | 1.1062 | 6.914 | 86.746 |
| 4 | 0.8270 | 5.169 | 91.914 |
| 5 | 0.3929 | 2.456 | 94.370 |
| 6 | 0.3170 | 1.981 | 96.352 |
| 7 | 0.1766 | 1.104 | 97.456 |
| 8 | 0.1272 | 0.795 | 98.250 |
| 9 | 0.1030 | 0.643 | 98.894 |
| 10 | 0.0665 | 0.416 | 99.309 |
| 11 | 0.0454 | 0.283 | 99.593 |
| 12 | 0.0286 | 0.179 | 99.772 |
| 13 | 0.0231 | 0.144 | 99.916 |
| 14 | 0.0081 | 0.050 | 99.966 |
| 15 | 0.0038 | 0.024 | 99.990 |
| 16 | 0.0016 | 0.010 | 100.00 |
The loading value results from a rotated PC factor (PCF) analysis of the HCC profile data are shown in Table 6. Significant contributors (ie. loading values > 0.75) to the first principal component factor (PCF1) were comprised of PtC species with m/z centered at 780,5573, 782.5692, 86.6014, 806.5683, 808.5808, 810.5967, 812.6067, 832.5772, 834.5969, and 836.6099 (Figure 4). Referring to the Human Metabolome Database, these ranges of m/z all correspond to PtC species containing long polyunsaturated fatty acyl (PUFA) groups (Supplementary Table 1). In contrast, the significant loading values of principal component factor 2 (PCF2) corresponded to species with m/z in the range of 732.5537, 734.5667, and 760.5814 (Figure 4). These ranges were ascribed in the Human Metabolome Database only to PtC species containing highly saturated fatty acyl (HSFA) groups (Supplementary Table 2). In contrast, PCA of adjacent liver tissue profiles did not reveal this pattern of partitioning between PUFA-PtC and HSFA-PtC.
Table 6.
Rotated principal component factor (PCF) loading values. Significant loading values (bold) of PCF1 corresponded to the m/z ratios of PtC species with polyunsaturated fatty acyl groups, while significant loading values (bold) of PCF2 corresponded only with the m/z ratios of PtC species containing saturated and mono-unsaturated fatty acyl groups.
| HCC Tumors (n=31) | ||
|---|---|---|
| m/z ratio | PCF1 | PCF2 |
| 732.5537 | −0.05544 | 0.89626 |
| 734.5667 | 0.15288 | 0.81138 |
| 758.5677 | 0.73962 | 0.30112 |
| 760.5814 | 0.52879 | 0.79036 |
| 780.5573 | 0.94078 | 0.06516 |
| 782.5692 | 0.89515 | 0.28799 |
| 784.5815 | 0.63876 | 0.56117 |
| 786.6014 | 0.83106 | 0.10791 |
| 788.6106 | 0.38212 | 0.22091 |
| 806.5683 | 0.89053 | 0.25746 |
| 808.5808 | 0.88871 | 0.40116 |
| 810.5967 | 0.97224 | 0.11127 |
| 812.6067 | 0.92275 | 0.15986 |
| 832.5772 | 0.77533 | 0.51895 |
| 834.5969 | 0.94649 | 0.06628 |
| 836.6099 | 0.92022 | 0.29525 |
PCF, principal component factor
Fig. 4.
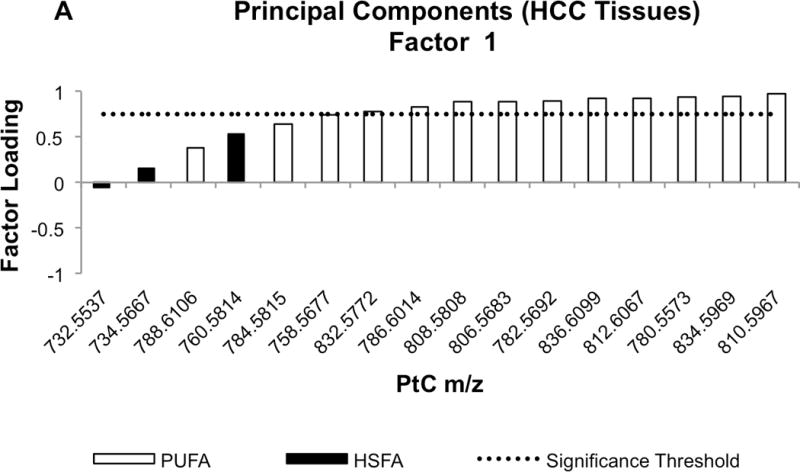
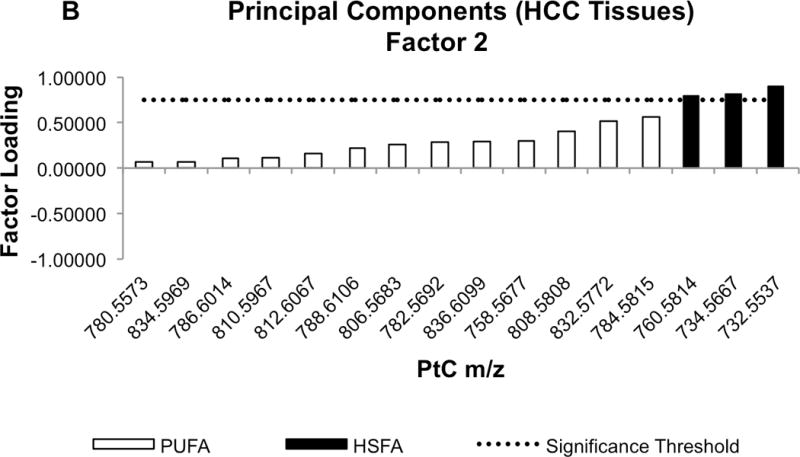
Waterfall plots of factor loading values for PCF1 (A) and PCF2 (B). Molecular species of PtC differentiated by mass-to-charge (m/z) value are sorted in ascending order based on their factor loading values. Black bars indicate the m/z values corresponding to PtC species containing highly-saturated fatty acyl (HSFA) groups, while white bars correspond to the PtC species containing poly-unsaturated fatty acyl (PUFA) groups. The dotted line shows loading value significance threshold at 0.75.
PCF1 was not significantly correlated with any PET parameter, including TLRSUV and tumor SUVmax. However, PCF2 correlated significantly with TLRSUV (ρ = 0.59, p < 0.0005) and tumor SUVmax (ρ = 0.37, p < 0.05). No significant associations between Edmondson-Steiner tumor grade and PtC composition were noted.
PCA that included the 4 ICC samples was also performed, resulting in the same partitioning between HSFA and PUFA PtC species as was found in analysis of only HCC. Notably, PtC metabolite profiles in 3 of 4 ICC tumors differed distinctively from HCC tumors, clustering tightly and separately from HCC tumors based on the first two principal components (Figure 5). Interestingly, the only ICC tumor that showed iso-intense uptake on [18F]fluorocholine PET/CT was the one not distinguishable from HCC by PCA.
Fig. 5.
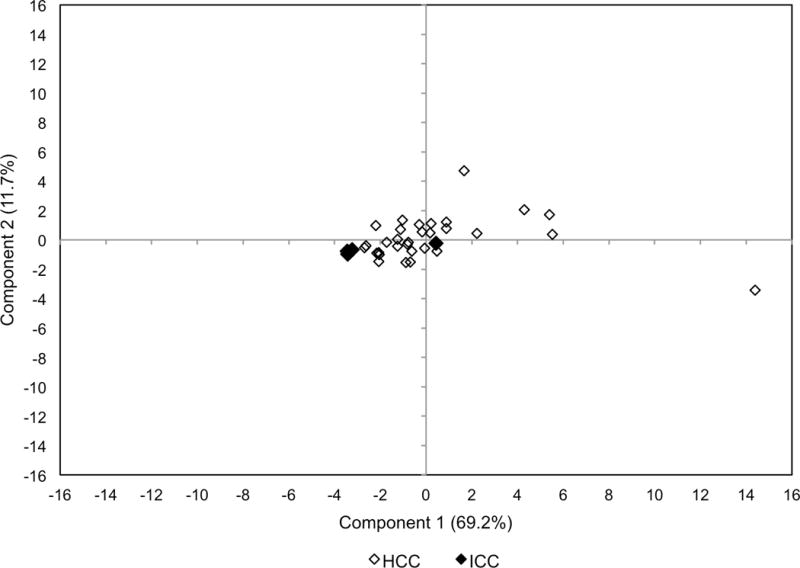
PCA score plot including both HCC and ICC samples. Based on principal components 1 and 2, there is tight clustering of 3 out of 4 ICC tumors (overlapping black dots) separable from HCC tumors. The HCC tumors are more broadly distributed. The ICC tumor near the origin (0,0) was not distinguishable from HCC tumors based on principal components. This was the only ICC tumor that demonstrated iso-intense uptake on [18F]-fluorocholine PET/CT.
Bioinformatics
Human Metabolome Database queries (http://www.hmdb.ca, last accessed June 19, 2016) revealed PtC species associated with the m/z values comprising the significant loading values for PCF2 (m/z 732.5537, 734.5667, and 760.5814) were exclusively composed of saturated fatty acids (C14:0, C16:0, C18:0) that are products of fatty acid synthase (FASN), as well as mono-unsaturated fatty acids (C14:1, C16:1, etc.) that are products of stearoyl-CoA desaturase-1 (SCD1) and other human-occurring fatty acid CoA desaturases (23). In contrast, the m/z values associated with the significant loading values for PCF1 indicated more complex mixtures of fatty acids that include longer highly unsaturated fatty acids, as well as linoleic acid (C18:2) and alpha-linolenic acid (C18:3), which cannot be synthesized de-novo by humans (ie. derived from essential fatty acids).
DISCUSSION
The CDP-choline pathway that produces PtC from choline is a constitutive metabolic pathway in hepatocytes, supporting not only membrane production but also the synthesis of lipid particles and bile solvents (24). In liver cancer as well as other cancers, there appears to be upregulation of this pathway in support of tumor cell proliferation (5, 25). Molecular imaging of the initial steps of this pathway is enabled by [18F]fluorocholine PET/CT (14), with single-institution trials showing it to have high diagnostic sensitivity for several malignancies that can elude detection by conventional FDG PET/CT, such as prostate cancer and HCC (13, 26). The present study correlates choline metabolism (depicted by [18F]fluorocholine PET/CT) with lipid composition in liver cancer, revealing a preponderance of HSFA PtC species in the tumors demonstrating increased [18F]fluorocholine metabolism. These results indicate that upregulated choline metabolism and de-novo lipogenesis are jointly involved in satisfying the demand for PtC in malignancy.
In the context of metabolic reprogramming, it would not be surprising for choline phospholipid metabolism to join with other metabolic pathways such as fatty acid synthesis in support of tumor cell survival and proliferation (27). Increased rates of de-novo fatty acid synthesis have been observed in many cancers (28), and pre-clinical experiments using radiolabeled acetate have shown that a significant proportion of de-novo fatty acids are incorporated by PtC in HCC (29). Indeed, [11C]-acetate has been proposed as a PET tracer for detecting HCC on the basis of imaging de-novo fatty acid synthesis, with clinical studies supporting its potential diagnostic efficacy (30). The consumption of de-novo fatty acids for cell membrane synthesis may help explain the significant overlap between cancers that can be detected by choline PET and by acetate PET. However, recently it was shown that some HCC tumors show low [11C]-acetate uptake despite increases in de novo lipogenesis and FASN expression (31). While the mechanism underlying this paradoxical observation is not yet fully clarified, it is known that acetate participates in other metabolic pathways besides lipogenesis, including oxidative metabolism, histone acetylation, and cholesterol synthesis (32). Therefore, multiple pathways may be regulating acetate metabolism, thus reducing the fidelity of [11C]-acetate as an imaging biomarker of lipogenesis. Alternative imaging techniques may therefore be required to better identify and characterize lipogenic tumor phenotypes. Based on the present findings, imaging of choline metabolism may be helpful in this regard.
The coordination between lipogenesis and phospholipid synthesis in HCC might involve sterol regulatory element-binding protein 1 (SREBP-1), a nuclear transcription factor that controls multiple elements of lipid metabolism (33). SREBP-1 has also been shown to regulate elements of the CDP-choline pathway (34). SREBP-1 can be activated by PI3K/Akt signaling, recruiting lipogenesis to meet the metabolic demands of malignant tumors (33). Since SREBP-1 is potentially a therapeutic target, [18F]fluorocholine PET/CT may be worth evaluating as an imaging biomarker for measuring the phospholipid effects of SREBP-1 antagonists, or other lipid pathway inhibitors, in tumors.
Applying diagnostic criteria developed in a previous clinical imaging trial (13), we estimated the sensitivity of [18F]fluorocholine PET/CT to be 93% for detecting primary liver cancers, a result similar to the aforementioned trial. Another similar finding was that none of the ICC tumors imaged in this study were hypermetabolic on [18F]fluorocholine PET/CT. Because some HCC tumors may have cholangiocarcinoma-like features and also incorporate lipogenic and glycolytic phenotypes (35), there is a basis for classifying both hypermetabolic and hypometabolic liver tumors as abnormal on [18F]fluorocholine PET/CT. Further research is needed to determine the clinical and prognostic significance of HCC tumor [18F]fluorocholine avidity, particularly in relation to the degree by which tumors are also positive on FDG PET/CT.
The present study has several limitations. Most notably, it included only patients with resectable tumors and consequently may not reflect the full clinical spectrum of liver cancer, including aggressive cancers that are more likely to present at late stage. Furthermore, there was not enough sample tissue to conduct phospholipid metabolite profiling in 6 cases. Given a small cohort, this might raise concern for selection bias, however the pathologic and imaging characteristics of profiled and unprofiled tumors were comparable. In addition, since patients with benign liver lesions are less likely to undergo surgery, the diagnostic specificity of [18F]fluorocholine PET/CT could not be realistically estimated. Previous studies have reported that non-cancerous conditions such as focal nodular hyperplasia and cholangitis can manifest with increased [18F]fluorocholine uptake (13). Larger studies involving a broader series of patients will be needed to fully characterize the diagnostic performance of [18F]fluorocholine PET/CT in patients presenting with liver masses.
Although the prognostic significance of increased [18F]fluorocholine uptake in liver cancer is not yet certain, we recently found by immunohistochemical profiling of a liver cancer tissue microarray that overexpression of choline kinase was associated with diminished overall survival in HCC (36). An enzyme responsible for producing the mono-unsaturated fatty acids comprising PCF2 (the component associated with tumor [18F]fluorocholine uptake), SCD-1, has also been shown to promote tumor cell survival and chemotherapy resistance in HCC (37). Thus, it may be worthwhile to conduct further research on the prognostic or predictive value of [18F]fluorocholine PET/CT in HCC.
CONCLUSION
In this study, the phospholipid metabolomes of surgically-resected liver cancers were profiled in a targeted manner, revealing that levels of highly-saturated PtC species increased in HCC in correlation with [18F]fluorocholine uptake on PET/CT. These findings imply that the CDP-choline pathway may have dependency on de-novo fatty acid metabolism in supplying PtC in HCC. Findings from the present study may support the use of [18F]fluorocholine PET/CT to identify tumors with lipogenic phenotypes, with potential applications as a prognostic or therapeutic biomarker in HCC.
Supplementary Material
Acknowledgments
This work was substantially supported by United States National Institutes of Health/National Cancer Institute grant R01CA161209-05.
Financial Support: This work was supported by NIH/NCI grant R01CA161209-05.
Footnotes
Author Contributions: Conceived and designed experiments: SAK, MMS, YK, AF, LC, LLW. Performed the experiments: SAK, AF, LC, KM. Analyzed the data: SAK, MMS, YK, AF, LC, KM, LLW. Contributed materials/analysis tools: SAK, MMS, YK, AF, LC, LLW. Writing and final manuscript approval: SAK, MMS, YK, AF, LC, KM, LLW.
Conflicts of Interest: The authors declare that they have no conflicts of interest.
References
- 1.Rahib L, Smith BD, Aizenberg R, Rosenzweig AB, Fleshman JM, Matrisian LM. Projecting cancer incidence and deaths to 2030: the unexpected burden of thyroid, liver, and pancreas cancers in the United States. Cancer research. 2014;74(11):2913–21. doi: 10.1158/0008-5472.CAN-14-0155. [DOI] [PubMed] [Google Scholar]
- 2.Benson AB, 3rd, D’Angelica MI, Abrams TA, Are C, Bloomston PM, Chang DT, Clary BM, Covey AM, Ensminger WD, Iyer R, et al. Hepatobiliary cancers, version 2.2014. J Natl Compr Canc Netw. 2014;12(8):1152–82. doi: 10.6004/jnccn.2014.0112. [DOI] [PubMed] [Google Scholar]
- 3.Lan BY, Kwee SA, Wong LL. Positron emission tomography in hepatobiliary and pancreatic malignancies: a review. American journal of surgery. 2012;204(2):232–41. doi: 10.1016/j.amjsurg.2011.07.025. [DOI] [PMC free article] [PubMed] [Google Scholar]
- 4.Michel V, Yuan Z, Ramsubir S, Bakovic M. Choline transport for phospholipid synthesis. Exp Biol Med (Maywood) 2006;231(5):490–504. doi: 10.1177/153537020623100503. [DOI] [PubMed] [Google Scholar]
- 5.Kuang Y, Salem N, Tian H, Kolthammer JA, Corn DJ, Wu C, Wang F, Wang Y, Lee Z. Imaging lipid synthesis in hepatocellular carcinoma with [methyl-11c]choline: correlation with in vivo metabolic studies. Journal of nuclear medicine: official publication, Society of Nuclear Medicine. 2011;52(1):98–106. doi: 10.2967/jnumed.110.080366. [DOI] [PubMed] [Google Scholar]
- 6.Beyoglu D, Idle JR. The metabolomic window into hepatobiliary disease. Journal of hepatology. 2013;59(4):842–58. doi: 10.1016/j.jhep.2013.05.030. [DOI] [PMC free article] [PubMed] [Google Scholar]
- 7.Stubbs CD, Smith AD. The modification of mammalian membrane polyunsaturated fatty acid composition in relation to membrane fluidity and function. Biochimica et biophysica acta. 1984;779(1):89–137. doi: 10.1016/0304-4157(84)90005-4. [DOI] [PubMed] [Google Scholar]
- 8.Gandola YB, Perez SE, Irene PE, Sotelo AI, Miquet JG, Corradi GR, Carlucci AM, Gonzalez L. Mitogenic effects of phosphatidylcholine nanoparticles on MCF-7 breast cancer cells. Biomed Res Int. 2014;2014:687037. doi: 10.1155/2014/687037. [DOI] [PMC free article] [PubMed] [Google Scholar]
- 9.Guo S, Wang Y, Zhou D, Li Z. Significantly increased monounsaturated lipids relative to polyunsaturated lipids in six types of cancer microenvironment are observed by mass spectrometry imaging. Sci Rep. 2014;4:5959. doi: 10.1038/srep05959. [DOI] [PMC free article] [PubMed] [Google Scholar]
- 10.Hilvo M, Denkert C, Lehtinen L, Muller B, Brockmoller S, Seppanen-Laakso T, Budczies J, Bucher E, Yetukuri L, Castillo S, et al. Novel theranostic opportunities offered by characterization of altered membrane lipid metabolism in breast cancer progression. Cancer research. 2011;71(9):3236–45. doi: 10.1158/0008-5472.CAN-10-3894. [DOI] [PubMed] [Google Scholar]
- 11.Ishikawa S, Tateya I, Hayasaka T, Masaki N, Takizawa Y, Ohno S, Kojima T, Kitani Y, Kitamura M, Hirano S, et al. Increased expression of phosphatidylcholine (16:0/18:1) and (16:0/18:2) in thyroid papillary cancer. PloS one. 2012;7(11):e48873. doi: 10.1371/journal.pone.0048873. [DOI] [PMC free article] [PubMed] [Google Scholar]
- 12.Rysman E, Brusselmans K, Scheys K, Timmermans L, Derua R, Munck S, Van Veldhoven PP, Waltregny D, Daniels VW, Machiels J, et al. De novo lipogenesis protects cancer cells from free radicals and chemotherapeutics by promoting membrane lipid saturation. Cancer research. 2010;70(20):8117–26. doi: 10.1158/0008-5472.CAN-09-3871. [DOI] [PubMed] [Google Scholar]
- 13.Talbot JN, Fartoux L, Balogova S, Nataf V, Kerrou K, Gutman F, Huchet V, Ancel D, Grange JD, Rosmorduc O. Detection of hepatocellular carcinoma with PET/CT: a prospective comparison of 18F-fluorocholine and 18F-FDG in patients with cirrhosis or chronic liver disease. Journal of nuclear medicine: official publication, Society of Nuclear Medicine. 2010;51(11):1699–706. doi: 10.2967/jnumed.110.075507. [DOI] [PubMed] [Google Scholar]
- 14.Bansal A, Shuyan W, Hara T, Harris RA, Degrado TR. Biodisposition and metabolism of [(18)F]fluorocholine in 9L glioma cells and 9L glioma-bearing fisher rats. European journal of nuclear medicine and molecular imaging. 2008;35(6):1192–203. doi: 10.1007/s00259-008-0736-y. [DOI] [PMC free article] [PubMed] [Google Scholar]
- 15.Talbot JN, Gutman F, Fartoux L, Grange JD, Ganne N, Kerrou K, Grahek D, Montravers F, Poupon R, Rosmorduc O. PET/CT in patients with hepatocellular carcinoma using [(18)F]fluorocholine: preliminary comparison with [(18)F]FDG PET/CT. European journal of nuclear medicine and molecular imaging. 2006;33(11):1285–9. doi: 10.1007/s00259-006-0164-9. [DOI] [PubMed] [Google Scholar]
- 16.Lim J, Dorman E, Cabral C. Automated Production of[18F]FECh and [18F]FCH: Preparation and Use of [18F]Fluoroalkane Sulfonates and Fluoroalkylation Agents [abstract] J Label Compd Radiopharm. 2003;46:S46. [Google Scholar]
- 17.Slaets D, De Vos F. Comparison between kinetic modelling and graphical analysis for the quantification of [18F]fluoromethylcholine uptake in mice. EJNMMI Res. 2013;3(1):66. doi: 10.1186/2191-219X-3-66. [DOI] [PMC free article] [PubMed] [Google Scholar]
- 18.Verwer EE, Oprea-Lager DE, van den Eertwegh AJ, van Moorselaar RJ, Windhorst AD, Schwarte LA, Hendrikse NH, Schuit RC, Hoekstra OS, Lammertsma AA, et al. Quantification of 18F-Fluorocholine Kinetics in Patients with Prostate Cancer. Journal of nuclear medicine: official publication, Society of Nuclear Medicine. 2015;56(3):365–71. doi: 10.2967/jnumed.114.148007. [DOI] [PubMed] [Google Scholar]
- 19.Takesh M. Kinetic Modeling Application to (18)F-fluoroethylcholine Positron Emission Tomography in Patients with Primary and Recurrent Prostate Cancer Using Two-tissue Compartmental Model. World J Nucl Med. 2013;12(3):101–10. doi: 10.4103/1450-1147.136734. [DOI] [PMC free article] [PubMed] [Google Scholar]
- 20.Koc H, Mar MH, Ranasinghe A, Swenberg JA, Zeisel SH. Quantitation of choline and its metabolites in tissues and foods by liquid chromatography/electrospray ionization-isotope dilution mass spectrometry. Analytical chemistry. 2002;74(18):4734–40. doi: 10.1021/ac025624x. [DOI] [PubMed] [Google Scholar]
- 21.Zhao YY, Xiong Y, Curtis JM. Measurement of phospholipids by hydrophilic interaction liquid chromatography coupled to tandem mass spectrometry: the determination of choline containing compounds in foods. Journal of chromatography A. 2011;1218(32):5470–9. doi: 10.1016/j.chroma.2011.06.025. [DOI] [PubMed] [Google Scholar]
- 22.Mimmi MC, Finato N, Pizzolato G, Beltrami CA, Fogolari F, Corazza A, Esposito G. Absolute quantification of choline-related biomarkers in breast cancer biopsies by liquid chromatography electrospray ionization mass spectrometry. Anal Cell Pathol (Amst) 2013;36(3–4):71–83. doi: 10.3233/ACP-130082. [DOI] [PMC free article] [PubMed] [Google Scholar]
- 23.Peck B, Schug ZT, Zhang Q, Dankworth B, Jones DT, Smethurst E, Patel R, Mason S, Jiang M, Saunders R, et al. Inhibition of fatty acid desaturation is detrimental to cancer cell survival in metabolically compromised environments. Cancer Metab. 2016;4:6. doi: 10.1186/s40170-016-0146-8. [DOI] [PMC free article] [PubMed] [Google Scholar]
- 24.Plagemann PG. Choline metabolism and membrane formation in rat hepatoma cells grown in suspension culture. II. Phosphatidylcholine synthesis during growth cycle and fluctuation of mitochondrial density. J Cell Biol. 1969;42(3):766–81. doi: 10.1083/jcb.42.3.766. [DOI] [PMC free article] [PubMed] [Google Scholar]
- 25.Glunde K, Bhujwalla ZM, Ronen SM. Choline metabolism in malignant transformation. Nature reviews Cancer. 2011;11(12):835–48. doi: 10.1038/nrc3162. [DOI] [PMC free article] [PubMed] [Google Scholar]
- 26.Price DT, Coleman RE, Liao RP, Robertson CN, Polascik TJ, DeGrado TR. Comparison of [18 F]fluorocholine and [18 F]fluorodeoxyglucose for positron emission tomography of androgen dependent and androgen independent prostate cancer. The Journal of urology. 2002;168(1):273–80. [PubMed] [Google Scholar]
- 27.Schulze A, Harris AL. How cancer metabolism is tuned for proliferation and vulnerable to disruption. Nature. 2012;491(7424):364–73. doi: 10.1038/nature11706. [DOI] [PubMed] [Google Scholar]
- 28.Santos CR, Schulze A. Lipid metabolism in cancer. FEBS J. 2012;279(15):2610–23. doi: 10.1111/j.1742-4658.2012.08644.x. [DOI] [PubMed] [Google Scholar]
- 29.Salem N, Kuang Y, Corn D, Erokwu B, Kolthammer JA, Tian H, Wu C, Wang F, Wang Y, Lee Z. [(Methyl)1-(11)c]-acetate metabolism in hepatocellular carcinoma. Molecular imaging and biology: MIB: the official publication of the Academy of Molecular Imaging. 2011;13(1):140–51. doi: 10.1007/s11307-010-0308-y. [DOI] [PMC free article] [PubMed] [Google Scholar]
- 30.Ho CL, Yu SC, Yeung DW. 11C-acetate PET imaging in hepatocellular carcinoma and other liver masses. Journal of nuclear medicine: official publication, Society of Nuclear Medicine. 2003;44(2):213–21. [PubMed] [Google Scholar]
- 31.Li L, Che L, Wang C, Blecha JE, Li X, VanBrocklin HF, Calvisi DF, Puchowicz M, Chen X, Seo Y. [C]acetate PET Imaging is not Always Associated with Increased Lipogenesis in Hepatocellular Carcinoma in Mice. Molecular imaging and biology: MIB: the official publication of the Academy of Molecular Imaging. 2015 doi: 10.1007/s11307-015-0915-8. [DOI] [PMC free article] [PubMed] [Google Scholar]
- 32.Deford-Watts LM, Mintz A, Kridel SJ. The potential of (1)(1)C-acetate PET for monitoring the Fatty acid synthesis pathway in Tumors. Curr Pharm Biotechnol. 2013;14(3):300–12. doi: 10.2174/1389201011314030006. [DOI] [PMC free article] [PubMed] [Google Scholar]
- 33.Guo D, Bell EH, Mischel P, Chakravarti A. Targeting SREBP-1-driven lipid metabolism to treat cancer. Curr Pharm Des. 2014;20(15):2619–26. doi: 10.2174/13816128113199990486. [DOI] [PMC free article] [PubMed] [Google Scholar]
- 34.Kast HR, Nguyen CM, Anisfeld AM, Ericsson J, Edwards PA. CTP:phosphocholine cytidylyltransferase, a new sterol- and SREBP-responsive gene. J Lipid Res. 2001;42(8):1266–72. [PubMed] [Google Scholar]
- 35.Murakami Y, Kubo S, Tamori A, Itami S, Kawamura E, Iwaisako K, Ikeda K, Kawada N, Ochiya T, Taguchi YH. Comprehensive analysis of transcriptome and metabolome analysis in Intrahepatic Cholangiocarcinoma and Hepatocellular Carcinoma. Sci Rep. 2015;5:16294. doi: 10.1038/srep16294. [DOI] [PMC free article] [PubMed] [Google Scholar]
- 36.Kwee SA, Hernandez B, Chan O, Wong L. Choline kinase alpha and hexokinase-2 protein expression in hepatocellular carcinoma: association with survival. PloS one. 2012;7(10):e46591. doi: 10.1371/journal.pone.0046591. [DOI] [PMC free article] [PubMed] [Google Scholar]
- 37.Bansal S, Berk M, Alkhouri N, Partrick DA, Fung JJ, Feldstein A. Stearoyl-CoA desaturase plays an important role in proliferation and chemoresistance in human hepatocellular carcinoma. J Surg Res. 2014;186(1):29–38. doi: 10.1016/j.jss.2013.07.001. [DOI] [PMC free article] [PubMed] [Google Scholar]
Associated Data
This section collects any data citations, data availability statements, or supplementary materials included in this article.