Abstract
Background
Mediation analyses have been a popular approach to investigate the effect of an exposure on an outcome through a mediator. Mediation models with multiple mediators have been proposed for continuous and dichotomous outcomes. However, development of multi-mediator models for survival outcomes is still limited.
Methods
We present methods for multi-mediator analyses using three survival models: Aalen additive hazard models, Cox proportional hazard models, and semiparametric probit models. Effects through mediators can be characterized by path-specific effects, for which definitions and identifiability assumptions are provided. We derive closed form expressions for path-specific effects for the three models, which are intuitively interpreted using a causal diagram.
Results
Mediation analyses using Cox models under the rare outcome assumption and Aalen additive hazard models consider effects on log hazard ratio and hazard difference, respectively; analyses using semiparametric probit models consider effects on difference in transformed survival time as well as survival probability. The three models were applied to a hepatitis study where we investigated effects of hepatitis C on liver cancer incidence mediated through baseline and/or follow-up hepatitis B viral load. The three methods show consistent results on respective effect scales, which suggest an adverse estimated effect of hepatitis C on liver cancer not mediated through hepatitis B, and a protective estimated effect mediated through the baseline (and possibly follow-up) of hepatitis B viral load.
Conclusions
Causal mediation analyses of survival outcome with multiple mediators are developed for additive hazard and proportional hazard and probit models with utility demonstrated in a hepatitis study.
Keywords: Additive hazard model, causal mediation model, Cox proportional hazard model, multiple mediators, semiparametric probit model, survival analysis
INTRODUCTION
Mediation analyses first proposed in psychology literature1,2 have become a very popular approach and been applied to a wide range of epidemiologic studies3–7. Mediation models characterize relationships of an exposure, a mediator, and an outcome. Specifically, in mediation analyses, the effect of the exposure on the outcome can be decomposed into natural direct effect, the effect of the exposure on the outcome not mediated by the mediator, and natural indirect effect, the effect of the exposure on the outcome mediated through the mediator. By employing the counterfactual framework8, causal mediation models can be formulated as a graphic model illustrated using a directed acyclic graph (DAG)9, and causal assumptions for effect identifiability have been carefully studied10. Built upon the framework of causal inference, the methodology of mediation analyses has been generalized from continuous outcomes to dichotomous outcomes11,12 and time-to-event survival outcomes13,14. The identification of natural direct and indirect effect in mediation analyses with an exposure S, a mediator M, and a survival outcome Y requires a set of assumptions14. The assumptions can be stated as that, conditional on measured confounders X, there is 1) no confounding for the relationship of S and Y, 2) no confounding for the relationship of M and Y, conditional on S, 3) no confounding for the S-M association, and 4) no confounder for the M-Y relationship caused by S; additional standard assumptions include positivity and consistency discussed in eAppendix A1.
This paper is motivated by a hepatitis study where mediation by hepatitis B and C in relation to liver cancer was investigated15. The study was conducted in a community-based prospective cohort study in Taiwan, in which viral load of hepatitis B (HBV) and C (HCV) viruses was measured at the baseline, and the incidence of liver cancer was recorded prospectively16. Based on the existing scientific evidence17–23, a mediation model was proposed with the exposure being hepatitis C viral load, the mediator being hepatitis B viral load and the outcome being the incidence of liver cancer. Additionally, hepatitis B viral load was also measured during the follow-up. We extend the above mediation model to include exposure, HCV viral load (S), the outcome, the liver cancer incidence (Y) and two mediators, one being the baseline HBV viral load (M1) and the other being the follow-up HBV viral load (M2) (Figure 1). Note that if one is interested in the mediator model with only one mediator M2, then the existence of M1 violates the aforementioned assumption 4). To address the issue, we study three effects: 1) the effect of HCV on the liver cancer incidence mediated through the baseline HBV viral load and possibly through the follow-up HBV viral load (the black path), 2) the effect of HCV on the liver cancer incidence mediated through the follow-up HBV viral load, but not through the baseline HBV viral load (the dark gray path), and 3) the effect of HCV on the liver cancer incidence not mediated by HBV regardless through the baseline or follow-up viral load (the light gray path).
Figure 1.
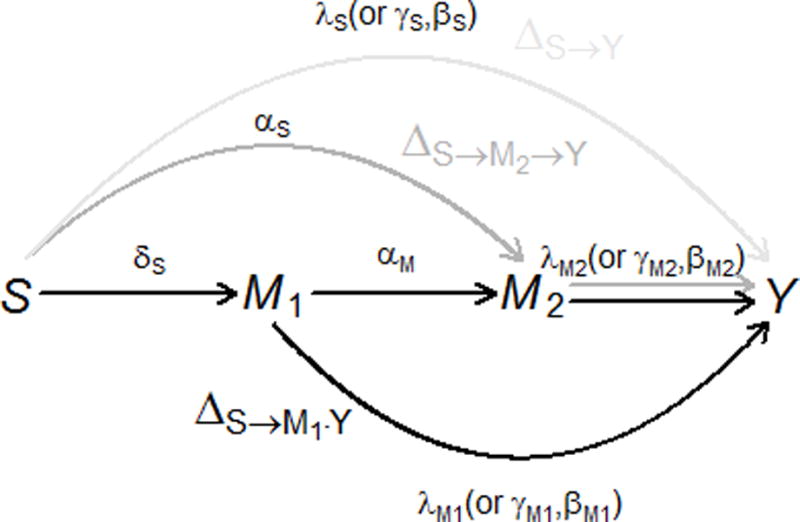
The causal diagram of the baseline HCV viral load S, the baseline HBV viral load M1, the follow-up HBV viral load M2, and the outcome of interest Y. The outcome Y is , and in additive hazard model, Cox proportional hazard model, and probit model, respectively. Three path-specific effects are in different gray scales: , the effect of the baseline HCV viral load S on the outcome independent of the HBV viral load M1 and M2 is in light gray; , the effect of the HCV viral load S on the outcome mediated only through the follow-up HBV viral load M2 (i.e., not through the baseline HBV viral load M1) is in dark gray; , the effect mediated through the baseline HBV viral load M1, and possibly through the follow-up HBV viral load M2 is in black. Greek letters are the regression coefficients in models (2)–(4) (or (6), (8)) which each arrow corresponds to. HCV indicates hepatitis C virus, HBV hepatitis B virus.
To identify the above effects, one has to conduct mediation analyses for a model with a survival outcome and multiple mediators. The three different effects have been termed as path-specific effects, which characterize mediation effects for various pathways through different mediators24. Regression-based and weighting-based approaches have been proposed to estimate path-specific effects25. The path-specific effect approach has also been proposed as a method to adjust for exposure-induced confounding for the mediator-outcome association26, similar to our problem in the hepatitis study. Causal mediation models have been generalized to incorporate mixed variable types such as a combination of continuous and dichotomous mediators27 or a set of high-dimensional continuous mediators28. However, these methods focus on non-censored outcomes. There has been some work on mediation analyses for survival outcomes. Lange and Hansen (2011)13 introduced mediation analyses using Aalen additive hazard model29; VanderWeele (2011)14 presented mediation analyses using Cox proportional hazard models30 and accelerated failure time models31; Tchetgen Tchetgen (2011) proposed studying mediation in Cox models by a doubly robust estimator32. Except for a resampling-based method presented by Lange et al. (2013)33, literature on survival models that incorporate multiple mediators is still very limited.
Because the numerical approach may have its limitation in computation costs, this paper aims to present analytic methods, which also provide better mechanistic understanding of the parameters involved in mediation effects. Huang and Cai (2016) have recently developed a new mediation analysis for survival outcome using semiparametric probit models34. Instead of focusing on a specific effect scale, e.g., hazard difference, hazard ratio, or ratio of survival time, the probit model is able to quantify the effect on the entire survival probability. Due to the conjugacy property of normal distributions, this model can be easily used to study multiple mediators. Moreover, we develop two additional multi-mediator models that use Aalen additive hazard and Cox proportional hazard models. We illustrate the utility of the three multi-mediator models in the motivating hepatitis study where we examine path-specific effects on different effect scales, including the difference in transformed survival time, the difference in survival probability across follow-up time, the hazard difference, and the hazard ratio.
DEFINITIONS AND ASSUMPTIONS
We first define a general outcome Y to be a function of time to liver cancer development T, . Let Y(s, m1, m2) be the counterfactual outcome that would have been observed had S (HCV baseline viral load), M1 (HBV baseline viral load) and M2 (HBV follow-up viral load) been set to s, m1 and m2, respectively; M2(s, m1) be the counterfactual value of M2 (HBV follow-up viral load) had S and M1 been set to s and m1, respectively; and be the counterfactual value of M1 (HBV baseline viral load) had S been set to . By extension of natural direct and indirect to two-mediator models, we define three path-specific effects on Y:
| (1) |
A series of no unmeasured confounding assumptions needs to be made to identify the three path-specific effects26,34. With for the condition that A is independent of B conditional on C, we list six sufficient conditions for identifying the PSE in the context of the motivating hepatitis study. To simplify notation, the following assumptions are presented as marginal exchangeability, and they can be generalized to be conditionally exchangeable on covariates X, in which known confounders such age and gender can be adjusted to achieve exchangeability.
: there is no confounding for the joint effect of the baseline and follow-up hepatitis B viral load on the time to liver cancer development, conditional on the baseline hepatitis C viral load (S).
: there is no confounding for the effect of the baseline hepatitis C viral load (S) on the time to liver cancer incidence.
: there is no confounding for the joint effect of , the baseline HBV and HCV viral load on the follow-up HBV viral load (M2).
: there is no confounding for the effect of the baseline HCV viral load (S) on the baseline HBV viral load (M1).
: there is no baseline HCV viral load (S)-induced factor that can confound the baseline HBV viral load-survival time (M1-T) and the follow-up HBV viral load-survival time (M2-T) joint relation, where and are interventions for the baseline HCV viral load with different values than and each other.
: there is no baseline HCV viral load-induced factor that confounds the M1-M2 (baseline vs. follow-up HBV viral load) association.
Besides no unmeasured confounding assumptions, standard assumptions of positivity and consistency are also required (see eAppendix A1).
MULTI-MEDIATOR MODELS OF SURVIVAL OUTCOME
In this section, we present three methods for mediation analyses with one exposure S, two mediators M1 and M2, and a survival outcome Y, as shown in Figure 1. The methods can easily be extended to more than two mediators.
Aalen additive hazard model
We propose two linear regression models for M1 and M2, respectively:
| (2) |
| (3) |
where X is covariates with the first element being 1 for the intercept; the error terms and are independent and normally distributed with mean zero and respective variances, and . We propose the following additive hazard model for the outcome :
| (4) |
where is the hazard of developing liver cancer for subject ; is the baseline hazard; and , , and are regression coefficients for the covariates (X without the first element), the baseline HCV viral load S, the baseline HBV viral load M1 and the follow-up HBV viral load M2, respecitvely. Based on the six assumptions in the Definitions and Assumptions section one can express the counterfactual hazard as:
where . Derivation of the above expression is in eAppendix. The model for the second mediator (3) and the survival model (4) focus on the main effects, and they can incorporate S-by-M1 and S-by-M2 cross-product interaction terms by replacing , and with , and , respectively. We then use the definition in (1) to re-expressed path-specific effects on the scale of hazard difference by using the above result:
| (5) |
The results in (5) have intuitive interpretations and can be easily visualized using the DAG in Figure 1. Each arrow in Figure 1 has its corresponding effect parameter in models (2)–(4): represents the effect of the baseline HCV viral load S on the baseline HBV viral load M1; and respectively represent the effects of the baseline HCV viral load S and the baseline HBV viral load M1 on the follow-up HBV viral load M2; , , and respectively represent the effects of S, M1 and M2 on the hazard of developing liver cancer. The path of has only one arrow with effect parameter . has two arrows: and with respective effect parameters being and , and the path-specific effect is the product of the two parameters . contains two paths: and . The path consists of three arrows: , and with effect parameters being , and , respectively; the path consists of two arrows: and with effect parameters being and , respectively. The effect of is the sum of and , which are the products of effect parameters along the two paths.
Total effect, defined as , can be expressed as the sum of the three path-specific effects: . The additive hazard model (4) can incorporate time-dependent effects by generalizing , , , and to , , , and , respectively.
Cox proportional hazard model
Unlike additive hazard models, which assume hazard linearly determined by the predictors, Cox models assume that the hazard is determined by the predictors exponentially (or linearly on the log hazard scale):
| (6) |
where , , , and are regression coefficients for , S, M1, and M2, respectively. Provided that the assumptions in the Definitions and Assumptions section hold and the outcome event is rare, one can approximate the counterfactual log hazard as:
where . Derivation of the above expression is provided in the eAppendix (Section A5). Again, it can be extended to incorporate S-by-M1 and S-by-M2 cross-product interaction terms by replacing , , and in (3) and (6) with , , and , respectively. We let , and re-express the three path-specific effects in (1) as effects on log hazard ratio by using the above expression:
| (7) |
Similar to mediation analyses using Aalen additive hazard models, one can visualize the three path-specific effects as products of parameters in Figure 1. Total effect is sum of the three path-specific effects:
Variances and confidence intervals for and can be calculated using a resampling method that takes random draws from multivariate normal distribution of estimates for or 13,28 with detail provided in the eAppendix (Sections A4 and A5).
Probit model
For completeness as well as comparison with the above two models, we present another multi-mediator model that has been published34. This model proposes a semiparametric probit model for the survival time:
| (8) |
where the outcome is a nonparametric transformation of the survival time T; is a standard normal random variable, independent of and ; and , , and are regression coefficients for the covariates X, the baseline HCV viral load S, the baseline HBV viral load M1 and the follow-up HBV viral load M2, respectively. By the assumptions in Section 2, one can show that
The derivation is in the eAppendix (Section A3). Similar to the additive hazard and proportional hazard models, it can be extended to incorporate S-by-M1 and S-by-M2 cross-product interaction terms by replacing , , and in (3) and (8) with , , and , respectively. By letting and using the above result, the path-specific effects defined in (1) can be expressed as:
| (9) |
Note that the three path-specific effects are effects on the difference in the transformed survival time. Similar to the other two models, the three path-specific effects can also be visualized as products of parameters in Figure 1.
Next we present another set of path-specific effects, the difference in survival probability. Note that the survival probability in the motivating hepatitis study represents the probability that a subject has not yet developed liver cancer. Since , , and are all normally distributed, one can further show that the distribution function for the survival time T, is conjugate with the distributions for M2 and M1. The counterfactual outcome defined as a cumulative distribution function of counterfactual survival time can be expressed as:
where and is the baseline cumulative hazard (see eAppendix for the derivation). Therefore, by letting , we obtain another set of path-specific effects that characterizes the effects on entire survival probability as a function of the follow-up time:
| (10) |
The difference in survival probability is a very general effect because other effect scales such as the average survival time and the hazard are functions of the survival probability. , , ′s, ′s, ′s all can be estimated consistently with least square estimators and a nonparametric maximum likelihood estimator. It follows that path-specific effects can be estimated with the closed form formula in (9) and (10) by plugging in the estimates. Total effect is defined as and can be expressed as and , respectively. Variances and confidence intervals for and can be calculated using the non-parametric maximum likelihood estimator and the functional delta method34,35.
The proposed method for mediation analyses using semiparametric probit models has been implemented in Matlab code, and those using Aalen additive hazard models and Cox proportional hazard models have been implemented in R code. We term these methods M3S (Multi-Mediation Models for Survival data). Relevant code is available on our website (http://www.stat.sinica.edu.tw/ythuang/M3S-Probit.zip; http://www.stat.sinica.edu.tw/ythuang/M3S-Cox%20and%20M3S-Aalen.zip). R scripts for the Aalen and Cox models are also in the eAppendix (Section A7).
DATA APPLICATION
Details of the study design are provided in eAppendix A6. The ethical review is not required for the secondary analyses of the existing and de-identified data. We first conducted one-mediator analyses, similar to Huang et al (2016)15, to examine the effect of the HCV viral load (S) on the incidence of liver cancer (Y) mediated through the follow-up HBV viral load (M). Natural direct effect, natural indirect effect, and total effect for the HCV viral load increasing from the minimum to the first quartile of the detectable log-transformed viral level are presented in Table 1. Mediation analyses using probit models estimated that an increase in the HCV viral load decreased the transformed survival time using the natural direct effect (−0.32 (95% confidence interval [CI]: −0.57, −0.076)), which is not through HBV, but increased by the natural indirect effect (0.19 (95% CI: 0.12, 0.26)); the opposite natural direct and natural indirect effects masked each other in the total effect (−0.13 (95% CI: −0.38, 0.12)). We noted that the non-parametric transformation made it less intuitive to interpret the effects in absolute units such as months. Results using Aalen additive hazard models and Cox proportional hazard models revealed a similar pattern (Table 1). While the three models provided similar results under different effect scales, probit models can further characterize effects on the survival probability as a function of the follow-up time. The natural direct and indirect effects, respectively, decreased and increased the survival probability from getting liver cancer monotonically across the follow-up time: for an increase from the minimum to the first quartile of the detectable HCV viral level, the effect independent of the follow-up HBV DNA (natural direct effect) decreased the 15-year probability of not having an HCC event by 0.3%, and the effect mediated by the follow-up HBV DNA (natural indirect effect) increased the probability by 0.18% (Figure 2a). Again, the opposite effects masked each other in total and marginal effects (Figure 2b) where the marginal effect was estimated from the probit model that simply regressed on HCV viral load S, adjusting for covariates X. Besides the total effect, the marginal effect was another estimate for the overall effect, which did not decompose the effect into the natural direct and indirect effects; but similar to the total effect, the marginal effect was also conditional on X.
Table 1.
Natural direct, natural indirect, and total effects of hepatitis C viral load (increase from the minimum to the first quartile of the detectable HCV viral level) on liver cancer incidence mediated through the follow-up HBV viral load.
| Effect Estimate | 95% Confidence Interval | |
|---|---|---|
| Probit; Effect scale: Difference in transformed survival time | ||
| Natural Direct Effect | −0.32 | (−0.57, −0.076) |
| Natural Indirect Effect | 0.19 | (0.12, 0.26) |
| Total Effect | −0.13 | (−0.38, 0.12) |
|
| ||
| Aalen; Effect scale: Difference in hazard (per 1000 person-year) | ||
| Natural Direct Effect | 0.84 | (−0. 066, 1.75) |
| Natural Indirect Effect | −0.36 | (−0. 53, −0. 21) |
| Total Effect | 0. 49 | (−0. 43, 1.40) |
|
| ||
| Cox; Effect scale: Hazard ratio | ||
| Natural Direct Effect | 1.14 | (1.03, 1.26) |
| Natural Indirect Effect | 0.92 | (0.89, 0.95) |
| Total Effect | 1.05 | (0.95, 1.16) |
HCV indicates hepatitis C virus, HBV hepatitis B virus.
Figure 2.
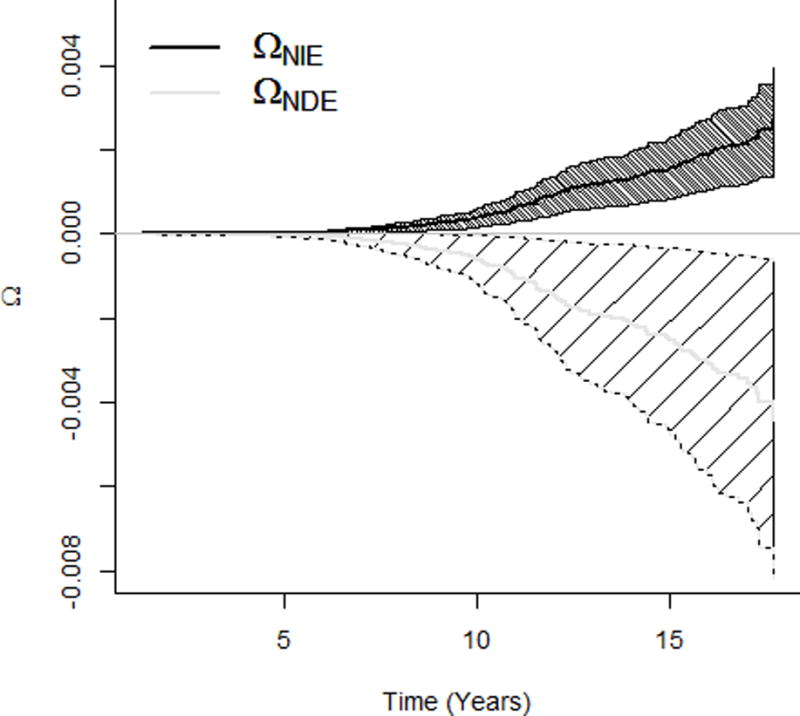
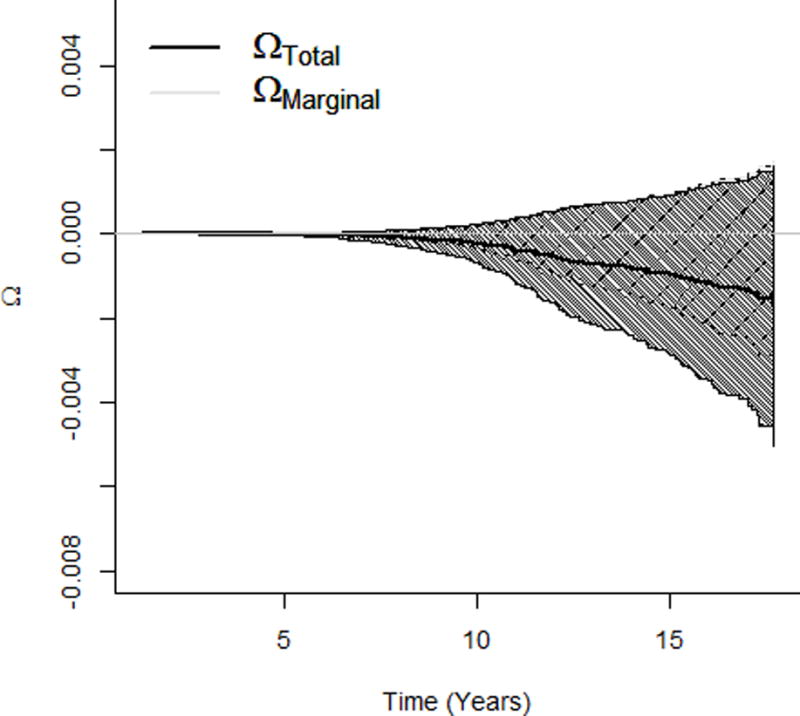
Effects of the HCV viral load (increasing from the minimum to the first quartile of the detectable HCV viral level) on survival probability of the liver cancer incidence. a. NDE and NIE on survival probability of getting liver cancer. b. Total and marginal effects on survival probability. HCV indicates hepatitis C virus, NDE natural direct effect, NIE natural indirect effect.
According to the epidemiology of hepatitis in Taiwan, most dual infected participants were chronic hepatitis B carriers superinfected by HCV17,20. The literature supports the assumption that HBV is suppressed by the superimposed HCV18,19,21–23. Therefore, the HCV (S)-induced baseline HBV viral load (M1) may be a common cause of the follow-up HBV viral load (M2) and the outcome (Y) (Figure 1), which violates the identifiability assumption in the single-mediator model. To address the issue, we resorted to the two-mediator model investigating path-specific effects26 (Table 2). In analyses using Cox models, an increase in the HCV viral load increased the risk of liver cancer through the mechanism of with a hazard ratio of 1.17 (95% CI: 1.06, 1.29), but decreased the risk through the mechanism of with a hazard ratio of 0.91 (95% CI: 0.88, 0.94); the HCV viral load did not change the risk through the mechanism only mediated by the follow-up HBV viral load ( : 1.00 (95% CI: 0.99, 1.01)); and the total effect was 1.06 (95% CI: 0.96, 1.18). Probit models characterized path-specific effects on the entire survival function, which suggests that and , respectively decreased and increased the survival probability (from getting liver cancer) monotonically across the follow-up time; covered the probability difference of zero; and the three effects masked each other in total and marginal effects (Figure 3a and b).
Table 2.
Path-specific effects and total effects of HCV viral load (S) increase from the minimum to the first quartile of the detectable HCV viral level) on liver cancer incidence (Y) mediated through the baseline HBV viral load (M1) and the follow-up HBV viral load (M2).
| Effect Estimate | 95% Confidence Interval | ||
|---|---|---|---|
| Probit model; Effect scale: Difference in transformed survival time | |||
|
|
−0.32 | (−0.57, −0.073) | |
|
|
0.0042 | (−0.018, 0.026) | |
|
|
0.19 | (0.12, 0.26) | |
|
|
−0.13 | (−0.38, 0.13) | |
|
| |||
| Aalen model; Effect scale: Difference in hazard (per 1000 person-year) | |||
|
|
0. 92 | (0.021, 1.82) | |
|
|
−0.010 | (−0.067, 0.044) | |
|
|
−0. 42 | (−0. 60, −0.27) | |
|
|
0. 49 | (−0. 43, 1.40) | |
|
| |||
| Cox model; Effect scale: Hazard ratio | |||
|
|
1.17 | (1.06, 1.29) | |
|
|
1.00 | (0.99, 1.01) | |
|
|
0.91 | (0.88, 0.94) | |
|
|
1.06 | (0.96, 1.18) | |
HCV indicates hepatitis C virus, HBV hepatitis B virus.
Figure 3.
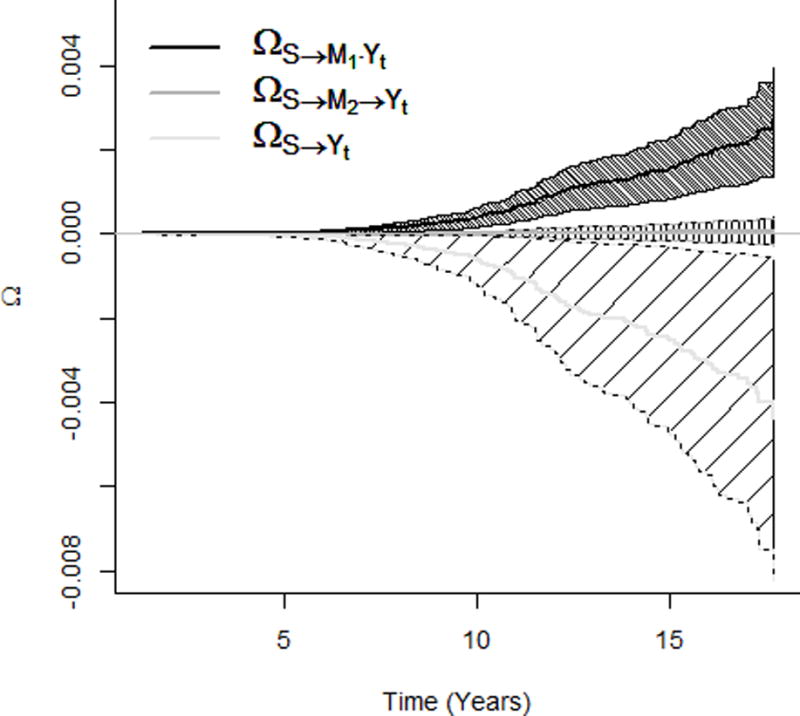
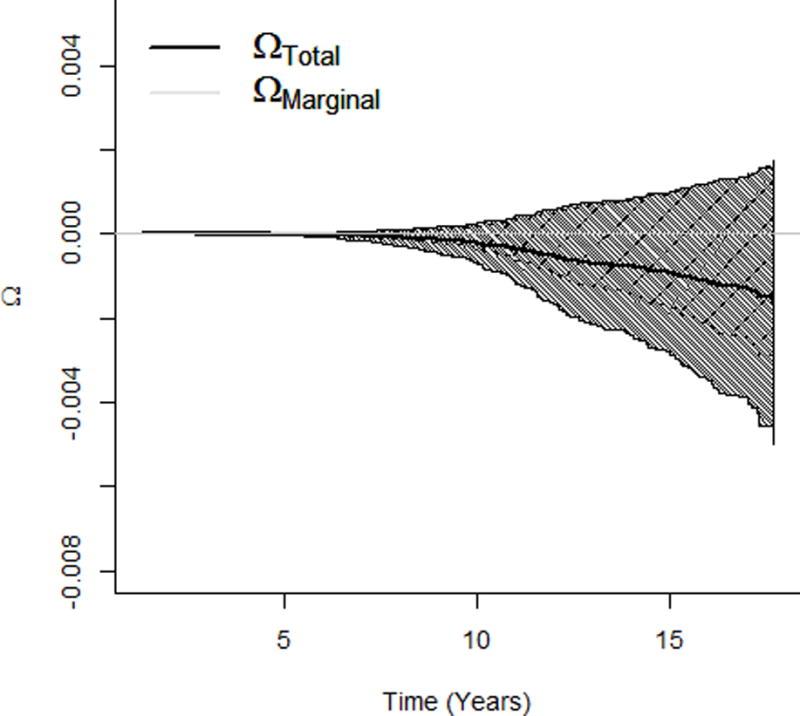
Effects of the HCV viral load (increasing from the minimum to the first quartile of the detectable HCV viral level) on survival probability of the liver cancer incidence. a. Path-specific effects on survival probability of getting liver cancer. b. Total and marginal effects on survival probability of getting liver cancer. HCV indicates hepatitis C virus.
The nonparametric transformation function depicted in Figure 4 is a monotonically increasing function with slight non-linearity and was estimated as a step function using the nonparametric maximum likelihood estimator34. The normality assumption was also evaluated for probit models using a bootstrap procedure34, which revealed no departure from the normal distribution.
Figure 4.
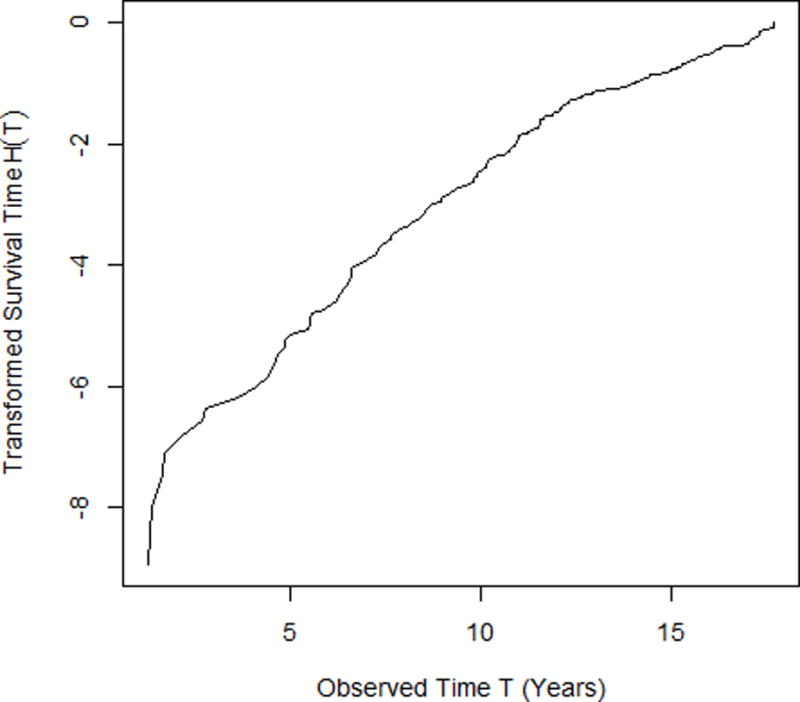
The transformed survival time H(T) versus the observed survival time T under the semiparametric probit model in (8).
DISCUSSION
We present multi-mediator analyses under semiparametric probit models, additive hazard models, and Cox proportional hazard models and provide closed-form expressions for path-specific effects. The closed-form expression for Cox models can only be obtained under the rare-outcome assumption, which may be a limitation for its application. Mediation analyses under additive hazard models and Cox models characterize effects on specific scales; additive hazard models focus on the hazard difference and Cox models focus on the log hazard ratio. Probit models examine the effect on the transformed survival time difference as well as the difference in survival probability across the follow-up time. The closed-form expressions under the three models have intuitive interpretations using a causal diagram labeled with effect parameters on each arrow. Effects estimated from the three models convey complementary information. The effect on survival probability by probit models is very general and may be used to estimate any summary outcome such as average survival time or 5-year survival risk. The effects estimated using probit models is in the opposite direction compared to the other two models because probit models characterize the difference in survival time and survival probability, which is qualitatively the opposite of the hazard difference or the hazard ratio. Because of the lack of conjugacy between product of normal and normal distributions, we may not be able to provide closed-form expressions for a mediator-by-mediator interaction effect (e.g., ) or a non-linear mediator effect (e.g., ). One may have to utilize the simulation-based approach to approximate these effects33. In the hepatitis study, there was no evidence for such effects.
Causal multi-mediator models have several advantages. First, models with multiple mediators are able to characterize more comprehensive mechanistic structure. It is often not plausible to assume that the effect of an exposure on an outcome is mediated only by a single mediator. Secondly, path-specific effects in multi-mediator models constitute an approach to address identifiability issue due to the undue influence by the exposure-induced mediator-outcome confounder26, e.g., the baseline HBV viral load in the hepatitis study. Finally, being able to incorporate more potential mediators renders the identifiability assumptions (5) and (6) more plausible25 because the inclusion of additional mediators makes it less likely to miss alternative pathways from the exposure to the outcome.
The analyses of the hepatitis study were limited to participants with no missing data on the hepatitis B and C viral load and covariates, and assumed that the viral load was accurately measured. Mediation analyses accounting for missing data and measurement error have been developed36,37, but how to incorporate in the proposed multi-mediator analyses for survival outcomes may require additional development.
The finding that had stronger effects than may not exclude the possibility that the follow-up HBV DNA is a mediator since contains the effect mediated by both baseline and follow-up HBV DNA levels. However, our analyses does not support that there existed an effect mediated only through the follow-up HBV. The finding has an important public health implication: Taiwanese patients with dual infection of hepatitis B and C may not require more intensive follow-up for HBV activity than those with HBV single infection if their baseline HBV viral load is low. Analytically, one may propose a mediation model with the baseline and follow-up HBV viral load as a single set of mediators, and interrogates the longitudinal mediation effect through HBV38. Such analyses evaluate an overall mediation effect but would not be able to provide the respective effect measures of different mechanisms/paths.
Supplementary Material
Acknowledgments
Sources of Financial Support: NIH/NCI 5R03CA 182937-02, NIH/NIA 1R01AG048825-01
Footnotes
Availability of Data and Code: Computation code and data are available at http://www.stat.sinica.edu.tw/ythuang/M3S-Cox%20and%20M3S-Aalen.zip and http://www.stat.sinica.edu.tw/ythuang/M3S-Probit.zip.
Conflict of Interest: NA
References
- 1.Baron RM, Kenny DA. The moderator-mediator variable distinction in social psychological research: conceptual, strategic, and statistical considerations. J Pers Soc Psychol. 1986;51(6):1173–82. doi: 10.1037//0022-3514.51.6.1173. [DOI] [PubMed] [Google Scholar]
- 2.MacKinnon D. Introduction to statistical mediation analysis. New York: Taylor and Francis; 2008. [Google Scholar]
- 3.Huang YT, Freeman JR, Yang HI, Liu J, Lee MH, Chen CJ. Mediation effect of hepatitis B and C on mortality. Eur J Epidemiol. 2016 doi: 10.1007/s10654-016-0118-x. [DOI] [PubMed] [Google Scholar]
- 4.Pan WC, Wu CD, Chen MJ, Huang YT, Chen CJ, Su HJ, Yang HI. Fine Particle Pollution, Alanine Transaminase, and Liver Cancer: A Taiwanese Prospective Cohort Study (REVEAL-HBV) J Natl Cancer Inst. 2016;108(3) doi: 10.1093/jnci/djv341. [DOI] [PubMed] [Google Scholar]
- 5.Song Y, Huang YT, Song Y, Hevener AL, Ryckman KK, Qi L, LeBlanc ES, Kazlauskaite R, Brennan KM, Liu S. Birthweight, mediating biomarkers and the development of type 2 diabetes later in life: a prospective study of multi-ethnic women. Diabetologia. 2015;58(6):1220–30. doi: 10.1007/s00125-014-3479-2. [DOI] [PMC free article] [PubMed] [Google Scholar]
- 6.VanderWeele TJ, Asomaning K, Tchetgen Tchetgen EJ, Han Y, Spitz MR, Shete S, Wu X, Gaborieau V, Wang Y, McLaughlin J, Hung RJ, Brennan P, Amos CI, Christiani DC, Lin X. Genetic variants on 15q25.1, smoking, and lung cancer: an assessment of mediation and interaction. Am J Epidemiol. 2012;175(10):1013–20. doi: 10.1093/aje/kwr467. [DOI] [PMC free article] [PubMed] [Google Scholar]
- 7.Liu Y, Aryee MJ, Padyukov L, Fallin MD, Hesselberg E, Runarsson A, Reinius L, Acevedo N, Taub M, Ronninger M, Shchetynsky K, Scheynius A, Kere J, Alfredsson L, Klareskog L, Ekstrom TJ, Feinberg AP. Epigenome-wide association data implicate DNA methylation as an intermediary of genetic risk in rheumatoid arthritis. Nat Biotechnol. 2013;31(2):142–7. doi: 10.1038/nbt.2487. [DOI] [PMC free article] [PubMed] [Google Scholar]
- 8.Rubin D. Bayesian inference of causal effects. Annals of Statistics. 1978;6:34–58. [Google Scholar]
- 9.Pearl J. Direct and indirect effects Seventeenth Conference on Uncertainty and Artificial Intelligence. San Francisco, CA: Morgan Kaufmann; 2001. pp. 411–420. [Google Scholar]
- 10.Robins JM, Greenland S. Identifiability and exchangeability for direct and indirect effects. Epidemiology. 1992;3(2):143–55. doi: 10.1097/00001648-199203000-00013. [DOI] [PubMed] [Google Scholar]
- 11.Imai K, Keele L, Tingley D. A general approach to causal mediation analysis. Psychol Methods. 2010;15(4):309–34. doi: 10.1037/a0020761. [DOI] [PubMed] [Google Scholar]
- 12.Vanderweele TJ, Vansteelandt S. Odds ratios for mediation analysis for a dichotomous outcome. Am J Epidemiol. 2010;172(12):1339–48. doi: 10.1093/aje/kwq332. [DOI] [PMC free article] [PubMed] [Google Scholar]
- 13.Lange T, Hansen JV. Direct and indirect effects in a survival context. Epidemiology. 2011;22(4):575–81. doi: 10.1097/EDE.0b013e31821c680c. [DOI] [PubMed] [Google Scholar]
- 14.VanderWeele TJ. Causal mediation analysis with survival data. Epidemiology. 2011;22(4):582–5. doi: 10.1097/EDE.0b013e31821db37e. [DOI] [PMC free article] [PubMed] [Google Scholar]
- 15.Huang YT, Yang HI, Liu J, Lee MH, Freeman JR, Chen CJ. Mediation Analysis of Hepatitis B and C in Relation to Hepatocellular Carcinoma Risk. Epidemiology. 2016;27(1):14–20. doi: 10.1097/EDE.0000000000000390. [DOI] [PubMed] [Google Scholar]
- 16.Huang YT, Jen CL, Yang HI, Lee MH, Su J, Lu SN, Iloeje UH, Chen CJ. Lifetime risk and sex difference of hepatocellular carcinoma among patients with chronic hepatitis B and C. J Clin Oncol. 2011;29(27):3643–50. doi: 10.1200/JCO.2011.36.2335. [DOI] [PMC free article] [PubMed] [Google Scholar]
- 17.Chen CJ, Wang LY, Yu MW. Epidemiology of hepatitis B virus infection in the Asia-Pacific region. J Gastroenterol Hepatol. 2000;15(Suppl):E3–6. doi: 10.1046/j.1440-1746.2000.02124.x. [DOI] [PubMed] [Google Scholar]
- 18.Koike K, Yasuda K, Yotsuyanagi H, Moriya K, Hino K, Kurokawa K, Iino S. Dominant replication of either virus in dual infection with hepatitis viruses B and C. J Med Virol. 1995;45(2):236–9. doi: 10.1002/jmv.1890450222. [DOI] [PubMed] [Google Scholar]
- 19.Liaw YF. Role of hepatitis C virus in dual and triple hepatitis virus infection. Hepatology. 1995;22(4 Pt 1):1101–8. doi: 10.1016/0270-9139(95)90615-0. [DOI] [PubMed] [Google Scholar]
- 20.Lu SN, Chen HC, Tang CM, Wu MH, Yu ML, Chuang WL, Lu CF, Chang WY, Chen CJ. Prevalence and manifestations of hepatitis C seropositivity in children in an endemic area. Pediatr Infect Dis J. 1998;17(2):142–5. doi: 10.1097/00006454-199802000-00012. [DOI] [PubMed] [Google Scholar]
- 21.Schuttler CG, Fiedler N, Schmidt K, Repp R, Gerlich WH, Schaefer S. Suppression of hepatitis B virus enhancer 1 and 2 by hepatitis C virus core protein. J Hepatol. 2002;37(6):855–62. doi: 10.1016/s0168-8278(02)00296-9. [DOI] [PubMed] [Google Scholar]
- 22.Shih CM, Lo SJ, Miyamura T, Chen SY, Lee YH. Suppression of hepatitis B virus expression and replication by hepatitis C virus core protein in HuH-7 cells. J Virol. 1993;67(10):5823–32. doi: 10.1128/jvi.67.10.5823-5832.1993. [DOI] [PMC free article] [PubMed] [Google Scholar]
- 23.Tsiquaye KN, Portmann B, Tovey G, Kessler H, Hu S, Lu XZ, Zuckerman AJ, Craske J, Williams R. Non-A, non-B hepatitis in persistent carriers of hepatitis B virus. J Med Virol. 1983;11(3):179–89. doi: 10.1002/jmv.1890110302. [DOI] [PubMed] [Google Scholar]
- 24.Avin C, Sphitser I, Pearl J. Identifiability of path-specific effects. International Joint Conference on Artificial Intelligence; Edinburgh, Scotland. 2005. pp. 357–363. [Google Scholar]
- 25.VanderWeele TJ, Vansteelandt S. Mediation Analysis with Multiple Mediators. Epidemiol Method. 2014;2(1):95–115. doi: 10.1515/em-2012-0010. [DOI] [PMC free article] [PubMed] [Google Scholar]
- 26.Vanderweele TJ, Vansteelandt S, Robins JM. Effect decomposition in the presence of an exposure-induced mediator-outcome confounder. Epidemiology. 2014;25(2):300–6. doi: 10.1097/EDE.0000000000000034. [DOI] [PMC free article] [PubMed] [Google Scholar]
- 27.Albert JM, Nelson S. Generalized causal mediation analysis. Biometrics. 2011;67(3):1028–38. doi: 10.1111/j.1541-0420.2010.01547.x. [DOI] [PMC free article] [PubMed] [Google Scholar]
- 28.Huang YT, Pan WC. Hypothesis test of mediation effect in causal mediation model with high-dimensional continuous mediators. Biometrics. 2016;72(2):402–413. doi: 10.1111/biom.12421. [DOI] [PubMed] [Google Scholar]
- 29.Aalen O. A model for non-parametric regression analysis of counting process. In: Klonecki W, Kozek A, Rosinki J, editors. Lecture Notes in Statistics, Mathematical Statistics and Probability Theory. New York: Springer-Verlag; 1980. pp. 1–25. [Google Scholar]
- 30.Cox D. Regression models and life-tables. Journal of the Royal Statistical Society, Series B. 1972;34:187–220. [Google Scholar]
- 31.Wei LJ. The accelerated failure time model: a useful alternative to the Cox regression model in survival analysis. Stat Med. 1992;11(14–15):1871–9. doi: 10.1002/sim.4780111409. [DOI] [PubMed] [Google Scholar]
- 32.Tchetgen Tchetgen EJ. On causal mediation analysis with a survival outcome. Int J Biostat. 2011;7(1) doi: 10.2202/1557-4679.1351. Article 33. [DOI] [PMC free article] [PubMed] [Google Scholar]
- 33.Lange T, Rasmussen M, Thygesen LC. Assessing natural direct and indirect effects through multiple pathways. Am J Epidemiol. 2014;179(4):513–8. doi: 10.1093/aje/kwt270. [DOI] [PubMed] [Google Scholar]
- 34.Huang YT, Cai T. Mediation analysis for survival data using semiparametric probit models. Biometrics. 2016;72(2):563–574. doi: 10.1111/biom.12445. [DOI] [PubMed] [Google Scholar]
- 35.Zeng D, Lin D. Maximum Likelihood Estimation in Semiparametric Models with Censored Data. Journal of the Royal Statistical Society, Series B. 2007;69(4):507–564. [Google Scholar]
- 36.Zhang Z, Wang L. Methods for mediation analysis with missing data. Psychometrika. 2013;78(1):154–84. doi: 10.1007/s11336-012-9301-5. [DOI] [PubMed] [Google Scholar]
- 37.VanderWeele TJ, Valeri L, Ogburn EL. The role of measurement error and misclassification in mediation analysis: mediation and measurement error. Epidemiology. 2012;23(4):561–4. doi: 10.1097/EDE.0b013e318258f5e4. [DOI] [PMC free article] [PubMed] [Google Scholar]
- 38.Bind MA, Vanderweele TJ, Coull BA, Schwartz JD. Causal mediation analysis for longitudinal data with exogenous exposure. Biostatistics. 2016;17(1):122–34. doi: 10.1093/biostatistics/kxv029. [DOI] [PMC free article] [PubMed] [Google Scholar]
Associated Data
This section collects any data citations, data availability statements, or supplementary materials included in this article.


