

Abstract
Little is known on how sensing of energy needs is centrally represented, integrated, and translated into the behavioral aspects of energy homeostasis. Fat free mass (FFM) is the major determinant of energy expenditure. We investigated how interindividual variances in FFM relate to neuronal activity in humans. Healthy adults (n = 64, 21F/43M; age 31.3 ± 9.1y; percentage of body fat [PFAT] 25.6 ± 10.7%; BMI 30.4 ± 9) underwent a 36h fast and subsequent H2 15O positron emission tomographic (PET) measurement of regional cerebral blood flow (rCBF). Multiple variable regression analysis revealed significant associations of FFM with rCBF within the midbrain [including parts of the periaqueductal gray (PAG), ventral tegmental area (VTA), thalamic and hypothalamic regions], the bilateral parahippocampal region, left anterior cingulate, left insular cortex, right cerebellum, and distinct regions within the temporal and occipital cortex. In contrast, no significant associations were found for fat mass (FM). We investigated the potential functional‐anatomical link between FFM and central regulation of food intake by performing a conjunction analysis of FFM and the perceived hunger feelings. This showed a significant overlap within the midbrain PAG. Mediation analysis demonstrated a significant indirect effect of FFM on hunger with PAG rCBF as mediator. Most regions we found to be associated with FFM form part in ascending homeostatic pathways and cortical circuitries implicated in the regulation of basic bodily functions indicating a potential role of these central networks in the integration of FFM determined energy needs. Hum Brain Mapp 36:2406–2415, 2015. © 2015 Wiley Periodicals, Inc.
Keywords: energy homeostasis, hunger, brain, body composition, regional cerebral blood flow
INTRODUCTION
Sensing of energy needs is crucial to body weight regulation. Energy homeostasis demands that the body seeks sufficient amounts of energy (i.e., food) to prevent starvation and loss of body mass [Keesey and Powley, 2008]. Recent evidence indicates that fat‐free body mass (FFM), and not fat mass (FM), is predictive of both self determined meal size [Blundell et al., 2012] and ad‐libitum food intake [Weise et al., 2014] in humans. This appears intuitively correct, considering that FFM is the major determinant of energy expenditure, accounting for >80% of the variance in resting metabolic rate (RMR) [Ravussin et al., 1982; Ravussin et al., 1986] and maximal oxygen uptake [Goran et al., 2000]. Numerous mechanisms have been identified that relate to both short and long‐term regulation of energy balance and food intake (e.g., adipokines, gut‐brain axis, gut and central peptides) [Berthoud and Morrison, 2008; Moran and Ladenheim, 2011]. However, the current knowledge on the regulation of food intake does not yet provide a complete biological explanation on how the brain receives and integrates information of how much body mass needs to be sustained and how this in turn is translated into behavioral aspects of energy homeostasis.
Analyzing the relationship between measures of body composition and regional gray matter volume (GMV) in a sample of 76 healthy adults, we previously found that FFM but not FM is negatively associated with reduced GMV in cortical brain regions associated with autonomic and homeostatic regulation, including medial prefrontal cortical areas (i.e., BA25, BA32, BA10) distinct temporal cortical regions (particularly the right temporal pole) and the left insular cortex [Weise et al., 2013]. Anatomical labeling studies have shown that medial prefrontal cortical regions are densily connected with autonomic core structures, including hypothalamic nuclei, the midbrain periaqueductal gray (PAG), and the parabrachial nucleus. These structures are deemed to form central networks engaged in the regulation of basal bodily functions [Carmichael and Price, 1996; Ongür et al., 2003; Ongür and Price, 2000; Price, 1999; Price, 2007; Saleem et al., 2008]. Similar and related structures may also play important roles in the central representation of the physiological state of the body. This interoceptive system has been described in detail by Craig et al. and involves homeostatic pathways with afferents arising from lamina I of the spinothalamic tract, conducting information about the physiological condition of all tissue types (e.g., metabolic, mechanical, and thermal status) to homeostatic centers within the parabrachial nucleus, hypothalamus, and PAG, and to higher cortical centers in the insula and anterior cingulate (ACC) where homeostatic information is integrated and modulated for goal directed behavior [Craig, 2003; Craig, 2009].
In this study, we analyzed 64 subjects with a wide range of adiposity, who underwent a 36 h fast and subsequent H2 15O positron emission tomographic (PET) measurement of regional cerebral blood flow (rCBF, resting condition). We hypothesized that FFM as the major determinate of energy expenditure, independently of FM, would be associated with increased rCBF in brain regions implicated in autonomic and homeostatic regulation (i.e., midbrain regions, thalamus, hypothalamus, cingulate cortices, insula, and the temporal pole). In a second step, we attempted to identify regions that were similarly associated with FFM and the subjective feeling of hunger. After demonstrating a strong overlap of activation in the midbrain for FFM and hunger, mediation analysis was applied to investigate a potential relationship between FFM, midbrain activity, and hunger.
SUBJECT AND METHODS
Subjects
Our study included 64 healthy adult subjects (78.1% European Americans; 10.9% African Americans; 7.8% Latino Americans; 3.1% Asian Americans) with a wide range of adiposity (21F/43M; age 31.3 ± 9.1y; percentage of body fat [PFAT] 25.6 ± 10.7%; BMI 30.4 ± 9) with available H2 15O PET and dual energy x‐ray absorptiomery (DXA) scans who had participated in our study of neuroimaging, hunger, satiation, and the predisposition to obesity. Individuals with a history of addiction and substance abuse (including alcohol), endocrine disorders (including type 2 diabetes), hypertension, pulmonary, cardiovascular, gastrointestinal, hepatic, renal, central nervous system, and psychiatric disorders were not eligible for this study. Any ongoing major health issues were ruled out by physical examination and screening laboratory tests. All volunteers provided a written informed consent and spent one week in the metabolic unit of the Phoenix Epidemiology and Clinical Reasearch Branch (PECRB) of the National Institute of Diabetes and Digestive and Kidney Diseases (NIDDK) in Phoenix, AZ. During the admission, subjects were restricted to sedentary activity only. The protocol had been approved by the Institutional Review Boards of the NIDDK and the Banner Good Samaritan Regional Medical Center and all applicable institutional and governmental regulations concerning the ethical use of human volunteers were followed during this research.
Experimental Procedures
Details of the experimental procedures have been described elsewhere [Tataranni et al., 1999]. In brief, after admission to our research unit, all subjects were placed on a weight maintaining diet (50% of calories from carbohydrate, 30% fat, and 20% protein). Body composition was assessed by dual energy x‐ray absorptiomery (DPX‐1; Lunar Corp, Madison, WI). Prior to the brain imaging session, subjects fasted for 36 hr to standardize and increase the state of hunger. All participants had free access to water and noncaloric, noncaffeinated beverages during the fast.
Imaging Procedures
All imaging procedures were performed at the Banner Good Samaritan Regional Medical Center (Phoenix, AZ). Two H2 15O water positron emission tomographic measurements of regional cerebral blood flow (counts/voxel/min) were performed on an ECAT‐951/31 scanner (Siemens, Knoxville, TN) after a 36 h fast. To adjust for attenuation of γ‐radiation by the brain and skull, a 10 min transmission scan was performed using a retractable external ring source of 68Ga/68Ge. Subjects were instructed to remain motionless in the supine position and to keep their eyes closed and pointing forward. Subjects received a 50‐mCi intravenous bolus of 15O‐water during each scan. Blood samples for metabolite analysis were immediately drawn after each scan and subjective hunger ratings were evaluated by using an anchored 100‐mm visual analog scale, ranging from 0 (“not hungry at all”) to 100 (“extremely hungry”) [Raben et al., 1995].
Metabolite Analysis
Plasma fasting glucose concentrations were measured by the glucose oxidase method (Beckman Instruments, Fullerton, CA) and plasma fasting insulin concentrations were determined by an automated radioimmunoassay (Concept 4; ICN, Costa Mesa, CA). Fasting insulin concentrations were log‐transformed for analysis.
Image Data Analysis
PET scans were aligned and spatially normalized to the standard Montreal Neurological Institute (MNI) stereotactic space and slightly smoothed with a 4 mm Full Width at Half Maximum (FWHM) Gaussian Kernel [Friston et al., 1995]. Statistical image analysis was performed on the average of both scans for each subject, using statistical parametric mapping package (SPM8) and the Threshold‐Free Cluster Enhancement (TFCE) toolbox (dbm.neuro.uni‐jena.de). TFCE is a nonparametric permutation‐based approach for statistical thresholding, that does not require defining arbitray voxel‐wise or cluster thresholds and works well with no or little spatial presmoothing [Smith and Nichols, 2009]. Results of the TFCE based analysis (5000 permutations) were considered significant at P < 0.05 FWE corrected for the entire brain volume or after small volume correction of a‐priori hypothesized brain regions using anatomical masks generated by the WFU‐Pickatlas toolbox (http://www.fmri.wfubmc.edu). For all analyses FFM, FM, height, age, and sex were entered as individual regressors in a multiple variable regression model. Plasma insulin and glucose concentrations were also included as covariates, in order to account for well‐known influences of metabolic and endocrine factors on neuronal activity (e.g., [Bie‐Olsen et al., 2009; Heni et al., 2014; Kullmann et al., 2013; Page et al., 2013]). The study sample was predominantly righthanded except for four individuals. Preliminary analyses did not indicate any effects of handedness and was, therefore, not considered in further analyses. Similary, exclusion of nonright‐handed individuals did not significantly change the results.
In addition, conjunction analysis (testing the global null hypothesis) of FFM and perceived hunger sensations was performed as implemented in SPM8 [Friston et al., 2005] after adding subjective hunger ratings to the multiple regression model. The global null hypothesis applies minimum t‐statistics and, in essence, tests for a similar directionality of associations across multiple contrasts. Results indicate that the individual contrasts are consistently high and jointly significant [Friston et al., 2005]. However, this does not imply that regions highlighted with this method reach significance when contrasts are analyzed separately at the given threshold (i.e., testing the conjunction null hypothesis as proposed by Nichols et al., 2005). For this study, we chose to apply the more sensitive global null conjunction, to guide further ROI based analyses. Since TFCE does not support conjunction analyses, we applied a voxelwise threshold of P < 0.001 and an extent threshold of 60 continuous voxels (0.4 cm3; voxelsize: 2 × 2 × 2 mm3). Results are reported as significant at P < 0.05 (FWE corrected for multiple comparisons).
Anatomical regions were defined using the BioImage Suite MNI to Talaraich Coordinate Converter (http://www.bioimagesuite.org) and the Talaraich Client v2.4.2 [Lancaster et al., 2000]. Results of the SPM analyses are displayed using the MRIcron software (http://www.mricro.com).
Mediation analysis of the relationship between FFM, hunger, and extracted midbrain rCBF data was performed within SAS statistical software, using a publicly available macro [Hayes, 2012]. The mediation model consisted of FFM as independent variable (x), hunger ratings as dependent variable (y) and extracted midbrain (i.e., PAG) rCBF values as the mediator (m). Adjustments were made for the same covariates as within SPM analyses (i.e., FM, height, age, sex, fasting glucose, and insulin concentrations). According to the general convention, paths were labeled as a (x‐>m), b (m‐>y), c/c' (x‐>y, total/direct effect) and ab (i.e., indirect effect, crossproduct of a and b). Significance of the mediation product was estimated based on a bias‐corrected bootstrap confidence interval (CI 99%; 20000 bootstrap samples).
RESULTS
Subject characteristics and anthropometric measures of our study group are listed in Table 1.
Table 1.
Characteristics of the study population
| n (female/male)* | 64 (21/43) |
|---|---|
| Age | 31.3 ± 9.1 (18.3–60.7) |
| Weight (kg) | 90.9 ± 26.2 (50.4–140.0) |
| Height (cm) | 173.4 ± 8.8 (158.0–191.0) |
| FFM (kg) | 65.6 ± 13.6 (38.7–94.0) |
| FM (kg) | 25.3 ± 15.6 (3.8–57.6) |
| PFAT % | 25.6 ± 10.7 (6.0–44.3) |
| BMI (kg*m−2) | 30.4 ± 9 (18.5–50.2) |
| Plasma glucose (mg/dl) | 80.8 ± 8.1 (62.5–99.5) |
| Plasma insulin (μU/ml) | 22.3 ± 5.4 (11.4–38.0) |
| Subjective hunger ratings | 73.5 ± 22.3 (16.0–100.0) |
All results apart from * are presented as mean ± SD, corresponding ranges in parentheses.
FFM, fat‐free mass; FM, fat mass; PFAT, percentage body fat; BMI, body mass index.
Only positive associations, not any negative ones, between FFM and rCBF were observed at the given thresholds. Results are illustrated and summarized in Figure 1 and Table 2 with corresponding local maxima, stereotactic locations, corrected P‐values and spatial extent. No suprathreshold assciations (either positive or negative) were found for FM.
Figure 1.
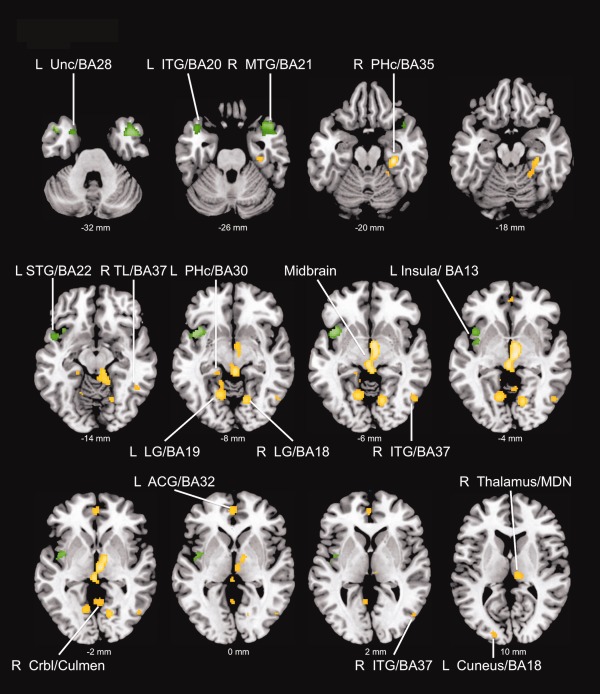
Positive associations between fat‐free mass and regional cerebral blood flow (results are displayed in the axial plane with corresponding locations on the z‐axis); Maps are thresholded at P < 0.05 FWE whole brain corrected (yellow) and P < 0.05 small volume corrected (green) using the threshold free cluster enhancement method (TFCE). R right, L left, BA Brodmann Area, Unc Uncus, ITG inferior temporal gyrus, MTG medial temporal gyrus, PHc Parahippocampus, STG superior temporal gyrus, TL temporal lobe, LG lingual gyrus, Crbl cerebellum, ACG anterior cingulate, MDN medial dorsal nucleus. [Color figure can be viewed in the online issue, which is available at http://wileyonlinelibrary.com.]
Table 2.
Results of SPM analyses
| MNIa coordinates | |||||
|---|---|---|---|---|---|
| Region, brodman area | x | y | z | P FWE | k |
| Positive associations of regional cerebra blood flow with fat‐free mass (FFM) | |||||
| Right parahippocampal gyrus, BA35 | 32 | −24 | −22 | 0.010 | 132 |
| Right cerebellum, Culmen | 22 | −46 | −18 | 0.048 | |
| Right thalamus/midbrain | 6 | −16 | −4 | 0.012 | 589 |
| Right midbrain | 4 | −4 | −6 | 0.013 | |
| Left midbrain | −2 | −26 | −4 | 0.015 | |
| Right lingual gyrus, Brodmann area 18 | 14 | −68 | −6 | 0.017 | 126 |
| Left lingual gyrus, Brodmann area 19 | −16 | −60 | −8 | 0.019 | 176 |
| Left cerebellum, Culmen | −14 | −48 | −10 | 0.033 | |
| Left anterior cingulate, Brodmann area 32 | −2 | 50 | 0 | 0.029 | 52 |
| Right inferior temporal gyrus, Brodmann area 37 | 52 | −66 | −6 | 0.034 | 46 |
| Right middle occipital gyrus, BA19 | 50 | −72 | 2 | 0.044 | |
| Right cerebellum, Culmen | 2 | −56 | −2 | 0.038 | 60 |
| Left posterior cingulate, BA30 | −6 | −56 | 4 | 0.041 | |
| Right temporal lobe, Subgyral, BA37 | 48 | −50 | −12 | 0.041 | 19 |
| Left cuneus, BA18 | −18 | −92 | 10 | 0.045 | 21 |
| Left parahippocampal gyrus, BA30 | −20 | −34 | −10 | 0.047 | 23 |
| Small volume corrected results | |||||
| Right temporal pole, Middle temporal gyrus, BA 21 | 44 | 8 | −30 | 0.004SVC | 314 |
| Right temporal pole, Superior temporal gyrus, BA38 | 46 | 16 | −26 | 0.006SVC | |
| Right temporal pole, Superior temporal gyrus, BA38 | 38 | 18 | −24 | 0.006SVC | |
| Left temporal pole, Inferior temporal gyrus, BA20 | −44 | 16 | −32 | 0.006SVC | 68 |
| Left anterior insula, BA13 | −42 | 14 | −8 | 0.011SVC | 115 |
| Left temporal pole, Superior temporal gyrus BA22 | −48 | 10 | −10 | 0.021SVC | 39 |
| Left temporal pole, Uncus, BA28 | −24 | 8 | −32 | 0.026SVC | 32 |
| Left middle insula, BA13 | −38 | 0 | −2 | 0.026SVC | 50 |
| Left, middle insula, BA13 | −46 | −10 | 4 | 0.049SVC | |
| Conjunction analysis of fat‐free mass and hunger (global null) | |||||
| L midbrain, Periaqueductal gray | −2 | −24 | −6 | 0.004VOX | 83 |
Associations are listed that survived a threshold of P < 0.05 TFCE FWE whole brain corrected unless otherwise indicated.
SVC TFCE FWE small volume corrected for ROI volume.
vox FWE whole brain corrected for multiple comparisons on the voxel‐level with a voxelwise threshold of P < 0.001.
a MNI: Montreal Neurological Institute. Bold data indicate primary peak within a cluster.
Nonbold data indicate secondary peaks.
FFM was significantly (TFCE FWE P < 0.05) associated with rCBF of the bilateral parahippocampus (PHc), most significantly with the rightsided PHc, extending to the cerebellum. A large cluster (Fig. 2) was observed in the mes‐ and diencephalon, comprising parts of the thalamus (i.e., right medial dorsal nucleus), right hypothalamus, right subthalamic nucleus, the ventral tegmental area (VTA), bilateral red nuclei, and the midbrain periaqueductal gray (PAG). FFM was also significantly associated with rCBF of the left perigenual anterior cingulate (ACC). Further associations were observed in the bilateral lingual gyrus, the left cuneus and the cerebellum. Within the temporal lobes, FFM was significantly associated with rCBF of the right inferior temporal gyrus (ITG) and the right subgyral gray matter.
Figure 2.
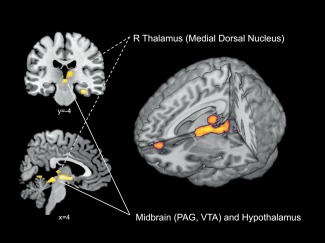
Detailed perspective on midbrain and diencephalic rCBF associated with FFM [results are displayed in the coronal plane (i.e., top left image), sagittal plane (i.e., bottom left image), and on a three‐dimensional rendered brain (i.e., right image)]. Maps are thresholded at P < 0.05 FWE whole brain corrected using the threshold free cluster enhancement method (TFCE). PAG periaqueductal gray, VTA ventral tegmental area. [Color figure can be viewed in the online issue, which is available at http://wileyonlinelibrary.com.]
Small volume correction (SVC) using anatomical masks yielded significant positive associations in the bilateral temporal pole (right middle and superior temporal gyrus; left superior temporal gyrus; and uncus) and the left insula (anterior and middle insula).
To investigate regions similarly associated with FFM and the feeling of hunger, we performed a conjunction analysis of FFM and hunger, adding subjective hunger ratings as additional covariate. Testing the global null hypothesis, we found that both FFM and hunger were positively associated with rCBF of the left midbrain (i.e., PAG; P = 0.004, FWE whole‐brain corrected on the voxel‐level, Fig. 3). Additional global null conjunction yielded similar results, yet at a different family wise error rate (data not shown). In contrast, no overlapping associations were found for FM and hunger.
Figure 3.
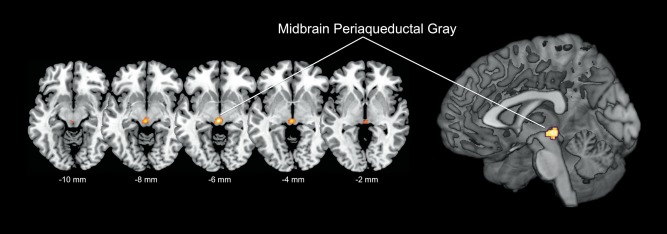
Results of the conjunction analysis (global null) of fat‐free mass and subjective hunger ratings [results are displayed in the axial plane with corresponding locations on the z‐axis, and on a three‐dimensional rendered brain (i.e., right image)], highlighting significant (P = 0.004 FWE voxel‐level corrected for entire brain volume) overlapping associations in the midbrain periaqueductal gray (PAG, voxelwise threshold P < 0.001). [Color figure can be viewed in the online issue, which is available at http://wileyonlinelibrary.com.]
Mediation analysis was performed in order to explore whether midbrain rCBF (i.e., extracted peak voxel located in the PAG) serves as a mediator between FFM and hunger. This analysis revealed a highly significant indirect effect of FFM on hunger via PAG neuronal activity (i.e., peak voxel; P < 0.001; 99% Bootstrap CI 0.17–1.94, Fig. 4). As the total effect (i.e., efect of FFM on hunger) did not reach significance, this is considered indirect‐only mediation [Zhao et al., 2010]. Mediation analysis was repeated using extracted rCBF values derived from a 3 mm sphere (centered on the peak voxel) and average rCBF from the entire midbrain cluster of the conjunction analysis, yielding results at similar significance levels (all P ≤ 0.006 for the mediation product).
Figure 4.
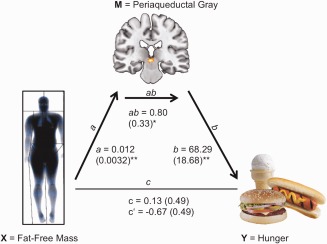
Mediation model for the relationship between fat‐free mass (FFM), midbrain periaqueductal gray (PAG) rCBF and the perceived feeling of hunger, showing a statiscally significant indirect effect of FFM on hunger via the PAG; Path coefficients and corresponding standard errors are shown next to arrows; path a indicates the relationship between FFM and PAG rCBF; path b indicates the relationship between PAG rCBF and hunger; path ab indicates the indirect effect of FFM on hunger via the PAG; path c and c' indicate the total and direct effect of FFM on hunger; * P < 0.001; ** P ≤ 0.0006. [Color figure can be viewed in the online issue, which is available at http://wileyonlinelibrary.com.]
DISCUSSION
In this study, we investigated the relationship between fat‐free body mass (FFM) and regional cerebral blood flow (rCBF) in a sample of 64 fasting healthy adults. To our knowledge, this is the first study analyzing the relationship of specific body composition variables with regional brain activity. We confirmed our hypothesis demonstrating positive associations of FFM with rCBF of mes‐ and diencephalic regions, the cingulate cortex (i.e., left ACC), temporal cortical regions including the bilateral temporal pole (after SVC), and the left insula (after SVC). Further associations were observed in the bilateral parahippocampal gyrus PHc, (right > left), occipital cortical regions, and the cerebellum. Conjunction analysis of FFM and subjective hunger ratings revealed a significant overlap in the midbrain PAG and mediation analysis demonstrated an indirect effect of FFM on hunger via the PAG.
The behavioral tasks required to maintain energy homeostasis are ultimately regulated by the central nervous system and demand the integration of internal needs (i.e., energy needs manifested by hunger) with behavioral actions (i.e., food intake) [Keesey and Powley, 2008]. In humans, >80% of the variance of an individual's resting metabolic rate (RMR) and maximal oxygen uptake are explained by FFM [Goran et al., 2000; Ravussin et al., 1982; Ravussin et al., 1986]. In terms of energy requirements, increases in FFM represent an important contributor to obesity related alterations in energy homeostasis. Taking this relationship and the general concept of energy homeostasis into consideration it is not surprising that FFM has been shown to be predictive of self‐determined meal size [Blundell et al., 2012] and ad‐libitum food intake in humans, independently of FM [Weise et al., 2014]. Interestingly, higher FFM was also associated with relative overeating [Weise et al., 2014]. In VBM analyses, we had also previously shown that FFM but not FM was associated with reduced GMV of brain regions that form part of cortical networks implicated in autonomic and homeostatic regulation, including ventromedial prefrontal regions, parts of the caudolateral OFC, the left insular cortex and distinct temporal regions [Weise et al., 2013]. These findings indicated that there are central adaptive changes in response to increases in FFM which account for the higher energy needs.
Consistent with our hypotheses the largest cluster of positive associations between FFM and rCBF was found in subcortical brain regions comprising parts of the mes‐ and diencephalon. The role of midbrain and adjacent diencephalic regions in the regulation of basal bodily functions is well established. In particular, hypothalamic nuclei and the VTA (and arising mesolimbic dopaminergic pathways) have key roles in the control of energy homeostasis and food intake [Pandit et al., 2011; Sisley and Sandoval, 2011]. Associations of FFM with mes‐ and diencephalic rCBF did include distinct thalamic regions, parts of the VTA, subthalamic nucleus, hypothalamus and extended towards the rostral PAG [Linnman et al., 2012]. Conjunction analysis additionally highlighted the PAG as region with the strongest coactivation by FFM and subjective hunger ratings. This phylogenetically ancient region is believed to play an overarching role in homeostatic defense and survival‐related motivational behaviors, as highlighted by numerous experimental animal studies as well as by human neuroimaging studies [Linnman et al., 2012; Sewards and Sewards, 2003]. As part of the emotional motor system, the PAG receives projections from both spinal lamina 1 neurons and higher cortical regions (i.e., ACC, insula, amygdala, superior temporal sulcus) integrating sensory bodily information with emotional and motivational cues to generate appropriate behavioral responses via cortical, subcortical, and spinal efferent output [Benarroch, 2012; Linnman et al., 2012; Sewards and Sewards, 2003]. Hunger, on the other hand is a complex and generally unpleasant subjective sensation, signalling a homeostatic deviation (an energy deficit) driving food intake. Prolonged periods of food deprivation pose a serious threat to an organisms integrity. To prevent starvation, loss of body mass and organ dysfunction, hunger sensations drive food intake as an individuals overall predominant motivation. Thus, the prolonged 36 hr fast and resulting high hunger levels in our study might have contributed to our findings. Recent neuroimaging studies in humans have demonstrated a positive relationship between midbrain PAG activity in response to tasting a palatable milkshake but also to a subsequent ad‐libitum milkshake ingestion in the absence of hunger [Nolan‐Poupart et al., 2013] and past animal studies provide strong evidence for the involvement of the PAG in the central regulation of feeding behavior [Bailey and Davis, 1942; Lonstein and Stern, 1997; Lyon et al., 1968; Van Erp et al., 1993; Wyrwicka and Doty, 1966]. In rodents disruption of two distinct mesencephalic pathways related to the PAG lead to hypophagia. One ascending pathway terminated in the ventrolateral PAG while the other pathway contained afferent and efferent projections from the forebrain which project to the entire tegmental region surrounding the ventrolateral PAG [Blatt and Lyon, 1968]. Lesions of the neighbouring zona incerta (a region densely innervated by the PAG) within the subthalamic nucleus, caused hypophagia in rats, but only in absence of palatable foods, suggesting a disruption of basic homeostatic pathways but preserving reward‐based feeding behavior [McDermott and Grossman, 1979]. Interestingly, weight gain is a common side effect of subthalamic deep brain stimulation in Parkinson's supporting a possible role of these regions in the regulation of energy homeostasis [Rieu et al., 2011; Růžička et al., 2012].
In accordance with our hypotheses, we also found the ACC to be positively associated with FFM. Neuroimaging studies have consistently demonstrated activation of medial prefrontal cortical regions and the ACC to homeostatic challenges, including fasting (hunger), thirst, air hunger, and hypoglycemia [Weston, 2012]. The ACC is also implicated in higher cognitive functions, including decision making and inhibitory control, and thus may integrate autonomic, emotional, and cognitive information with the goal of generating the appropriate behavioral actions when facing internal and external demands [Critchley et al., 2003].
Although not being part of primarily hypothesized brain regions, we found the strongest association of FFM wih rCBF within the right PHc, additionally a smaller cluster was also found in the left PHc. The hippocampal formation has been repeatedly shown to respond to motivational and appetitive states [LaBar et al., 2001; Tracy et al., 2001]. Interestingly, a recent meta‐analysis showed higher activation of the right parahippocampus in response to food images in obese as compared to normal‐weight subjects [Brooks et al., 2013]. In addition fMRI experiments indicate, that the PHc interacts with the spatial attention network in dependency of food related motivational states [Mohanty et al., 2008], all together suggesting a prominent role of this brain region in energy homeostasis.
Additional brain regions we found to be associated with rCBF included bilateral occipital cortical areas (i.e., left and right lingual gyrus and left cuneus) and the cerebellum. The occipital cortex is primarily involved in vision and previous studies have shown that nutritional states modulate activity of these regions in response to food‐related visual stimuli [Cornier et al., 2007; Cornier et al., 2009], thus providing a potential explanations for our observed associations. The cerebellum on the other hand, has been highlighted in various neuroimaging studies investigating obesity (e.g., [Tomasi et al., 2009; Wang et al., 2006]) and has been proposed to be involved in the regulation of eating related visceral activities. A possible reason for these observations are strong afferent and efferent projections from the cerebellum to the hypothalamus and diverse brainstem regions including the PAG [Zhu and Wang, 2008].
The organs and tissues that comprise FFM need some degree of central control and representation, including their respective energy needs. Our finding as are intriguing as the reported associations (particularly mesencephalic and diencephalic brain regions, insula, and cingulate cortex) fit into predescribed homeostatic neuronal pathways.
Information about the physiological status of all tissue types is obtained by numerous receptors, including metabo‐, osmo‐, thermo‐ and noziceptors and conducted to the brain via spinal lamina I neurons reaching the hypothalamus and the periaqueductal gray via the parabrachial nucleus [Craig, 1996; Craig, 2002; Craig, 2003]. Dense afferent and efferent projections of these regions via thalamic nuclei (i.e., medial dorsal and basal ventromedial nucleus) to cingulate and insular cortices allow further modulation and integration of homeostatic information and the generation of appropriate autonomic and behavioral patterns [Craig, 2002; Critchley, 2009]. Evidence indicates that in primates a further phylogenetically new and more direct pathway exists between lamina I neurons and insular and anterior cingulate cortices. This pathway bypasses brainstem, mesencephalic, and diencephalic nuclei directly projecting to thalamic relay nuclei (i.e., medial dorsal nucleus, basal, and posterior ventral medial nucleus), providing a functional‐anatomical construct for the conscious perception of bodily states [Craig, 2002]. Since ultimately the homeostatic information provided from lamina I neurons appears to be conducted via medial dorsal and basal ventromedial thalamic nuclei, it is noteworthy that we found an area that corresponds to the right medial dorsal nucleus to be associated with FFM, indicating a potential role of these circuitries in the integration of FFM determined energy needs.
Anatomical labeling studies in nonhuman primates have demonstrated the existance of two distinct, but functionally interacting networks within the orbitofrontal cortex. The medial prefrontal network consists of medial prefrontal regions and parts of the caudolateral OFC and anterior insula. Based on its dense efferent projections to autnomomic and homeostatic centers (PAG, Hypothalamus, nucleus of the solitary tract) it has been proposed to serve as a cortical modulating system for homeostatic, autonomic, and visceral bodily functions [Carmichael and Price, 1996; Ongür et al., 2003; Ongür and Price, 2000; Price, 1999; Price, 2007; Saleem et al., 2008]. The orbitofrontal network comprises large parts of the orbitofrontal surface and may be involved the integrations of sensory food‐related information. The medial network appears to have extensive projections to to temporal cortical regions, particularly the temporal pole [Kondo et al., 2003; Saleem et al., 2008]. This provides an anatomical basis for the observed coactivation of temporal cortical regions and the ACC in the setting of autonomic and homeostatic challenges [Weston, 2012]. Indeed, in this study FFM was associated with increased rCBF in both the ACC and the bilateral temporal pole.
We acknowledge the limitations in our analysis. The original study design (i.e., subgroups with differing meal sizes) did not allow analyzing associations of FFM with rCBF across premeal and postmeal conditions. This is a cross sectional study and should be interpreted with caution. However, to our knowledge this is the first attempt to explore the relationship between FFM and neuronal activity (i.e., rCBF) and underline FFM as of primary importance in the context of energy homeostasis. Nevertheless, we must also acknowledge, that the prolonged fast of 36 hr does not apply to regular human eating behavior and, thus, this limitation must be considered when interpreting these results. We were also limited by the low spatial resolution of PET imaging especially with respect to the small size of highlighted midbrain regions and their neighbouring structures. We also have to acknowledge that hunger and food intake are complexly regulated, involving a multitude of hormonal‐metabolic, environmental, psychological, neuronal, factors, which all might affect our findings. However, we were able to adjust for some these (such as insulin and glucose). This complexity could explain the indirect‐only effect of FFM on hunger in the mediation analysis. Although a significant indirect effect is consistent with mediation [Cerin and Mackinnon, 2009; Hayes, 2009; Rucker et al., 2011; Shrout and Bolger, 2002; Zhao et al., 2010], confirmation is required by carefully designed follow‐up studies.
CONCLUSION
Results of this study allow new insights in the neurophysiology of energy homeostasis. Our findings indicate that FFM, independently of FM modulates neuronal activity of subcortical, cortical, and cerebellar regions. These regions largely overlap with ascending afferent homeostatic pathways and cortical networks implicated in the regulation of autonomic and homeostatic bodily functions. Conjunction and mediation analysis furthermore identified more specific midbrain structures (i.e., periaqueductal gray and neighbouring regions) that may integrate FFM determined energy needs with motivational aspects of eating behavior.
ACKNOWLEDGMENTS
The authors declare that there are no conflicts of interest.
REFERENCES
- Bailey P, Davis EW (1942): Effects of lesions of the periaqueductal gray matter in the cat. Proc Soc Exp Biol Med 51:305–306. [Google Scholar]
- Benarroch EE (2012): Periaqueductal gray: An interface for behavioral control. Neurology 78:210–217. [DOI] [PubMed] [Google Scholar]
- Berthoud H‐R, Morrison C (2008): The brain, appetite, and obesity. Annu Rev Psychol 59:55–92. [DOI] [PubMed] [Google Scholar]
- Bie‐Olsen LG, Kjaer TW, Pedersen‐Bjergaard U, Lonsdale MN, Holst JJ, Law I, Thorsteinsson B (2009): Changes of cognition and regional cerebral activity during acute hypoglycemia in normal subjects: A H215O positron emission tomographic study. J Neurosci Res 87:1922–1928. [DOI] [PubMed] [Google Scholar]
- Blatt B, Lyon M (1968): The interrelationship of forebrain and midbrain structures involved in feeding behavior. Acta Neurol Scand 44:576–595. [DOI] [PubMed] [Google Scholar]
- Blundell JE, Caudwell P, Gibbons C, Hopkins M, Näslund E, King NA, Finlayson G (2012): Body composition and appetite: Fat‐free mass (but not fat mass or BMI) is positively associated with self‐determined meal size and daily energy intake in humans. Br J Nutr 107:445–449. [DOI] [PubMed] [Google Scholar]
- Brooks SJ, Cedernaes J, Schiöth HB (2013): Increased prefrontal and parahippocampal activation with reduced dorsolateral prefrontal and insular cortex activation to food images in obesity: A meta‐analysis of fMRI studies. PLoS ONE 8:e60393. [DOI] [PMC free article] [PubMed] [Google Scholar]
- Carmichael ST, Price JL (1996): Connectional networks within the orbital and medial prefrontal cortex of macaque monkeys. J Comp Neurol 371:179–207. [DOI] [PubMed] [Google Scholar]
- Cerin E, Mackinnon DP (2009): A commentary on current practice in mediating variable analyses in behavioural nutrition and physical activity. Public Health Nutr 12:1182–1188. [DOI] [PMC free article] [PubMed] [Google Scholar]
- Cornier M‐A, Kaenel SSV, Bessesen DH, Tregellas JR (2007): Effects of overfeeding on the neuronal response to visual food cues. Am J Clin Nutr 86:965–971. [DOI] [PubMed] [Google Scholar]
- Cornier M‐A, Salzberg AK, Endly DC, Bessesen DH, Rojas DC, Tregellas JR (2009): The effects of overfeeding on the neuronal response to visual food cues in thin and reduced‐obese individuals. PLoS One 4:e6310. [DOI] [PMC free article] [PubMed] [Google Scholar]
- Craig AD (1996): An ascending general homeostatic afferent pathway originating in lamina I. Prog Brain Res 107:225–242. [DOI] [PubMed] [Google Scholar]
- Craig AD (2002): How do you feel? Interoception: The sense of the physiological condition of the body. Nat Rev Neurosci 3:655–666. [DOI] [PubMed] [Google Scholar]
- Craig AD (2003): A new view of pain as a homeostatic emotion. Trends Neurosci 26:303–307. [DOI] [PubMed] [Google Scholar]
- Craig ADB (2009): How do you feel–now? The anterior insula and human awareness. Nat Rev Neurosci 10:59–70. [DOI] [PubMed] [Google Scholar]
- Critchley HD (2009): Psychophysiology of neural, cognitive and affective integration: fMRI and autonomic indicants. Int J Psychophysiol 73:88–94. [DOI] [PMC free article] [PubMed] [Google Scholar]
- Critchley HD, Mathias CJ, Josephs O, O'Doherty J, Zanini S, Dewar B‐K, Cipolotti L, Shallice T, Dolan RJ (2003): Human cingulate cortex and autonomic control: Converging neuroimaging and clinical evidence. Brain 126:2139–2152. [DOI] [PubMed] [Google Scholar]
- Friston KJ, Frith CD, Frackowiak RS, Turner R (1995): Characterizing dynamic brain responses with fMRI: A multivariate approach. Neuroimage 2:166–172. [DOI] [PubMed] [Google Scholar]
- Friston KJ, Penny WD, Glaser DE (2005): Conjunction revisited. Neuroimage 25:661–667. [DOI] [PubMed] [Google Scholar]
- Goran M, Fields DA, Hunter GR, Herd SL, Weinsier RL (2000): Total body fat does not influence maximal aerobic capacity. Int J Obes Relat Metab Disord 24:841–848. [DOI] [PubMed] [Google Scholar]
- Hayes AF (2009): Beyond Baron and Kenny: Statistical mediation analysis in the new millennium. Commun Monogr 76:408–420. [Google Scholar]
- Hayes AF (2012): PROCESS: A versatile computational tool for observed variable mediation, moderation, and conditional process modeling. Available at: http://www.afhayes.com.
- Heni M, Kullmann S, Ketterer C, Guthoff M, Bayer M, Staiger H, Machicao F, Häring H‐U, Preissl H, Veit R, Fritsche A (2014): Differential effect of glucose ingestion on the neural processing of food stimuli in lean and overweight adults. Hum Brain Mapp 35:918–928. [DOI] [PMC free article] [PubMed] [Google Scholar]
- Keesey RE, Powley TL (2008): Body energy homeostasis. Appetite 51:442–445. [DOI] [PMC free article] [PubMed] [Google Scholar]
- Kondo H, Saleem KS, Price JL (2003): Differential connections of the temporal pole with the orbital and medial prefrontal networks in macaque monkeys. J Comp Neurol 465:499–523. [DOI] [PubMed] [Google Scholar]
- Kullmann S, Frank S, Heni M, Ketterer C, Veit R, Häring H‐U, Fritsche A, Preissl H (2013): Intranasal insulin modulates intrinsic reward and prefrontal circuitry of the human brain in lean women. Neuroendocrinology 97:176–182. [DOI] [PubMed] [Google Scholar]
- LaBar KS, Gitelman DR, Parrish TB, Kim YH, Nobre AC, Mesulam MM (2001): Hunger selectively modulates corticolimbic activation to food stimuli in humans. Behav Neurosci 115:493–500. [DOI] [PubMed] [Google Scholar]
- Lancaster JL, Woldorff MG, Parsons LM, Liotti M, Freitas CS, Rainey L, Kochunov PV, Nickerson D, Mikiten SA, Fox PT (2000): Automated Talairach atlas labels for functional brain mapping. Hum Brain Mapp 10:120–131. [DOI] [PMC free article] [PubMed] [Google Scholar]
- Linnman C, Moulton EA, Barmettler G, Becerra L, Borsook D (2012): Neuroimaging of the periaqueductal gray: State of the field. Neuroimage 60:505–522. [DOI] [PMC free article] [PubMed] [Google Scholar]
- Lonstein JS, Stern JM (1997): Role of the midbrain periaqueductal gray in maternal nurturance and aggression: c‐fos and electrolytic lesion studies in lactating rats. J Neurosci 17:3364–3378. [DOI] [PMC free article] [PubMed] [Google Scholar]
- Lyon M, Halpern M, Mintz E (1968): The significance of the mesencephalon for coordinated feeding behavior. Acta Neurol Scand 44:323–346. [DOI] [PubMed] [Google Scholar]
- McDermott LJ, Grossman SP (1979): Regulation of calorie intake in rats with rostral zona incerta lesions: Effects of caloric density or palatability of the diet. Physiol Behav 23:1135–1140. [DOI] [PubMed] [Google Scholar]
- Mohanty A, Gitelman DR, Small DM, Mesulam MM (2008): The spatial attention network interacts with limbic and monoaminergic systems to modulate motivation‐induced attention shifts. Cereb Cortex 18:2604–2613. [DOI] [PMC free article] [PubMed] [Google Scholar]
- Moran TH, Ladenheim EE (2011): Adiposity signaling and meal size control. Physiol Behav 103:21–24. [DOI] [PMC free article] [PubMed] [Google Scholar]
- Nichols T, Brett M, Andersson J, Wager T, Poline J‐B (2005): Valid conjunction inference with the minimum statistic. Neuroimage 25:653–660. [DOI] [PubMed] [Google Scholar]
- Nolan‐Poupart S, Veldhuizen MG, Geha P, Small DM (2013): Midbrain response to milkshake correlates with ad libitum milkshake intake in the absence of hunger. Appetite 60:168–174. [DOI] [PMC free article] [PubMed] [Google Scholar]
- Ongür D, Price JL (2000): The organization of networks within the orbital and medial prefrontal cortex of rats, monkeys and humans. Cereb Cortex 10:206–219. [DOI] [PubMed] [Google Scholar]
- Ongür D, Ferry AT, Price JL (2003): Architectonic subdivision of the human orbital and medial prefrontal cortex. J Comp Neurol 460:425–449. [DOI] [PubMed] [Google Scholar]
- Page KA, Chan O, Arora J, Belfort‐Deaguiar R, Dzuira J, Roehmholdt B, Cline GW, Naik S, Sinha R, Constable RT, Sherwin RS (2013): Effects of fructose vs glucose on regional cerebral blood flow in brain regions involved with appetite and reward pathways. JAMA 309:63–70. [DOI] [PMC free article] [PubMed] [Google Scholar]
- Pandit R, de Jong JW, Vanderschuren LJMJ, Adan RAH (2011): Neurobiology of overeating and obesity: The role of melanocortins and beyond. Eur J Pharmacol 660:28–42. [DOI] [PubMed] [Google Scholar]
- Price JL (1999): Prefrontal cortical networks related to visceral function and mood. Ann N Y Acad Sci 877:383–396. [DOI] [PubMed] [Google Scholar]
- Price JL (2007): Definition of the orbital cortex in relation to specific connections with limbic and visceral structures and other cortical regions. Ann N Y Acad Sci 1121:54–71. [DOI] [PubMed] [Google Scholar]
- Raben A, Tagliabue A, Astrup A (1995): The reproducibility of subjective appetite scores. Br J Nutr 73:517–530. [DOI] [PubMed] [Google Scholar]
- Ravussin E, Burnand B, Schutz Y, Jéquier E (1982): Twenty‐four‐hour energy expenditure and resting metabolic rate in obese, moderately obese, and control subjects. Am J Clin Nutr 35:566–573. [DOI] [PubMed] [Google Scholar]
- Ravussin E, Lillioja S, Anderson TE, Christin L, Bogardus C (1986): Determinants of 24‐hour energy expenditure in man. Methods and results using a respiratory chamber. J Clin Invest 78:1568–1578. [DOI] [PMC free article] [PubMed] [Google Scholar]
- Rieu I, Derost P, Ulla M, Marques A, Debilly B, De Chazeron I, Chéreau I, Lemaire JJ, Boirie Y, Llorca PM, Durif F (2011): Body weight gain and deep brain stimulation. J Neurol Sci 310:267–270. [DOI] [PubMed] [Google Scholar]
- Rucker DD, Preacher KJ, Tormala ZL, Petty RE (2011): Mediation analysis in social psychology: Current practices and new recommendations. Social Personality Psychol Compass 5:359–371. [Google Scholar]
- Růžička F, Jech R, Nováková L, Urgošík D, Vymazal J, Růžička E (2012): Weight gain is associated with medial contact site of subthalamic stimulation in Parkinson's disease. PLoS ONE 7:e38020. [DOI] [PMC free article] [PubMed] [Google Scholar]
- Saleem KS, Kondo H, Price JL (2008): Complementary circuits connecting the orbital and medial prefrontal networks with the temporal, insular, and opercular cortex in the macaque monkey. J Comp Neurol 506:659–693. [DOI] [PubMed] [Google Scholar]
- Sewards TV, Sewards MA (2003): Representations of motivational drives in mesial cortex, medial thalamus, hypothalamus and midbrain. Brain Res Bull 61:25–49. [DOI] [PubMed] [Google Scholar]
- Shrout PE, Bolger N (2002): Mediation in experimental and nonexperimental studies: New procedures and recommendations. Psychol Methods 7:422–445. [PubMed] [Google Scholar]
- Sisley S, Sandoval D (2011): Hypothalamic control of energy and glucose metabolism. Rev Endocr Metab Disord 12:219–233. [DOI] [PubMed] [Google Scholar]
- Smith SM, Nichols TE (2009): Threshold‐free cluster enhancement: Addressing problems of smoothing, threshold dependence and localisation in cluster inference. Neuroimage 44:83–98. [DOI] [PubMed] [Google Scholar]
- Tataranni PA, Gautier JF, Chen K, Uecker A, Bandy D, Salbe AD, Pratley RE, Lawson M, Reiman EM, Ravussin E (1999): Neuroanatomical correlates of hunger and satiation in humans using positron emission tomography. Proc Natl Acad Sci USA 96:4569–4574. [DOI] [PMC free article] [PubMed] [Google Scholar]
- Tomasi D, Wang G‐J, Wang R, Backus W, Geliebter A, Telang F, Jayne MC, Wong C, Fowler JS, Volkow ND (2009): Association of Body Mass and Brain Activation during Gastric Distention: Implications for Obesity. PLoS ONE 4:e6847. [DOI] [PMC free article] [PubMed] [Google Scholar]
- Tracy AL, Jarrard LE, Davidson T. (2001): The hippocampus and motivation revisited: Appetite and activity. Behav Brain Res 127:13–23. [DOI] [PubMed] [Google Scholar]
- Van Erp AM, Kruk MR, Meelis W, Veening JG (1993): Periaqueductal gray lesions do not affect grooming, induced electrically in the hypothalamic paraventricular area in the rat. Behav Brain Res 59:95–101. [DOI] [PubMed] [Google Scholar]
- Wang G‐J, Yang J, Volkow ND, Telang F, Ma Y, Zhu W, Wong CT, Tomasi D, Thanos PK, Fowler JS (2006): Gastric stimulation in obese subjects activates the hippocampus and other regions involved in brain reward circuitry. Proc Natl Acad Sci USA 103:15641–15645. [DOI] [PMC free article] [PubMed] [Google Scholar]
- Weise CM, Thiyyagura P, Reiman EM, Chen K, Krakoff J (2013): Fat‐free body mass but not fat mass is associated with reduced gray matter volume of cortical brain regions implicated in autonomic and homeostatic regulation. Neuroimage 64:712–721. [DOI] [PMC free article] [PubMed] [Google Scholar]
- Weise CM, Hohenadel MG, Krakoff J, Votruba SB (2014): Body composition and energy expenditure predict ad‐libitum food and macronutrient intake in humans. Int J Obes (Lond) 38:243–251. [DOI] [PMC free article] [PubMed] [Google Scholar]
- Weston CSE (2012): Another major function of the anterior cingulate cortex: the representation of requirements. Neurosci Biobehav Rev 36:90–110. [DOI] [PubMed] [Google Scholar]
- Wyrwicka W, Doty RW (1966): Feeding induced in cats by electrical stimulation of the brain stem. Exp Brain Res 1:152–160. [DOI] [PubMed] [Google Scholar]
- Zhao X, Lynch JG Jr, Chen Q (2010): Reconsidering baron and kenny: Myths and truths about mediation analysis. J Consumer Res 37:197–206. [Google Scholar]
- Zhu J‐N, Wang J‐J(2008): The cerebellum in feeding control: Possible function and mechanism. Cell Mol Neurobiol 28:469–478. [DOI] [PMC free article] [PubMed] [Google Scholar]