This article gives an overview of molecular imaging methods for prostate cancer by explaining the biologic basics for the accumulation of tracers in cancerous tissue, clinical principles for their use, and their potential diagnostic value.
Abstract
Prostate cancer is the most common noncutaneous malignancy among men in the Western world. The natural history and clinical course of prostate cancer are markedly diverse, ranging from small indolent intraprostatic lesions to highly aggressive disseminated disease. An understanding of this biologic heterogeneity is considered a necessary requisite in the quest for the adoption of precise and personalized management strategies. Molecular imaging offers the potential for noninvasive assessment of the biologic interactions underpinning prostate carcinogenesis. Currently, numerous molecular imaging probes are in clinical use or undergoing preclinical or clinical evaluation. These probes can be divided into those that image increased cell metabolism, those that target prostate cancer–specific membrane proteins and receptor molecules, and those that bind to the bone matrix adjacent to metastases to bone. The increased metabolism and vascular changes in prostate cancer cells can be evaluated with radiolabeled analogs of choline, acetate, glucose, amino acids, and nucleotides. The androgen receptor, prostate-specific membrane antigen, and gastrin-releasing peptide receptor (ie, bombesin) are overexpressed in prostate cancer and can be targeted by specific radiolabeled imaging probes. Because metastatic prostate cancer cells induce osteoblastic signaling pathways of adjacent bone tissue, bone-seeking radiotracers are sensitive tools for the detection of metastases to bone. Knowledge about the underlying biologic processes responsible for the phenotypes associated with the different stages of prostate cancer allows an appropriate choice of methods and helps avoid pitfalls.
©RSNA, 2015
See discussion on this article by Choyke.
SA-CME LEARNING OBJECTIVES
After completing this journal-based SA-CME activity, participants will be able to:
■ List and describe the molecular targets of prostate cancer imaging agents that are currently used in clinics or are undergoing preclinical evaluation, as well as the most relevant underlying biologic mechanisms.
■ Recognize patterns of physiologic and pathologic tracer uptake, as well as potential pitfalls during image interpretation.
■ Discuss the advantages and disadvantages of each imaging strategy, its diagnostic value, and its appropriate use.
Introduction
Prostate cancer is the most commonly diagnosed noncutaneous malignancy in the United States, where (a) more than 200,000 new cases are identified annually, (b) nearly 30,000 men die of the disease each year, and (c) about 2.7 million patients are living with the diagnosis (1). Prostate cancer ranges from slowly growing, indolent intraprostatic tumors to rapidly progressive metastasizing and therapy-resistant clones (2). A considerable proportion of prostate cancers will not affect the life expectancy of patients, as suggested by investigators in a recent meta-analysis of the results of 19 autopsy studies; these investigators found that among men aged 70–79 years, tumor had been discovered in 36% of white men and 51% of African American men (3). The probability of 5-year survival for patients with a diagnosis of prostate cancer ranges from 100% for localized disease to 28% once the cancer has metastasized to distant organs (1).
In the management of prostate cancer, the methods currently applied for risk stratification, treatment selection, and response prediction, as well as estimation of prognosis, are considered suboptimal. Screening for prostate-specific antigen (PSA) is controversial because of its low specificity and the risk of overtreatment of cancers that are not clinically important. Tissue biopsy samples, on the other hand, can provide only a small window into the biologic characteristics of a cancer, particularly in cases of widespread disease. Molecular imaging of prostate cancer is a rapidly emerging field that aims to provide noninvasive insights into tumor biology and diversity on a whole-body scale. This information might be used to better understand the nature of prostate cancer and to support treatment decisions.
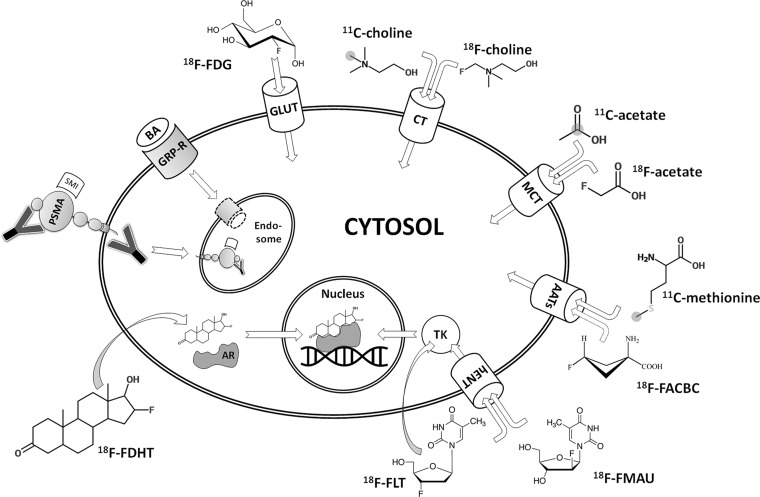
In this article, we provide an overview of the molecular imaging methods that are presently used or are undergoing clinical evaluation, including imaging of cell metabolism, hormone receptors, and membrane proteins, as schematically outlined in Figure 1. We also refer to imaging of the osseous matrix of metastases to bone, as well as emerging techniques that are currently in the state of preclinical development (eg, reporter gene imaging). Finally, we detail imaging strategies relevant to the most common clinical scenarios encountered in patients with prostate cancer.
Figure 1.
Diagram of an overview of molecular imaging strategies currently applied for prostate cancer. Gray circles indicate the position of carbon 11 (11C) atoms. Curved arrows indicate free transmembranous diffusion. AATs = amino acid transporters, AR = androgen receptor, BA = bombesin analog, CT = choline transporter, 18F-FACBC = anti-fluorine 18 (18F)-1-amino-3-fluorocyclobutane-1-carboxylic acid, 18F-FDG = 18F-fluorodeoxyglucose, 18F-FDHT = 18F-16β-fluoro-5α-dihydrotestosterone, 18F-FLT = 18F-fluorothymidine, 18F-FMAU = 18F-fluoro-methyl-arabinofuranosyl-uracil, GLUT = glucose transporter, GRP-R = gastrin-releasing peptide receptor, hENT = human equilibrative nucleoside transporter, MCT = monocarboxylate transporter, PSMA = prostate-specific membrane antigen, SMI = small molecule inhibitor, TK = thymidine kinase, Y = antibody.
Imaging of Cell Metabolism
Cancer cells show dramatic differences, compared with benign tissue, with regard to the uptake and use of nutrients. By applying labeled metabolites that are preferentially incorporated into cancer cells, differences in metabolism between malignant and nonmalignant tissues can be used for imaging purposes. In prostate cancer, radiolabeled analogs of the following metabolic substrates have been used clinically: choline, acetate, glucose, amino acids and amino acid analogs (ie, leucine, methionine, tryptophan, and FACBC), and nucleotides. Radiolabeled metabolites are not specific to prostate cancer, and tracer accumulation may be observed at other sites of increased cell metabolism, including areas of inflammatory change, benign tumors, and nonprostatic malignancies.
Choline
Choline is an essential nutrient needed for three main physiologic purposes. First, choline appears in the hydrophilic head groups of phosphatidylcholine and sphingomyelin, two major constructional components in eukaryotic cell membranes. Thus, choline is essential for the synthesis of cell membranes during cell growth. Second, by way of its metabolite betaine, choline participates in the synthesis of methionine (discussed later in this article); and third, choline is the biochemical originator of the neurotransmitter acetylcholine. Because choline is a charged hydrophilic cation, it requires specific membrane transporters to enter cells. Several mechanisms have been shown to be responsible for the accumulation of choline and its metabolites in cancer cells. Overexpression of choline kinase has been observed in human tumor-derived cell lines, as well as in samples from human breast, lung, prostate, and colorectal cancers (4). Choline uptake by prostate cancer cell lines appears to be influenced by their sensitivity to and the presence of androgens (5), and such uptake has been shown to decrease as a consequence of tissue anoxia (6).
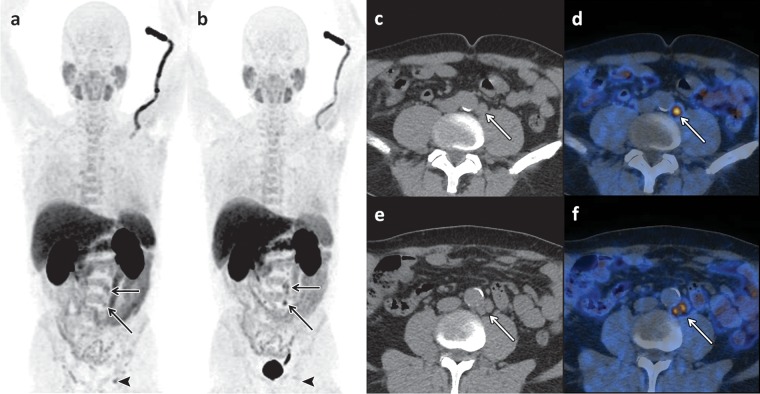
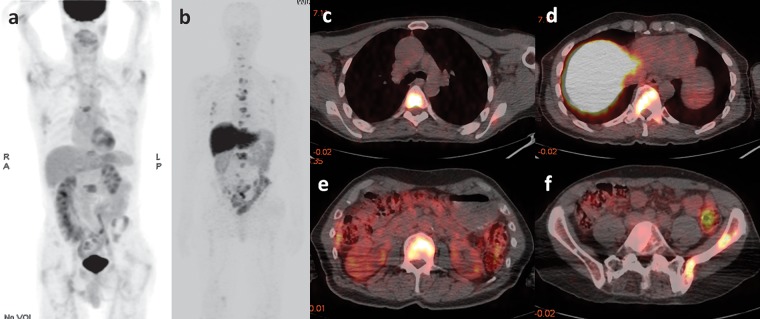
For the purpose of clinical positron emission tomographic (PET) imaging of patients with prostate cancer, three radiolabeled forms of choline are available: 11C-choline, 18F-choline, and 18F-fluoroethylcholine. The latter two are more-convenient alternatives to the former because of the longer half-life of 18F (ie, 120 minutes, compared with 20 minutes for 11C), which obviates the need for proximity to a cyclotron. The normal biodistribution of radiolabeled choline demonstrates relatively high accumulation in the pancreas, liver, kidneys, and lacrimal and salivary glands and shows variable uptake in the bowel and bone marrow. Although 11C-choline is rapidly metabolized to 11C-betaine with generally little renal excretion, 18F-choline is cleared from the blood pool within 5 minutes after administration and is excreted in the urine. With time, the renal excretion of 18F-choline results in high accumulation in the urinary bladder, which may obscure and limit the assessment of lesions within the adjacent prostate gland. Therefore, two-point imaging has been suggested, with the first scan starting at the pelvis 2 minutes after the injection of 18F-choline and a second scan being performed after 30 minutes. Lesions with increasing 18F-choline activity are regarded as malignant, and lesions with decreasing 18F-choline activity are more likely benign (Fig 2).
Figure 2.
Dual-modality 18F-choline PET and computed tomographic (CT) combined imaging (hereafter, PET/CT) of a 70-year-old man with recurrence of increased PSA levels 14 years after radical prostatectomy. (a, b) Early (a) and late (b) coronal maximum intensity projection images show the normal biodistribution of 18F-choline in the salivary glands, liver, pancreas, spleen, kidneys, bone marrow, and bowel, with urinary excretion depicted on b. In a, tracer accumulation is depicted in the left-sided paraaortic lymph nodes (arrows) and in one left-sided inguinal lymph node (arrowhead). In b, increased tracer uptake is depicted in the paraaortic nodes (arrows), a finding that is suspicious for metastasis; and after the same interval, the inguinal lymph node (arrowhead) shows decreased tracer uptake, which indicates that this lymph node is reactive. (c–f) Corresponding axial CT images (c, e) and fused late-phase PET/CT images (d, f) (c and d obtained at a lower level than e and f) show pathologic 18F-choline uptake in the left-sided paraaortic lymph nodes (arrow).
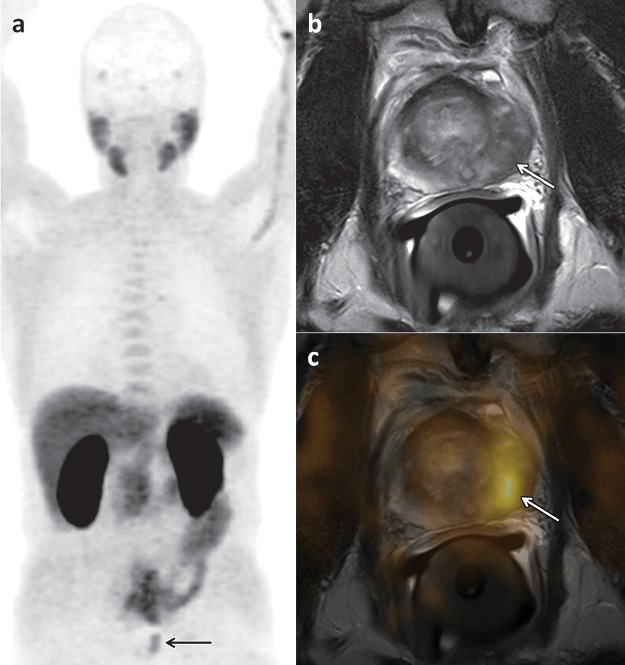
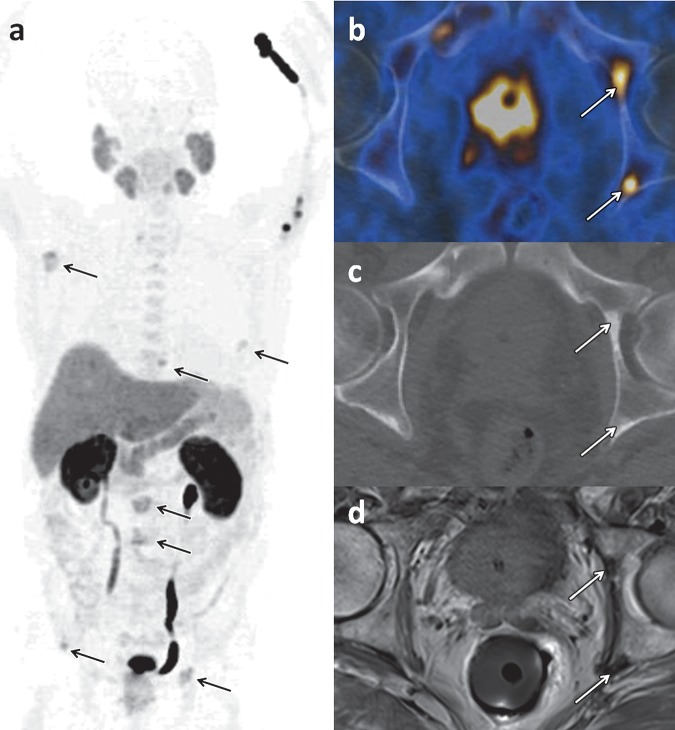
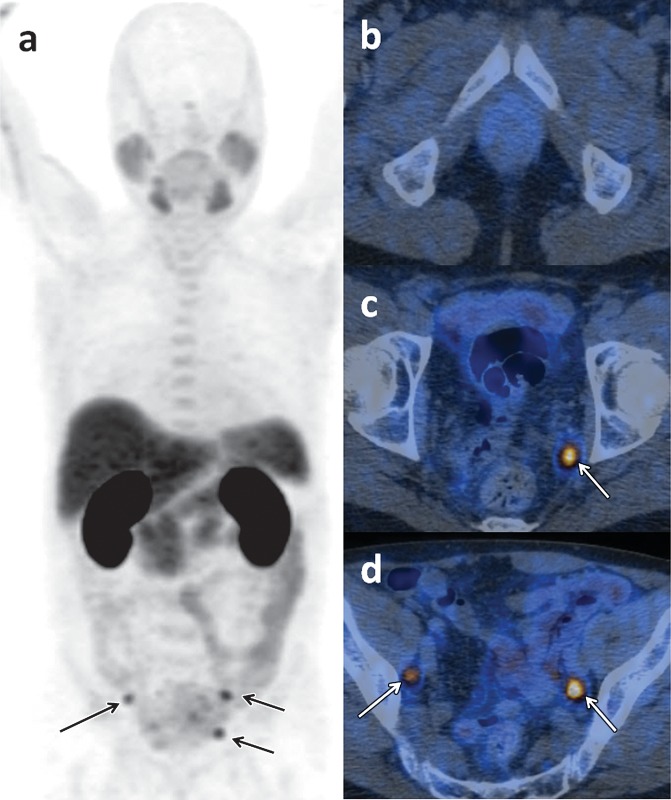
Choline uptake is not specific to prostate cancer, and tracer accumulation may also be observed in inflammatory processes, benign prostate hyperplasia, benign tumors, and synchronous malignant disease. For the initial staging of localized prostate cancer, some investigators have reported a significant correlation between 18F-choline uptake and tumor volume (r = 0.68, P = .0001) (7); however, others found a considerable overlap of 18F-choline uptake values in tumor foci and in benign prostatic hyperplasia (8). Given the exquisite anatomic detail afforded by magnetic resonance (MR) imaging, manually fusing MR images with 18F-choline PET images results in increased specificity of the latter by allowing distinction between uptake in the peripheral zone, which is the most common site of prostate cancer, and uptake in hyperplastic nodules with typical imaging features at MR imaging (eg, heterogeneous signal intensity on T2-weighted images, presence of a capsule) (9) (Fig 3). 18F-Choline PET/CT and MR imaging can be used for staging of newly diagnosed prostate cancer (Fig 4). For the detection of metastases to the pelvic lymph nodes during tumor staging of intermediate- to high-risk prostate cancer, the findings from a meta-analysis indicated a pooled sensitivity of 49% and pooled specificity of 95% for 11C- and 18F-choline (10) (Fig 5).
Figure 3.
18F-Choline PET/CT and MR imaging of a 66-year-old man with newly diagnosed prostate cancer and a PSA level of 30 ng/mL. (a) Early coronal maximum intensity projection image from 18F-choline PET shows unspecific focal 18F-choline uptake (arrow) in the left part of the prostate. (b) Axial T2-weighted MR image shows a hypointense lesion (arrow) in the left prostatic peripheral zone consistent with prostate cancer, a finding that was confirmed by the results of histopathologic examination. (c) Manually fused image combining axial PET image and axial MR image of the prostate depicts the 18F-choline activity (arrow) in the left peripheral zone.
Figure 4.
18F-Choline PET/CT and MR imaging of a 72-year-old man with newly diagnosed prostate cancer (Gleason score, 5 + 5 = 10). (a) Late coronal maximum intensity projection image from 18F-choline PET/CT shows focal tracer uptake in multiple bone lesions (arrows). (b) Axial fused PET/CT image of the pelvis depicts intense focal tracer uptake (arrows) in the left acetabulum, which helps confirm the findings in a. (c) Axial CT image shows minimal sclerotic changes (arrows) in the left acetabulum. (d) Corresponding axial T1-weighted MR image shows minimal hypointense changes (arrows) in the left acetabulum.
Figure 5.
18F-Choline PET/CT of a 70-year-old man with recurrence of an increased PSA level (1.9 ng/mL) 6 months after radical prostatectomy. (a) Early coronal maximum intensity projection shows focal tracer uptake in multiple lymph nodes (arrows). (b–d) Axial fused PET/CT images obtained at increasingly higher levels in the pelvis show the absence of focal tracer uptake in the prostate bed in b but also show intense focal activity in three pelvic lymph nodes (arrows in c, d).
The strength of choline-based PET imaging appears to lie in the detection of prostate cancer recurrence after radical prostatectomy or radiation therapy. In the results of a meta-analysis on this topic, investigators reported pooled sensitivity and pooled specificity of 86% and 93%, respectively, for all sites of disease (area under the receiver operating characteristic curve, 0.949). The three different choline radiotracers have not been systematically compared so far, but differences in diagnostic accuracy appear minor (11,12). For recurrence in the prostatic fossa, a pooled sensitivity of 75% and pooled specificity of 82% were reported; for lymph node recurrence, these numbers were 100% and 82%, respectively (11). It should be noted, however, that the reference standard and the included patient populations varied markedly across studies. Therefore, the pooled accuracy needs to be interpreted with caution. Moreover, the terms sensitivity and specificity can be problematic for whole-body imaging studies because the true number of malignant lesions is not known, and the number of “negative sites” is not well defined, an issue that is applicable not just to choline PET/CT but to all other PET tracers and imaging modalities used for whole-body evaluation. The detection of recurrent prostate cancer at choline PET/CT is influenced by the serum PSA kinetics. Although some investigators have reported that 18F-choline PET/CT can be used to detect early recurrence in patients with PSA values less than 1.5 ng/mL if there is a high PSA velocity (high rate of rise in PSA level) (13), the sensitivity decreases with decreasing PSA values (14,15). Given the current trend toward detection of recurrence at early stages, future efforts should be directed toward further defining the ability of PET with choline and other tracers to help identify sites of recurrent disease in patients with early PSA relapse (relapse to an increased PSA level) after therapy.
Acetate
Acetate, a simple organic anion (CH3COO−), is one of the central ions in the energy metabolism of human cells and the most common building block for the biosynthesis of fatty acids and other structural cell compounds. After entering a cell by way of membrane transporters, the acetate ion is mainly used in the form of acetyl-coenzyme A. As acetyl-coenzyme A, the acetate ion conveys the carbon atoms to the citric acid cycle (Krebs cycle) to be oxidized for energy production. Acetyl-coenzyme A and its metabolite malonyl-coenzyme A are also the major carbon sources for the elongation of fatty acids, which, in turn, constitute the major components of phospholipids and glycolipids in cell membranes. Acetyl-coenzyme A is also the basic molecule for the biosynthesis of cholesterol, which is vital to cell membrane structure and a precursor of fat-soluble vitamins and steroid hormones (16). In human cancer cells, several enzymatic pathways of acetate processing were observed to be upregulated or essential for cell survival (17–19). In prostate cancer cells, the upregulation of fatty acid synthetase was found to be the most likely molecular basis for the increased cellular uptake of acetate (20), although its uptake seems to be unaffected by androgens (5).
For the purpose of clinical PET imaging, 11C-labeled acetate and 18F-labeled acetate are available. The multifarious biochemical functions of acetate explain the widespread biodistribution of these tracers in the heart, kidneys, liver, salivary glands, pancreas, spleen, intestine, bone marrow, and skeletal muscle (Fig 6). Because of the rapid uptake and metabolization of acetate, PET images are typically acquired between 5 and 15 minutes after tracer administration. 11C-Acetate gets metabolized to 11C-CO2 in normal tissues, which in turn is eliminated by way of the lungs, and there is virtually no renal excretion of tracer. In contrast, 18F-acetate is excreted in the urine. Neither tracer is taken up specifically by prostate cancer cells, and both tracers can also accumulate in other hypermetabolic states, such as in inflamed tissues, benign tumors, or other cancers.
Figure 6.
11C-Acetate PET/CT and gallium 68 (68Ga)–RM2 (bombesin analog) PET/CT of a 64-year-old man with newly diagnosed prostate cancer found at biopsy (Gleason score, 4 + 4 = 8; PSA level, 30 ng/mL), who was referred for cancer staging. (a, b) 11C-Acetate PET/CT image (a) and 68Ga-RM2 (bombesin analog) PET/CT image (b) show a suspicious lesion (arrow in a, b) in the right prostatic peripheral zone. Note the physiologic uptake of 11C-acetate in the skeletal muscle on a. (c) Photograph of a macrosection obtained at robotic prostatectomy helps verify the presence of prostate cancer with invasion of the prostatic capsule (arrow). (Images courtesy of Heikki Minn, MD, Turku PET Centre, Turku, Finland.)
Although 11C-acetate has been studied extensively, the clinical value of 18F-acetate has not been evaluated so thoroughly. For the diagnosis of primary prostate cancer, 11C-acetate PET/CT has been reported to be inferior to MR imaging, because its uptake in prostate cancer is similar to its uptake in areas of benign prostatic hyperplasia (21). For the detection of regional lymph node metastases, the findings from a meta-analysis indicated that the sensitivity and specificity of imaging with 11C-acetate were 73% and 79%, respectively (22). In this same meta-analysis, investigators found that in the setting of PSA relapse after radical treatment, the tracer was highly specific (specificity, >90%) but lacked sensitivity (sensitivity, 68%) (22). The depiction of metastases at 11C-acetate PET/CT depends on the PSA level and may not be sufficient in patients with a PSA level less than 1–3 ng/mL (23). Similar to the situation described with choline PET/CT, acetate PET/CT may be of limited use for the detection of early recurrence of prostate cancer.
Glucose
Glucose is a ubiquitous fuel in the human body, particularly for hypermetabolic cells, and an increased expression of transmembrane glucose transporters and hexokinase has been observed in various cancer types. The radiolabeled analog of glucose, FDG, also uses transmembrane glucose transporters to enter a cell and is phosphorylated by hexokinase. This pharmacokinetic profile makes FDG a valuable tracer for imaging a wide range of malignancies and inflammatory diseases. In prostate tissue, benign prostatic hyperplasia, and prostate cancer, however, the uptake of FDG is less consistent and is related to the grade of tumor differentiation (24), androgen dependency (25), and tumor hypoxia (6). Because of the frequently low FDG uptake of newly diagnosed prostate cancer and the appreciable overlap in tracer accumulation in normal and abnormal prostate tissue, FDG PET/CT is of only limited value for the local staging of prostate cancer. For patients with PSA relapse after radical treatment, investigators showed that FDG PET/CT is less sensitive than choline- and acetate-based imaging methods in a systematic review (26). This tracer may have potential as a prognostic tool in the evaluation of castration-resistant metastatic prostate cancer (27,28) and as a predictor of treatment response to antiandrogenic therapy (29).
Amino Acids
Leucine.—l-Leucine is an essential amino acid that activates the mammalian target of the rapamycin (mTOR) pathway. This pathway controls messenger RNA translation, ribosome biogenesis, autophagy, and cell metabolism. Deregulation of the mTOR pathway has been observed in a variety of cancers; in prostate cancer, this deregulation contributes to cancer progression and androgen independency (30). In a xenograft model of prostate cancer, knockdown of l-leucine membrane transporters inhibited cell cycle progression and tumor growth and led to spontaneous regression of metastasis (31).
FACBC is a radiolabeled analog of l-leucine for PET imaging. Its normal biodistribution includes intense hepatic and pancreatic uptake and moderate to mild uptake in the salivary and pituitary glands, the bowel, and the bone marrow. The fact that l-leucine is preferentially metabolized in muscle cells explains why FACBC increasingly accumulates in muscle tissue with time. Urinary excretion of FACBC is minimal, but cellular uptake is rapid. Thus, imaging can be performed before the tracer accumulates in the bladder, typically 3 minutes after application. The uptake of FACBC is not specific to prostate cancer and might also be observed in benign prostatic hyperplasia, inflammation, and benign tumors. Some encouraging clinical reports about FACBC are found in the literature (32,33). Recently, investigators reported that FACBC PET/CT had considerably higher accuracy and helped detect more prostatic and extraprostatic disease than indium 111 (111In)−labeled capromab pendetide, an antibody directed against the internal epitope of the PSMA molecule and imaged with single photon emission computed tomography (SPECT), as discussed later in this article (34). An example of FACBC PET/MR imaging is given in Figure 7.
Figure 7.
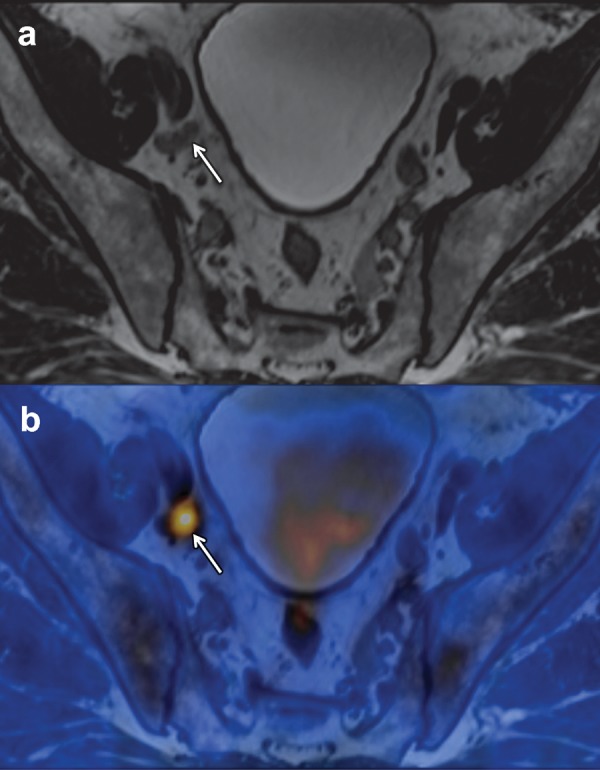
FACBC PET/MR imaging of a 65-year-old man with newly diagnosed prostate cancer found at biopsy (Gleason score, 4 + 4 = 8; PSA level, 3.6 ng/mL), who was referred for cancer staging. (a) T2-weighted MR image of the pelvis shows an 8-mm external iliac lymph node (arrow). (b) Axial fused FACBC PET/MR image obtained with a fully integrated PET/MR system shows intense tracer uptake in the lymph node (arrow). The findings at histopathologic examination helped confirm lymph node metastases. (Images courtesy of Brage Krüger-Stokke, MD, NTNU-MR Cancer Group and St. Olavs Hospital, Trondheim, Norway.)
Methionine.—Methionine is an essential amino acid that is necessary for growth, normal development, and homeostasis of mammalian cells. Together with cysteine, methionine is one of the two sulfur-containing proteinogenic amino acids, and its metabolites serve as major methyl donors in cell biochemistry. Accordingly, methionine is involved in several biochemical pathways that provide molecular compounds for protein synthesis, chromatin and protein methylation, and synthesis of glutathione, a molecule that protects cells from oxidative stress. In androgen-insensitive prostate cancer cell lines, methionine restriction can stop proliferation and induce apoptosis (35).
Several radiolabeled analogs of methionine and its precursor homocysteine have been used for cancer imaging. Among those, 11C-methionine is the only one that has also been evaluated in patients with prostate cancer. After intravenous administration, 11C-methionine is rapidly cleared from the blood, and its physiologic biodistribution includes the pancreas, liver, salivary glands, tonsils, bone marrow, testicles, and myocardium. No renal excretion of 11C-methionine occurs, which makes it an interesting tracer for pelvic cancers. In the findings from some clinical studies, investigators have described the potential role of 11C-methionine in prostate cancer imaging, but its clinical value in comparison with other tracers has not yet been explored fully (36,37).
Tryptophan.—Tryptophan is an essential amino acid that is used for protein synthesis and also acts as the biochemical precursor of 5-hydroxytryptamine (ie, serotonin). In addition to its well-studied functions in the central nervous, circulatory, and intestinal systems, serotonin may also be a mitogenic factor involved in cancer growth and angiogenesis, cell migration, and metastasis (38). Serotonin-producing neuroendocrine cells are found in normal prostate tissue, as well as in prostate carcinoma. These cells are more commonly encountered in high-stage and high-grade prostate cancer, with the highest concentrations occurring in castration-resistant cancers (39). In a preliminary study of individuals with metastatic hormone-refractory prostate cancer, investigators reported an increased uptake of 11C-labeled serotonin in all observed skeletal lesions (40).
Nucleosides
Nucleosides represent the basic building blocks of nucleic acids, and the adequate synthesis of nucleic acids is essential for the proliferation of malignant cell clones. Radiolabeled nucleosides, mainly thymidine and its analogs, have therefore been used for the imaging of cell proliferation since the mid 1990s. Fluorothymidine was originally developed as an antineoplastic and antiretroviral agent, because it acts as a chain terminator in DNA synthesis. Because of the considerable side effects of fluorothymidine when administered at routine therapeutic doses, it was abandoned as a therapeutic agent. At doses that are needed for imaging, however, 18F-fluorothymidine is far less toxic and has been applied in a wide variety of cancers. No clinical data about this tracer in patients with prostate cancer are currently available; however, in the results of preliminary studies with the fluorothymidine analog, 18F-fluoro-methyl-arabinofuranosyl-uracil (FMAU), investigators found that this tracer accumulates in prostate cancer (41,42). Compared with fluorothymidine, FMAU demonstrates less intense uptake in the bone marrow and less urinary excretion, findings that make it an interesting alternative for prostate cancer imaging, although further work is needed to explore the potential of this tracer in prostate cancer.
Imaging of Receptors and Membrane Proteins
Androgen Receptor
Androgens are the main molecular drivers for the development and maintenance of the male sexual phenotype, including the proliferation of prostate epithelial cells, and androgens play a major role in the carcinogenesis of prostate cancer. The androgen receptor is a cytoplasmic molecule that, after binding of its ligand, translocates into the nucleus and serves as a transcription factor. Expression or overexpression of the androgen receptor has been observed in all stages of prostate cancer, and androgen deprivation will lead to treatment response in virtually all patients with metastatic disease. However, almost all of them will experience resistance to androgen deprivation, a process that is referred to as “castration resistance.” Although these cell clones gain their independence from circulating androgens, the clones often continue to express or even overexpress the androgen receptor. The mechanisms of castration resistance are not fully understood, and many theories have been proposed in the literature, including, but not limited to, androgen receptor variants, the amplification of androgen receptor coactivators, and bypass-activating pathways.
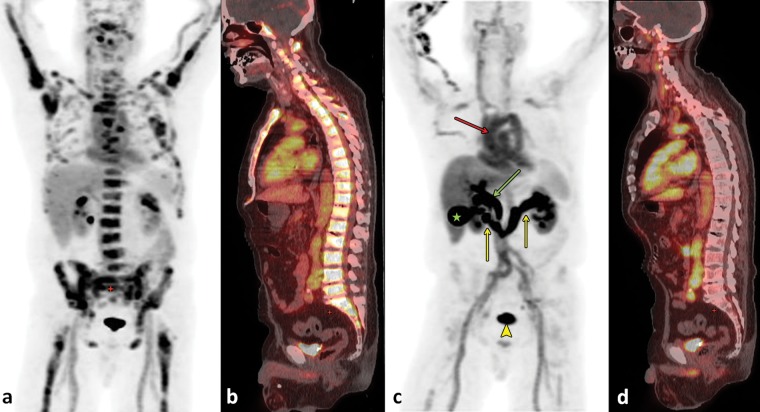
FDHT is a structural analog of 5α-dihydrotestosterone, the major and most potent intraprostatic androgen. After intravenous administration, FDHT is bound to sex hormone–binding globulin and passively diffuses through the cell membrane. In prostate cancer, the uptake of FDHT reaches a plateau about 20 minutes after injection. FDHT has an effective half-life of 1–2 hours and is mainly excreted by the liver by way of the biliary tree, as well as by the kidneys into the urinary bladder. Little tracer uptake may also be observed in the pancreas, adrenals, intestine, and the bone marrow (Fig 8). The binding of FDHT to the androgen receptor is drastically reduced by physiologic testosterone levels and the administration of antiandrogenic drugs (43,44). Thus, it is crucial to consider the patient’s current antiandrogenic medication when interpreting FDHT PET examinations. FDHT examinations are generally negative if testosterone levels are not in the castrated category. Additionally, mutations or alternative splicing in prostate cancer cells may lead to the expression of androgen receptors with an altered or even missing hormone-binding domain. These changes may also affect the binding of FDHT, although no studies are available that explore this hypothesis on a molecular level. However, in a study of castration-resistant prostate cancer, investigators described different patterns of FDHT uptake in metastases to bone (27). Although 90% of the lesions in this study were positive at FDHT PET, a minority of vital metastases, as proven by their FDG avidity, did not accumulate FDHT. This tracer may therefore be used to assess the androgen receptor status on a whole-body scale and to evaluate the prospects and efficacy of androgen receptor−directed pharmaceuticals. The quantity of FDHT accumulation may also have potential as a prognostic biomarker in castration-resistant prostate cancer (27).
Figure 8.
FDHT PET/CT of a 64-year-old man with metastatic castration-resistant prostate cancer. (a, b) Images obtained at baseline examination: Coronal maximum intensity projection image obtained at FDHT PET (a) and sagittal fused FDHT PET/CT image (b) show diffuse osseous metastases. (c, d) Images obtained 6 weeks after treatment with cabozantinib (Cometriq; Exelixis, South San Francisco, Calif): Corresponding coronal maximum intensity projection image obtained at FDHT PET (c) and sagittal fused FDHT PET/CT image (d) show almost completely resolved uptake in the metastases to bone. FDHT is bound to sex hormone–binding globulin, which explains the considerable blood pool activity (red arrow in c). Note also the hepatobiliary excretion of the tracer into the bile ducts (green arrow in c) and the gallbladder (★ in c). The tracer is also excreted by way of the kidneys (yellow arrows in c) into the urinary bladder (arrowhead in c).
Prostate-Specific Membrane Antigen
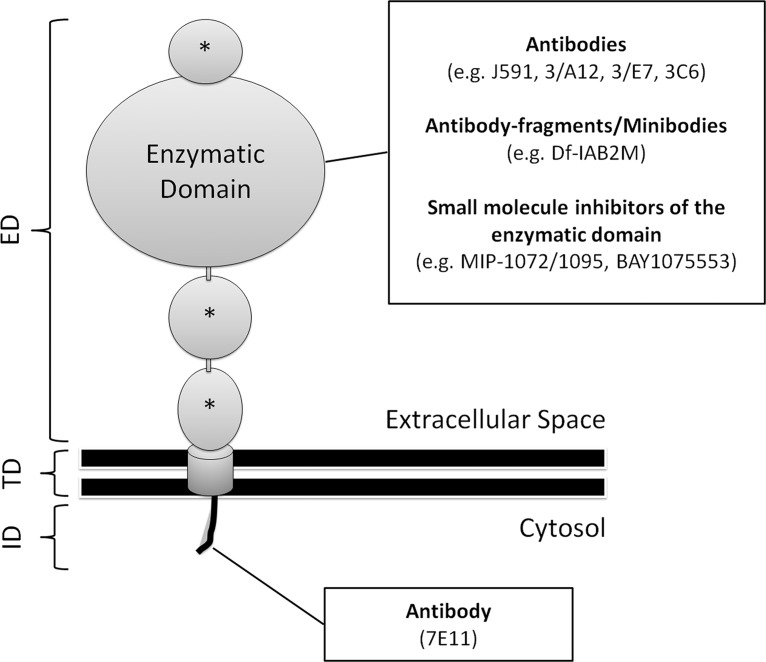
PSMA (also known as glutamate carboxypeptidase II) is a transmembrane glycoprotein that is found on prostate epithelial cells, the small intestine, renal tubular cells, celiac ganglia, and salivary glands. Its expression is 100-fold to 1000-fold higher in prostate cancer than in other tissues, and the degree of PSMA expression is associated with the time to tumor progression and the probability of cancer relapse (45,46). Androgens will downregulate the expression of PSMA, and it is more abundant on the surface of castration-resistant tumors (47). Knowledge about the structure and natural functions of PSMA helps to understand the principles of PSMA-directed imaging. A schematic diagram of a PSMA molecule is shown in Figure 9. PSMA consists of a small intracytoplasmic domain, a hydrophobic transmembranous domain, and a large extracytoplasmic domain. The extracytoplasmic domain has several enzymatic functions, and the fact that PSMA gets internalized into the cell’s endosomal recycling system suggests that it may also serve as a receptor for which the ligand is not known. The highly increased expression of PSMA on prostate cancer cells, its anchorage in the cell membrane, and its internalization make PSMA a highly attractive target for imaging and therapy.
Figure 9.
Diagram of a PSMA molecule. The molecule is composed of a short intracellular domain (ID), a hydrophobic transmembranous domain (TD), and a large extracellular domain (ED). The latter consists of a large enzymatic portion and three smaller domains (*), the functions of which are not known. PSMA-directed imaging tracers can be divided into those targeting the ID and those that bind to the ED or inhibit its enzymatic domain. The ID contains a motif that is responsible for the internalization of the molecule into the endosomal recycling system of the cell.
PSMA imaging is based on monoclonal antibodies or small molecule inhibitors of its enzymatic domains. The first commercially available radiolabeled antibody against PSMA (ie, 111In-7E11; capromab pendetide [ProstaScint; Aytu Bioscience, Englewood, Colo]) was directed against the molecule’s intracellular domain. Antibodies are hydrophilic molecules and cannot cross intact cell membranes. Thus, 7E11 can only bind to PSMA after its exposure in damaged or necrotic cells, and the capacity of 111In-7E11 to image vital prostate cancer cells with intact cellular membranes is limited.
Newer generations of anti-PSMA antibodies (eg, J591, 3/A12, 3/E7, 3/F11, and 3C6) target the extracellular receptor domain, with J591 being the best studied among them. This antibody has been labeled with radioactive technetium 99m (99mTc), 111In, copper 64 (64Cu), and zirconium 89 (89Zr) for SPECT/PET imaging, as well as with magnetic nanoparticles for MR imaging. In the results of preliminary clinical studies, investigators found that 89Zr-labeled J591 binds primarily to primary prostate cancer with a Gleason score of 7 or more, and investigators also found that 111In-labeled J591 accurately targeted bone or soft-tissue lesions in 98% of patients with castration-resistant disease (48).
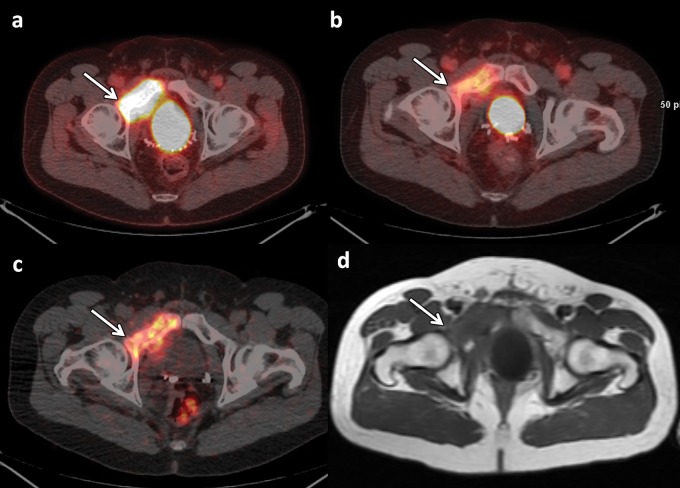
For therapeutic purposes, J591 has also been linked to particles with α- and β-radioactive decay (49,50). The availability of both diagnostic and therapeutic versions of the same tracer allows implementation of a “theranostic” approach, in which an imaging probe can reliably predict the in vivo binding of its therapeutic “sister” agent and can also allow patient-tailored dosage calculations. Figure 10 shows the physiologic distribution of 89Zr-J591, and Figures 11 and 12 display patterns of pathologic accumulation of this tracer in prostate cancer metastases.
Figure 10.
FDG PET and 89Zr-J591 imaging of a 55-year-old man with a mildly increasing PSA level of 1.1 ng/mL after radical prostatectomy. Coronal maximum intensity projection images obtained 60 minutes after intravenous injection of FDG (a) and 7 days after the injection of 89Zr-J591 (b) show physiologic tracer distribution for each tracer. No areas of abnormal tracer accumulation were depicted.
Figure 11.
FDG PET/CT, FDHT PET/CT, 89Zr-J591 PET/CT, and MR imaging of a 47-year-old man undergoing follow-up 2 years after prostatectomy and radiation therapy for prostate cancer (Gleason score, 4 + 5 = 9). Axial fused FDG PET/CT image (a), axial fused FDHT PET/CT image (b), axial fused 89Zr-J591 PET/CT image (c), and axial T1-weighted MR image (d) of the pelvis show a right superior pubic ramus metastasis extending into the acetabulum (arrow). Tracer uptake was depicted with all three PET tracers.
Figure 12.
FDG PET and 89Zr-J591 PET/CT of a 73-year-old man with metastatic castration-resistant prostate cancer. (a) Coronal maximum intensity projection image from FDG PET shows a few metastases to bone. (b–f) Coronal maximum intensity projection image from 89Zr-J591 PET (b) and axial fused 89Zr-J591 PET/CT images (c–f) depict many more metastases to bone.
In addition to antibodies, radiolabeled small molecule inhibitors of the enzymatic domain of PSMA, as well as antibody fragments and minibodies (engineered antibody fragments) against PSMA, have been developed. Because of their lower molecular weight, these substances are cleared from the blood more rapidly than antibodies, thereby decreasing the time interval from injection to scanning and the overall radiation dose. These molecules will physiologically accumulate in the liver and spleen, the kidneys, the salivary glands, and the intestinal tract, with variable urinary excretion. Among them, a 68Ga-labeled PSMA ligand is a promising agent that showed higher sensitivity and tumor-to-background ratios than did choline PET/CT in patients with recurrent prostate cancer (51). The potential ability of PSMA-based imaging to help detect prostate cancer recurrence at the time of early PSA relapse after prostatectomy or radiation therapy has garnered considerable interest and is currently the subject of ongoing studies to further delineate the usefulness of PSMA-based imaging in this clinical context.
Despite its name, PSMA is not perfectly specific for prostate cells or prostate cancer, and possible pitfalls should be kept in mind in the interpretation of PSMA-based imaging studies. PSMA expression and positivity at J591-based imaging have been observed in a variety of solid nonprostate malignancies. In contrast, poorly differentiated prostate cancer with neuroendocrine differentiation may appear negative at PSMA-directed imaging. Importantly, the celiac ganglia can also express PSMA and were found to be positive at PSMA PET/CT in as many as 89% of patients with prostate cancer (52). Because of their paraaortic localization just in front of the crura of the diaphragm and their lymph node–like morphologic structure at CT, the celiac ganglia can easily be misinterpreted as metastatic lymph nodes.
Gastrin-releasing Peptide Receptor
The gastrin-releasing peptide, also referred to as the “mammalian bombesin,” is a member of the “bombesin-like peptide family” and shows a broad range of pharmacologic and biologic responses in mammalian organisms. Its membrane receptors (gastrin-releasing peptide receptor) mediate their biologic effects via several intracellular signaling pathways leading to an increased expression of transcription factors, key proteins of the cell cycle, and expression of growth factor receptors. Gastrin-releasing peptide receptor was shown to be overexpressed in many cancer types, including prostate cancer, while being scarce or nondetectable in normal prostate tissues. Its nonmammalian ligand, bombesin, was originally isolated from the skin of the European fire-bellied toad (Bombina bombina), and several radiolabeled analogs have been developed for PET and SPECT/CT imaging, including radiopharmaceuticals labeled with 18F, 68Ga, 111In, 99mTc, 64Cu, and lutetium 177 (177Lu) (53). These tracers can be classified according to their pharmacodynamic effect on the gastrin-releasing peptide receptor. Although agonists will induce internalization of the ligand-receptor complex into the endosomal compartment, antagonist-bound gastrin-releasing peptide receptor remains in the cell membrane, as indicated in Figure 1 (54).
In humans, a radiolabeled gastrin-releasing peptide receptor antagonist (ie, 64Cu-CB-TE2A-AR0) is rapidly cleared from the blood (initial half-life, 5 minutes) and excreted by the kidneys into the urinary bladder. Physiologic uptake can be observed mainly in the pancreas and, to a lesser extent, in the liver, spleen, and bowel. The tracer washout is slower for prostate cancer than for normal organs. In the results of preliminary clinical studies, investigators reported promising diagnostic accuracies of radiolabeled bombesin analogs, but further studies are warranted to understand the true clinical value of these tracers (55–57). An example of imaging with a bombesin analog (68Ga-RM2) is shown in Figure 6b.
Imaging of the Bone Matrix
Human bone consists of two major components: (a) proteins, mainly collagen; and (b) inorganic crystals, mainly hydroxyapatite, which is a calcium phosphate mineral with the chemical formula Ca5(PO4)3(OH). Its OH− ion can be replaced by several anions, including fluoride, which produces fluorapatite. Healthy adult bone is in homeostasis between resorption of old bone by osteoclasts and synthesis of new bone by osteoblasts. In metastases to bone, an intercellular communication between cancer cells and the bone microenvironment promotes an abnormal cycle of tumor growth, bone destruction, and bone remodeling. Generally, cancer cells release numerous signaling molecules that activate osteoclasts and lead to destruction of bone, the result being an osteolytic appearance on medical images. In prostate cancer metastases, however, tumor progression was observed to be accompanied by demasking of osteoblastic signaling pathways. This explains the switch from an osteolytic to the more-common osteoblastic phenotype early in the development of metastases to bone from prostate cancer. By the systemic application of radiolabeled building blocks of bone, it is possible to localize sites of increased de novo synthesis of bone (eg, osteoblastic metastases to bone). The uptake of these “bone-seeking” radiopharmaceuticals, most importantly, 99mTc-labeled diphosphonates and 18F-sodium fluoride, depends on both bone perfusion and the rate of bone turnover. Bone-seeking tracers will accumulate in the bone matrix but not in cancer cells, thus reflecting the osteoblastic response to the cancer rather than reflecting the tumor itself. Thus, radiotracer uptake might be seen in cases of tumor regression with ongoing bone formation, the so-called flare phenomenon. Degenerative bone disease, such as osteoarthritis, can also be avid for these tracers and mimic metastatic disease. Correlation with anatomic images is essential for diagnosis.
99mTc-labeled Diphosphonates
The most widely applied bone-seeking radiotracers are 99mTc-labeled diphosphonates, including methylene diphosphonate (99mTc-MDP) and hydroxymethylene diphosphonate (99mTc-HMDP). Diphosphonates are molecules with two phosphate groups that have a mechanism of accumulation in bone that is not completely understood. Most probably, diphosphonates accumulate at the surface of bone during bone formation, a process that is called chemisorption. In prostate cancer, whole-body scintigraphy with these radiotracers (“bone scans”) lacks specificity and also underestimates the true prevalence of metastases to bone. The application of SPECT/CT with these tracers can increase their specificity.
Sodium Fluoride
Sodium fluoride (NaF) is an inorganic chemical compound that dissolves to give separated Na+ and F− ions. Its radiolabeled form, 18F-NaF, was developed in 1962 and was approved for bone imaging by the U.S. Food and Drug Administration as early as 1972. After chemisorption onto the bone matrix, 18F rapidly exchanges for the hydroxyapatite’s OH− ion, forming 18F-fluorapatite. Compared with diphosphonates, NaF has a more-rapid blood clearance and a higher bone-to-background ratio, and the interval from the administration to imaging is shorter. NaF is excreted by the kidneys into the urinary bladder. Despite these advantages, it was replaced by 99mTc-labeled diphosphonates in the 1970s because of their better physical properties for imaging with conventional gamma cameras. The introduction of PET and PET/CT, as well as the broader availability of electronic 18F generators, allowed tapping the full potential of this tracer. In the results of several studies, investigators have demonstrated that 18F-NaF PET is more accurate than a conventional bone scan or SPECT with 99mTc-labeled diphosphonates in the diagnosis and characterization of metastases to bone from various primary cancers, including prostate cancer. In the findings from a literature review of 18F-NaF PET/CT for imaging prostate cancer metastases to bone, investigators reported pooled sensitivities and specificities of 89% and 91%, respectively, on a per-lesion basis and 87% and 80%, respectively, on a per-patient basis (58).
Reporter Gene Imaging
Carcinogenesis and progression of cancer are mainly driven by alterations of gene expression, and the diversity of gene expression patterns is a major cause of cancer heterogeneity, including the wide variation in biologic behavior of prostate cancer. Visualization of gene expression could therefore provide direct insights into the molecular basis of cancer biology and may help to detect, diagnose, classify, and understand cancers and cancer subtypes. Until recently, imaging of gene expression was restricted to histochemistry (immunohistochemistry), necessitating tissue sampling and processing, and it was not possible to visualize gene expression in living subjects. Reporter gene expression imaging, however, is a method that allows visualization, localization, and quantification of gene expression in living cells and organisms.
Reporter genes are relatively short strands of DNA that are attached to regulatory sequences of another “gene of interest.” After their introduction into a living cell (eg, by a vector virus), the reporter genes get integrated into the DNA of the host. Because both the reporter gene and the gene of interest have the same regulatory sequences, their expression will be controlled concurrently by the same stimuli and mechanisms. The difference between these two genes, however, lies in the type of encoded protein. The gene of interest encodes for a certain protein (eg, PSA), and the reporter gene encodes for a “reporter protein,” which can be an intracellular enzyme, a transmembrane transporter, or a membrane-bound receptor or antigen. After its expression, the reporter protein accumulates in the cell or gets integrated into the cell membrane. In the next step, a “reporter probe” is injected into the system or organism. The reporter probe is a molecule that specifically interacts with the reporter protein and, at the same time, acts as a tracer that allows for its localization in the cell or organism. Depending on the type of reporter protein and probe, various interactions are possible between them, including direct binding, transmembrane transportation, or enzymatic metabolization. Any of these interactions result in an accumulation of the reporter probe (ie, the “tracer”) on or in the target cell, producing the target-to-background contrast needed for imaging. Because the reporter probe can be labeled with either radioactive or paramagnetic molecules, this technique can be adapted for both PET/CT and MR imaging.
In several studies, investigators have successfully used adenoviral vectors to introduce reporter genes with promoters that were derived from the PSA-PSMA gene regulatory region for PET imaging (59–61). This method may increase the ability to image prostate cancer micrometastases in the future, although further research is necessary to transfer the findings from these preclinical studies to humans.
Imaging Strategies
The Table summarizes the currently available evidence about the diagnostic performance of the most commonly applied tracers for prostate cancer imaging, according to a recently published systematic review (26).
Comparison of Tracers That Are Commonly Used in Prostate Cancer Imaging
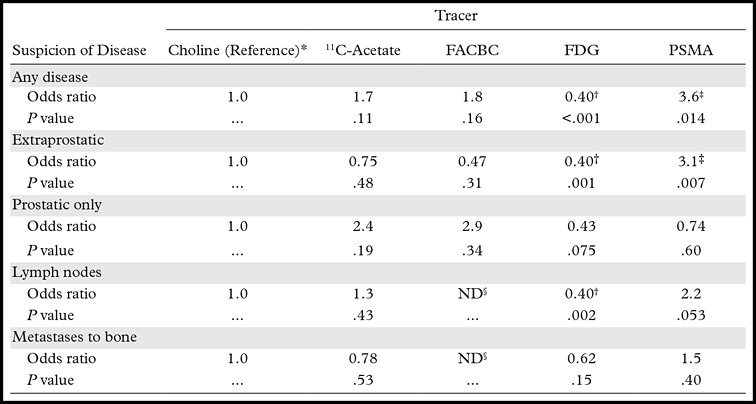
Note.—Adapted and reprinted, with permission, from reference 26. The odds ratio numbers represent odds ratios with choline as the reference. As a general pattern, no significant difference was observed among choline, 11C-acetate, and FACBC. Further details are found in the systematic review by Yu et al (26). FACBC = anti-18F-1-amino-3-fluorocyclobutane-1-carboxylic acid, FDG = 18F-fluorodeoxyglucose, PSMA = prostate-specific membrane antigen.
*11C-Choline or 18F-choline.
†FDG tended to help detect a lower proportion of patients suspected of having disease.
‡PSMA-directed imaging strategies tended to help detect a higher proportion of patients suspected of having disease.
§ND = no data (no observations).
Local Staging
In the local staging of prostate cancer, prostate MR imaging is the most reliable modality for localization of the tumor and assessment of its extent within and beyond the gland, including the detection of extracapsular tumor extension and invasion into the seminal vesicles. Diffusion-weighted MR imaging, MR spectroscopy, and contrast material−enhanced MR imaging improve the diagnostic performance of conventional MR imaging and may also be used for noninvasive assessment of tumor aggressiveness (62).
Lymph Node Staging
Although MR imaging is the modality of choice for evaluating primary prostate cancer, it is affected by a low sensitivity for the diagnosis of regional lymph node metastases. Accordingly, in the findings from a meta-analysis, investigators reported a pooled sensitivity and specificity of 39% and 82%, respectively (63). Although the sensitivity of MR imaging for the diagnosis of lymph node metastases can be improved with the application of diffusion-weighted and contrast-enhanced MR imaging sequences, alternative imaging methods are needed to close this diagnostic gap. For choline PET-CT, the results of a meta-analysis yielded a pooled sensitivity of 49% and a pooled specificity of 95% (10). 11C-Acetate may be more accurate for lymph node staging, because in the findings from a meta-analysis, investigators reported a pooled sensitivity of 73% and a pooled specificity of 79% (22). PSMA-directed imaging agents have shown promising results in preliminary human studies, but the potential of these agents to allow accurate assessment of the nodal status of prostate cancer needs to be further evaluated.
Recurrence after Radical Treatment
PSA is a sensitive and specific tumor marker for prostate cancer and is routinely measured to detect disease recurrence in patients who have undergone definitive treatment of localized disease. Although PSA relapse after treatment is usually indicative of prostate cancer recurrence, it does not contribute to identifying the sites of recurrent disease and the planning of targeted salvage therapy. The ultimate goal of imaging in this scenario is to distinguish local recurrence in the prostatic fossa from distant recurrence, most commonly in the lymph nodes or bones.
All Sites of Prostate Cancer Recurrence.—For all sites of prostate cancer recurrence, choline PET/CT was reported to have a high sensitivity (86%) and specificity (93%) in the findings from a meta-analysis, with 18F-choline performing slightly better than 11C-choline (11). The pooled sensitivity of 11C-acetate for overall recurrence was reported to be 68%, with a pooled specificity of 93% (22). In the results of a systematic review, PSMA-directed tracers were reported to depict cancer foci in a higher proportion of patients with PSA relapse than did choline, acetate, and FACBC, especially in patients after radical prostatectomy (26).
Local Recurrence to the Prostatic Fossa.—For the diagnosis of local recurrence to the prostatic fossa with MR imaging, the findings from a meta-analysis disclosed values for pooled sensitivity and specificity of 82% and 87% after radical prostatectomy and values of 82% and 74%, respectively, after external beam radiation (64). The diagnostic precision of 11C-acetate in this setting strongly depends on the patient’s PSA level and is higher after radical prostatectomy than after radiation therapy. Overall, the pooled sensitivity for 11C-acetate PET/CT was reported to be 83% and its sensitivity was 92% in the findings from a meta-analysis (22). In the results of one study that directly compared MR imaging and 18F-choline PET/CT for the detection of local recurrence after radical prostatectomy, investigators found that MR imaging had better diagnostic accuracy, especially in patients with low levels of PSA (65). For choline PET/CT, the pooled sensitivity was calculated to be 75%, and the pooled specificity was 82% (11). In the results of a systematic comparison of choline, acetate, FACBC, and PSMA-directed tracers, investigators did not find significant differences in the detection of recurrence in the prostatic fossa (26).
Prostate Cancer Recurrence in Regional Lymph Nodes.—With regard to prostate cancer recurrence in regional lymph nodes, choline PET/CT was reported to be perfectly sensitive in the results of a meta-analysis, with a pooled specificity of 82% (11), and 11C-acetate had a pooled sensitivity and specificity of 82% and 94%, respectively (22). In the setting of PSA relapse, PSMA-directed tracers may help detect lymph node metastases in a higher proportion of patients than acetate and choline (26), although more data are needed to verify these preliminary observations.
Metastases to Bone.—For the detection and localization of metastases to bone in prostate cancer patients, 99mTc-based bone scintigraphy is the most widely distributed imaging method. It offers the advantages of broad availability and low cost but comes with a relatively low diagnostic accuracy. Choline-based PET/CT studies were shown to be more sensitive than conventional bone scans in the findings from a recent meta-analysis (12). Similarly, 18F-acetate PET/CT was reported to be a valuable tool for helping detect metastases to bone in patients with primary intermediate- or high-risk prostate cancer or in those with biochemical relapse and serum PSA levels of more than 2.0 ng/mL (15). In the results of a systematic review of 18F-NaF and choline-based PET/CT, investigators found similar diagnostic performances for both modalities (58). Another emerging imaging approach for patients at high risk for metastases to bone from prostate cancer is whole-body MR imaging. This method has been shown to outperform conventional bone scans and had a lower sensitivity but higher specificity than 18F-NaF PET/CT in recent studies (66,67). In conclusion, choline-based PET/CT, acetate-based PET/CT, and NaF-based PET/CT are the most sensitive, specific, and adequately evaluated imaging modalities for metastases to bone from prostate cancer at the current time, although their diagnostic accuracy is not perfect. Emerging imaging techniques and tracers (FACBC, PSMA-directed agents, etc) are undergoing preclinical and clinical evaluation and may further enhance diagnostic precision in the assessment of patients with prostate cancer recurrence. A particular issue affecting most studies evaluating metastatic prostate cancer is the absence of a standard methodologic approach for translation of newly developed compounds, which limits the comparability of reported results among different tracers.
Conclusion
Molecular imaging strategies for evaluating prostate cancer make use of the increased metabolic needs of cancer cells, the tumor-specific expression of androgen receptors and membrane proteins, or the osteoblastic reaction adjacent to bone marrow metastases. Each imaging method has both advantages and disadvantages. Selection of the imaging strategy most appropriate for the clinical situation, as well as knowledge about the biologic mechanisms underlying each imaging approach and the pharmacologic properties of the individual tracers, will help realize the full potential of tracers and avoid pitfalls. Also, there is an urgent need to develop standardized methodology for evaluating new and existing tracers that are relevant to prostate cancer imaging, to allow comparison of the results reported with different compounds.
Presented as an education exhibit at the 2014 RSNA Annual Meeting.
For this journal-based SA-CME activity, the author W.A.W. has provided disclosures (see “Disclosures of Conflicts of Interest”); all other authors, the editor, and reviewers have disclosed no relevant relationships.
This research was funded in part through the NIH/NCI Cancer Center support grant P30 CA008748.
Disclosures of Conflicts of Interest.—: W.A.W. Activities related to the present article: disclosed no relevant relationships. Activities not related to the present article: member of Advisory Board of Endocyte; research support from Piramal. Other activities: disclosed no relevant relationships.
Abbreviations:
- FACBC
- anti-18F-1-amino-3-fluorocyclobutane-1-carboxylic acid
- FDG
- 18F-fluorodeoxyglucose
- FDHT
- 18F-16β-fluoro-5α-dihydrotestosterone
- PSA
- prostate-specific antigen
- PSMA
- prostate-specific membrane antigen
References
- 1.Surveillance, Epidemiology, and End Results Program . SEER stat fact sheets: prostate cancer—statistics at a glance. National Cancer Institute Web site. http://seer.cancer.gov/statfacts/html/prost.html. Published 2015. Accessed January 12, 2015.
- 2.Mazaris E, Tsiotras A. Molecular pathways in prostate cancer. Nephrourol Mon 2013;5(3):792–800. [DOI] [PMC free article] [PubMed] [Google Scholar]
- 3.Jahn JL, Giovannucci EL, Stampfer MJ. The high prevalence of undiagnosed prostate cancer at autopsy: implications for epidemiology and treatment of prostate cancer in the prostate-specific antigen-era. Int J Cancer 2015;137(12):2795–2802. [DOI] [PMC free article] [PubMed] [Google Scholar]
- 4.Ramírez de Molina A, Gutiérrez R, Ramos MA, et al. Increased choline kinase activity in human breast carcinomas: clinical evidence for a potential novel antitumor strategy. Oncogene 2002;21(27):4317–4322. [DOI] [PubMed] [Google Scholar]
- 5.Emonds KM, Swinnen JV, Lerut E, Koole M, Mortelmans L, Mottaghy FM. Evaluation of androgen-induced effects on the uptake of [18F]FDG, [11C]choline and [11C]acetate in an androgen-sensitive and androgen-independent prostate cancer xenograft model. EJNMMI Res 2013;3(1):31. [DOI] [PMC free article] [PubMed] [Google Scholar]
- 6.Hara T, Bansal A, DeGrado TR. Effect of hypoxia on the uptake of [methyl-3H]choline, [1-14C] acetate and [18F]FDG in cultured prostate cancer cells. Nucl Med Biol 2006;33(8):977–984. [DOI] [PubMed] [Google Scholar]
- 7.Beheshti M, Imamovic L, Broinger G, et al. 18F choline PET/CT in the preoperative staging of prostate cancer in patients with intermediate or high risk of extracapsular disease: a prospective study of 130 patients. Radiology 2010;254(3):925–933. [DOI] [PubMed] [Google Scholar]
- 8.Igerc I, Kohlfürst S, Gallowitsch HJ, et al. The value of 18F-choline PET/CT in patients with elevated PSA-level and negative prostate needle biopsy for localisation of prostate cancer. Eur J Nucl Med Mol Imaging 2008;35(5):976–983. [DOI] [PubMed] [Google Scholar]
- 9.de Perrot T, Rager O, Scheffler M, et al. Potential of hybrid 18F-fluorocholine PET/MRI for prostate cancer imaging. Eur J Nucl Med Mol Imaging 2014;41(9):1744–1755. [DOI] [PubMed] [Google Scholar]
- 10.Evangelista L, Guttilla A, Zattoni F, Muzzio PC, Zattoni F. Utility of choline positron emission tomography/computed tomography for lymph node involvement identification in intermediate- to high-risk prostate cancer: a systematic literature review and meta-analysis. Eur Urol 2013;63(6):1040–1048. [DOI] [PubMed] [Google Scholar]
- 11.Evangelista L, Zattoni F, Guttilla A, et al. Choline PET or PET/CT and biochemical relapse of prostate cancer: a systematic review and meta-analysis. Clin Nucl Med 2013; 38(5):305–314. [DOI] [PubMed] [Google Scholar]
- 12.von Eyben FE, Kairemo K. Meta-analysis of (11)C-choline and (18)F-choline PET/CT for management of patients with prostate cancer. Nucl Med Commun 2014;35(3):221–230. [DOI] [PubMed] [Google Scholar]
- 13.Castellucci P, Fuccio C, Rubello D, et al. Is there a role for 11C-choline PET/CT in the early detection of metastatic disease in surgically treated prostate cancer patients with a mild PSA increase <1.5 ng/ml? Eur J Nucl Med Mol Imaging 2011;38(1):55–63. [DOI] [PubMed] [Google Scholar]
- 14.Picchio M, Messa C, Landoni C, et al. Value of [11C]choline-positron emission tomography for re-staging prostate cancer: a comparison with [18F]fluorodeoxyglucose-positron emission tomography. J Urol 2003;169(4):1337–1340. [DOI] [PubMed] [Google Scholar]
- 15.Bauman G, Belhocine T, Kovacs M, Ward A, Beheshti M, Rachinsky I. 18F-Fluorocholine for prostate cancer imaging: a systematic review of the literature. Prostate Cancer Prostatic Dis 2012;15(1):45–55. [DOI] [PubMed] [Google Scholar]
- 16.Yoshii Y, Furukawa T, Saga T, Fujibayashi Y. Acetate/acetyl-CoA metabolism associated with cancer fatty acid synthesis: overview and application. Cancer Lett 2015;356(2 pt A):211–216. [DOI] [PubMed] [Google Scholar]
- 17.Yun M, Bang SH, Kim JW, Park JY, Kim KS, Lee JD. The importance of acetyl coenzyme A synthetase for 11C-acetate uptake and cell survival in hepatocellular carcinoma. J Nucl Med 2009;50(8):1222–1228. [DOI] [PubMed] [Google Scholar]
- 18.Yoshii Y, Waki A, Furukawa T, et al. Tumor uptake of radiolabeled acetate reflects the expression of cytosolic acetyl-CoA synthetase: implications for the mechanism of acetate PET. Nucl Med Biol 2009;36(7):771–777. [DOI] [PubMed] [Google Scholar]
- 19.Chajès V, Cambot M, Moreau K, Lenoir GM, Joulin V. Acetyl-CoA carboxylase alpha is essential to breast cancer cell survival. Cancer Res 2006;66(10):5287–5294. [DOI] [PubMed] [Google Scholar]
- 20.Vāvere AL, Kridel SJ, Wheeler FB, Lewis JS. 1-11C-Acetate as a PET radiopharmaceutical for imaging fatty acid synthase expression in prostate cancer. J Nucl Med 2008;49(2):327–334. [DOI] [PubMed] [Google Scholar]
- 21.Mena E, Turkbey B, Mani H, et al. 11C-Acetate PET/CT in localized prostate cancer: a study with MRI and histopathologic correlation. J Nucl Med 2012;53(4):538–545. [DOI] [PMC free article] [PubMed] [Google Scholar]
- 22.Mohsen B, Giorgio T, Rasoul ZS, et al. Application of C-11-acetate positron-emission tomography (PET) imaging in prostate cancer: systematic review and meta-analysis of the literature. BJU Int 2013;112(8):1062–1072. [DOI] [PubMed] [Google Scholar]
- 23.Oyama N, Miller TR, Dehdashti F, et al. 11C-Acetate PET imaging of prostate cancer: detection of recurrent disease at PSA relapse. J Nucl Med 2003;44(4):549–555. [PubMed] [Google Scholar]
- 24.Effert P, Beniers AJ, Tamimi Y, Handt S, Jakse G. Expression of glucose transporter 1 (Glut-1) in cell lines and clinical specimens from human prostate adenocarcinoma. Anticancer Res 2004;24(5A):3057–3063. [PubMed] [Google Scholar]
- 25.Kukuk D, Reischl G, Raguin O, et al. Assessment of PET tracer uptake in hormone-independent and hormone-dependent xenograft prostate cancer mouse models. J Nucl Med 2011;52(10):1654–1663. [DOI] [PubMed] [Google Scholar]
- 26.Yu CY, Desai B, Ji L, Groshen S, Jadvar H. Comparative performance of PET tracers in biochemical recurrence of prostate cancer: a critical analysis of literature. Am J Nucl Med Mol Imaging 2014;4(6):580–601. [PMC free article] [PubMed] [Google Scholar]
- 27.Vargas HA, Wassberg C, Fox JJ, et al. Bone metastases in castration-resistant prostate cancer: associations between morphologic CT patterns, glycolytic activity, and androgen receptor expression on PET and overall survival. Radiology 2014;271(1):220–229. [DOI] [PMC free article] [PubMed] [Google Scholar]
- 28.Jadvar H, Desai B, Ji L, et al. Baseline 18F-FDG PET/CT parameters as imaging biomarkers of overall survival in castrate-resistant metastatic prostate cancer. J Nucl Med 2013;54(8):1195–1201. [DOI] [PMC free article] [PubMed] [Google Scholar]
- 29.Yu EY, Muzi M, Hackenbracht JA, et al. C11-Acetate and F-18 FDG PET for men with prostate cancer bone metastases: relative findings and response to therapy. Clin Nucl Med 2011;36(3):192–198. [DOI] [PMC free article] [PubMed] [Google Scholar]
- 30.Burgio SL, Fabbri F, Seymour IJ, Zoli W, Amadori D, De Giorgi U. Perspectives on mTOR inhibitors for castration-refractory prostate cancer. Curr Cancer Drug Targets 2012;12(8):940–949. [DOI] [PubMed] [Google Scholar]
- 31.Wang Q, Tiffen J, Bailey CG, et al. Targeting amino acid transport in metastatic castration-resistant prostate cancer: effects on cell cycle, cell growth, and tumor development. J Natl Cancer Inst 2013;105(19):1463–1473. [DOI] [PubMed] [Google Scholar]
- 32.Kairemo K, Rasulova N, Partanen K, Joensuu T. Preliminary clinical experience of trans-1-amino-3-(18)F-fluorocyclobutanecarboxylic acid (anti-(18)F-FACBC) PET/CT imaging in prostate cancer patients. BioMed Res Int 2014;2014(10):305182. [DOI] [PMC free article] [PubMed] [Google Scholar]
- 33.Nanni C, Schiavina R, Brunocilla E, et al. 18F-FACBC compared with 11C-choline PET/CT in patients with biochemical relapse after radical prostatectomy: a prospective study in 28 patients. Clin Genitourin Cancer 2014;12(2):106–110. [DOI] [PubMed] [Google Scholar]
- 34.Schuster DM, Nanni C, Fanti S, et al. Anti-1-amino-3-18F-fluorocyclobutane-1-carboxylic acid: physiologic uptake patterns, incidental findings, and variants that may simulate disease. J Nucl Med 2014;55(12):1986–1992. [DOI] [PMC free article] [PubMed] [Google Scholar]
- 35.Lu S, Hoestje SM, Choo EM, Epner DE. Methionine restriction induces apoptosis of prostate cancer cells via the c-Jun N-terminal kinase-mediated signaling pathway. Cancer Lett 2002;179(1):51–58. [DOI] [PubMed] [Google Scholar]
- 36.Macapinlac HA, Humm JL, Akhurst T, et al. Differential metabolism and pharmacokinetics of L-[1-11C]-methionine and 2-[18F] fluoro-2-deoxy-d-glucose (FDG) in androgen independent prostate cancer. Clin Positron Imaging 1999;2(3):173–181. [DOI] [PubMed] [Google Scholar]
- 37.Nuñez R, Macapinlac HA, Yeung HW, et al. Combined 18F-FDG and 11C-methionine PET scans in patients with newly progressive metastatic prostate cancer. J Nucl Med 2002;43(1):46–55. [PubMed] [Google Scholar]
- 38.Sarrouilhe D, Clarhaut J, Defamie N, Mesnil M. Serotonin and cancer: what is the link? Curr Mol Med 2015;15(1):62–77. [DOI] [PubMed] [Google Scholar]
- 39.Puccetti L, Supuran CT, Fasolo PP, et al. Skewing towards neuroendocrine phenotype in high grade or high stage androgen-responsive primary prostate cancer. Eur Urol 2005; 48(2):215–221; discussion 221–223. [DOI] [PubMed] [Google Scholar]
- 40.Kälkner KM, Ginman C, Nilsson S, et al. Positron emission tomography (PET) with 11C-5-hydroxytryptophan (5-HTP) in patients with metastatic hormone-refractory prostatic adenocarcinoma. Nucl Med Biol 1997;24(4):319–325. [DOI] [PubMed] [Google Scholar]
- 41.Sun H, Sloan A, Mangner TJ, et al. Imaging DNA synthesis with [18F]FMAU and positron emission tomography in patients with cancer. Eur J Nucl Med Mol Imaging 2005;32(1):15–22. [DOI] [PubMed] [Google Scholar]
- 42.Tehrani OS, Muzik O, Heilbrun LK, et al. Tumor imaging using 1-(2'-deoxy-2'-18F-fluoro-β-d-arabinofuranosyl) thymine and PET. J Nucl Med 2007;48(9):1436–1441. [DOI] [PubMed] [Google Scholar]
- 43.Dehdashti F, Picus J, Michalski JM, et al. Positron tomographic assessment of androgen receptors in prostatic carcinoma. Eur J Nucl Med Mol Imaging 2005;32(3):344–350. [DOI] [PubMed] [Google Scholar]
- 44.Rathkopf DE, Morris MJ, Fox JJ, et al. Phase I study of ARN-509, a novel antiandrogen, in the treatment of castration-resistant prostate cancer. J Clin Oncol 2013;31(28):3525–3530. [DOI] [PMC free article] [PubMed] [Google Scholar]
- 45.Sweat SD, Pacelli A, Murphy GP, Bostwick DG. Prostate-specific membrane antigen expression is greatest in prostate adenocarcinoma and lymph node metastases. Urology 1998;52(4):637–640. [DOI] [PubMed] [Google Scholar]
- 46.Ross JS, Sheehan CE, Fisher HA, et al. Correlation of primary tumor prostate-specific membrane antigen expression with disease recurrence in prostate cancer. Clin Cancer Res 2003;9(17):6357–6362. [PubMed] [Google Scholar]
- 47.Israeli RS, Powell CT, Corr JG, Fair WR, Heston WD. Expression of the prostate-specific membrane antigen. Cancer Res 1994;54(7):1807–1811. [PubMed] [Google Scholar]
- 48.Osborne JR, Green DA, Spratt DE, et al. A prospective pilot study of 89Zr-J591/prostate specific membrane antigen positron emission tomography in men with localized prostate cancer undergoing radical prostatectomy. J Urol 2014; 191(5):1439–1445. [DOI] [PMC free article] [PubMed] [Google Scholar]
- 49.Bandekar A, Zhu C, Jindal R, Bruchertseifer F, Morgenstern A, Sofou S. Anti–prostate-specific membrane antigen liposomes loaded with 225Ac for potential targeted antivascular α-particle therapy of cancer. J Nucl Med 2014;55(1):107–114. [DOI] [PubMed] [Google Scholar]
- 50.Tagawa ST, Milowsky MI, Morris M, et al. Phase II study of lutetium-177-labeled anti-prostate-specific membrane antigen monoclonal antibody J591 for metastatic castration-resistant prostate cancer. Clin Cancer Res 2013;19(18):5182–5191. [DOI] [PMC free article] [PubMed] [Google Scholar]
- 51.Afshar-Oromieh A, Zechmann CM, Malcher A, et al. Comparison of PET imaging with a 68Ga-labelled PSMA ligand and 18F-choline-based PET/CT for the diagnosis of recurrent prostate cancer. Eur J Nucl Med Mol Imaging 2014; 41(1):11–20. [DOI] [PMC free article] [PubMed] [Google Scholar]
- 52.Krohn T, Verburg FA, Pufe T, et al. [68Ga]PSMA-HBED uptake mimicking lymph node metastasis in coeliac ganglia: an important pitfall in clinical practice. Eur J Nucl Med Mol Imaging 2015;42(2):210–214. [DOI] [PubMed] [Google Scholar]
- 53.Zhang H, Abiraj K, Thorek DL, et al. Evolution of bombesin conjugates for targeted PET imaging of tumors. PLoS One 2012;7(9):e44046. [DOI] [PMC free article] [PubMed] [Google Scholar]
- 54.Mansi R, Fleischmann A, Mäcke HR, Reubi JC. Targeting GRPR in urological cancers: from basic research to clinical application. Nat Rev Urol 2013;10(4):235–244. [DOI] [PubMed] [Google Scholar]
- 55.Scopinaro F, De Vincentis G, Varvarigou AD, et al. 99mTc-bombesin detects prostate cancer and invasion of pelvic lymph nodes. Eur J Nucl Med Mol Imaging 2003;30(10):1378–1382. [DOI] [PubMed] [Google Scholar]
- 56.Gornik G, Mansi R, Abiraj K, et al. Evaluation of the GRPR radioantagonist Cu-64-CB-TE2A-AR-06 in mice and men [abstr]. J Nucl Med 2011;52(suppl 1):22. [Google Scholar]
- 57.Kähkönen E, Jambor I, Kemppainen J, et al. In vivo imaging of prostate cancer using [68Ga]-labeled bombesin analog BAY86-7548. Clin Cancer Res 2013;19(19):5434–5443. [DOI] [PubMed] [Google Scholar]
- 58.Wondergem M, van der Zant FM, van der Ploeg T, Knol RJ. A literature review of 18F-fluoride PET/CT and 18F-choline or 11C-choline PET/CT for detection of bone metastases in patients with prostate cancer. Nucl Med Commun 2013; 34(10):935–945. [DOI] [PubMed] [Google Scholar]
- 59.Jiang ZK, Sato M, Wei LH, Kao C, Wu L. Androgen-independent molecular imaging vectors to detect castration-resistant and metastatic prostate cancer. Cancer Res 2011;71(19):6250–6260. [DOI] [PMC free article] [PubMed] [Google Scholar]
- 60.Sato M, Figueiredo ML, Burton JB, et al. Configurations of a two-tiered amplified gene expression system in adenoviral vectors designed to improve the specificity of in vivo prostate cancer imaging. Gene Ther 2008;15(8):583–593. [DOI] [PMC free article] [PubMed] [Google Scholar]
- 61.Pouliot F, Karanikolas BD, Johnson M, et al. In vivo imaging of intraprostatic-specific gene transcription by PET. J Nucl Med 2011;52(5):784–791. [DOI] [PMC free article] [PubMed] [Google Scholar]
- 62.de Rooij M, Hamoen EH, Fütterer JJ, Barentsz JO, Rovers MM. Accuracy of multiparametric MRI for prostate cancer detection: a meta-analysis. AJR Am J Roentgenol 2014;202(2):343–351. [DOI] [PubMed] [Google Scholar]
- 63.Hövels AM, Heesakkers RA, Adang EM, et al. The diagnostic accuracy of CT and MRI in the staging of pelvic lymph nodes in patients with prostate cancer: a meta-analysis. Clin Radiol 2008;63(4):387–395. [DOI] [PubMed] [Google Scholar]
- 64.Wu LM, Xu JR, Gu HY, et al. Role of magnetic resonance imaging in the detection of local prostate cancer recurrence after external beam radiotherapy and radical prostatectomy. Clin Oncol (R Coll Radiol) 2013;25(4):252–264. [DOI] [PubMed] [Google Scholar]
- 65.Panebianco V, Sciarra A, Lisi D, et al. Prostate cancer: 1HMRS-DCEMR at 3 T versus [(18)F]choline PET/CT in the detection of local prostate cancer recurrence in men with biochemical progression after radical retropubic prostatectomy (RRP). Eur J Radiol 2012;81(4):700–708. [DOI] [PubMed] [Google Scholar]
- 66.Lecouvet FE, El Mouedden J, Collette L, et al. Can whole-body magnetic resonance imaging with diffusion-weighted imaging replace Tc 99m bone scanning and computed tomography for single-step detection of metastases in patients with high-risk prostate cancer? Eur Urol 2012;62(1):68–75. [DOI] [PubMed] [Google Scholar]
- 67.Mosavi F, Johansson S, Sandberg DT, Turesson I, Sörensen J, Ahlström H. Whole-body diffusion-weighted MRI compared with 18F-NaF PET/CT for detection of bone metastases in patients with high-risk prostate carcinoma. AJR Am J Roentgenol 2012;199(5):1114–1120. [DOI] [PubMed] [Google Scholar]


