

Abstract
Loneliness is associated with impaired mental and physical health. Studies of lonely individuals reported differential expression of inflammatory genes in peripheral leukocytes and diminished activation in brain reward regions such as nucleus accumbens, but could not address gene expression in the human brain. Here, we examined genome-wide RNA expression in postmortem nucleus accumbens from donors (N = 26) with known loneliness measures. Loneliness was associated with 1 710 differentially expressed transcripts from 1 599 genes (DEGs; FDR p < 0.05, fold-change ≥ |2|, controlling for confounds) previously associated with behavioral processes, neurological disease, psychological disorders, cancer, organismal injury, and skeletal and muscular disorders, as well as networks of upstream RNA regulators. Furthermore, a number of DEGs were associated with Alzheimer’s disease genes (which was correlated with loneliness in this sample, although gene expression analyses controlled for AD diagnosis). These results identify novel targets for future mechanistic studies of gene networks in nucleus accumbens and gene regulatory mechanisms across a variety of diseases exacerbated by loneliness.
Loneliness has been defined as a negative emotional state of unfulfilled intimate and social needs (1). It can also be considered as a behavioral trait, because it is stable over time (2, 3), difficult to alter with interventions (4), and heritable (5). Loneliness is a subjective perception of social isolation and therefore independent of objective measures such as social network size (1), making it a challenge to study in non-human animals.
Loneliness has a profoundly negative impact on psychological/behavioral processes including mental health, particularly in aging populations. For example, loneliness is associated with depression and anxiety (6–8). Longitudinal studies of cognition reported that loneliness at baseline predicted cognitive decline in recall memory over a 4-year period (9), was associated with lower levels of perceptual processing and memory at baseline (10), overall cognitive decline (11) and incident dementia (12), as well as a decline in motor function (13). The underlying molecular-genetic mechanisms of these associations are currently unknown, in part because gene expression as a function of loneliness has not yet been examined in the human brain.
Loneliness is also associated with increased risk for neurological and neurodegenerative diseases such as Alzheimer’s disease (AD) (10), as well as cancer (17, 18), and organismal and muscular diseases and disorders that include cardiovascular disease (14–16), and dysfunction of the immune system and inflammatory disease (19–21). The molecular-genetic mechanisms underlying some of these associations have begun to be examined at the level of the transcriptome (22), in which genes responsive to glucocorticoids and genes within pro-inflammatory pathways were differentially expressed. Whether similar expression patterns are manifested in the human brain is currently unknown.
Here, we set out to examine the expression profile of mRNAs in the human brain as a function of loneliness. We took advantage of data and tissue from the Rush Memory and Aging Project (MAP), a longitudinal prospective cohort study of common chronic conditions of aging (35). We selected the nucleus accumbens as our a priori region of interest, based on work that had shown the nucleus accumbens to be involved in (social) reward processing (36–38), and a functional magnetic resonance imaging (fMRI) study that reported reduced activation in the nucleus accumbens of lonely individuals (39).
We used a microarray approach to measure genome-wide mRNA expression in nucleus accumbens tissue from 26 donors (see Table 1 for demographic and related sample information) with known loneliness phenotypes, based on self-report at baseline (representing the trait-like aspects of loneliness when participants were relatively healthy, e.g., without known dementia, rather than the state-like aspects of loneliness proximate to death).
Table 1.
| Nucleus Accumbens Cohort | Low Loneliness | High Loneliness | t-test | chi-square |
|---|---|---|---|---|
| Sample Size | 13 (6 F) | 13 (6 F) | ||
| Loneliness score (1–4) at initial visit (M, sd) | 1.7 (0.4) | 3.2 (0.3) | p < 0.0001 | |
| Interval: initial visit to death in years (M, sd) | 2.6 (1.1) | 2.1 (0.8) | p = 0.20 | |
| Loneliness score (1–4) at last visit (M, sd) | 2.0 (0.7) | 3.0 (0.6) | p = 0.0003 | |
| Interval: last visit to death in years (M, sd) | 0.9 (0.4) | 0.9 (0.7) | p = 0.85 | |
| Demographics | ||||
| Education in years (M, sd) | 15.1 (3.0) | 14.2 (3.6) | p = 0.52 | |
| Age at initial visit (M, sd) | 81.9 (7.1) | 87.0 (5.2) | p = 0.05 | |
| Age at last visit (M, sd) | 83.7 (7.4) | 88.1 (5.5) | p = 0.09 | |
| Age at death (M, sd) | 84.6 (7.5) | 89.1 (5.2) | p = 0.09 | |
| Cognitive and Neurodegenerative Measures | ||||
| Last MMSE prior to death (M, sd) | 24.5 (6.8) | 20.6 (8.0) | p = 0.19 | |
| Clinical interval, last MMSE prior to death in days (M, sd) | 283.92 (173.9) | 222.15 (72.6) | p = 0.25 | |
| Global Cognition last visit | −0.2 (0.9) | −1.1 (0.8) | p<.02 | |
| Final clinical diagnosis of Parkinson’s (yes/no) | 3/10 | 0/13 | ||
| ApoE genotype | p = 0.109 | |||
| E2E2 | 0 | 0 | ||
| E2E3 | 3 | 1 | ||
| E2E4 | 1 | 0 | ||
| E3E3 | 9 | 8 | ||
| E3E4 | 0 | 4 | ||
| E4E4 | 0 | 0 | ||
| Braak Stage | p = 0.018 | |||
| I | 5 | 0 | ||
| II | 2 | 0 | ||
| III | 5 | 6 | ||
| IV | 0 | 3 | ||
| V | 1 | 4 | ||
| VI | 0 | 0 | ||
| Assessment of neuritic plaques | p = 0.026 | |||
| definite | 4 | 3 | ||
| probable | 2 | 9 | ||
| possible | 2 | 0 | ||
| no AD | 5 | 1 | ||
| NIA Reagan score | p = 0.015 | |||
| high likelihood | 1 | 2 | ||
| intermediate likelihood | 4 | 10 | ||
| low likelihood | 8 | 1 | ||
| no AD | 0 | 0 | ||
| Overall cognitive diagnostic category | p = 0.196 | |||
| no cognitive impairment | 6 | 2 | ||
| mild cognitive impairment | 3 | 5 | ||
| Alzheimer’s disease (AD) | 4 | 6 | ||
| Life Style | ||||
| Grams of alcohol per day (M, sd) | 3.2 (10.4) | 6.4 (11.5) | p = 0.46 | |
| Lifetime daily alcohol intake (LDAI) at baseline | 0.4 (0.9) | 0.5 (0.7) | p = 0.91 | |
| Smoking quantity at baseline (cigarettes/day: M, sd) | 13.8 (15.1) | 20.0 (11.4) | p = 0.46 | |
| Smoking at baseline | p = 0.691 | |||
| never | 8 | 7 | ||
| former smoker | 5 | 6 | ||
| current smoker | 0 | 0 | ||
| Body Mass Index at baseline | 25.0 (3.6) | 24.2 (1.8) | p = 0.50 | |
| Body Mass Index at last visit | 24.4 (3.7) | 24.0 (2.3) | p = 0.76 | |
| Medical Conditions | ||||
| Clinician Rating of Depression at baseline | p = 0.141 | |||
| not present | 13 | 11 | ||
| possible | 0 | 2 | ||
| probable | 0 | 0 | ||
| highly probable | 0 | 0 | ||
| Clinician Rating of Depression at last visit | p = 0.336 | |||
| not present | 12 | 10 | ||
| possible | 1 | 2 | ||
| probable | 0 | 1 | ||
| highly probable | 0 | 0 | ||
| Hypertension ever (yes/no) | 6/7 | 6/7 | p = 1.0 | |
| Cancer ever (yes/no) | 5/8 | 2/11 | p = 0.185 | |
| History of Diabetes (yes/no) | 1/12 | 1/12 | p = 1.0 | |
| History of head injury with loss of consciousness (yes/no) | 1/12 | 0/13 | p = 0.308 | |
| History of thyroid disease (yes/no) | 3/10 | 1/12 | p = 0.277 | |
| History of heart condition (yes/no) | 3/10 | 5/8 | p = 0.395 | |
| History of congestive heart failure (yes/no) | 1/12 | 1/12 | p = 1.0 | |
| History of claudication (yes/no) | 1/12 | 2/11 | p = 0.539 | |
| Clinical diagnosis of stroke ever (yes/no) | 2/11 | 3/10 | p = 0.619 | |
| Prescription medication during 2 weeks prior to death | p = 0.156 | |||
| yes | 9 | 10 | ||
| no | 0 | 0 | ||
| don’t know | 2 | 0 | ||
| no answer | 2 | 3 | ||
| Vitamins taken during 2 weeks prior to death | p = 0.012 | |||
| yes | 2 | 8 | ||
| no | 5 | 2 | ||
| don’t know | 4 | 0 | ||
| no answer | 2 | 3 | ||
| Other nonprescription medicines taken during 2 weeks prior to death (pain medication, laxatives or bowel medicines, cold and cough, sleep, antacids or stomach medicines) | p = 0.257 | |||
| yes | 6 | 8 | ||
| no | 2 | 2 | ||
| don’t know | 3 | 0 | ||
| no answer | 2 | 3 | ||
| Deceased - Post Mortem information | ||||
| Agonal State Information | ||||
| died in sleep (yes/no/don’t know) | 2/9/0 | 2/7/1 | p = 0.547 | |
| died unexpectedly (yes/no) | 1/10 | 1/9 | p = 0.943 | |
| had major surgery with anaesthesia within two weeks prior to death (yes/no) | 1/9 | 0/9 | p = 0.330 | |
| breathing difficulty in the 3 days prior to death (yes/suspect/no) | 5/1/4 | 7/0/2 | p = 0.377 | |
| fever in the 3 days prior to death (yes/suspect/no/don’t know) | 3/1/3/3 | 4/0/5/0 | p = 0.203 | |
| infection in the 3 days prior to death (yes/suspect/no) | 4/2/4 | 2/0/7 | p = 0.179 | |
| unconscious in the hour prior to death (yes/suspect/no) | 9/0/1 | 5/1/3 | p = 0.212 | |
| on ventilator in the hour prior to death (yes/no) | 0/10 | 0/9 | ||
| Post Mortem Interval in mins (M, sd) | 340 (109) | 350 (128) | p = 0.83 | |
| RNA OD 260/280 Ratio | 2.0 (.05) | 2.0 (.03) | p = 0.50 | |
| RNA OD 260/230 Ration | 2.1 (.05) | 2.1 (.07) | p = 0.13 | |
Materials/Subjects and Methods
Subjects
All brain donors were participants in the ongoing Rush Memory and Aging Project (MAP), a cohort study of common chronic conditions of aging (35). MAP participants are older persons without known dementia at enrollment (“baseline”) who agree to annual detailed evaluation and organ donation at the time of death. The evaluation includes 21 cognitive performance tests and clinical evaluation from which dementia status and the presence of mild cognitive impairment (MCI) is determined annually as described (43, 44). The remaining subjects had no obvious cognitive impairment (NCI). The follow-up rate exceeds 95% and the autopsy rate exceeds 80%. The study was approved by the Institutional Review Board of Rush University Medical Center and all subjects signed an informed consent and Anatomical Gift Act.
Twenty-six White, non-Hispanic individuals without a clinical diagnosis of depression (i.e., excluding individuals who were rated “probable” or “highly probable” to be depressed by a clinician) at baseline were selected out of a pool of 247 MAP participants with reported loneliness data (see next section) by stratified random sub-sampling from a convenience sample from the top and bottom quartiles of loneliness scores (N=13 each), and matched for the number of females (N=6) in these quartiles. From these donors, nucleus accumbens tissue was collected for RNA expression analysis (see below). There was no significant difference between lonely and non-lonely individuals in education, age at death, last MMSE prior to death, agonic state prior to death, or a host of other potential confounds (see Table 1 for details, and Supplementary Table 1 for individual medication history). However, consistent with its known association with dementia (10), lonely individuals exhibited significantly poorer cognitive function and were more likely to have dementia and to meet pathologic criteria for AD. There was no significant difference between the two groups with respect to RNA quality control measures.
Self-Report Measures
Self-reported loneliness scores were collected annually. In a previous study of the MAP cohort there was no evidence of a linear or non-liner change in loneliness over up to five annual evaluations (10), consistent with earlier work that conceptualizes loneliness as trait-like (2). Self-reported loneliness scores were based on the average score from five response items scored on a 5-point Likert scale (1 = strongly disagree, 5 = strongly agree): 1. “I experience a general sense of emptiness”; 2. “I miss having people around”; 3. “I feel like I don’t have enough friends”; 4. “I often feel abandoned”; 5. “I miss having a really close friend” as previously described (10).
Brain tissue
At autopsy, the brainstem was removed and the brain hemisected. One hemisphere was cut into 1cm slabs in a plexiglass jig, put into individual freezer bags, placed on a metal plate, and put into a −80° freezer. This tissue was the source of the gene-expression studies. A complete neuropathologic evaluation was performed that included the determination of pathologic AD by NIA-Reagan criteria as described (45).
RNA extraction, Array Platform, and Analysis
Total RNA was isolated from frozen nucleus accumbens tissue using TRI Reagent (Sigma-Aldrich) followed by clean-up using the RNeasy kit (Qiagen). RNA quantity and quality were measured by NanoDrop ND-1000 and RNA integrity was assessed by standard denaturing agarose gel electrophoresis. Each individual’s sample was then prepared for the Arraystar Human LncRNA Array v2.0, which was designed for the global profiling of 30,215 human mRNA and 33,045 lncRNAs transcripts. On this array, each transcript is represented by a specific exon or splice junction probe to identify individual transcript accurately. The Arraystar Human LncRNA Array v2.0 contains positive probes for housekeeping genes and negative probes for hybridization quality control.
Sample labeling and array hybridization were performed according to the Agilent One-Color Microarray-Based Gene Expression Analysis protocol (Agilent Technology). Hybridized arrays were washed, fixed and scanned using the Agilent DNA Microarray Scanner (part number G2505C). Agilent Feature Extraction software (version 11.0.1.1) was used to analyze acquired array images. Quantile normalization and subsequent data processing were performed using the GeneSpring GX v11.5.1 software package (Agilent Technologies). After quantile normalization of the raw data, mRNAs for which at least 20 out of 26 samples had flags in Present or Marginal (“All Targets Value”) were chosen for further data analysis. Raw, normalized, and meta-data were deposited in the National Center for Biotechnology Information (NCBI) Gene Expression Omnibus (GEO) database under accession number GSE80696.
Data analysis of mRNAs
To analyze the association of loneliness with mRNA expression in nucleus accumbens, we used a multiple regression model, in which loneliness at baseline was entered as a continuous variable of interest and that included the following additional potential confounds: age at baseline, global cognition proximate to death, and Reagan AD score (a similar analysis, based on a logistic regression analysis in which loneliness was entered as a binary categorical variable – high versus low – produced very similar results; data not shown). The global cognition measure was based on 19 cognitive function tests converted to z-scores and averaged as previously reported (10). Overall diagnostic category was Alzheimer’s disease and mild cognitive impairment (MCI) as previously described (10, 43, 46). Persons without dementia or MCI were classified as no cognitive impairment. To identify differentially expressed transcripts and genes (DEGs), we screened for mRNAs with FDR-corrected p-values of < .05 and Fold-Change of ≥ |2.0|. These transcripts were then analyzed using QIAGEN’s Ingenuity® Pathway Analysis (IPA®, QIAGEN Redwood City, www.qiagen.com/ingenuity; Content version: 26127183; Release Date: 2015-11-30). Additional analyses were conducted using Gene Set Enrichment Analysis (47) v2.2.2, based on differentially expressed transcripts on a pre-ranked (by fold-change) list, compared against two curated Alzheimer’s Disease gene sets (MSigDB files: Blalock_Alzheimers_disease_up, Blalock Alzheimers_disease_down, (48)).
Real-time PCR Validation
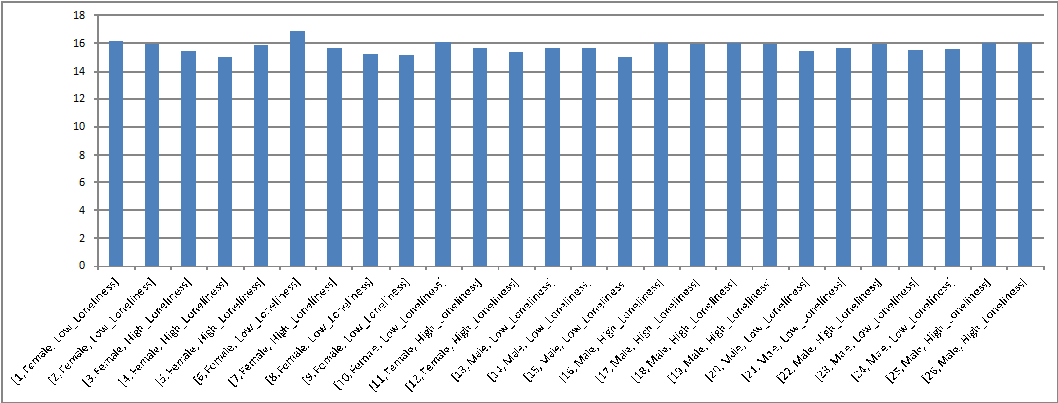
Twelve DEGs (ACAT2, AIG1, CART, GARS, GLRB, HAMP, LILRA2, MAPK8, OXTR, SNX7, TAC1, TSPAN7; Supplementary Table 2) were selected for validation using RT-qPCR. Relative expression values of transcripts were determined in accordance with the standard curve and then normalized to GAPDH by calculating the ratio between the concentration of the target gene and that of the housekeeping gene. Normalized intensities of GAPDH expression were constant across all 26 samples (Supplementary Figure 1), suggesting stable expression of GAPDH as an endogenous control. Data analysis was performed using ABI7900 Analysis Software SDS2.3.
Results
Stability of Loneliness
Loneliness can be viewed as both a state and a trait, and it is plausible that the level of loneliness changes near the end of life. Self-reported loneliness measures were available at baseline (2.3 years prior to death), when participants were relatively healthy (e.g., without known dementia) and at last visit proximate (0.9 years) to death. Levels of loneliness were stable within-subjects across these two visits (test-retest correlation r = 0.62, p = 0.0007; Supplementary Figure 2).
Analysis of differentially expressed genes (DEGs) as a function of loneliness
We identified 1 710 transcripts from 1 599 unique DEGs as a function of loneliness reported at baseline, based on a screen of FDR-corrected significance level of p < 0.05 and a minimum fold-change of |2|.
The complete list of transcripts, along with fold-change and significance levels, is presented in Supplementary Table 3. The ten most over- and under-expressed mRNAs in lonely individuals, their GO and fold-change information are listed in Table 2. Figure 1 shows individual (normalized) expression values for the five most over- and under-expressed mRNAs, respectively.
Table 2.
| mRNA over-expressed in lonely Individuals
| |||||||
|---|---|---|---|---|---|---|---|
| GeneSymbol | EntrezID | unigene | GO | ProteinAccession | Product | avg.log.fold.c hange | avg.fold.c hange |
| CARTPT | 9607 | Hs.1707 | GO:0003674|GO:0007186|GO:0000186|GO:0008343|GO:0007267|GO:0001678|GO:0009267|GO:0032922|GO:0032099|GO:0032099|GO:0045779|GO:0070093|GO:0045671|GO:0007218|GO:0045777|GO:0032812|GO:0051971|GO:0046850|GO:0050796|GO:0007165|GO:0070253|GO:0007268|GO:0005576|GO:0005615|GO:0005615 | NP_004282 | CART prepropeptide | 4.1 | 16.8 |
| UCHL1 | 7345 | Hs.518731 | GO:0031694|GO:0004197|GO:0016874|GO:0008242|GO:0008233|GO:0005515|GO:0043130|GO:0004221|GO:0007628|GO:0007412|GO:0019896|GO:0008283|GO:0042755|GO:0043407|GO:0050905|GO:0016579|GO:0006950|GO:0006511|GO:0030424|GO:0005737|GO:0005737|GO:0005737|GO:0005829|GO:0005622|GO:0043231|GO:0043025|GO:0005730|GO:0005634|GO:0005886|GO:0005886 | NP_004172 | Ubiquitin carboxyl-terminal esterase L1 (ubiquitin thiolesterase) | 3.4 | 10.8 |
| ATP6V1E1 | 529 | Hs.517338 | GO:0008553|GO:0016787|GO:0005515|GO:0046961|GO:0015991|GO:0006879|GO:0008286|GO:0006811|GO:0015992|GO:0033572|GO:0055085|GO:0016324|GO:0005737|GO:0005829|GO:0005829|GO:0005829|GO:0005768|GO:0005739|GO:0016469|GO:0033178 | NP_001687 | ATPase, H+ transporting, lysosomal 31kDa, V1 subunit E1 | 3.2 | 9.4 |
| GLRB | 2743 | Hs.32973 | GO:0005230|GO:0016934|GO:0016934|GO:0016933|GO:0016594|GO:0005216|GO:0005515|GO:0004872|GO:0007340|GO:0007628|GO:0034220|GO:0006811|GO:0007399|GO:0007218|GO:0051291|GO:0042391|GO:0060013|GO:0001964|GO:0007268|GO:0060012|GO:0055085|GO:0007601|GO:0030054|GO:0034707|GO:0005887|GO:0005624|GO:0005886|GO:0045211|GO:0045202 | NP_001159533 | Glycine receptor, beta | 3.1 | 8.5 |
| GAP43 | 2596 | Hs.134974 | GO:0005516|GO:0005515|GO:0007205|GO:0030154|GO:0007275|GO:0007399|GO:0040008|GO:0009611|GO:0030054|GO:0042995|GO:0032584|GO:0005886|GO:0045202 | NP_002036 | Growth associated protein 43 | 3.0 | 7.8 |
| RCN2 | 5955 | Hs.79088 | GO:0005509|GO:0005783|GO:0005788 | NP_002893 | Reticulocalbin 2, EF-hand calcium binding domain | 2.9 | 7.6 |
| ASPH | 444 | Hs.332422 | GO:0005488|GO:0005509|GO:0009055|GO:0016491|GO:0016702|GO:0004597|GO:0008307|GO:0005198|GO:0006936|GO:0055114|GO:0018193|GO:0005783|GO:0005789|GO:0030176|GO:0016021|GO:0016020 | NP_115857 | Aspartate beta-hydroxylase | 2.9 | 7.2 |
| PAM | 5066 | Hs.369430 | GO:0031418|GO:0005507|GO:0016829|GO:0046872|GO:0004598|GO:0004504|GO:0005515|GO:0009987|GO:0055114|GO:0006518|GO:0006464|GO:0005576|GO:0016021|GO:0016020|GO:0030141 | NP_620177 | Peptidylglycine alpha-amidating monooxygenase | 2.8 | 6.9 |
| TAC1 | 6863 | Hs.2563 | GO:0007267|GO:0009582|GO:0007204|GO:0007320|GO:0007218|GO:0007268|GO:0007217|GO:0005576|GO:0005576|GO:0005615 | NP_054704 | Tachykinin, precursor 1 | 2.8 | 6.9 |
| SFRP5 | 6425 | Hs.279565 | GO:0030165|GO:0042813|GO:0017147|GO:0061133|GO:0016055|GO:0009653|GO:0006915|GO:0060028|GO:0048546|GO:0009790|GO:0001736|GO:0007163|GO:0001654|GO:0030900|GO:0008406|GO:0030514|GO:0043508|GO:0090090|GO:0035414|GO:0008285|GO:2000041|GO:0051898|GO:0043433|GO:0001649|GO:0007389|GO:0090179|GO:0010950|GO:0090175|GO:0010551|GO:0030278|GO:0007165|GO:0035121|GO:0001944|GO:0007601|GO:0005737|GO:0005576|GO:0005615 | NP_003006 | Secreted frizzled-related protein 5 | 2.7 | 6.7 |
| mRNA under-expressed in lonely Individuals
| |||||||
|---|---|---|---|---|---|---|---|
| GeneSymbol | EntrezID | unigene | GO | ProteinAccession | Product | avg.log.fold.c hange | avg.fold.c hange |
| TFF1 | 7031 | Hs.162807 | GO:0008083|GO:0005975|GO:0007586|GO:0030277|GO:0032355|GO:0010039|GO:0043434|GO:0006950|GO:0005576|GO:0005615 | NP_003216 | Trefoil factor 1 | −2.0 | −4.0 |
| CXCR6 | 10663 | Hs.34526 | GO:0016494|GO:0004930|GO:0015026|GO:0007186|GO:0019079|GO:0005887|GO:0005886|GO:0005886 | NP_006555 | Chemokine (C-X-C motif) receptor 6 | −2.0 | −4.0 |
| DMP1 | 1758 | Hs.652366 | GO:0005509|GO:0050840|GO:0005178|GO:0031214|GO:0030198|GO:0001503|GO:0010811|GO:0005737|GO:0005576|GO:0005634|GO:0005578 | NP_004398 | Dentin matrix acidic phosphoprotein 1 | −2.1 | −4.2 |
| HIST4H4 | 121504 | Hs.718935 | NP_778224 | Histone cluster 4, H4 | −2.1 | −4.2 | |
| CIAPIN1 | 57019 | Hs.4900 | GO:0006916|GO:0006915|GO:0030097|GO:0005737|GO:0005737|GO:0005730|GO:0005634 | NP_064709 | Cytokine induced apoptosis inhibitor 1 | −2.1 | −4.2 |
| MPO | 4353 | Hs.458272 | GO:0003682|GO:0020037|GO:0008201|GO:0046872|GO:0016491|GO:0004601|GO:0006916|GO:0006952|GO:0050832|GO:0042744|GO:0002149|GO:0034374|GO:0044130|GO:0055114|GO:0019430|GO:0002679|GO:0006979|GO:0001878|GO:0005615|GO:0005764|GO:0005739|GO:0005634|GO:0030141 | NP_000241 | Myeloperoxidase | −2.1 | −4.3 |
| HAMP | 57817 | Hs.8821 | GO:0005179|GO:0006879|GO:0042742|GO:0050832|GO:0006955|GO:0031640|GO:0045179|GO:0005737|GO:0005576 | NP_066998 | Hepcidin antimicrobial peptide | −2.3 | −5.0 |
| DENND2C | 163259 | Hs.654928 | NP_940861 | DENN/MADD domain containing 2C | −2.4 | −5.3 | |
| ZDBF2 | 57683 | Hs.110489 | GO:0046872|GO:0003676|GO:0008270 | NP_065974 | Zinc finger, DBF-type containing 2 | −2.5 | −5.5 |
| DEFA3 | 1668 | Hs.654448 | GO:0042742|GO:0050832|GO:0031640|GO:0009615|GO:0005576|GO:0005615 | NP_005208 | Defensin, alpha 3, neutrophil-specific | −3.1 | −8.6 |
Figure 1.

Individuals’ gene expression values for the top-five over-expressed and under-expressed mRNAs. Scatter plot shows normalized expression values for 13 lonely and 13 non-lonely individuals. Red bar indicates mean expression.
DEGs associated with behavior
In the category of “Top Diseases and Bio Functions: Physiological System Development and Function”, IPA identified “Behavior” as the top-scoring gene set, which is presented in Supplementary Table 4.
DEG sets associated with diseases and disorders
In the category of “Top Diseases and Bio Functions: Diseases and Disorders”, IPA identified these sets: (1) “neurological disease”, (2) “psychological disorders”, (3) “cancer”, (4) “organismal injury and abnormalities” and (5) “skeletal and muscular disorders”, which are presented in Supplementary Tables 5 to 9.
Pleiotropic genes
We next identified pleiotropic genes by cross-referencing across these sets by Venn diagram (49) (for ease of presentation, sets for “behavior” and “psychological disorders” were combined into one category, as were sets for “organismal injury and abnormalities” and “skeletal and muscular disorders”), as shown in Figure 2, and listed in Supplementary Table 10. One-hundred-seventy-seven genes were most pleiotropic, participating in all four gene sets (Supplementary Table 10, column J). To determine their common molecular and cellular functions, these 177 genes were subjected to a secondary IPA analysis, which attributed these functions: cell death and survival, cell-to-cell signaling and interaction, molecular transport, lipid metabolism, and small molecule biochemistry. The complete set of genes is provided in Supplementary Table 11.
Figure 2.
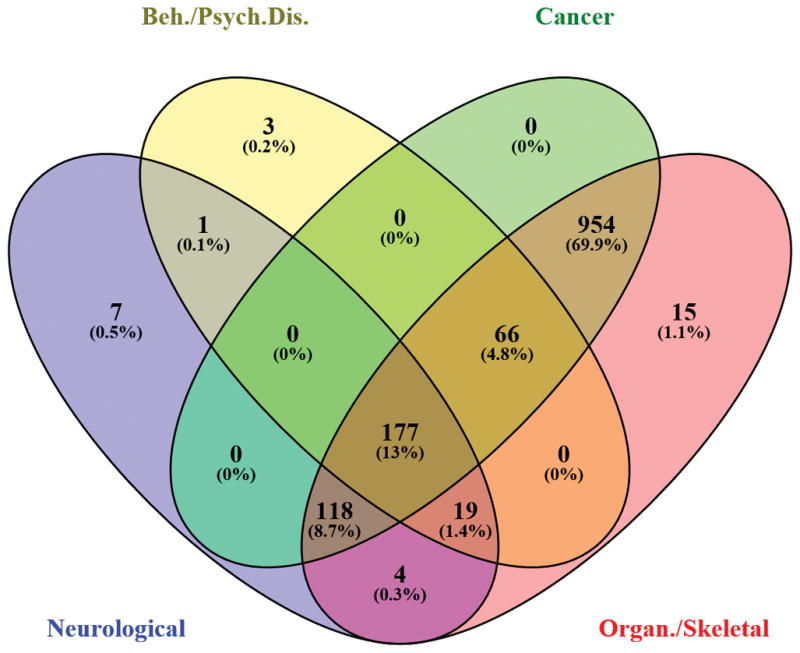
Venn Diagram of DEGs across four categories: (1) “neurological disease”; (2) “behavior” plus “psychological disorders”; (3) “cancer”; and (4) “organismal injury and abnormalities” plus “skeletal and muscular disorders”.
Canonical Pathways of DEGs
IPA identified as the top-5 canonical pathways: mitochondrial dysfunction, oxidative phosphorylation, TCA Cycle II, protein ubiquitination, and assembly of RNA polymerase II complex. The complete list of significant canonical pathways is given in Supplementary Table 12.
Upstream regulators and regulator effect networks
We next conducted an upstream regulator analysis in IPA to evaluate whether apparently disparate gene sets (e.g., gene sets associated with psychological/behavioral processes versus cancer) are regulated by common upstream molecules. Molecules were screened to include genes, RNAs, and proteins, and satisfied a statistical screen of IPA activation z-scores of |2| or greater, and overlap p-values of p<0.05. We identified 23 upstream regulators (listed in Supplementary Table 13) that included ligand-dependent nuclear receptors, kinases, transcription regulators, phosphatases, enzymes, microRNAs, and other molecules. Ten of these upstream regulators also participate in mechanistic networks with other regulators, with whom they share a significant overlap in the regulation of downstream genes; these mechanistic networks are shown in Figure 3. In order to understand how these upstream regulators might have functional downstream effects, we used IPA’s Regulator Effect Networks analysis, which identified four sets of networks, shown in Supplementary Figure 3, that play a role in (1) synthesis of purine nucleotides, purine ribonucleotides, metabolism of nucleoside triphosphate; (2) inflammation of the heart; (3) movement disorders; and (4) infection by RNA virus.
Figure 3.

Mechanistic networks of upstream regulators identified by IPA.
Gene Set Enrichment Analysis (GSEA)
To examine potential links between DEGs and previously reported AD genes, we selected two curated AD gene sets (MSigDB files: Blalock_Alzheimers_disease_up, Blalock Alzheimers_disease_down, (48)). Using a screening threshold of FDR-corrected p-values of < 0.05, both sets were significantly enriched (Supplementary Table 14; Blalock_Alzheimers_disease_up: Enrichment score (ES) = -0.16, normalized ES = −1.95, FDR q-val < 0.001; Blalock_ Alzheimers_disease down: Enrichment score (ES) = 0.33, normalized ES = 2.65, FDR q-val < 0.001).
Discussion
Loneliness is associated with impaired psychological/behavioral processes including mental health (8–11, 13), as well as neurodegenerative and other physical diseases (10, 14–21). Prior work focused on differential gene expression in peripheral tissue (22, 50) and differential neural activation (39), but has not yet examined differential gene expression in the brain. Here, we investigated genome-wide RNA expression profiles as a function of loneliness in the postmortem brain. We correlated gene expression with loneliness at baseline to capture its trait-related aspects, when participants were relatively healthy; loneliness proximate to death would more likely capture state-related aspects, when participants may have been subject to mental and physical decline. We focused on differentially expressed genes (DEGs) in the nucleus accumbens, based on prior work that associated this region with loneliness, and with the processing of social rewards and stimuli (36–39).
Consistent with the view that loneliness is a trait-like phenotype, we observed that within-subject repeated measures of loneliness at baseline (2.3 years prior to death) and at last visit (0.9 years prior to death) were stable.
Loneliness at baseline was associated with differential expression of large numbers of genes in the nucleus accumbens. It was striking that IPA identified “Behavior” as the top-scoring biological function in the “Physiological Systems Development and Function” category, containing gene sets that fell into three distinct behavioral sub-categories: affective/social, cognitive, and motor, corresponding to deficits observed in lonely individuals. For example, in the affective/social sub-category, the largest group of genes was related to emotional behavior and anxiety. Indeed, loneliness is associated with social anxiety, even after controlling for level of depression (51). One of the genes in this set was Cocaine and Amphetamine regulated Transcript Protein (CARTPT, or CART). Indeed, CART was the highest up-regulated gene overall.
CART is abundantly expressed in the brain, including nucleus accumbens (52). In rodents, it is associated with reduced social interactions (53). In humans, loneliness is associated with high levels of stress hormones (2), and CART is expressed abundantly across all three levels of the hypothalamic–pituitary–adrenal (HPA) stress axis (54). Finally, CART interacts with dopamine (DA) (55) and, when infused into the nucleus accumbens, counters the behavioral effects of DA (56). It is therefore plausible, albeit speculative, that the DA-countering actions of high levels of CART may contribute to reduced nucleus accumbens activation in lonely individuals (39), which may make social interactions feel less rewarding (40) and diminish the experience of social uplifts (2). It is unknown whether these elevated levels of CART reflect a cause (if any) or consequence of subjective social isolation.
IPA identified (1) “neurological disease”, (2) “psychological disorders”, (3) “cancer”, (4) “organismal injury and abnormalities”, and (5) “skeletal and muscular disorders” as the top-scoring biological functions in the “Diseases and Disorders” category. Furthermore, GSE analysis identified links with 169 AD-related genes. This suggests that at least some genes involved in AD may also be involved in loneliness, based on unknown mechanisms. The causal relationship, if any, between loneliness at baseline and expression of these disease-related gene sets in postmortem tissue remains uncertain in the absence of baseline gene expression data. On the one hand, loneliness at baseline may indeed predict expression of disease-related genes in the nucleus accumbens by an average of 2.3 years at the time of death. On the other hand, the observed expression pattern could be causal in the opposite direction, such that the observed level of loneliness at baseline may have resulted from as-yet-undiagnosed, subclinical brain disease.
We identified a number of differentially expressed canonical pathways, which can be interpreted in light of patient history. For example, among the most significant differentially expressed canonical pathways were mitochondrial dysfunction, oxidative phosphorylation, and protein ubiquitination. In this study cohort, a larger proportion of lonely than non-lonely individuals met pathologic criteria for AD at the time of death (our analyses controlled for AD status), and mitochondrial dysfunction may be the primary driver of AD pathology (57–59). Oxidative phosphorylation within neuronal mitochondria may reflect reduced neuronal energy demands in the early stages of AD (61, 62). Protein ubiquitination is a mechanism by which misfolded proteins may be tagged for removal by the ubiquitin-proteasome (UPS) and the autophagy-lysomal pathways (ALP), and this process may be impaired in AD (60).
Our analyses allow us to begin examining the underlying molecular and regulatory architecture of the many disparate loneliness-associated behavioral and disease phenotypes. Given that the assignment of differentially expressed mRNAs to particular functional domains by IPA and GSEA was algorithmically based and hence bias-free, it is therefore remarkable that many of the differentially expressed genes had previously been associated with behavioral and disease-related processes associated with loneliness. Using these analytic tools, we identified many pleiotropic DEGs associated with more than one of these phenotypes. Indeed, a subset of genes was associated with all of these phenotypes, and this subset was characterized by playing a role in critical cellular and molecular functions. For example, the involvement of these most-pleiotropic DEGs in cell death could play a role in diminishing cell health in the nucleus accumbens, contributing to a behavioral phenotype that is less responsive to (social) reward, and have downstream effects on the expression of other genes.
In addition to pleiotropy, we conducted formal network analyses to identify upstream regulators of DEGs, mechanistic networks of such regulators, and regulator effect networks. For example, MYC (V-myc myelocytomatosis viral related oncogene) is an upstream regulator of 90 downstream target genes; it is also a proto-oncogene that itself was over-expressed in lonely individuals (FC 3.0). Within its mechanistic network, MYC controls such critical regulators as TP53 (Tumor Suppressor Protein 53), which has protective functions, CREB (cAMP response element-binding protein), which is a ubiquitous transcription factor with central roles in learning and memory, and NR3C1 (glucocorticoid receptor) which plays a role in the stress response. Among identified regulator effect networks are two that are involved in inflammation of the heart and in movement disorders, respectively, and loneliness is associated with cardiovascular disease (14–16), and decline in motor function (13). An intriguing speculation to emerge from these data is that apparently unrelated sequelae of loneliness, which may range from cognitive decline to a wide range of different diseases, may reflect an underlying genetic network architecture of pleiotropic genes and networks.
A limitation of the current study is the sample size, although it is comparable with other recent gene expression profiling studies (64, 65). Despite the relatively small sample size, results were robust, based on FDR-corrected statistical and fold-change thresholds and modeled to control for age at baseline, global cognition at last visit, and AD status. Statistical controls notwithstanding, the correlation of AD with loneliness in this sample makes it difficult to dissociate differential gene expression as a function of loneliness per se from gene expression as a function of AD, and future studies of the neuro-genomics of loneliness would benefit from samples that are not affected by dementia.
Another limitation of the study is that extraction of the tissue was conducted without the removal of blood cells and vessels. This represents a potential confound, since the source of (some) DEGs could have been blood leukocytes rather than neuronal tissue per se. Future studies will need to address this possibility by removing blood and blood vessels prior to assaying the tissue.
In the absence of longitudinal, repeated measures of both loneliness and gene expression, we cannot determine the direction of causality, if any. On the one hand, the experience of social isolation could be the result of brain structural and functional features that could be shaped, in part, by inherited gene variation, consistent with heritability studies of loneliness (5). If this is the case, then future large-scale studies of loneliness could investigate polymorphic variation in DNA sequences. Our study now provides a large number of candidate genes stratified across a number of disease categories that should be examined for such structural variants. On the other hand, the experience of social isolation could lead to large-scale dynamic changes in gene expression. Several plausible mechanisms come to mind. One mechanism could involve the activation of genes containing glucocorticoid response elements (22, 66) or other response elements that are sensitive to other stress-related signaling pathways, as loneliness is associated with differential activation of cortisol and the HPA axis (2, 67, 68). Another mechanism could involve activation of epigenetic processes such as CpG methylation, which has been shown to vary as a function of psychosocial stress (69–72), and which also has been shown to moderate craving-related behavior through gene methylation in the nucleus accumbens (73). Taken together, our results identify novel targets for future mechanistic studies of gene networks in nucleus accumbens and gene regulatory mechanisms across a variety of diseases, including AD, exacerbated by loneliness.
Supplementary Material
Acknowledgments
This work was supported by funding from NIA R01 AG034578-01 and NSF BCS-0843346 to T.C., and RF1AG15819, R01AG17917 and R01AG36042 to D.A.B.
Footnotes
Supplementary information is available at Molecular Psychiatry’s website.
Conflict of Interest
The authors declare no conflict of interest.
References
- 1.Peplau LA, Perlman D. Perspectives on loneliness. In: Peplau LA, Perlman D, editors. Loneliness: A sourcebook of current theory, research, and therapy. New York: Wiley-Interscience; 1982. [Google Scholar]
- 2.Cacioppo JT, Ernst JM, Burleson MH, McClintock MK, Malarkey WB, Hawkley LC, et al. Lonely traits and concomitant physiological processes: the MacArthur social neuroscience studies. Int J Psychophysiol. 2000;35(2–3):143–54. doi: 10.1016/s0167-8760(99)00049-5. [DOI] [PubMed] [Google Scholar]
- 3.Russell DW. UCLA Loneliness Scale (Version 3): reliability, validity, and factor structure. Journal of personality assessment. 1996;66(1):20–40. doi: 10.1207/s15327752jpa6601_2. [DOI] [PubMed] [Google Scholar]
- 4.Masi CM, Chen HY, Hawkley LC, Cacioppo JT. A meta-analysis of interventions to reduce loneliness. Pers Soc Psychol Rev. 2011;15(3):219–66. doi: 10.1177/1088868310377394. [DOI] [PMC free article] [PubMed] [Google Scholar]
- 5.Boomsma DI, Willemsen G, Dolan CV, Hawkley LC, Cacioppo JT. Genetic and environmental contributions to loneliness in adults: the Netherlands twin register study. Behav Genet. 2005;35(6):745–52. doi: 10.1007/s10519-005-6040-8. [DOI] [PubMed] [Google Scholar]
- 6.Hawkley LC, Cacioppo JT. Loneliness matters: a theoretical and empirical review of consequences and mechanisms. Annals of behavioral medicine: a publication of the Society of Behavioral Medicine. 2010;40(2):218–27. doi: 10.1007/s12160-010-9210-8. [DOI] [PMC free article] [PubMed] [Google Scholar]
- 7.Bekhet AK, Zauszniewski JA. Mental health of elders in retirement communities: is loneliness a key factor? Arch Psychiatr Nurs. 2012;26(3):214–24. doi: 10.1016/j.apnu.2011.09.007. [DOI] [PMC free article] [PubMed] [Google Scholar]
- 8.Cacioppo JT, Hughes ME, Waite LJ, Hawkley LC, Thisted RA. Loneliness as a specific risk factor for depressive symptoms: cross-sectional and longitudinal analyses. Psychol Aging. 2006;21(1):140–51. doi: 10.1037/0882-7974.21.1.140. [DOI] [PubMed] [Google Scholar]
- 9.Shankar A, Hamer M, McMunn A, Steptoe A. Social isolation and loneliness: relationships with cognitive function during 4 years of follow-up in the English Longitudinal Study of Ageing. Psychosom Med. 2013;75(2):161–70. doi: 10.1097/PSY.0b013e31827f09cd. [DOI] [PubMed] [Google Scholar]
- 10.Wilson RS, Krueger KR, Arnold SE, Schneider JA, Kelly JF, Barnes LL, et al. Loneliness and risk of Alzheimer disease. Arch Gen Psychiatry. 2007;64(2):234–40. doi: 10.1001/archpsyc.64.2.234. [DOI] [PubMed] [Google Scholar]
- 11.Tilvis RS, Kahonen-Vare MH, Jolkkonen J, Valvanne J, Pitkala KH, Strandberg TE. Predictors of cognitive decline and mortality of aged people over a 10-year period. J Gerontol A Biol Sci Med Sci. 2004;59(3):268–74. doi: 10.1093/gerona/59.3.m268. [DOI] [PubMed] [Google Scholar]
- 12.Holwerda TJ, Deeg DJ, Beekman AT, van Tilburg TG, Stek ML, Jonker C, et al. Feelings of loneliness, but not social isolation, predict dementia onset: results from the Amsterdam Study of the Elderly (AMSTEL) J Neurol Neurosurg Psychiatry. 2014;85(2):135–42. doi: 10.1136/jnnp-2012-302755. [DOI] [PubMed] [Google Scholar]
- 13.Buchman AS, Boyle PA, Wilson RS, James BD, Leurgans SE, Arnold SE, et al. Loneliness and the rate of motor decline in old age: the Rush Memory and Aging Project, a community-based cohort study. BMC Geriatr. 2010;10:77. doi: 10.1186/1471-2318-10-77. [DOI] [PMC free article] [PubMed] [Google Scholar]
- 14.Hawkley LC, Thisted RA, Masi CM, Cacioppo JT. Loneliness predicts increased blood pressure: 5-year cross-lagged analyses in middle-aged and older adults. Psychol Aging. 2010;25(1):132–41. doi: 10.1037/a0017805. [DOI] [PMC free article] [PubMed] [Google Scholar]
- 15.Sorkin D, Rook KS, Lu JL. Loneliness, lack of emotional support, lack of companionship, and the likelihood of having a heart condition in an elderly sample. Annals of behavioral medicine: a publication of the Society of Behavioral Medicine. 2002;24(4):290–8. doi: 10.1207/S15324796ABM2404_05. [DOI] [PubMed] [Google Scholar]
- 16.Herlitz J, Wiklund I, Caidahl K, Hartford M, Haglid M, Karlsson BW, et al. The feeling of loneliness prior to coronary artery bypass grafting might be a predictor of short-and long-term postoperative mortality. Eur J Vasc Endovasc Surg. 1998;16(2):120–5. doi: 10.1016/s1078-5884(98)80152-4. [DOI] [PubMed] [Google Scholar]
- 17.Nausheen B, Gidron Y, Peveler R, Moss-Morris R. Social support and cancer progression: a systematic review. Journal of psychosomatic research. 2009;67(5):403–15. doi: 10.1016/j.jpsychores.2008.12.012. [DOI] [PubMed] [Google Scholar]
- 18.Antoni MH, Lutgendorf SK, Cole SW, Dhabhar FS, Sephton SE, McDonald PG, et al. The influence of bio-behavioural factors on tumour biology: pathways and mechanisms. Nat Rev Cancer. 2006;6(3):240–8. doi: 10.1038/nrc1820. [DOI] [PMC free article] [PubMed] [Google Scholar]
- 19.Luanaigh CO, Lawlor BA. Loneliness and the health of older people. Int J Geriatr Psychiatry. 2008 doi: 10.1002/gps.2054. [DOI] [PubMed] [Google Scholar]
- 20.Cohen S, Doyle WJ, Skoner DP, Rabin BS, Gwaltney JM., Jr Social ties and susceptibility to the common cold. Jama. 1997;277(24):1940–4. [PubMed] [Google Scholar]
- 21.Cole SW, Kemeny ME, Fahey JL, Zack JA, Naliboff BD. Psychological risk factors for HIV pathogenesis: mediation by the autonomic nervous system. Biol Psychiatry. 2003;54(12):1444–56. doi: 10.1016/s0006-3223(02)01888-7. [DOI] [PubMed] [Google Scholar]
- 22.Cole SW, Hawkley LC, Arevalo JM, Sung CY, Rose RM, Cacioppo JT. Social regulation of gene expression in human leukocytes. Genome Biol. 2007;8(9):R189. doi: 10.1186/gb-2007-8-9-r189. [DOI] [PMC free article] [PubMed] [Google Scholar]
- 23.Guil S, Esteller M. Cis-acting noncoding RNAs: friends and foes. Nat Struct Mol Biol. 2012;19(11):1068–75. doi: 10.1038/nsmb.2428. [DOI] [PubMed] [Google Scholar]
- 24.Guttman M, Rinn JL. Modular regulatory principles of large non-coding RNAs. Nature. 2012;482(7385):339–46. doi: 10.1038/nature10887. [DOI] [PMC free article] [PubMed] [Google Scholar]
- 25.Kugel JF, Goodrich JA. Non-coding RNAs: key regulators of mammalian transcription. Trends Biochem Sci. 2012;37(4):144–51. doi: 10.1016/j.tibs.2011.12.003. [DOI] [PMC free article] [PubMed] [Google Scholar]
- 26.Liu Z, Li X, Sun N, Xu Y, Meng Y, Yang C, et al. Microarray profiling and co-expression network analysis of circulating lncRNAs and mRNAs associated with major depressive disorder. PLoS One. 2014;9(3):e93388. doi: 10.1371/journal.pone.0093388. [DOI] [PMC free article] [PubMed] [Google Scholar]
- 27.Wu P, Zuo X, Deng H, Liu X, Liu L, Ji A. Roles of long noncoding RNAs in brain development, functional diversification and neurodegenerative diseases. Brain Res Bull. 2013;97:69–80. doi: 10.1016/j.brainresbull.2013.06.001. [DOI] [PubMed] [Google Scholar]
- 28.Schonrock N, Harvey RP, Mattick JS. Long noncoding RNAs in cardiac development and pathophysiology. Circ Res. 2012;111(10):1349–62. doi: 10.1161/CIRCRESAHA.112.268953. [DOI] [PubMed] [Google Scholar]
- 29.Jiang X, Ning Q. The emerging roles of long noncoding RNAs in common cardiovascular diseases. Hypertens Res. 2015;38(6):375–9. doi: 10.1038/hr.2015.26. [DOI] [PubMed] [Google Scholar]
- 30.Uchida S, Dimmeler S. Long noncoding RNAs in cardiovascular diseases. Circ Res. 2015;116(4):737–50. doi: 10.1161/CIRCRESAHA.116.302521. [DOI] [PubMed] [Google Scholar]
- 31.Wapinski O, Chang HY. Long noncoding RNAs and human disease. Trends Cell Biol. 2011;21(6):354–61. doi: 10.1016/j.tcb.2011.04.001. [DOI] [PubMed] [Google Scholar]
- 32.Cheetham SW, Gruhl F, Mattick JS, Dinger ME. Long noncoding RNAs and the genetics of cancer. Br J Cancer. 2013;108(12):2419–25. doi: 10.1038/bjc.2013.233. [DOI] [PMC free article] [PubMed] [Google Scholar]
- 33.Satpathy AT, Chang HY. Long Noncoding RNA in Hematopoiesis and Immunity. Immunity. 2015;42(5):792–804. doi: 10.1016/j.immuni.2015.05.004. [DOI] [PubMed] [Google Scholar]
- 34.Fitzgerald KA, Caffrey DR. Long noncoding RNAs in innate and adaptive immunity. Current opinion in immunology. 2014;26:140–6. doi: 10.1016/j.coi.2013.12.001. [DOI] [PMC free article] [PubMed] [Google Scholar]
- 35.Bennett DA, Schneider JA, Buchman AS, Barnes LL, Boyle PA, Wilson RS. Overview and findings from the rush Memory and Aging Project. Curr Alzheimer Res. 2012;9(6):646–63. doi: 10.2174/156720512801322663. [DOI] [PMC free article] [PubMed] [Google Scholar]
- 36.Rilling JK, Gutman D, Zeh T, Pagnoni G, Berns G, Kilts C. A neural basis for social cooperation. Neuron. 2002;35(2):395–405. doi: 10.1016/s0896-6273(02)00755-9. [DOI] [PubMed] [Google Scholar]
- 37.Guroglu B, Haselager GJ, van Lieshout CF, Takashima A, Rijpkema M, Fernandez G. Why are friends special? Implementing a social interaction simulation task to probe the neural correlates of friendship. Neuroimage. 2008;39(2):903–10. doi: 10.1016/j.neuroimage.2007.09.007. [DOI] [PubMed] [Google Scholar]
- 38.Davey CG, Allen NB, Harrison BJ, Dwyer DB, Yucel M. Being liked activates primary reward and midline self-related brain regions. Human brain mapping. 2010;31(4):660–8. doi: 10.1002/hbm.20895. [DOI] [PMC free article] [PubMed] [Google Scholar]
- 39.Cacioppo JT, Norris CJ, Decety J, Monteleone G, Nusbaum H. In the Eye of the Beholder: Individual Differences in Perceived Social Isolation Predict Regional Brain Activation to Social Stimuli. Journal of cognitive neuroscience. 2008 doi: 10.1162/jocn.2009.21007. [DOI] [PMC free article] [PubMed] [Google Scholar]
- 40.Hawkley LC, Preacher KJ, Cacioppo JT. Multilevel modeling of social interactions and mood in lonely and socially connected individuals: The MacArthur social neuroscience studies. In: Ong DA, van Dulmen M, editors. Oxford handbook of methods in positive psychology. New York: Oxford University Press; 2007. pp. 559–75. [Google Scholar]
- 41.Dahlberg L, McKee KJ. Correlates of social and emotional loneliness in older people: evidence from an English community study. Aging & mental health. 2014;18(4):504–14. doi: 10.1080/13607863.2013.856863. [DOI] [PMC free article] [PubMed] [Google Scholar]
- 42.Holwerda TJ, Beekman ATF, Deeg DJH, Stek ML, van Tilburg TG, Visser PJ, et al. Increased risk of mortality associated with social isolation in older men: only when feeling lonely? Results from the Amsterdam Study of the Elderly (AMSTEL) Psychological medicine. 2012;42(4):843–53. doi: 10.1017/S0033291711001772. [DOI] [PubMed] [Google Scholar]
- 43.Bennett DA, Schneider JA, Aggarwal NT, Arvanitakis Z, Shah RC, Kelly JF, et al. Decision rules guiding the clinical diagnosis of Alzheimer’s disease in two community-based cohort studies compared to standard practice in a clinic-based cohort study. Neuroepidemiology. 2006;27(3):169–76. doi: 10.1159/000096129. [DOI] [PubMed] [Google Scholar]
- 44.Boyle PA, Wilson RS, Aggarwal NT, Tang Y, Bennett DA. Mild cognitive impairment: risk of Alzheimer disease and rate of cognitive decline. Neurology. 2006;67(3):441–5. doi: 10.1212/01.wnl.0000228244.10416.20. [DOI] [PubMed] [Google Scholar]
- 45.Schneider JA, Arvanitakis Z, Bang W, Bennett DA. Mixed brain pathologies account for most dementia cases in community-dwelling older persons. Neurology. 2007;69(24):2197–204. doi: 10.1212/01.wnl.0000271090.28148.24. [DOI] [PubMed] [Google Scholar]
- 46.Wilson RS, Schneider JA, Arnold SE, Tang Y, Boyle PA, Bennett DA. Olfactory identification and incidence of mild cognitive impairment in older age. Arch Gen Psychiatry. 2007;64(7):802–8. doi: 10.1001/archpsyc.64.7.802. [DOI] [PubMed] [Google Scholar]
- 47.Subramanian A, Tamayo P, Mootha VK, Mukherjee S, Ebert BL, Gillette MA, et al. Gene set enrichment analysis: a knowledge-based approach for interpreting genome-wide expression profiles. Proc Natl Acad Sci U S A. 2005;102(43):15545–50. doi: 10.1073/pnas.0506580102. [DOI] [PMC free article] [PubMed] [Google Scholar]
- 48.Blalock EM, Geddes JW, Chen KC, Porter NM, Markesbery WR, Landfield PW. Incipient Alzheimer’s disease: microarray correlation analyses reveal major transcriptional and tumor suppressor responses. Proc Natl Acad Sci U S A. 2004;101(7):2173–8. doi: 10.1073/pnas.0308512100. [DOI] [PMC free article] [PubMed] [Google Scholar]
- 49.Venny Oliveros JC. An interactive tool for comparing lists with Venn’s diagrams. http://bioinfogp.cnb.csic.es/tools/venny/index.html2015 [cited 2016 3/10/2016]
- 50.Cole SW, Hawkley LC, Arevalo JM, Cacioppo JT. Transcript origin analysis identifies antigen-presenting cells as primary targets of socially regulated gene expression in leukocytes. Proc Natl Acad Sci U S A. 2011;108(7):3080–5. doi: 10.1073/pnas.1014218108. [DOI] [PMC free article] [PubMed] [Google Scholar]
- 51.Stednitz JN, Epkins CC. Girls’ and mothers’ social anxiety, social skills, and loneliness: associations after accounting for depressive symptoms. J Clin Child Adolesc Psychol. 2006;35(1):148–54. doi: 10.1207/s15374424jccp3501_13. [DOI] [PubMed] [Google Scholar]
- 52.Stanek LM. Cocaine- and amphetamine related transcript (CART) and anxiety. Peptides. 2006;27(8):2005–11. doi: 10.1016/j.peptides.2006.01.027. [DOI] [PubMed] [Google Scholar]
- 53.Chaki S, Kawashima N, Suzuki Y, Shimazaki T, Okuyama S. Cocaine- and amphetamine-regulated transcript peptide produces anxiety-like behavior in rodents. Eur J Pharmacol. 2003;464(1):49–54. doi: 10.1016/s0014-2999(03)01368-2. [DOI] [PubMed] [Google Scholar]
- 54.Koylu EO, Balkan B, Kuhar MJ, Pogun S. Cocaine and amphetamine regulated transcript (CART) and the stress response. Peptides. 2006;27(8):1956–69. doi: 10.1016/j.peptides.2006.03.032. [DOI] [PubMed] [Google Scholar]
- 55.Hubert GW, Jones DC, Moffett MC, Rogge G, Kuhar MJ. CART peptides as modulators of dopamine and psychostimulants and interactions with the mesolimbic dopaminergic system. Biochem Pharmacol. 2008;75(1):57–62. doi: 10.1016/j.bcp.2007.07.028. [DOI] [PMC free article] [PubMed] [Google Scholar]
- 56.Jaworski JN, Kozel MA, Philpot KB, Kuhar MJ. Intra-accumbal injection of CART (cocaine-amphetamine regulated transcript) peptide reduces cocaine-induced locomotor activity. The Journal of pharmacology and experimental therapeutics. 2003;307(3):1038–44. doi: 10.1124/jpet.103.052332. [DOI] [PubMed] [Google Scholar]
- 57.Swerdlow RH, Burns JM, Khan SM. The Alzheimer’s disease mitochondrial cascade hypothesis. J Alzheimers Dis. 2010;20(Suppl 2):S265–79. doi: 10.3233/JAD-2010-100339. [DOI] [PMC free article] [PubMed] [Google Scholar]
- 58.Swerdlow RH, Khan SM. The Alzheimer’s disease mitochondrial cascade hypothesis: an update. Exp Neurol. 2009;218(2):308–15. doi: 10.1016/j.expneurol.2009.01.011. [DOI] [PMC free article] [PubMed] [Google Scholar]
- 59.Swerdlow RH, Khan SM. A “mitochondrial cascade hypothesis” for sporadic Alzheimer’s disease. Med Hypotheses. 2004;63(1):8–20. doi: 10.1016/j.mehy.2003.12.045. [DOI] [PubMed] [Google Scholar]
- 60.Ihara Y, Morishima-Kawashima M, Nixon R. The ubiquitin-proteasome system and the autophagic-lysosomal system in Alzheimer disease. Cold Spring Harb Perspect Med. 2012;2(8) doi: 10.1101/cshperspect.a006361. [DOI] [PMC free article] [PubMed] [Google Scholar]
- 61.Rapoport SI. Coupled reductions in brain oxidative phosphorylation and synaptic function can be quantified and staged in the course of Alzheimer disease. Neurotox Res. 2003;5(6):385–98. doi: 10.1007/BF03033167. [DOI] [PubMed] [Google Scholar]
- 62.Chandrasekaran K, Hatanpaa K, Brady DR, Rapoport SI. Evidence for physiological down-regulation of brain oxidative phosphorylation in Alzheimer’s disease. Exp Neurol. 1996;142(1):80–8. doi: 10.1006/exnr.1996.0180. [DOI] [PubMed] [Google Scholar]
- 63.Chen G, Wang Z, Wang D, Qiu C, Liu M, Chen X, et al. LncRNADisease: a database for long-non-coding RNA-associated diseases. Nucleic acids research. 2013;41(Database issue):D983–6. doi: 10.1093/nar/gks1099. [DOI] [PMC free article] [PubMed] [Google Scholar]
- 64.Bannon MJ, Johnson MM, Michelhaugh SK, Hartley ZJ, Halter SD, David JA, et al. A molecular profile of cocaine abuse includes the differential expression of genes that regulate transcription, chromatin, and dopamine cell phenotype. Neuropsychopharmacology. 2014;39(9):2191–9. doi: 10.1038/npp.2014.70. [DOI] [PMC free article] [PubMed] [Google Scholar]
- 65.Counts SE, Alldred MJ, Che S, Ginsberg SD, Mufson EJ. Synaptic gene dysregulation within hippocampal CA1 pyramidal neurons in mild cognitive impairment. Neuropharmacology. 2014;79:172–9. doi: 10.1016/j.neuropharm.2013.10.018. [DOI] [PMC free article] [PubMed] [Google Scholar]
- 66.Cole SW. Social regulation of leukocyte homeostasis: The role of glucocorticoid sensitivity. Brain Behav Immun. 2008 doi: 10.1016/j.bbi.2008.02.006. [DOI] [PMC free article] [PubMed] [Google Scholar]
- 67.Steptoe A, Owen N, Kunz-Ebrecht SR, Brydon L. Loneliness and neuroendocrine, cardiovascular, and inflammatory stress responses in middle-aged men and women. Psychoneuroendocrinology. 2004;29(5):593–611. doi: 10.1016/S0306-4530(03)00086-6. [DOI] [PubMed] [Google Scholar]
- 68.Adam EK. Transactions among adolescent trait and state emotion and diurnal and momentary cortisol activity in naturalistic settings. Psychoneuroendocrinology. 2006;31(5):664–79. doi: 10.1016/j.psyneuen.2006.01.010. [DOI] [PubMed] [Google Scholar]
- 69.Duman EA, Canli T. Influence of life stress, 5-HTTLPR genotype, and SLC6A4 methylation on gene expression and stress response in healthy Caucasian males. Biology of mood & anxiety disorders [Internet] 2015;5:2. doi: 10.1186/s13587-015-0017-x. [DOI] [PMC free article] [PubMed] [Google Scholar]
- 70.Klengel T, Mehta D, Anacker C, Rex-Haffner M, Pruessner JC, Pariante CM, et al. Allele-specific FKBP5 DNA demethylation mediates gene-childhood trauma interactions. Nat Neurosci. 2013;16(1):33–41. doi: 10.1038/nn.3275. [DOI] [PMC free article] [PubMed] [Google Scholar]
- 71.McGowan PO, Sasaki A, D’Alessio AC, Dymov S, Labonte B, Szyf M, et al. Epigenetic regulation of the glucocorticoid receptor in human brain associates with childhood abuse. Nat Neurosci. 2009;12(3):342–8. doi: 10.1038/nn.2270. [DOI] [PMC free article] [PubMed] [Google Scholar]
- 72.Weaver IC, Cervoni N, Champagne FA, D’Alessio AC, Sharma S, Seckl JR, et al. Epigenetic programming by maternal behavior. Nat Neurosci. 2004;7(8):847–54. doi: 10.1038/nn1276. Epub 2004 Jun 27. [DOI] [PubMed] [Google Scholar]
- 73.Massart R, Barnea R, Dikshtein Y, Suderman M, Meir O, Hallett M, et al. Role of DNA methylation in the nucleus accumbens in incubation of cocaine craving. J Neurosci. 2015;35(21):8042–58. doi: 10.1523/JNEUROSCI.3053-14.2015. [DOI] [PMC free article] [PubMed] [Google Scholar]
Associated Data
This section collects any data citations, data availability statements, or supplementary materials included in this article.