

Abstract
Double‐strand breaks (DSBs) trigger rapid and transient transcription pause to prevent collisions between repair and transcription machineries at damage sites. Little is known about the mechanisms that ensure transcriptional block after DNA damage. Here, we reveal a novel role of the negative elongation factor NELF in blocking transcription activity nearby DSBs. We show that NELF‐E and NELF‐A are rapidly recruited to DSB sites. Furthermore, NELF‐E recruitment and its repressive activity are both required for switching off transcription at DSBs. Remarkably, using I‐SceI endonuclease and CRISPR‐Cas9 systems, we observe that NELF‐E is preferentially recruited, in a PARP1‐dependent manner, to DSBs induced upstream of transcriptionally active rather than inactive genes. Moreover, the presence of RNA polymerase II is a prerequisite for the preferential recruitment of NELF‐E to DNA break sites. Additionally, we demonstrate that NELF‐E is required for intact repair of DSBs. Altogether, our data identify the NELF complex as a new component in the DNA damage response.
Keywords: double‐strand breaks, NELF‐E, PARP1, RNA polymerase II
Subject Categories: DNA Replication, Repair & Recombination
Introduction
DNA damage occurs continuously following exposure to endogenic and exogenic damaging agents. To repair damaged DNA and preserve genomic stability, eukaryotic cells developed sophisticated and highly efficient DNA damage response (DDR) pathway. Defective DDR could lead therefore to accumulation of mutations and genetic instability fueling tumorigenesis 1, 2, 3. Growing body of evidence shows that transcription activity is rapidly and transiently paused in response to DNA damage to eliminate production of abnormal transcripts and to avoid deleterious collisions between transcription and repair machineries 4, 5, 6. UV‐induced DNA damage causes both global and local transcriptional repressions at sites of damage 7, 8, 9. Similarly, double‐strand breaks (DSBs) inhibit transcription activity of RNA polymerase I in ATM/NBS1/MDC1‐dependent manner 10. Moreover, the activity of ATM and DNA‐dependent protein kinase (DNA‐PK) is critical for local inhibition of RNA polymerase II (Pol II) activity at DSB sites 11, 12. Several targets of ATM kinase, such as the ubiquitin ligases RNF8/168 that monoubiquitinate H2A‐K119 and catalyze the formation of K63‐linked polyubiquitination chain of histones H1, H2A, and H2AX 13, 14, 15, 16, PBAF complex, PcG proteins, and the transcription elongation factor ENL, were recently shown to participate in blocking transcription after DSB induction 11, 17, 18. In addition, it was suggested that the activity of PARP1 enzyme promotes transcriptional repression at DNA damage sites likely by recruiting the repressive complexes NuRD and PcG 19, 20. However, depletion of these complexes shows partial alleviation of transcriptional repression after DNA damage, suggesting that additional yet unknown factors, regulated by PARP1 activity, are required to switch off transcription after DNA damage.
The negative elongation factor (NELF) composes of WHSC2/NELF‐A, COBRA1/NELF‐B, NELF‐E, and NELF‐C/D subunits. NELF cooperates with DRB sensitivity‐inducing factor (DSIF) to repress transcriptional elongation by Pol II 21, 22, 23, 24, 25. NELF‐E, the smallest subunit of the NELF complex, composed of 380 amino acids that consists of an N‐terminal leucine zipper (LZ) motif, a central domain rich in Arg‐Asp dipeptide repeats (RD motif), and a C‐terminal RNA recognition motif (RRM) 26. The LZ motif mediates proteins dimerization and facilitates binding to DNA 27, 28. NELF‐E RRM domain shows preference for RNA binding over DNA, and it is important for the transcriptional repression activity of NELF complex 21. Here, we unprecedentedly demonstrate that NELF‐E is preferentially recruited to DSBs nearby transcriptionally active genes in a PARP‐1‐dependent manner to underpin transcriptional repression and promote timely repair of DSBs.
Results
The negative transcription elongation complex NELF promotes transcriptional silencing following DSB induction
NELF complex cooperates with DSIF to repress transcriptional elongation by RNA Pol II 21, 22. In addition, three quantitative proteomics screens showed that NELF‐E subunit undergoes phosphorylation in response to DNA damage 29, 30, 31. These observations prompted us to determine whether NELF complex is implicated in DSB‐induced transcriptional silencing. Here, we present two lines of evidence showing that NELF‐E subunit is required for transcriptional silencing following DSB induction. First, we measured global transcription activity in mock and NELF‐E‐depleted cells before and after ionizing radiation (IR) using CLICK‐IT methodology, which is based on incorporation of 5‐ethynyl uridine (5‐EU) into newly synthesized RNA 32. Consistent with previous reports 10, we observed that control cells exhibit ~40% reduction in transcription activity at 30 min after IR. On the other hand, NELF‐E‐deficient cells show milder reduction in transcription activity after IR (~5%; Fig 1A and B). Interestingly, at 60 min after IR both mock and NELF‐E‐depleted cells show recovery of transcriptional activity. However, NELF‐E‐deficient cells exhibit elevated rate of transcription compared to control cells (Fig 1B). We concluded therefore that NELF‐E contributes to transient transcription shutdown in response to IR. Second, we tested the effect of NELF‐E on transcription of a specific gene before and after DSB induction. Toward this end, we used an elegant reporter cell line named U2OS‐TRE‐I‐Sce‐19 33, 34, 35 that was recently modified by the Yasui laboratory 18. This single‐cell assay allows monitoring transcription of the MS2 gene following induction of DSB upstream of its promoter region using I‐SceI endonuclease (Fig 1C). To activate transcription of the MS2 gene, cells are transfected with pCherry‐tTA‐ER plasmid, which expresses a cytoplasmic Cherry‐tTA‐ER chimera, and addition of tamoxifen (Tam) drives its migration into the nucleus, which binds the TRE repeats and induces transcription of the MS2 gene. To visualize nascent transcription of MS2, cells are co‐transfected with pYFP‐MS2 plasmid, which expresses YFP‐MS2 protein that binds the MS2 stem loops (Fig 1C). To study the effect of DSB on the transcription of the MS2 gene, U2OS‐TRE‐I‐Sce‐19 cells are transfected with pCMV‐NLS‐I‐SceI plasmid expressing I‐SceI endonuclease that generates DSB upstream of the MS2 gene. DSB induction can be validated by immunostaining with γH2AX antibody 18. To test whether NELF‐E is involved in transcriptional repression after DSB induction, U2OS‐TRE‐I‐Sce‐19 cells were transfected with control and NELF‐E siRNAs (Fig 1D), and 72 h post‐transfection, nascent MS2 transcripts were visualized in the absence of DSBs (by co‐transfecting the cells with pCherry‐tTA‐ER and pYFP‐MS2 plasmids) and in the presence of DSBs (by co‐transfecting the cells with pCherry‐tTA‐ER, pYFP‐MS2, and pCMV‐NLS‐I‐SceI plasmids). In accordance with earlier findings 18, 35, the MS2 gene is transcribed in cells expressing Cherry‐tTA‐ER fusion as evident by the co‐localization of YFP and mCherry foci (Fig 1E, top panel), and DSB induction represses MS2 expression (Fig 1E, second panel). Similar to mock cells, NELF‐E depletion has no discernible effect on MS2 expression in the absence of DSBs (Fig 1E, third panel). However in striking contrast to mock cells, ~70% of NELF‐E‐deficient cells express MS2 in the presence of DSBs (Fig 1E, bottom panel). Of note, the intensity of γH2AX foci at DSB sites was not affected by NELF‐E depletion (Fig 1F). Altogether, these observations provide firm evidence that NELF‐E participates in DSB‐induced transcriptional silencing. Notably, as shown earlier 21, depletion of NELF‐E concomitantly disrupts the integrity of NELF complex as evident by the degradation of NELF‐A and NELF‐B proteins in MCF7 and U2OS‐TRE‐I‐Sce‐19 cells (Appendix Fig S1A–D). Therefore, the alleviation of transcriptional repression following DSB is likely due to disruption of the entire NELF complex rather than sole depletion of NELF‐E subunit. In agreement with previous reports 11, 17, 18, pharmacological inhibition of ATM disrupts DSB‐induced transcriptional silencing of the MS2 gene (Appendix Fig S2A and B). Interestingly, ATM inhibition in NELF‐E‐deficient cells did not cause synergistic or additive effects on the transcription of the MS2 gene when compared to cells treated with ATM inhibitor only, indicating that ATM and NELF‐E might function in the same silencing pathway (Appendix Fig S2A and B).
Figure 1. NELF‐E contributes to transcriptional silencing in response to DSBs.
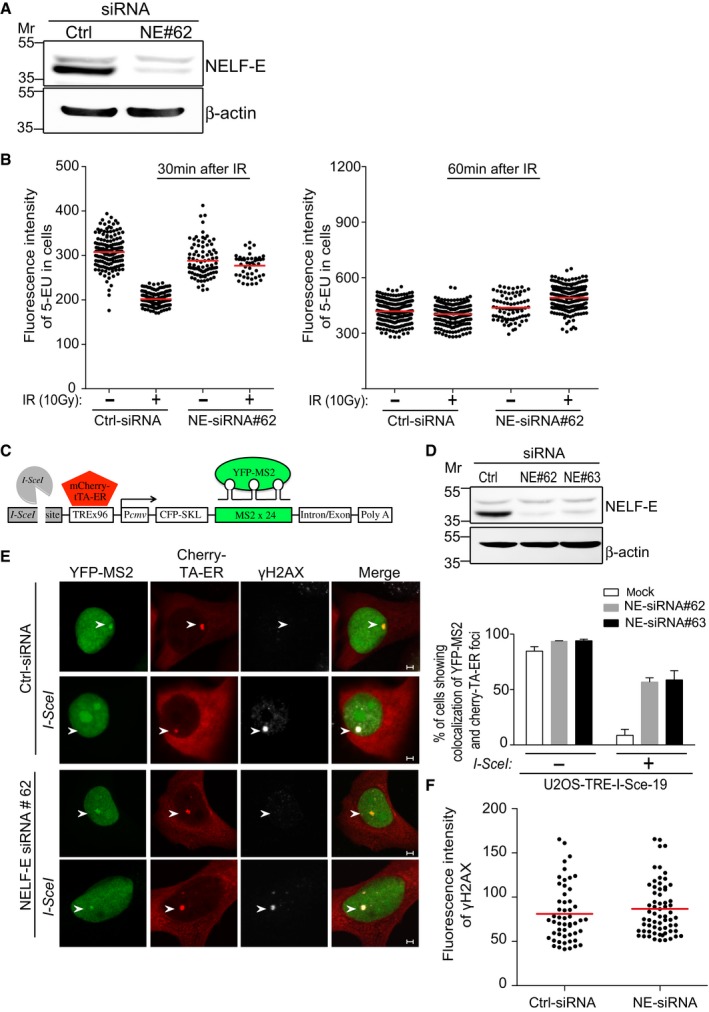
- Western blot shows knockdown of NELF‐E in U2OS cells. Cells were transfected with control siRNA (Ctrl) or NELF‐E siRNA#62 and 72 h post‐transfection cells were lysed and subjected to Western blot using NELF‐E antibody. β‐actin was used as a loading control.
- NELF‐E promotes global transcriptional silencing after ionizing radiation. Control and NELF‐E siRNA‐treated U2OS cells were exposed to IR (10 Gy) followed by 20‐min incubation with 5‐ethynyl uridine (5‐EU). Cells were then fixed at the indicated time points, and 5‐EU incorporation into newly synthesized RNA was detected using Alexa Fluor 594. The data are representative of two independent experiments. Red horizontal bars indicate the mean fluorescence intensity of 5‐EU in cells.
- Schematic of the reporter cassette integrated into the genome of U2OS‐TRE‐I‐Sce‐19 cells. It includes an I‐SceI recognition site, 96 copies of tetracycline response element (TRE), a CMV minimal promoter, CFP fused to a peroxisomal targeting signal (SKL), and 24 repeats of the MS2 RNA stem loop sequence.
- Knockdown of NELF‐E in U2OS‐TRE‐I‐Sce‐19 cells. Cells were transfected with control siRNA (Ctrl) or two different NELF‐E siRNA sequences and subjected to Western blot analysis. β‐actin was used as a loading control.
- NELF‐E is required for DSB‐induced transcriptional silencing. Mock and NELF‐E‐depleted U2OS‐TRE‐I‐Sce‐19 cells were transfected with pCherry‐tTA‐ER and pYFP‐MS2 plasmids and treated with 1 μM tamoxifen for 2 h to activate transcription of the MS2 gene. To induce DSB upstream of the MS2 gene, cells were transfected with a third plasmid expressing I‐SceI endonuclease. Cells were fixed and immunostained with γH2AX. Representative images were acquired using confocal microscope. Graph displays the percentage of cells that show colocalization of YFP‐MS2 and Cherry‐tTA‐ER. Data are represented as mean ± standard deviation (SD) from at least three independent experiments. The transcription of the MS2 gene is marked with white arrowheads. Scale bar, 2 μm.
- Quantitative measurements show that NELF‐E depletion has no detectable effect on the fluorescence intensity of γH2AX foci at DSB sites. Red horizontal bars indicate the mean fluorescence intensity of γH2AX in cells.
NELF‐E is recruited to DNA damage sites to promote transcriptional silencing
To further investigate how NELF‐E promotes transcriptional silencing after DSB induction, we monitored the subcellular localization of NELF subunits after DNA damage. While NELF‐B and NELF‐C/D subunits show no detectable changes in their localization following laser microirradiation (Appendix Fig S3), EGFP‐NELF‐E and EGFP‐NELF‐A show rapid recruitment to laser‐microirradiated sites. Their accumulation becomes detectable as early as 10 s with peak intensity at about 2–3 min (Fig 2A). Notably, NELF‐E and NELF‐A subunits are essential for the transcriptional pause activity of NELF complex 26. Hereafter, we decided to focus on NELF‐E subunit. Deletion mapping analysis shows that the N‐terminal (encompassing amino acids 1–250 and containing the LZ domain), but not the C‐terminal of NELF‐E (encompassing amino acids 250–380 and containing the RRM domain), is recruited to laser‐microirradiated sites (Appendix Fig S4A). Correspondingly, further deletion mapping revealed that the LZ motif, but not the RRM domain or the RD repeats, is essential for NELF‐E recruitment to laser‐microirradiated sites (Appendix Fig S4B and C). Importantly, these results genetically uncouple the two functional domains of NELF‐E: the first includes the LZ motif that is critical for NELF‐E accumulation at DNA damage sites, and the second is the RRM domain that is important for the transcriptional repression activity of NELF complex 21. We took advantage of these observations to address the role of NELF‐E domains in DSB‐induced transcriptional silencing. Complementing NELF‐E‐depleted U2OS‐TRE‐I‐Sce‐19 cells with construct expressing Flag‐NELF‐Edel(LZ) (unable to accumulate at DNA damage sites) fails to restore DSB‐induced silencing of the MS2 gene. In addition, only ~40% of the cells that were complemented with Flag‐NELF‐Edel(RRM) (accumulates at DNA damage sites but lost its transcriptional repressive activity) show silencing of the MS2 gene after DSB induction (Fig 2B and Appendix Fig S5). Altogether, these observations strongly suggest that the accumulation of NELF‐E at DNA damage sites and its repressive activity are both required for switching off transcription in response to DSBs.
Figure 2. NELF‐E is rapidly recruited to DNA damage sites to induce transcriptional silencing.
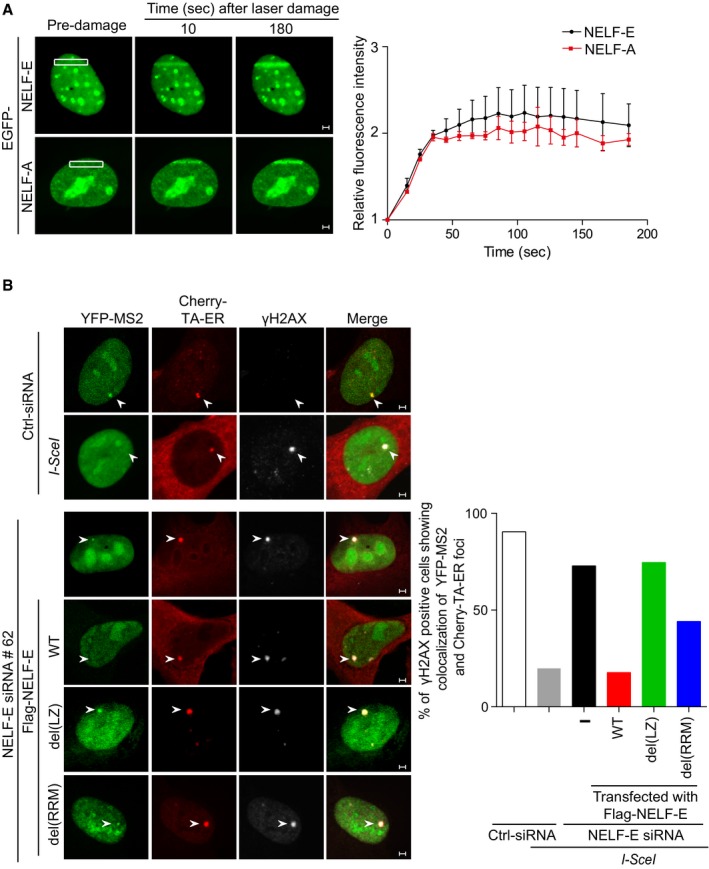
- Representative time‐lapse images showing the localization of EGFP‐NELF‐E and EGFP‐NELF‐A after laser microirradiation targeted to a particular region marked by white rectangle. Scale bar, 2 μm. Graph on the right shows fold increase in the relative fluorescence intensity at laser‐microirradiated sites. Results shown are typical of four independent experiments and represent 40 different cells. Error bars indicate standard error of the mean (SEM).
- NELF‐E recruitment to DSB is critical for transcriptional silencing. NELF‐E‐deficient U2OS‐TRE‐I‐Sce‐19 cells were transfected with pCherry‐tTA‐ER, pYFP‐MS2, and pCMV‐NLS‐I‐SceI plasmids along with either of the indicated constructs expressing Flag fused to NELF‐EWT, NELF‐Edel(LZ), or NELF‐Edel(RRM). Cells were immunostained with γH2AX (gray). Graph displays the percentage of γH2AX‐positive cells that show colocalization of YFP and Cherry foci. White arrowheads mark the location of the MS2 reporter cassette. Data represent the mean of two biological repeats. Scale bar, 2 μm.
Preferential accumulation of endogenous NELF‐E at DSB nearby transcriptionally active genes
To further corroborate the recruitment of NELF‐E to DNA lesions, we decided to visualize the accumulation of endogenous NELF‐E protein at I‐SceI‐induced DSB using the reporter U2OS‐TRE‐I‐Sce‐19 cells. To achieve this, U2OS‐TRE‐I‐Sce‐19 cells were transfected with pCMV‐NLS‐I‐SceI plasmid and co‐stained for NELF‐E and γH2AX. Surprisingly, no accumulation of NELF‐E was observed at γH2AX‐positive regions (Fig 3A; suitability of NELF‐E antibody for immunofluorescence analysis was confirmed; Appendix Fig S6). Given that the MS2 gene is silent in these cells, we predicted that NELF‐E might accumulate at DSBs nearby transcriptionally active genes. To test this prediction, U2OS‐TRE‐I‐Sce‐19 cells were subjected to two sequential transfections, first with pCherry‐tTA‐ER and treated with Tam to activate transcription of the MS2 gene and second with pCMV‐NLS‐I‐SceI plasmid to induce DSB, and then immunostained for NELF‐E and γH2AX antibodies. Results show remarkable accumulation of NELF‐E that co‐localizes with γH2AX foci (Fig 3B, top panel). Importantly, no detectable accumulation of NELF‐E was observed in cells transfected only with pCherry‐tTA‐ER plasmid and treated with Tam, suggesting that the observed NELF‐E foci are due to DSBs rather than transcription activation of the MS2 gene (Fig 3B, bottom panel). Altogether, the interpretation of these experiments is that NELF‐E shows preferential accumulation at DSBs induced adjacent to transcriptionally active sites. To further substantiate this important finding, we set up a novel system to monitor the accumulation of endogenous NELF‐E at DSBs induced by CRISPR‐Cas9 system upstream of the A20 gene in its active and inactive transcriptional states (Fig 3C). Toward this end, we used HeLa cells in which the A20 gene is transcriptionally silent and becomes active following administration of TNFα as evident by ~eightfold increase in its mRNA levels (Appendix Fig S7A). HeLa cells were untreated or treated with TNFα and transfected with expression vectors encoding EGFP‐Cas9 endonuclease and a specific gRNA to introduce DSBs upstream of the promoter region of the A20 gene. Cells were then subjected to chromatin immunoprecipitation (ChIP) using NELF‐E antibody [the suitability of NELF‐E antibody for ChIP was confirmed (Appendix Fig S7B)] and γH2AX antibody as a positive control for DSB induction. NELF‐E shows ~30‐fold increase at sequences surrounding DSB sites of transcriptionally active A20 gene comparing to ~fivefold increase when A20 is silent (Fig 3D). On the other hand, only moderate changes in γH2AX levels at DSB sites were observed following A20 activation (Fig 3D). Importantly, the increase in the amount of NELF‐E at the A20 gene following TNFα treatment is not due to overall increase in its protein levels (Appendix Fig S8). Altogether, these observations show that NELF‐E is preferentially recruited to DSBs nearby transcriptionally active genes. Broadly speaking, this preferential recruitment could be dependent on either the activity or the presence of RNA Pol II, which was shown to accumulate upstream of the A20 gene following TNFα treatment 36.
Figure 3. Endogenous NELF‐E shows preferential recruitment to DSBs nearby transcriptionally active gene.
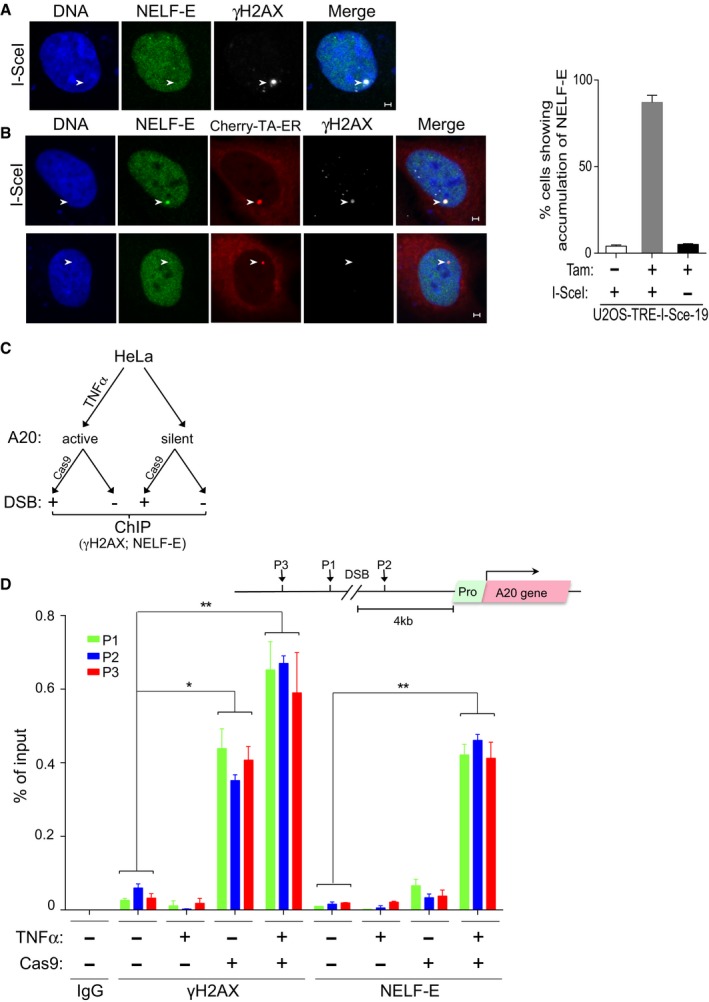
- Representative cell showing that NELF‐E is not recruited to I‐SceI‐induced DSBs upstream of transcriptionally inactive MS2 gene. U2OS‐TRE‐I‐Sce‐19 cells were transfected with pCMV‐NLS‐I‐SceI plasmid to induce DSB upstream of the silent MS2 gene. 24 h post‐transfection cells were fixed and co‐stained for NELF‐E (green) and γH2AX (gray). DNA is stained with DAPI (blue). White arrowheads mark the location of the MS2 reporter cassette. Scale bar, 2 μm.
- As in (A), except that U2OS‐TRE‐I‐Sce‐19 cells were co‐transfected with pCherry‐tTA‐ER and treated with Tam to induce MS2 expression. Top panel shows that NELF‐E is recruited to I‐SceI‐induced DSBs upstream of transcriptionally active gene. Bottom panel shows no accumulation of NELF‐E at transcriptionally active MS2 gene in the absence of DSBs. Scale bar, 2 μm. Graph on the right displays the percentage of cells that show colocalization of NELF‐E and γH2AX. White arrowheads mark the location of the MS2 reporter cassette. Data are represented as mean ± SD from three independent experiments.
- A diagram showing the layout of a ChIP experiment that aims to test the accumulation of NELF‐E at DSBs induced by CRISPR‐Cas9 upstream of transcriptionally active or inactive A20 gene.
- Endogenous NELF‐E is preferentially recruited to DSBs induced upstream of active rather than inactive A20 gene. A schematic diagram depicting the position of the DSB induced by Cas9, A20 gene, and its promoter, and the position of three DNA sequences (P1, P2, and P3) that were tested by real‐time PCR for the presence of NELF‐E and γH2AX (top). Graph represents the results of ChIP analysis showing the binding of endogenous NELF‐E and the abundance of γH2AX at three positions near DSBs upstream of transcriptionally active (HeLa cells treated with TNFα) and inactive (untreated cells) A20 gene. The occupancy of NELF‐E and γH2AX at P1, P2, and P3 sites was determined by quantitative real‐time PCR analysis and normalized to input. Error bars represent SD from three independent experiments. Asterisks depict statistically significant differences in the values of P1, P2, and P3 when compared to the corresponding values of the control samples that were not treated with TNFα and Cas9. Statistical analysis was performed by Student's t‐test, *P < 0.05, **P < 0.01.
Next, we sought to determine the effect of NELF‐E on A20 expression after DSB induction. To do so, mock and NELF‐E‐deficient cells were transiently treated with TNFα to activate A20 expression and then transfected with vectors encoding EGFP‐Cas9 and a specific gRNA to induce DSB upstream of the A20 gene. Green cells expressing EGFP‐Cas9 were sorted, and A20 mRNA levels were measured by real‐time PCR (Fig EV1A). Upon DSB induction, NELF‐E‐depleted cells (Fig EV1B) exhibit ~15‐fold increase in the expression levels of the A20 gene compared to ~fourfold increase in control cells, suggesting that NELF‐E negatively regulates A20 expression at DSB sites (Fig EV1C). Notably, introducing DSBs upstream of the A20 gene, even in the presence of NELF‐E, facilitates A20 gene expression (Fig EV1C), likely because DSBs could trigger DNA unwinding and create permissive environment for transcription as previously reported 37.
Figure EV1. NELF‐E depletion alleviates A20 expression at DSB sites.
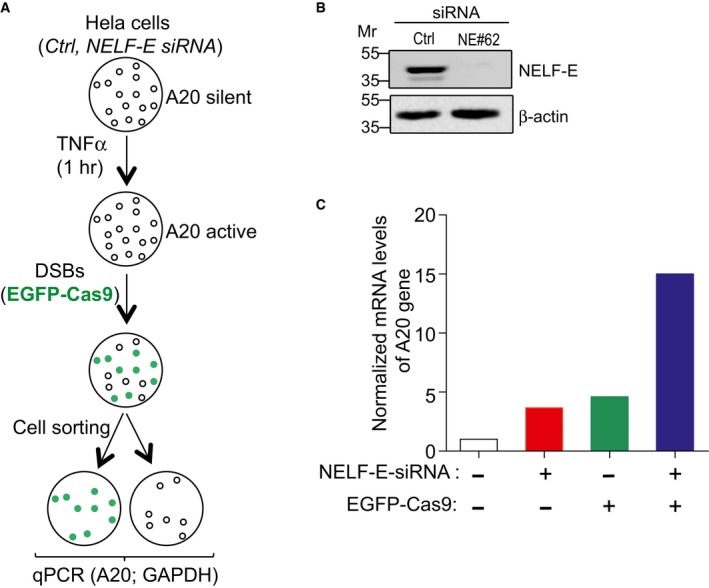
- A flowchart depicting the layout of an experiment designed to determine the effect of NELF‐E on the transcription of A20 gene following DSB induction.
- Western blot shows NELF‐E knockdown in HeLa cells at 72 h after siRNA transfection. β‐actin was used as a loading control.
- Graph displays the effect of NELF‐E depletion on the transcription activity of A20 gene upon Cas9‐induced DSBs. Results show that NELF‐E negatively regulates A20 expression at DSB sites. Data represent the mean of two biological repeats.
PARP1‐dependent recruitment of NELF‐E to laser‐microirradiated sites
Given the established role of ATM activity in promoting transcriptional repression after DNA damage, we tested whether ATM regulates NELF‐E recruitment to damage sites. Pharmacological inhibition of ATM has no detectable effect on NELF‐E recruitment to laser‐microirradiated regions (Appendix Fig S9A). The efficacy of ATM inhibitor was validated by visualizing CtIP recruitment to laser‐microirradiated regions during S and G2 cell cycle stages. Toward this, cells expressing MonoRed‐CtIP and EGFP fused to the N‐terminal domain of Geminin (which was previously shown to faithfully mark S/G2 and M phases 38) were subjected to laser microirradiation. In agreement with previous report 39, CtIP recruitment was abolished in cells treated with ATM inhibitor (Appendix Fig S9B). Altogether, we concluded that ATM activity is not required for NELF‐E accumulation at DNA damage sites. Given that PARP1 positively and negatively regulates gene expression 40 and the accumulation of several DDR responsive proteins to DNA damage sites 41, 42, we sought to determine whether PARP1 regulates the recruitment of NELF‐E to damage sites. Here, we provide two lines of evidence showing that PARP1 activity controls NELF‐E accumulation at laser‐microirradiated sites. First, pharmacological inhibition of PARP1/2 abrogates NELF‐E accumulation at DNA damage sites (Fig 4A). Second, PARP1 depletion (Fig 4B) leads to a remarkable decrease in the percentage of cells showing recruitment of NELF‐E to laser‐microirradiated sites (Fig 4C). It should be noted that comparable amounts of DNA damage were generated at laser‐microirradiated sites in control and PARP‐deficient cells, as evident by the intensity of γH2AX staining (Appendix Fig S10).
Figure 4. PARP1‐dependent recruitment of NELF‐E to laser‐microirradiated sites.
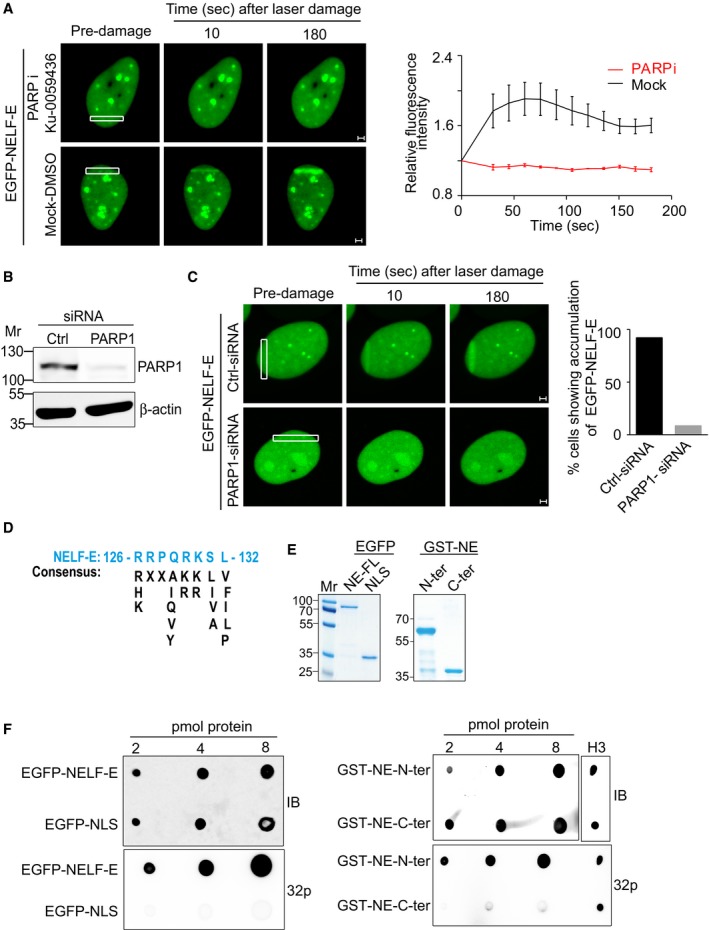
- Pharmacological inhibition of PARP abolished EGFP‐NELF‐E recruitment to laser‐microirradiated sites. Representative time‐lapse images show EGFP‐NELF‐E localization at the indicated times after laser microirradiation of a single region (marked by white rectangle). Results shown are typical of three independent experiments and represent at least 20 different cells. Graph on the right shows fold increase in the relative fluorescence intensity at laser‐microirradiated sites. Data are presented as mean ± SEM. Scale bar, 2 μm.
- U2OS‐TetON‐EGFP‐NELF‐E cells were transiently transfected with either control siRNA (Ctrl) or PARP1 siRNA and subjected to Western blot.
- As in (A), representative time‐lapse images show EGFP‐NELF‐E localization at laser‐microirradiated regions in U2OS cells transfected with control or PARP1 siRNA. Graph displays the percentage of PARP1‐depleted cells (n = 2) that show accumulation of EGFP‐NELF‐E to laser‐microirradiated regions, compared to mock transfected cells. Scale bar, 2 μm.
- Protein alignment reveals that the N‐terminal region of NELF‐E contains a putative PAR‐binding motif.
- Purification of full‐length EGFP‐NELF‐E, and EGFP fused to nuclear localization signal (EGFP‐NLS) from U2OS cells using GFP‐TRAP. Eluted proteins were separated and stained with Coomassie. Mr indicates protein marker. The right panel shows purification of NELF‐E N‐terminal (spanning amino acids 1–250) and C‐terminal regions (spanning amino acids 251–380) fused to GST tag.
- The N‐terminal region of NELF‐E binds PAR in vitro. PAR‐binding assay was performed using EGFP‐NELF‐E, EGFP‐NLS, GST‐N‐terminal, and GST‐C‐terminal of NELF‐E. Histone H3 was used as a positive control. IB: immunoblot. 32P: radiolabelled PAR.
To better understand how PARP1 regulates NELF‐E recruitment to DNA damage sites, we checked whether NELF‐E binds poly(ADP‐ribose; PAR) moieties. Bioinformatics analysis revealed that NELF‐E contains a potential PAR‐binding motif at its N‐terminal region 43 (Fig 4D). In line with this, in vitro PAR‐binding assay demonstrated that the N‐terminal, but not the C‐terminal, region of NELF‐E binds PAR moieties (Fig 4E and F). We propose therefore that NELF‐E N‐terminal region might regulate its recruitment to laser‐microirradiated sites (Appendix Fig S4), through binding to DNA damage‐induced PAR moieties surrounding the damaged DNA. However, we cannot exclude the existence of additional sequence motifs within the N‐terminal region of NELF‐E that might bind PAR and contribute to its recruitment to DNA damage sites.
Similar to the recruitment of EGFP‐NELF‐E to laser‐microirradiated sites, endogenous NELF‐E accumulation at I‐SceI sites was abrogated in cells pretreated with PARP inhibitor (Fig EV2A). Accordingly, PARP inhibition alleviates DSB‐induced transcriptional repression of the MS2 gene (Fig EV2B). Interestingly, simultaneous inhibition of ATM and PARP showed no further increase in the percentage of cells that express MS2 upon DSB induction when compared to cells treated with ATM inhibitor only, suggesting that ATM and PARP may act in similar mechanisms (Fig EV2C; see Discussion below). On the other hand, inhibiting PARP in NELF‐E‐depleted cells showed increase in the percentage of cells that express MS2 nearby DSB sites compared to NELF‐E‐depleted cells (Fig EV2C). These observations raised a possibility that in addition to NELF‐E, PARP1 regulates the recruitment of other silencing factors such as NurD and PcG to DNA break sites 19, 20.
Figure EV2. The effect of PARP1 and ATM on the expression of the MS2 gene.
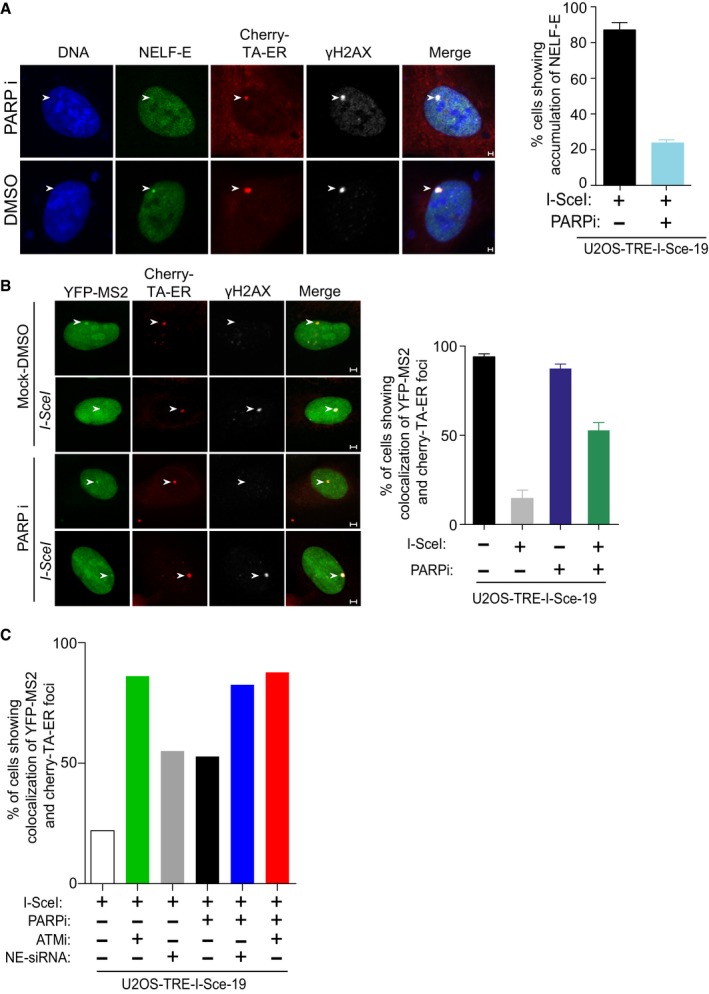
- Pharmacological inhibition of PARP1 inhibits NELF‐E accumulation at I‐SceI‐induced DSBs. As in Fig 3B (top panel), except that cells were pretreated for 2 h with 4 μM PARP inhibitor prior to Tam treatment. Error bars indicate SD (n = 3). White arrowheads mark the location of the MS2 reporter cassette. Scale bar, 2 μm.
- PARP inhibition alleviates DSB‐induced transcriptional repression of the MS2 gene. As in Fig 1E, except that cells were treated with PARP inhibitor as in (A) prior to Tam treatment. Error bars indicate SD (n = 3). White arrowheads mark the location of the MS2 reporter cassette. Scale bar, 2 μm.
- Graph displays the percentage of cells that show co‐localization of YFP‐MS2 and Cherry‐tTA‐ER in U2OS‐TRE‐I‐Sce‐19 cells transfected with NELF‐E siRNA sequences and/or treated with inhibitor for either PARP and/or ATM kinase. Data represent the mean of 20 cells collected from two biological repeats.
NELF‐E poly(ADP‐ribosyl)ation is reduced after DNA damage
Consistent with a recent finding 44, we found that NELF‐E interacts with PARP1 and undergoes poly(ADP‐ribosyl)ation in undamaged cells (Fig 5A and B). Importantly, we observed that both NELF‐E‐PARP1 interaction and NELF‐E poly(ADP‐ribosyl)ation were not increased after IR but rather showed consistent decrease (Fig 5A and B). In addition, we found that the recently characterized NELF‐E ADP‐ribosylation sites mutant 44 [shows reduced level of ADP‐ribosylation (Appendix Fig S11)] is recruited to laser‐microirradiated sites in a similar fashion as NELF‐E wild‐type protein (Fig 5C). Altogether, these observations support the notion that NELF‐E ADP‐ribosylation is dispensable for its accumulation at DNA damage sites. Moreover, the decrease in NELF‐E ADP‐ribosylation following IR implies that NELF‐E molecules that accumulate at DNA break sites are less ADP‐ribosylated. These results fit well with a recent finding showing that the ADP‐ribosylated form of NELF‐E is not active in pausing elongation activity of Pol II 44 and support our data showing that NELF‐E recruitment is required for DSB‐induced transcriptional repression.
Figure 5. NELF‐E poly(ADP‐ribosyl)ation is reduced after DNA damage.
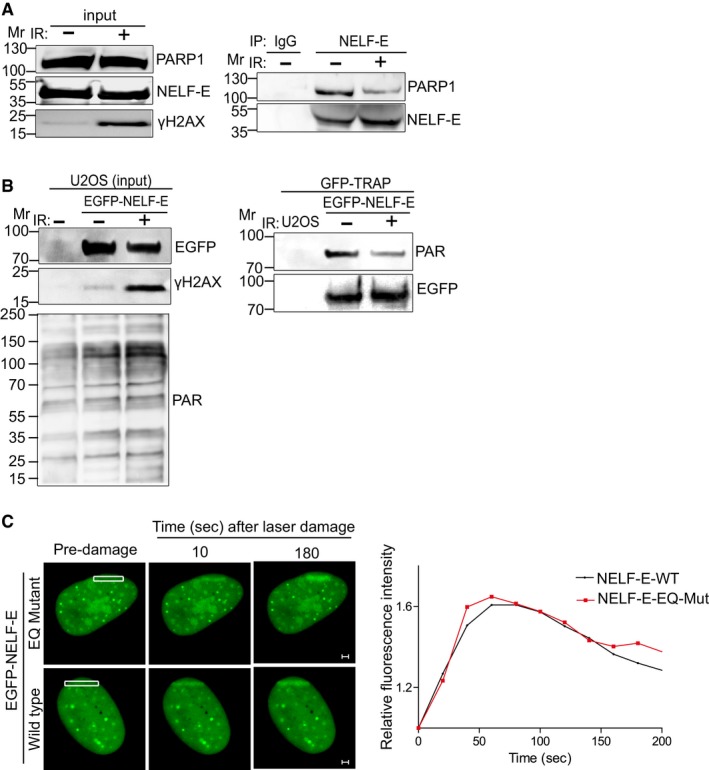
- NELF‐E‐PARP1 interaction is reduced after IR. U2OS cells were subjected to NELF‐E immunoprecipitation before and after IR (cells were exposed to 10 Gy of IR and recovered for 10 min). The immunoprecipitated proteins were immunoblotted with either PARP1 or NELF‐E. IgG pull‐down is used as a negative control. Input samples were blotted with the indicated antibodies.
- EGFP‐NELF‐E is less ADP‐ribosylated after IR. Control and EGFP‐NELF‐E expressing U2OS cells were exposed to IR as in (A), subjected to GFP‐TRAP and immunoblotted using PAR antibody. Next, the membrane was stripped and immunostained with GFP antibody. Input samples were immunostained with the indicated antibodies.
- Representative time‐lapse images show the localization of EGFP‐NELF‐E wild type and EGFP‐NELF‐E‐EQ mutant at laser‐microirradiated sites (marked with white rectangle). Graph on the right shows fold increase in the relative fluorescence intensity (n = 2). Scale bar, 2 μm.
RNA pol II is essential for NELF‐E recruitment to laser‐microirradiated sites
RNA degradation by RNase A treatment or inhibition of Pol II elongation using the adenosine analogue 5,6‐dichloro‐1‐β‐D‐ribofuranosylbenzimidazole (DRB) prior to laser microirradiation shows no detectable effect on NELF‐E accumulation at sites of damage (Fig 6A, first and second panels). These observations are in agreement with our previous finding showing that NELF‐Edel(RRM) mutant (cannot bind RNA) is still recruited to DNA damage sites (Appendix Fig S4C). Hence, we concluded that RNA molecules and NELF‐E‐RNA interaction are not essential for NELF‐E recruitment to DNA break sites. Interestingly, transcription activation of the A20 gene by TNFα is accompanied by enrichment of Pol II molecules at its promoter region 36. We speculated therefore that the presence of Pol II might be a prerequisite for NELF‐E accumulation at DSB sites nearby transcriptionally active regions. To test this, we induced Pol II degradation using α‐amanitin. Consistent with previous findings 45, 46, treating cells with α‐amanitin leads to a remarkable decrease in the protein levels of Pol II subunit, Rpb1 (Fig 6B). As shown in Fig 6A (third panel), pretreating cells with α‐amanitin disrupts NELF‐E recruitment to laser‐microirradiated sites. Importantly, α‐amanitin treatment has no substantial effect on PARP1 recruitment and on the accumulation of γH2AX at DNA break sites (Appendix Fig S12A and B). On the other hand, α‐amanitin treatment caused a slight decrease in the intensity of PAR moieties at laser‐microirradiated sites, probably due to degradation of ADP‐ribosylated proteins (Appendix Fig S12B). Altogether, these observations suggest that Pol II is critical for recruiting NELF‐E to DSB sites and the increase in Pol II levels following A20 activation may mediate the preferential recruitment of NELF‐E to DSBs induced at transcriptionally active DNA. Interestingly, a recent work showed that various subunits of pol II undergo ADP‐ribosylation following genotoxic stress 47 raising a possibility that the ADP‐ribosylated subunits of Pol II may provide a platform for recruiting NELF‐E to DNA break sites. In support of this, we demonstrate that NELF‐E association with the largest subunit of Pol II, RPB1, is disrupted in cells treated with PARP inhibitor (Fig 6C).
Figure 6. RNA pol II is required for NELF‐E accumulation at DNA break sites.
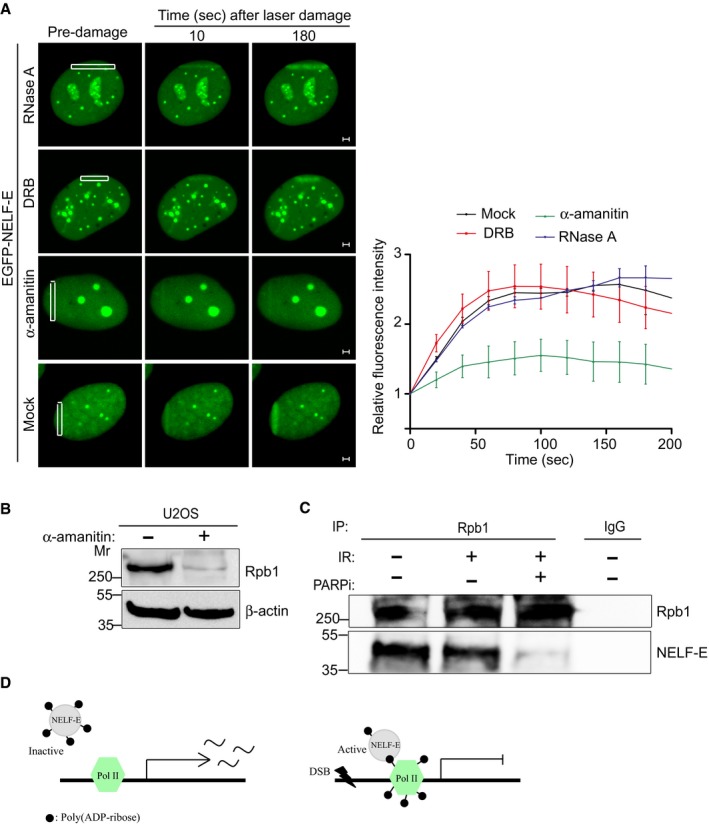
- Representative time‐lapse images showing the localization of EGFP‐NELF‐E at laser‐microirradiated regions of cells that were untreated or treated with either RNase A, DRB, or α‐amanitin. Scale bar, 2 μm. Graph on the right shows fold increase in fluorescence intensity at laser‐microirradiated sites. Results shown are typical of three independent experiments and represent more than 15 different cells. Error bars indicate SEM.
- Western blot shows that α‐amanitin triggers Rpb1 degradation. β‐actin was used as a loading control.
- Rpb1 immunoprecipitation from mock and IR‐treated cells in the absence and presence of PARP inhibitor.
- A hypothetical model shows that following DSB induction RNA pol II complex undergoes ADP‐ribosylation and thus proves a platform for recruiting the less ADP‐ribosylated form of NELF‐E to shut down transcription.
NELF‐E fine‐tunes DSB repair
Given that NELF‐E is recruited to DSB sites, we sought to determine whether it is involved in DSB repair. Colony formation assay revealed that NELF‐E‐depleted cells (Fig 7A) show moderate hypersensitivity to IR (Fig 7B). Next, we determined the effect of NELF‐E depletion on the integrity of homology‐directed repair (HDR) of DSB repair using U2OS‐HR‐ind cells 48. These cells express a cytoplasmic mCherry‐I‐SceI enzyme fused to glucocorticoid receptor, and treatment with dexamethasone (Dex) induces rapid entry of I‐SceI into the nucleus and induction of DSB at its recognition site within the GFP expression cassette. Repairing DSBs by HDR restores the integrity of the GFP gene and leads to the appearance of GFP‐positive cells 48, 49. Control, Rad51, and NELF‐E‐depleted HR‐ind cells (Fig 7C) were treated with 0.1 μM Dex for 48 h, and the percentage of GFP‐positive cells was determined by flow cytometry. Results show that NELF‐E depletion using two different siRNAs leads to a mild but significant decrease of 20–25% in GFP‐positive cells, when compared to cells depleted of Rad51 (a central protein of HDR) that exhibit ~60% decrease in GFP‐positive cells (Fig 7D). Similarly, we tested the effect of NELF‐E depletion on the efficiency of non‐homologous end joining (NHEJ) of DSBs using HeLa cells containing pEJSSA plasmid stably integrated into their genome 50. This plasmid contains a recognition site for I‐SceI endonuclease and repairing the DSB by NHEJ restores the functionality of the GFP gene, manifested in green‐colored cells. Results show that NELF‐E depletion (Fig 7E) leads to 35–40% decrease in the efficiency of NHEJ compared to 75% decrease in cells treated with siRNA against Ku80 (a central NHEJ factor; Fig 7F). Collectively, our results suggest that NELF‐E is required for fine‐tuning DSB repair.
Figure 7. NELF‐E promotes HDR and NHEJ of DSBs.
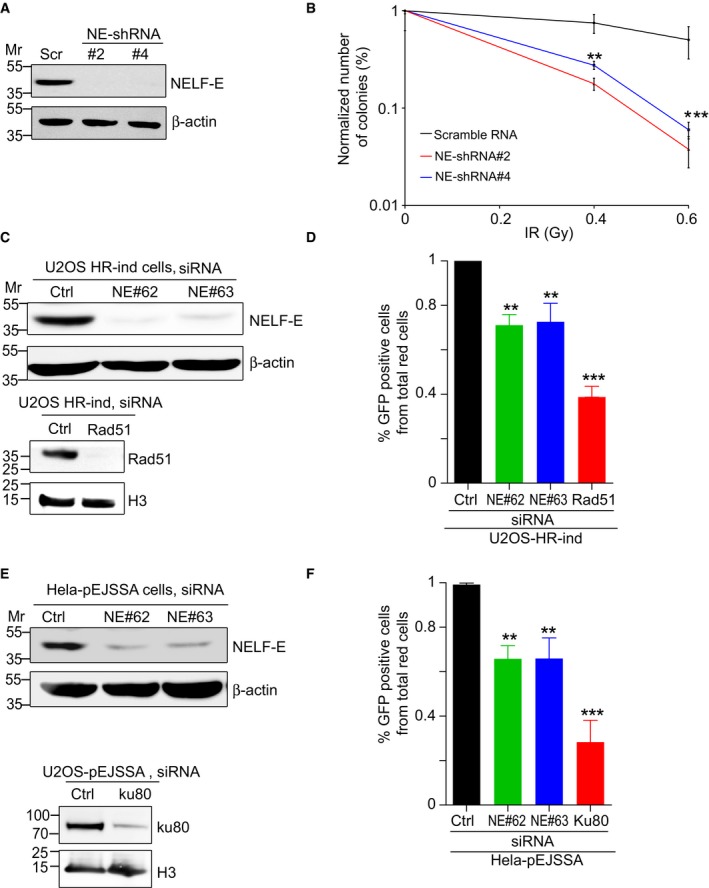
- Western blot shows NELF‐E knockdown using two different shRNAs (#2 and #4). β‐actin was used as a loading control.
- Colony formation assay shows that NELF‐E‐deficient cells are hypersensitive to IR. The numbers of colonies were normalized to the percentage of undamaged cells and plotted as a function of IR dosage. Error bars represent SEM (n = 4). Two‐way ANOVA was used to test for differences at each dose.
- Western blot shows depletion of NELF‐E and Rad51 in U2OS‐HR‐ind cells transfected with NELF‐E and Rad51 siRNAs. β‐actin and histone H3 were used as loading controls.
- NELF‐E promotes HDR of DSBs induced by I‐SceI endonuclease. To measure the integrity of HDR, U2OS‐HR‐ind cells were transfected with two different NELF‐E siRNAs and the efficiency of HDR was determined using flow cytometric analysis. For controls, U2OS‐HR‐ind cells were transfected with either control siRNA or Rad51 siRNA. Results shown are typical of three independent experiments. Error bars represent SD. P‐values were calculated by two‐sided Student's t‐test relative to Ctrl siRNA, **P < 0.01, ***P < 0.001.
- Western blot shows depletion of NELF‐E in HeLa‐pEJSSA cells transfected with NELF‐E and Ku80 siRNAs. β‐actin and histone H3 were used as loading controls.
- NELF‐E depletion affects the integrity of NHEJ of DSBs. NELF‐E‐depleted HeLa cells containing pEJSSA plasmid stably integrated into their genome were used to determine the efficiency of NHEJ as described in the Materials and Methods. For controls, HeLa‐pEJSSA cells were transfected with either control or Ku80 siRNA. Results shown are typical of three independent experiments. Error bars represent SD. P‐values were calculated by two‐sided Student's t‐test relative to Ctrl siRNA, **P < 0.01, ***P < 0.001.
Discussion
Here, we described a previously unrecognized role of NELF‐E in DDR. We demonstrated that NELF‐E is preferentially recruited, in a PARP1‐dependent manner, to DSBs induced upstream of transcriptionally active genes to promote transcriptional repression and facilitate DSB repair. Similar to NELF‐E, previous reports revealed that BRCA1 and Rad51 exhibit preferential binding to DSBs that lie within transcriptionally active chromatin marked by H4 acetylation and H3K36 methylation 51, 52. In addition to NELF‐E, recent studies identified several factors, such as BAF180 and BRG1, which are involved in blocking transcription of active genes in response to DNA damage in an ATM‐dependent manner 17. However, it remains unknown whether, similar to NELF‐E, these factors show also preferential recruitment to transcriptionally active genes.
This study showed that both the N‐terminal region (essential for NELF‐E accumulation at DNA damage sites) and the RRM domain (essential for NELF repressive activity) are crucial for intact DSB‐induced transcriptional repression (Fig 2 and Appendix Fig S4). Unpredictably, complementing NELF‐E‐deficient cells with NELF‐Edel(RRM) mutant partially restored the transcriptional silencing of MS2 gene at DSB sites (Fig 2B). This finding raises a possibility that the LZ motif of NELF‐Edel(RRM) might confer silencing by promoting the recruitment of various silencing factors to DSB sites. In agreement with this, the LZ domain is known to mediate protein dimerization and facilitate binding to DNA 27, 28 and is found in multiple DDR proteins, such as ATM, DNA‐PK, and Ku70/80 proteins 53, 54, 55, 56.
Our study also demonstrated that NELF‐E and NELF‐A, but not NELF‐B or NELF‐C/D, are recruited to DNA break sites (Fig 2A and Appendix Fig S3). These findings suggest that subcomplexes, including NELF‐E and NELF‐A, might be formed following DNA damage. In support of this, functional NELF subcomplexes that bind RNA in vitro and in vivo were recently described in human cells 57. It should be noted in this regard that both NELF‐E and NELF‐A subunits are critical for transcriptional silencing activity of NELF complex 21, 26. Moreover, it was previously shown that NELF cooperates with DSIF complex to silence the activity of Pol II 21, 22, 23, 24 raising a possibility that NELF‐E and NELF‐A subunits may function with DSIF to promote transcription arrest at DSB sites.
Our data implicate PARP1 enzyme in regulating transcription in response to DNA damage. A recent screen revealed that PARP1 ADP‐ribosylates NELF‐E and NELF‐A, which subsequently promotes transcription elongation 44. Interestingly, our data show that after IR the level of NELF‐E ADP‐ribosylation does not increase but rather shows a mild decrease. Given that NELF‐E recruitment is critical for transcriptional repression at DSB sites, we propose that NELF‐E molecules that accumulate at DNA break sites are less ADP‐ribosylated (Fig 6D).
This study showed that NELF‐E depletion or PARP inhibition alleviates DSB‐induced transcriptional repression. It is widely accepted that transcriptional silencing post‐DNA damage is tightly regulated, and its disruption can have harmful consequences leading to genomic instabilities and cancer 4, 5. In agreement with this, NELF‐E is required for fine‐tuning DSB repair (Fig 7). Moreover, a growing number of studies suggested that PARP1 activity is required for timely repair of DSBs 49, 58, 59, 60, 61, 62. Besides PARP1, ATM and DNA‐PK kinases regulate the activity of several silencing factors at sites of DNA damage 11, 12, 18. Interestingly, inhibition of ATM and NELF‐E did not cause synergistic or additive effects on the transcription of the MS2 gene, indicating that they might function in the same pathway (Appendix Fig S2). It was recently shown that pharmacological inhibition of PARP1 led to a significant reduction in H3K9me3 at DSB sites and thus preventing ATM activation (evidenced by the absence of the DNA damage‐induced KAP1 phosphorylation) 61. On this basis, it is plausible to assume that the alleviation of MS2 repression at DSB sites following PARP inhibition could be mediated by ATM kinase activity. In line with this, the percentage of cells that express MS2 gene in the presence of DSB following pharmacological inhibition of both ATM and PARP is comparable to the percentage of cells that were treated only with ATM inhibitor (Fig EV2C). Nonetheless, the relationship between the DNA damage‐induced silencing pathways that are mediated by ATM, DNA‐PK, and PARP1 activity should be further clarified. Do these three pathways act in a sequential manner with overlapping functions, in parallel to complement each other, or in distinct pathways? How the cells determine which silencing pathway to activate? Is this dependent on the type of the lesion and/or on the chromatin context surrounding the damage sites?
In summary, identifying NELF as a new player in DDR will help to better understand the molecular mechanisms that ensure efficient repair of DNA lesions to maintain genomic stability. Notably, different subunits of NELF complex are mutated in different types of human cancer 63, 64. Future studies will be essential to determine the impact of these cancer mutations on the newly identified functions of NELF complex in DDR and to investigate whether these mutations contribute to the alleged tumor suppressor activity of the different subunits of NELF complex.
Materials and Methods
Plasmids
pCherry‐rTA‐ER, pYFP‐MS2, and pCMV‐NLS‐I‐SceI plasmids were obtained from Yasui Akira (Tohoku University, Japan). pEGFP‐C1‐NELF‐E, pEGFP‐C1‐NELF‐E N‐terminal, pEGFP‐C1‐NELF‐E C‐terminal pEGFP‐NELF‐Edel(LZ), pEGFP‐NELF‐Edel(RRM), pEGFP‐NELF‐Edel(RD), pEGFP‐NELF‐EEQ, Flag‐NELF‐E, Flag‐NELF‐Edel(LZ), Flag‐NELF‐Edel(RRM), pGEX‐6P3‐NELF‐E1–250, pGEX‐6P3‐NELF‐E250–380, pEGFP‐C1‐NELF‐A, pEGFP‐C1‐NELF‐B, pEGFP‐C1‐NELF‐C/D, and Flag‐NELF‐A vectors were constructed as described in Table 1. pSpCAS9 (BB)‐2A‐GFP (PX458; #48183) and PsPgRNA (#47108) vectors were purchased from Addgene. A complete list of all primers and their sequences is described in Table 2. All constructs used in this study were verified by nucleotide sequencing or restriction digestion. mAG‐hGeminin (1/110) plasmid expressing EGFP‐Geminin was a kind gift from Dr. Atsushi Miyawaki (RIKEN Brain Science Institute, Japan).
Table 1.
Plasmids constructed in this study
| Plasmid | Vector backbone | Insert |
|---|---|---|
| pEGFP‐C1‐NELF‐E | pEGFP‐C1 | PCR product (1,143 bp) containing NELF‐E coding sequence was amplified using primers F1 and R1 and cut with Sall‐BamHl |
| pEGFP‐C1‐NELF‐E N‐terminal | pEGFP‐C1‐NELF‐E | PCR product (1–750 bp) was amplified using primers F2 and R2 |
| pEGFP‐C1‐NELF‐E N‐terminal | pEGFP‐C1‐NELF‐E | PCR product (751–1,143 bp) was amplified using primers F3 and R3 |
| pEGFP‐C1‐NELF‐Edel (LZ) | pEGFP‐C1 | PCR product was amplified using primers F4 and R4 |
| pEGFP‐C1‐NELF‐Edel (RD) | pEGFP‐C1 | PCR product was amplified using primers F5 and R5 |
| pEGFP‐C1‐NELF‐Edel(RRM) | pEGFP‐C1 | PCR product was amplified using primers F6 and R6 |
| pEGFP‐C1‐NELF‐EEQ | pEGFP‐C1‐NELF‐E | PCR mutagenesis using primers F7‐9 and R7‐9 |
| pGEX‐6P3‐NELF‐E‐C‐ter | pGEX‐6P3 | PCR product (751–1,143 bp) was amplified using primers F10 and R10 and cut with Sall‐BamHl |
| pGEX‐6P3‐NELF‐E‐N‐ter | pGEX‐6P3 | PCR product (1–750 bp) was amplified using primers F11 and R11 and cut with Sall‐BamHl |
| pTRE2puro‐EGFP‐NELF‐E | pTRE2‐Puro cut with EcoRV‐NheI | Insert containing EGFP‐NELF‐E fusion was produced by digesting pEGFP‐C1‐NELF‐E with SsPl and NheI to release an insert containing EGFP‐NELF‐E |
| p3XFlag‐CMV10‐NELF‐E‐WT | p3XFlag‐CMV10 cut with EcoRl‐BamHl | pEGFP‐C1‐NELF‐E was digested with EcoRl‐BamHl to release an insert containing NELF‐E‐WT |
| p3XFlag‐CMV10‐NELF‐E‐del LZ | p3XFlag‐CMV10 cut with EcoRl‐BamHl | pEGFP‐C1‐NELF‐E‐del LZ was digested with EcoRl‐BamHl to release an insert containing NELF‐E‐del LZ |
| p3XFlag‐CMV10‐NELF‐E‐del RRM | p3XFlag‐CMV10 cut with EcoRl‐BamHl | pEGFP‐C1‐NELF‐E‐del RRM was digested with EcoRl‐BamHl to release an insert containing NELF‐E‐del RRM |
| pEGFP‐C1‐NELF‐A | pEGFP‐C1 | PCR product (1,620 bp) containing NELF‐A coding sequence was amplified using primers F12 and R12 and cut with Sall‐BamHl |
| pEGFP‐C1‐NELF‐B | pEGFP‐C1 | PCR product (1,743 bp) containing NELF‐B coding sequence was amplified using primers F13 and R13 and cut with Sall‐BamHl |
| pEGFP‐C1‐NELF‐CD | pEGFP‐C1 | PCR product (1,800 bp) containing NELF‐CD coding sequence was amplified using primers F14 and R14 and cut with Sall‐BamHl |
| P3XFlag‐CMV10‐NELF‐A | p3XFlag‐CMV10 cut with EcoRl‐BamHl | pEGFP‐C1‐NELF‐A was digested with EcoRl‐BamHl to release an insert containing NELF‐A |
| pLKO.1‐TRC‐NELF‐E‐shRNA#2 | pLKO.1‐TRC cut with EcoRI and AgeI | Primers (F15, R15) were annealed and then ligated with the cut vector |
| pLKO.1‐TRC‐NELF‐E‐shRNA#4 | pLKO.1‐TRC cut with EcoRI and AgeI | Primers (F16, R16) were annealed and then ligated with the cut vector |
| pLKO.1‐TRC‐NELF‐A‐shRNA | pLKO.1‐TRC cut with EcoRI and AgeI | Primers (F17, R17) were annealed and then ligated with the cut vector |
| pLKO.1‐TRC‐NELF‐B‐shRNA | pLKO.1‐TRC cut with EcoRI and AgeI | Primers (F18, R18) were annealed and then ligated with the cut vector |
| pSpgRNA‐A20gRNA | pSPgRNA cut with Bbsl | Primers (gF19, gR19) were phosphorylated, annealed, and then ligated with the cut vector |
Table 2.
Primers used in this study
| Primer | Sequence |
|---|---|
| F1 | ATCGTCGACATGTTGGTGATACCCCCCGGACTGAGC |
| R1 | GTGGATCCCTAGAAGCCATCCACAAGGTTTTCCTTGTAGA |
| F2 | TAGGGATCCACCGGATCTAGATAACTG |
| R2 | ATCCGACCTGCGGAAAGGACCCTCT |
| F3 | TCATTCCCTGAACGGCGAGCCCCTA |
| R3 | CATGTCGACTGCAGAATTCGAAGC |
| F4 | CAGCAGCACAACCAGCCAAG |
| R4 | GGGGGGTATCACCAACATGTCGACT |
| F5 | CGAGAGGGTCCTTTCCGCAGGTCGGATT |
| R5 | GCTGCGGCTTCGGGGAGGGGAGGCT |
| F6 | TAGGGATCCACCGGATCTAGATAACTG |
| R6 | ATCCGACCTGCGGAAAGGACCCTCT |
| F7 | TGC TGATGATGACCT GCAGCA GTC ATC CAG ACG TCC CC |
| R7 | GGG GAC GTC TGG ATG ACT GCT GCA GGT CATCAT CAG CA |
| F8 | AGC TTT GAC TGG GGA TAT CAACAA CGC AGT GGT GCC CAC |
| R8 | GTG GGC ACC ACT GCG TTGTTG ATA TCC CCA GTC AAA GCT |
| F9 | AAC TAG GAC CAG ATG GCC AAC AGG CAG AGG GCC CAA GG |
| R9 | CCT TGG GCC CTC TGC CTG TTG GCC ATC TGG TCC TAG TT |
| F10 | AAGGATCCTCATTCCCTGAACGGCGAGCCCCTAG |
| R10 | AATGTCGACCTAGAAGCCATCCACAAGGTTTTCC |
| F11 | TAGGATCCATGTTGGTGATACCCCCCGGACTG |
| R11 | AATGTCGACCTAATCCGACCTGCGGAAAGGACCCTC |
| F12 | ATT GTC GAC ATG CCG GGG CAG CGG CGC GCG CTT TCC CC |
| R12 | GTG GAT CCC TAG GAC ACA TTG GTC ATG GGC TTG TAC TTC |
| F13 | ATA GTC GAC ATG TTC GCG GGG CTG CAG GAC CTG GGC GTG G |
| R13 | TTG GAT CCT CAG AGC GGG GCA GGG GCG GGC ACG CTG GGG |
| F14 | ATC GTC GAC ATG CGCCGC GCT CGC TCG CGG GAG GGC ATGG |
| R14 | GCG GAT CCT TAG TTC ACC ATGATG AAG TTA GAT TTG CAG |
| F15 | CCGGACCCAGATTGTCTACAGTGATCTCGAGATCACTGTAGACAATCTGGGTTTTTTG |
| R15 | AATTCAAAAAACCCAGATTGTCTACAGTGATCTCGAGATCACTGTAGACAATCTGGGT |
| F16 | CCGGCTGGATTCCTTGTGCCTCATACTCGAGTATGAGGCACAAGGAATCCAGTTTTTG |
| R16 | AATTCAAAAACTGGATTCCTTGTGCCTCATACTCGAGTATGAGGCACAAGGAATCCAG |
| F17 | CCGGCCTGTTTGTTAGACTCTTACTCTCGAGAGTAAGAGTCTAACAAACAGGTTTTTG |
| R17 | AATTCAAAAACCTGTTTGTTAGACTCTTACTCTCGAGAGTAAGAGTCTAACAAACAGG |
| F18 | CCGGCCATAGAAAGCGTGCTCATTTCTCGAGAAATGAGCACGCTTTCTTGGTTTTTG |
| R18 | AATTCAAAAACCATAGAAAGCGTGCTCATTTCTCGAGAAATGAGCACGCTTTCTATGG |
| gF19 | CACCGTAACTGGTTTAGTCTTTCTC |
| gR19 | AAACGAGAAAGACTAAACCAGTTAC |
| Primers for real‐time PCR (cDNA) | |
| A20‐F | TGGAACCTGATTCCAAACTTC |
| A20‐R | CTCAGGAATTTGTTGAAACGG |
| GAPDH‐F | GCTCCAATTCCCCATCTCA |
| GAPDH‐R | ACCCTTACACGCTTGGATGAA |
| Primers for real‐time PCR (DNA) | |
| P1‐F | CAGGACCTCCTGAGGCTATGT |
| P1‐R | CTGACCTTCTGCCAGGTATGTT |
| P2‐F | GCCTCAAATGCCAGGGAGTGAA |
| P2‐R | ACAGGCACTCAGTGAACAAC |
| P3‐F | GTCATTACACCAACTGCCTCCTTCC |
| P3‐R | GAGGGACAACTGAAGTCCTTAGTG |
Cell lines
All cell lines were cultured in media supplemented with 10% heat‐inactivated FBS, 2 mM l‐glutamine, 100 units/ml penicillin, and 100 μg/ml streptomycin. U2OS, HeLa, and U2OS‐TRE‐I‐Scel‐19 (kind gift from Dr. Yasui Akira, Tohoku University, Japan) cell lines were grown in Dulbecco's modified Eagle's medium (Gibco). The MCF‐7 cell line was cultured in RPMI‐1640 media (Gibco). U2OS‐HR‐ind cell line (kind gift from Michal Goldberg, Hebrew University of Jerusalem, Israel) was cultured as previously described 49.
Generation of U2OS‐Tet‐ON‐EGFP‐NELF‐E cell line
U2OS‐Tet‐ON cell line expressing the EGFP‐NELF‐E fusion was established as previously described 49. Briefly, EGFP‐NELF‐E fusion was subcloned into the pTRE2/Puro vector (Clontech) and transfected into U2OS‐Tet‐ON cell (Clontech). Puromycin‐resistant clones (0.6 μg/ml puromycin) were selected and tested for doxycycline (Dox)‐induced expression of EGFP‐NELF‐E by fluorescence microscopy. Clones that showed expression of EGFP‐NELF‐E only after the addition of Dox (Sigma, D9891) were selected for further characterization.
Transfections
Transient transfections with plasmid DNA or siRNA were performed using Poly Jet (Bio Consult) and Lipofectamine 2000 (Invitrogen), respectively, following the manufacturer's instructions. siRNAs used in this study included validated PARP1 siRNA (4390823 and 4390824; Ambion), Stealth RNAi negative control, and Stealth NELF‐E siRNA (Invitrogen). Rad51 and Ku80 siRNAs were kind gift from Michal Goldberg (Hebrew University of Jerusalem). All constructs and siRNA sequences are available upon request.
ShRNA knockdown
Scramble shRNA and shRNA directed against NELF‐E, NELF‐A, and NELF‐B were inserted into the pLKO.1‐TRC lentiviral vector digested with EcoRI and AgeI. The generated lentiviral vectors were verified by nucleotide sequencing. Next, 293T cells were co‐transfected with the lentiviral vector, a plasmid encoding the lentiviral Gag/Pol, and a plasmid encoding the VSV‐G. Supernatants containing the viral particles were collected after 48 h. Finally, the viral particles were infected into MCF7 cells, and 48 h post‐infection cells were selected with 1 μg/ml puromycin for 1 week.
Immunofluorescence
Cells were grown on coverslips and subjected to immunofluorescence as previously described in 49. Cells were immunostained with the appropriate antibodies (Table 3). Slides were visualized using the inverted Zeiss LSM 700 confocal microscope with 40× oil EC Plan Neofluar objective.
Table 3.
Antibodies used in this study
| Name | Source | Dilution for Western blot | Dilution for IF |
|---|---|---|---|
| Primary antibodies | |||
| Anti‐NELF‐E | Abcam ab170104 | 1:3,000 | 1:250 |
| Anti‐GFP | Abcam ab290 | 1:1,000 | |
| Anti‐NELF‐A/WHSC1 | Abcam ab85852 | 1:2,000 | |
| Anti‐NELF‐B/COBRA1 | Abcam ab167401 | 1:2,000 | |
| Anti‐β‐actin | Sigma A5441 | 1:15,000 | |
| Anti‐PARP1 | Enzo ALX‐210–895‐R100 | 1:3,000 | |
| Anti‐Flag | Sigma F1804 | 1:1,000 | |
| Anti‐H3 | Abcam ab1791 | 1:2,000–20,000 | |
| Anti‐γH2AX (ser139) | Millipore 05‐636 | 1:2,500 | |
| Anti‐γH2AX | Cell Signaling 2577 | 1:1,000 | |
| Anti‐RNA polymerase II (POLR2A/RPB1) | Santa Cruz sc‐899 | 1:1,000 | |
| Anti‐poly‐ADP‐ribose binding reagent | Millipore MABE1031 | 1:4,000 | 1:400 |
| Anti‐Rad51 | GeneTex GTX118249 | 1:1,500 | |
| Anti‐Ku80 | Santa Cruz sc‐1484 | 1:200 | |
| Secondary antibodies | |||
| Anti‐mouse (IgG)‐HRP | Amersham | 1:10,000 | |
| Anti‐rabbit (IgG)‐HRP | Jackson ImmunoResearch 111–035‐003 | 1:20,000 | |
| Anti‐goat (IgG)‐HRP | Abcam ab6885 | 1:10,000 | |
| Donkey anti‐rabbit Alexa Fluor 488 | Invitrogen A21206 | 1:500 | |
| Goat anti‐mouse Alexa Fluor 680 | Invitrogen A21057 | 1:500 | |
| Donkey anti‐mouse Alexa Fluor 568 | Invitrogen A10037 | 1:500 | |
Western blotting
Western blotting was performed as described previously 49. Briefly, protein lysates were prepared using hot lysis and immunoblotted using the appropriate antibodies (a complete list of antibodies and their dilutions are described in Table 3). Rad51 and Ku80 antibodies were kind gifts from Michal Goldberg (Hebrew University of Jerusalem). Membranes were developed using Quantum ECL detection kit (K‐12042‐D20, Advansta).
Immunoprecipitation
Immunoprecipitation was performed as previously described 49, 65. U2OS cells were lysed by Nonidet P‐40 (NP‐40) lysis buffer [50 mM HEPES pH 7.4, 100 mM NaCl, 0.5% NP‐40, 10 mM EDTA, 20 mM β‐glycerophosphate, 0.1 mg/ml PMSF, 1.2 mM Na3VO4, 5 mM NaF, 1 mM DTT, protease inhibitor cocktail, and 25 U/ml Benzonase (Novagen)] for 30 min on ice, centrifuged at 20,000 g for 25 min at 4°C and supernatant was recovered and pre‐cleared using protein A magnetic beads (GenScript). The pre‐cleared extracts were rotated at 4°C overnight with 1–4 μg of antibody and protein A magnetic beads. Then, the immunocomplexes were washed five times with IP buffer, resolved in gel and analyzed by Western blotting.
GFP‐TRAP pull‐down
GFP‐NELF‐E fusion was purified from doxycycline‐treated U2OS‐TetON‐EGFP‐NELF‐E cells using GFP‐TRAP methodology as previously described 49, 65. In brief, whole‐cell extracts were prepared using NP‐40 lysis buffer (supplemented with 30 μM PARP inhibitor and protease inhibitor cocktail) and subjected to pull‐down using GFP‐Trap beads (Chromotek). Next, the immuno‐complexes were washed, resolved by SDS–PAGE and stained with Coomassie.
Expression and purification of GST fusions
A single colony from E. coli BL21 (DE3) pLysS cells expressing either GST‐tagged NELF‐E N‐terminal 1–250aa (60 kDa) or GST‐tagged NELF‐E C‐terminal 251–380aa (42 kDa) was inoculated and grown overnight at 37°C into LB medium. The bacteria were transferred to 2× TY medium and were grown until reaching O.D = 0.6. The expressions of glutathione S‐transferase (GST)‐tagged proteins were induced with 0.1 mM IPTG for 24 h at 18°C. Bacteria were lysed by sonication (four cycles of 30 s on, 30 s off at amplitude of 50%) in 1× PBS containing 15 mM EDTA and PMSF and then treated with ~25 units Benzonase (Novagen) for 1 h. Lysed bacteria were centrifuged for 30 min at 20,000 g, and the supernatant was incubated with GST‐Bind Resin (Novagen) overnight. Beads were washed five times with 1× PBS containing 0.2% Triton X‐100 and 0.7% NP‐40, and the GST‐tagged proteins were eluted with a buffer containing 50 mM reduced glutathione, 10% glycerol, 0.2% Triton X‐100, 1 mM DTT, 50 mM Tris–HCl pH 8.8, 300 mM NaCl, 5 mM EDTA, and protease inhibitors cocktail overnight at RT. The eluted proteins were then dialyzed 3 times against buffer containing 5% glycerol, 20 mM Tris–HCl pH 8, 150 mM NaCl, 0.1 mM EDTA, 0.1% Triton X‐100, and 1 mM DTT.
PAR‐binding assay
Purified NELF‐E (full‐length, N‐terminal, and C‐terminal) was tested for their ability to bind PAR moieties using the PAR‐binding assay as previously described 42.
Drug treatment
Cells were exposed to 10 Gy of ionizing radiation from an X‐ray machine (Faxitron, CellRad). Where indicated, cells were treated with 1 μM PARP inhibitor (Ku‐0059436) for 1 h, 10 μM ATM inhibitor (KU‐55933) for 2 h, 100 μM DRB (Sigma) for 3 h, and 20 μg/ml α‐amanitin (Sigma) for 4 h. For RNase A experiment, cells were permeabilized (0.5% or 2% Tween‐20 in PBS for 10 min) and treated with or without 1 mg/ml RNase A in PBS for 15 min at room temperature 66.
RNA Isolation, reverse transcription, and quantitative real‐time PCR
To measure the expression levels of A20 gene, HeLa cells were untreated or treated with 10 ng/ml TNFα and total RNA was isolated using the TRIzol reagent according to the manufacturer's instructions (Ambion). RNA (1 μg) was used for cDNA synthesis using the qScript cDNA Synthesis Kit (Quanta) with random primers. A20 mRNA levels were measured by real‐time PCR in the Step‐One‐Plus real‐time PCR System (Applied Biosystems) using A20 and GAPDH primers (Table 2) and the Fast SYBR Green Master mix (Applied Biosystems) with three technical repeats for each PCR. Data analysis and quantification were performed using StepOne software V2.2 supplied by Applied Biosystems. GAPDH gene was used as a housekeeping gene to normalize the amount of the cDNA. Fold induction of A20 mRNA levels was calculated using ΔΔC t method from results that were normalized to GAPDH.
Visualizing MS2 expression before and after DSB in U2OS‐TRE‐I‐Sce‐19
The effect of DSB on the transcription of MS2 gene was performed as previously described 18, 33, 34, 35. Briefly, to activate transcription of MS2 gene in U2OS‐TRE‐I‐Sce‐19, cells were transfected with pCherry‐tTA‐ER plasmid, which expresses a cytoplasmic Cherry‐tTA‐ER chimera, and treated with 1 μM tamoxifen to drive its migration into the nucleus and induce transcription of MS2 gene. To visualize nascent transcription of MS2, cells were co‐transfected with pYFP‐MS2 plasmid, which expresses YFP‐MS2 protein that binds the MS2 stem loops. To induce DSB, U2OS‐TRE‐I‐Sce‐19 cells were co‐transfected with pCMV‐NLS‐I‐SceI. Where indicated, cells were treated with 10 μM ATM inhibitor for 24 h or with 4 μM PARP inhibitor prior to Tam treatment.
Laser microirradiation
Laser microirradiation was performed as previously described 49. Cells were grown on fluorodish and stained with 10 μM Hoechst 33342 for 10 min at 37°C. Then, laser microirradiation was performed using LSM‐700 confocal microscope. Selected region within the nucleus was microirradiated with 10 iterations of a 405‐nm laser with 100% power to generate localized DNA damage. Cells were then subjected to time‐lapse images or fixed for immunofluorescence. Fluorescence intensity at DNA damaged sites was measured using Zen 2009 software.
Chromatin immunoprecipitation (ChIP)
HeLa cells, untreated or treated with 10 ng/ml TNFα (Peprotech #300‐01A), were co‐transfected with expression vectors pSpCAS9(BB)‐2A‐GFP(PX458) encoding GFP‐Cas9 and pSpgRNA vector containing a specific gRNA to introduce double‐strand break 4 kb upstream of the promoter region of A20 gene. ChIP was performed as described previously 49. Briefly, cells were cross‐linked in 1% formaldehyde for 15 min, and then, the cross‐linking was stopped using 0.125 M glycine for 5 min. After cell lyses, the purified chromatin was sonicated to 300–500 bp using a Vibra cell sonicator (15 s ON, 30 s OFF, 35% duty, 18 cycles). 5% of each supernatant was used as input control and processed with the cross‐linking reversal step. The rest of the supernatant was pre‐cleared with protein G agarose beads (26150; Pierce) and subjected to overnight immunoprecipitation (IP) using either 2 μg of NELF‐E (ab170104) or γH2AX antibody (Millipore 05‐636) and protein G magnetic beads (GenScript). Following reverse cross‐linking, the precipitated DNA was purified using the PureLinkTM PCR Micro Kit. Quantification of the immunoprecipitated DNA was carried out by Step‐One‐Plus real‐time PCR using Fast SYBR Green Master mix (Applied Biosystems) and different sets of primers (P1, P2, and P3) around the damage site (Table 2). Percentages of precipitated DNA surrounding the break site were calculated relative to input.
Detection of global RNA synthesis
Global transcription levels were determined using the Click‐IT Nascent RNA capture kit (E10345) as previously described 67. Briefly, mock and NELF‐E‐depleted cells were exposed to either 10 Gy ionizing radiation or 50 J/m2 UV light, incubated for 20 min with 5‐EU that was added directly to the growth medium. Next, cells were fixed with 4% PFA for 15 min and permeabilized with 0.5% Triton X‐100 in 1× PBS for 15 min. Detection of 5‐EU incorporation was performed using Alexa Fluor 594 according to the manufacturer's protocol. Images were obtained using a high‐content screening microscope (In Cell Analyzer 2000; GE Healthcare) for automatic acquisition of at least 200 cells at each time point.
Colony formation assay
MCF‐7 cells infected with either scramble or NELF‐E shRNAs were plated in triplicate at density of 500 cells per 35‐mm dish and incubated for 24 h before exposure to increasing doses of ionizing radiation. After ~15 days of incubation at 37°C, the plates were fixed and stained with 0.25% crystal violet dissolved in 25% methanol, and colonies were counted.
Homology‐directed repair (HDR) assay
The efficiency of HDR of DSBs was performed as previously described 48, 49 in mock and NELF‐E‐depleted U2OS‐HR‐ind cells. In brief, U2OS‐HR‐ind cells, which stably express cytoplasmic mCherry‐I‐SceI enzyme fused to glucocorticoid receptor (I‐SceI‐GR), were treated with 0.1 μM of dexamethasone (Dex) for 48 h. This treatment induces rapid entry of I‐SceI‐GR into the nucleus and generation of DSB at its recognition sequence within the reporter construct expressing GFP. Repairing the DSB by HDR restores the integrity of the GFP gene. The number of GFP‐positive cells was determined using a BD LSRII. Data analysis was performed using FCS‐Express software and was based on at least 10,000 events.
Non‐homologous end joining (NHEJ)
HeLa cells containing the plasmid pEJSSA stably integrated into their genome 50 were used to monitor the efficiency of NHEJ in vivo as previously described 49. In brief, control and NELF‐E‐depleted HeLa cells were co‐transfected with constructs expressing I‐SceI endonuclease and Red‐Monomer (MR) tag, and the percentage of GFP‐positive cells from the total number of red cells was determined by flow cytometry.
Statistical analyses
Statistical analyses were performed using the demo version of GraphPad Prism software version 6.
Author contributions
SWA planned and performed all the experiments described in this study (except the one indicated below), wrote the experimental procedures, and helped in proofreading the manuscript. ERA‐Z performed the experiments described in Fig EV1B and C and Appendix Figs S1D , S2, S8, S10, S11 and S12. NG‐R performed the experiments described in Fig EV1B and C, and Appendix Figs S4B and S5. NA conceived the study, planned the experiments, and wrote the manuscript.
Conflict of interest
The authors declare that they have no conflict of interest.
Supporting information
Appendix
Expanded View Figures PDF
Review Process File
Acknowledgements
We are grateful to Akira Yasui for the plasmids and the U2OS‐TRE‐I‐Sce‐19 cell line. We thank Ofer Mandelboim and Mohammad Diab for helping in the generation of the lentiviruses used in this study. We thank Prathamesh Nadar‐Ponniah for expressing and purifying the GST‐NELF‐E fusions and Samer Shalaby for helping in the statistical analysis. We are grateful to Maayan Duvshani‐Eshet, Nitzan Dahan, Efrat Barak, and Shay Kirzner, from the Life Sciences and Engineering Infrastructure Unit at the Technion, for their help in the microscopy and flow cytometry‐related works. We thank Hanan Khoury‐Haddad for her critical reading of the manuscript. This study is supported by grants from the Israel Science Foundation (ISF), the Israel Cancer Association, the Binational Science Foundation (BSF), the Israel Cancer Research Fund (ICRF), Joint Lower Saxony (Niedersachsen)‐Israeli Research Fund. N. Ayoub is supported by a Neubauer Family Foundation. Samah W. Awwad and Enas R. Abu‐Zhayia are supported by the VATAT Fellowship for outstanding minority PhD student.
EMBO Reports (2017) 18: 745–764
See also: SE Polo (May 2017)
References
- 1. Shiloh Y, Ziv Y (2013) The ATM protein kinase: regulating the cellular response to genotoxic stress, and more. Nat Rev Mol Cell Biol 14: 197–210 [PubMed] [Google Scholar]
- 2. Jackson SP, Bartek J (2009) The DNA‐damage response in human biology and disease. Nature 461: 1071–1078 [DOI] [PMC free article] [PubMed] [Google Scholar]
- 3. Lord CJ, Ashworth A (2012) The DNA damage response and cancer therapy. Nature 481: 287–294 [DOI] [PubMed] [Google Scholar]
- 4. Adam S, Polo SE (2014) Blurring the line between the DNA damage response and transcription: the importance of chromatin dynamics. Exp Cell Res 329: 148–153 [DOI] [PMC free article] [PubMed] [Google Scholar]
- 5. Svejstrup JQ (2010) The interface between transcription and mechanisms maintaining genome integrity. Trends Biochem Sci 35: 333–338 [DOI] [PubMed] [Google Scholar]
- 6. Wickramasinghe VO, Venkitaraman AR (2016) RNA processing and genome stability: cause and consequence. Mol Cell 61: 496–505 [DOI] [PMC free article] [PubMed] [Google Scholar]
- 7. Mayne LV, Lehmann AR (1982) Failure of RNA synthesis to recover after UV irradiation: an early defect in cells from individuals with Cockayne's syndrome and xeroderma pigmentosum. Cancer Res 42: 1473–1478 [PubMed] [Google Scholar]
- 8. Rockx DA, Mason R, van Hoffen A, Barton MC, Citterio E, Bregman DB, van Zeeland AA, Vrieling H, Mullenders LH (2000) UV‐induced inhibition of transcription involves repression of transcription initiation and phosphorylation of RNA polymerase II. Proc Natl Acad Sci USA 97: 10503–10508 [DOI] [PMC free article] [PubMed] [Google Scholar]
- 9. Mone MJ, Volker M, Nikaido O, Mullenders LH, van Zeeland AA, Verschure PJ, Manders EM, van Driel R (2001) Local UV‐induced DNA damage in cell nuclei results in local transcription inhibition. EMBO Rep 2: 1013–1017 [DOI] [PMC free article] [PubMed] [Google Scholar]
- 10. Kruhlak M, Crouch EE, Orlov M, Montano C, Gorski SA, Nussenzweig A, Misteli T, Phair RD, Casellas R (2007) The ATM repair pathway inhibits RNA polymerase I transcription in response to chromosome breaks. Nature 447: 730–734 [DOI] [PubMed] [Google Scholar]
- 11. Shanbhag NM, Rafalska‐Metcalf IU, Balane‐Bolivar C, Janicki SM, Greenberg RA (2010) ATM‐dependent chromatin changes silence transcription in cis to DNA double‐strand breaks. Cell 141: 970–981 [DOI] [PMC free article] [PubMed] [Google Scholar]
- 12. Pankotai T, Bonhomme C, Chen D, Soutoglou E (2012) DNAPKcs‐dependent arrest of RNA polymerase II transcription in the presence of DNA breaks. Nat Struct Mol Biol 19: 276–282 [DOI] [PubMed] [Google Scholar]
- 13. Thorslund T, Ripplinger A, Hoffmann S, Wild T, Uckelmann M, Villumsen B, Narita T, Sixma TK, Choudhary C, Bekker‐Jensen S et al (2015) Histone H1 couples initiation and amplification of ubiquitin signalling after DNA damage. Nature 527: 389–393 [DOI] [PubMed] [Google Scholar]
- 14. Stewart GS, Panier S, Townsend K, Al‐Hakim AK, Kolas NK, Miller ES, Nakada S, Ylanko J, Olivarius S, Mendez M et al (2009) The RIDDLE syndrome protein mediates a ubiquitin‐dependent signaling cascade at sites of DNA damage. Cell 136: 420–434 [DOI] [PubMed] [Google Scholar]
- 15. Mailand N, Bekker‐Jensen S, Faustrup H, Melander F, Bartek J, Lukas C, Lukas J (2007) RNF8 ubiquitylates histones at DNA double‐strand breaks and promotes assembly of repair proteins. Cell 131: 887–900 [DOI] [PubMed] [Google Scholar]
- 16. Doil C, Mailand N, Bekker‐Jensen S, Menard P, Larsen DH, Pepperkok R, Ellenberg J, Panier S, Durocher D, Bartek J et al (2009) RNF168 binds and amplifies ubiquitin conjugates on damaged chromosomes to allow accumulation of repair proteins. Cell 136: 435–446 [DOI] [PubMed] [Google Scholar]
- 17. Kakarougkas A, Ismail A, Chambers AL, Riballo E, Herbert AD, Kunzel J, Lobrich M, Jeggo PA, Downs JA (2014) Requirement for PBAF in transcriptional repression and repair at DNA breaks in actively transcribed regions of chromatin. Mol Cell 55: 723–732 [DOI] [PMC free article] [PubMed] [Google Scholar]
- 18. Ui A, Nagaura Y, Yasui A (2015) Transcriptional elongation factor ENL phosphorylated by ATM recruits polycomb and switches off transcription for DSB repair. Mol Cell 58: 468–482 [DOI] [PubMed] [Google Scholar]
- 19. Gong F, Chiu LY, Cox B, Aymard F, Clouaire T, Leung JW, Cammarata M, Perez M, Agarwal P, Brodbelt JS et al (2015) Screen identifies bromodomain protein ZMYND8 in chromatin recognition of transcription‐associated DNA damage that promotes homologous recombination. Genes Dev 29: 197–211 [DOI] [PMC free article] [PubMed] [Google Scholar]
- 20. Chou DM, Adamson B, Dephoure NE, Tan X, Nottke AC, Hurov KE, Gygi SP, Colaiacovo MP, Elledge SJ (2010) A chromatin localization screen reveals poly (ADP ribose)‐regulated recruitment of the repressive polycomb and NuRD complexes to sites of DNA damage. Proc Natl Acad Sci USA 107: 18475–18480 [DOI] [PMC free article] [PubMed] [Google Scholar]
- 21. Yamaguchi Y, Inukai N, Narita T, Wada T, Handa H (2002) Evidence that negative elongation factor represses transcription elongation through binding to a DRB sensitivity‐inducing factor/RNA polymerase II complex and RNA. Mol Cell Biol 22: 2918–2927 [DOI] [PMC free article] [PubMed] [Google Scholar]
- 22. Yamaguchi Y, Takagi T, Wada T, Yano K, Furuya A, Sugimoto S, Hasegawa J, Handa H (1999) NELF, a multisubunit complex containing RD, cooperates with DSIF to repress RNA polymerase II elongation. Cell 97: 41–51 [DOI] [PubMed] [Google Scholar]
- 23. Missra A, Gilmour DS (2010) Interactions between DSIF (DRB sensitivity inducing factor), NELF (negative elongation factor), and the Drosophila RNA polymerase II transcription elongation complex. Proc Natl Acad Sci USA 107: 11301–11306 [DOI] [PMC free article] [PubMed] [Google Scholar]
- 24. Sims RJ III, Belotserkovskaya R, Reinberg D (2004) Elongation by RNA polymerase II: the short and long of it. Genes Dev 18: 2437–2468 [DOI] [PubMed] [Google Scholar]
- 25. Williams LH, Fromm G, Gokey NG, Henriques T, Muse GW, Burkholder A, Fargo DC, Hu G, Adelman K (2015) Pausing of RNA polymerase II regulates mammalian developmental potential through control of signaling networks. Mol Cell 58: 311–322 [DOI] [PMC free article] [PubMed] [Google Scholar]
- 26. Narita T, Yamaguchi Y, Yano K, Sugimoto S, Chanarat S, Wada T, Kim DK, Hasegawa J, Omori M, Inukai N et al (2003) Human transcription elongation factor NELF: identification of novel subunits and reconstitution of the functionally active complex. Mol Cell Biol 23: 1863–1873 [DOI] [PMC free article] [PubMed] [Google Scholar]
- 27. Groves MR, Barford D (1999) Topological characteristics of helical repeat proteins. Curr Opin Struct Biol 9: 383–389 [DOI] [PubMed] [Google Scholar]
- 28. Landschulz WH, Johnson PF, McKnight SL (1988) The leucine zipper: a hypothetical structure common to a new class of DNA binding proteins. Science 240: 1759–1764 [DOI] [PubMed] [Google Scholar]
- 29. Bennetzen MV, Larsen DH, Bunkenborg J, Bartek J, Lukas J, Andersen JS (2010) Site‐specific phosphorylation dynamics of the nuclear proteome during the DNA damage response. Mol Cell Proteomics 9: 1314–1323 [DOI] [PMC free article] [PubMed] [Google Scholar]
- 30. Elia AE, Boardman AP, Wang DC, Huttlin EL, Everley RA, Dephoure N, Zhou C, Koren I, Gygi SP, Elledge SJ (2015) Quantitative proteomic atlas of ubiquitination and acetylation in the DNA damage response. Mol Cell 59: 867–881 [DOI] [PMC free article] [PubMed] [Google Scholar]
- 31. Matsuoka S, Ballif BA, Smogorzewska A, McDonald ER III, Hurov KE, Luo J, Bakalarski CE, Zhao Z, Solimini N, Lerenthal Y et al (2007) ATM and ATR substrate analysis reveals extensive protein networks responsive to DNA damage. Science 316: 1160–1166 [DOI] [PubMed] [Google Scholar]
- 32. Jao CY, Salic A (2008) Exploring RNA transcription and turnover in vivo by using click chemistry. Proc Natl Acad Sci USA 105: 15779–15784 [DOI] [PMC free article] [PubMed] [Google Scholar]
- 33. Janicki SM, Tsukamoto T, Salghetti SE, Tansey WP, Sachidanandam R, Prasanth KV, Ried T, Shav‐Tal Y, Bertrand E, Singer RH et al (2004) From silencing to gene expression: real‐time analysis in single cells. Cell 116: 683–698 [DOI] [PMC free article] [PubMed] [Google Scholar]
- 34. Lan L, Ui A, Nakajima S, Hatakeyama K, Hoshi M, Watanabe R, Janicki SM, Ogiwara H, Kohno T, Kanno S et al (2010) The ACF1 complex is required for DNA double‐strand break repair in human cells. Mol Cell 40: 976–987 [DOI] [PubMed] [Google Scholar]
- 35. Rafalska‐Metcalf IU, Powers SL, Joo LM, LeRoy G, Janicki SM (2010) Single cell analysis of transcriptional activation dynamics. PLoS ONE 5: e10272 [DOI] [PMC free article] [PubMed] [Google Scholar]
- 36. Ainbinder E, Amir‐Zilberstein L, Yamaguchi Y, Handa H, Dikstein R (2004) Elongation inhibition by DRB sensitivity‐inducing factor is regulated by the A20 promoter via a novel negative element and NF‐kappaB. Mol Cell Biol 24: 2444–2454 [DOI] [PMC free article] [PubMed] [Google Scholar]
- 37. Madabhushi R, Gao F, Pfenning AR, Pan L, Yamakawa S, Seo J, Rueda R, Phan TX, Yamakawa H, Pao PC et al (2015) Activity‐induced DNA breaks govern the expression of neuronal early‐response genes. Cell 161: 1592–1605 [DOI] [PMC free article] [PubMed] [Google Scholar]
- 38. Sakaue‐Sawano A, Kurokawa H, Morimura T, Hanyu A, Hama H, Osawa H, Kashiwagi S, Fukami K, Miyata T, Miyoshi H et al (2008) Visualizing spatiotemporal dynamics of multicellular cell‐cycle progression. Cell 132: 487–498 [DOI] [PubMed] [Google Scholar]
- 39. You Z, Shi LZ, Zhu Q, Wu P, Zhang YW, Basilio A, Tonnu N, Verma IM, Berns MW, Hunter T (2009) CtIP links DNA double‐strand break sensing to resection. Mol Cell 36: 954–969 [DOI] [PMC free article] [PubMed] [Google Scholar]
- 40. Kraus WL, Hottiger MO (2013) PARP‐1 and gene regulation: progress and puzzles. Mol Aspects Med 34: 1109–1123 [DOI] [PubMed] [Google Scholar]
- 41. Sousa FG, Matuo R, Soares DG, Escargueil AE, Henriques JA, Larsen AK, Saffi J (2012) PARPs and the DNA damage response. Carcinogenesis 33: 1433–1440 [DOI] [PubMed] [Google Scholar]
- 42. Khoury‐Haddad H, Nadar‐Ponniah PT, Awwad S, Ayoub N (2015) The emerging role of lysine demethylases in DNA damage response: dissecting the recruitment mode of KDM4D/JMJD2D to DNA damage sites. Cell Cycle 14: 950–958 [DOI] [PMC free article] [PubMed] [Google Scholar]
- 43. Gagne JP, Isabelle M, Lo KS, Bourassa S, Hendzel MJ, Dawson VL, Dawson TM, Poirier GG (2008) Proteome‐wide identification of poly(ADP‐ribose) binding proteins and poly(ADP‐ribose)‐associated protein complexes. Nucleic Acids Res 36: 6959–6976 [DOI] [PMC free article] [PubMed] [Google Scholar]
- 44. Gibson BA, Zhang Y, Jiang H, Hussey KM, Shrimp JH, Lin H, Schwede F, Yu Y, Kraus WL (2016) Chemical genetic discovery of PARP targets reveals a role for PARP‐1 in transcription elongation. Science 353: 45–50 [DOI] [PMC free article] [PubMed] [Google Scholar]
- 45. Anindya R, Aygun O, Svejstrup JQ (2007) Damage‐induced ubiquitylation of human RNA polymerase II by the ubiquitin ligase Nedd4, but not Cockayne syndrome proteins or BRCA1. Mol Cell 28: 386–397 [DOI] [PubMed] [Google Scholar]
- 46. Nguyen VT, Giannoni F, Dubois MF, Seo SJ, Vigneron M, Kedinger C, Bensaude O (1996) In vivo degradation of RNA polymerase II largest subunit triggered by alpha‐amanitin. Nucleic Acids Res 24: 2924–2929 [DOI] [PMC free article] [PubMed] [Google Scholar]
- 47. Jungmichel S, Rosenthal F, Altmeyer M, Lukas J, Hottiger MO, Nielsen ML (2013) Proteome‐wide identification of poly(ADP‐Ribosyl)ation targets in different genotoxic stress responses. Mol Cell 52: 272–285 [DOI] [PubMed] [Google Scholar]
- 48. Shahar OD, Raghu Ram EV, Shimshoni E, Hareli S, Meshorer E, Goldberg M (2011) Live imaging of induced and controlled DNA double‐strand break formation reveals extremely low repair by homologous recombination in human cells. Oncogene 31: 3495–3504 [DOI] [PubMed] [Google Scholar]
- 49. Khoury‐Haddad H, Guttmann‐Raviv N, Ipenberg I, Huggins D, Jeyasekharan AD, Ayoub N (2014) PARP1‐dependent recruitment of KDM4D histone demethylase to DNA damage sites promotes double‐strand break repair. Proc Natl Acad Sci USA 111: E728–E737 [DOI] [PMC free article] [PubMed] [Google Scholar]
- 50. Mansour WY, Schumacher S, Rosskopf R, Rhein T, Schmidt‐Petersen F, Gatzemeier F, Haag F, Borgmann K, Willers H, Dahm‐Daphi J (2008) Hierarchy of nonhomologous end‐joining, single‐strand annealing and gene conversion at site‐directed DNA double‐strand breaks. Nucleic Acids Res 36: 4088–4098 [DOI] [PMC free article] [PubMed] [Google Scholar]
- 51. Tang J, Cho NW, Cui G, Manion EM, Shanbhag NM, Botuyan MV, Mer G, Greenberg RA (2013) Acetylation limits 53BP1 association with damaged chromatin to promote homologous recombination. Nat Struct Mol Biol 20: 317–325 [DOI] [PMC free article] [PubMed] [Google Scholar]
- 52. Aymard F, Bugler B, Schmidt CK, Guillou E, Caron P, Briois S, Iacovoni JS, Daburon V, Miller KM, Jackson SP et al (2014) Transcriptionally active chromatin recruits homologous recombination at DNA double‐strand breaks. Nat Struct Mol Biol 21: 366–374 [DOI] [PMC free article] [PubMed] [Google Scholar]
- 53. Morgan SE, Lovly C, Pandita TK, Shiloh Y, Kastan MB (1997) Fragments of ATM which have dominant‐negative or complementing activity. Mol Cell Biol 17: 2020–2029 [DOI] [PMC free article] [PubMed] [Google Scholar]
- 54. Yavuzer U, Smith GC, Bliss T, Werner D, Jackson SP (1998) DNA end‐independent activation of DNA‐PK mediated via association with the DNA‐binding protein C1D. Genes Dev 12: 2188–2199 [DOI] [PMC free article] [PubMed] [Google Scholar]
- 55. Yaneva M, Wen J, Ayala A, Cook R (1989) cDNA‐derived amino acid sequence of the 86‐kDa subunit of the Ku antigen. J Biol Chem 264: 13407–13411 [PubMed] [Google Scholar]
- 56. Reeves WH, Sthoeger ZM (1989) Molecular cloning of cDNA encoding the p70 (Ku) lupus autoantigen. J Biol Chem 264: 5047–5052 [PubMed] [Google Scholar]
- 57. Vos SM, Pollmann D, Caizzi L, Hofmann KB, Rombaut P, Zimniak T, Herzog F, Cramer P (2016) Architecture and RNA binding of the human negative elongation factor. eLife 5: e14981 [DOI] [PMC free article] [PubMed] [Google Scholar]
- 58. Polo SE, Kaidi A, Baskcomb L, Galanty Y, Jackson SP (2010) Regulation of DNA‐damage responses and cell‐cycle progression by the chromatin remodelling factor CHD4. EMBO J 29: 3130–3139 [DOI] [PMC free article] [PubMed] [Google Scholar]
- 59. Luijsterburg MS, de Krijger I, Wiegant WW, Shah RG, Smeenk G, de Groot AJ, Pines A, Vertegaal AC, Jacobs JJ, Shah GM et al (2016) PARP1 links CHD2‐mediated chromatin expansion and H3.3 deposition to DNA repair by non‐homologous end‐joining. Mol Cell 61: 547–562 [DOI] [PMC free article] [PubMed] [Google Scholar]
- 60. Young LC, McDonald DW, Hendzel MJ (2013) Kdm4b histone demethylase is a DNA damage response protein and confers a survival advantage following gamma‐irradiation. J Biol Chem 288: 21376–21388 [DOI] [PMC free article] [PubMed] [Google Scholar]
- 61. Ayrapetov MK, Gursoy‐Yuzugullu O, Xu C, Xu Y, Price BD (2014) DNA double‐strand breaks promote methylation of histone H3 on lysine 9 and transient formation of repressive chromatin. Proc Natl Acad Sci USA 111: 9169–9174 [DOI] [PMC free article] [PubMed] [Google Scholar]
- 62. Bryant HE, Petermann E, Schultz N, Jemth AS, Loseva O, Issaeva N, Johansson F, Fernandez S, McGlynn P, Helleday T (2009) PARP is activated at stalled forks to mediate Mre11‐dependent replication restart and recombination. EMBO J 28: 2601–2615 [DOI] [PMC free article] [PubMed] [Google Scholar]
- 63. Cerami E, Gao J, Dogrusoz U, Gross BE, Sumer SO, Aksoy BA, Jacobsen A, Byrne CJ, Heuer ML, Larsson E et al (2012) The cBio cancer genomics portal: an open platform for exploring multidimensional cancer genomics data. Cancer Discov 2: 401–404 [DOI] [PMC free article] [PubMed] [Google Scholar]
- 64. Gao J, Aksoy BA, Dogrusoz U, Dresdner G, Gross B, Sumer SO, Sun Y, Jacobsen A, Sinha R, Larsson E et al (2013) Integrative analysis of complex cancer genomics and clinical profiles using the cBioPortal. Sci Signal 6: pl1 [DOI] [PMC free article] [PubMed] [Google Scholar]
- 65. Ipenberg I, Guttmann‐Raviv N, Khoury HP, Kupershmit I, Ayoub N (2013) Heat shock protein 90 (Hsp90) selectively regulates the stability of KDM4B/JMJD2B histone demethylase. J Biol Chem 288: 14681–14687 [DOI] [PMC free article] [PubMed] [Google Scholar]
- 66. Pryde F, Khalili S, Robertson K, Selfridge J, Ritchie AM, Melton DW, Jullien D, Adachi Y (2005) 53BP1 exchanges slowly at the sites of DNA damage and appears to require RNA for its association with chromatin. J Cell Sci 118: 2043–2055 [DOI] [PubMed] [Google Scholar]
- 67. Tresini M, Warmerdam DO, Kolovos P, Snijder L, Vrouwe MG, Demmers JA, van IWF, Grosveld FG, Medema RH, Hoeijmakers JH et al (2015) The core spliceosome as target and effector of non‐canonical ATM signalling. Nature 523: 53–58 [DOI] [PMC free article] [PubMed] [Google Scholar]
Associated Data
This section collects any data citations, data availability statements, or supplementary materials included in this article.
Supplementary Materials
Appendix
Expanded View Figures PDF
Review Process File