

Abstract
Aims
Hypoxic response mediated by hypoxia‐inducible factor (HIF) seems to contribute to the benefit of endurance training. To verify the direct contribution of HIF activation to running training without exposure to atmospheric hypoxia, we used prolyl hydroxylase domain 2 (PHD2) conditional knockout mice (cKO), which exhibit HIF activation independent of oxygen concentration, and we examined their maximal exercise capacity before and after 4 weeks of treadmill exercise training.
Methods
Phd2 f/f mice (n = 26) and Phd2 cKO mice (n = 24) were randomly divided into two groups, trained and untrained, and were subjected to maximal running test before and after a 4‐week treadmill‐training regimen.
Results
Prolyl hydroxylase domain 2 deficiency resulted in HIF‐α protein accumulation. Phd2 cKO mice exhibited marked increases in haematocrit values and haemoglobin concentrations, as well as an increase in the capillary number in the skeletal muscle. The 4‐week training elicited an increase in the capillary‐to‐fibre (C/F) ratio and succinyl dehydrogenase activity of the skeletal muscle. Importantly, trained Phd2 cKO mice showed a significantly greater improvement in running time than trained control mice (P < 0.05). Collectively, these data suggest that the combination of training and the activation of the HIF pathway are important for maximizing the effect of running training.
Conclusion
We conclude that the activation of the HIF pathway induced by PHD2 deficiency enhances the effect of running training.
Keywords: altitude training, hypoxic response, training effect, treadmill
Exposing the body to low oxygen (O2) concentrations in the atmosphere elicits a series of adaptive reactions. Hypoxia‐inducible factor (HIF), which is known as a master regulator of the hypoxic response, transcriptionally regulates the expression of several target genes (Epstein et al. 2001, Wenger 2002), including erythropoietin (Epo) (Semenza et al. 1991) and vascular endothelial growth factor (Vegf) (Forsythe et al. 1996, Semenza 2002). These adaptations to lower atmospheric O2 concentration below 15.4% seemed to contribute to the benefit of altitude training (Levine & Stray‐Gundersen 1997); however, the veracity of this benefit is still controversial, and studies ruling out the placebo effect are suggested to be required (Lundby et al. 2012). One of the ways to rule out the placebo effect is to show the effect of biological processes mediated by the HIF pathway on the improvement in exercise performance after exercise training.
Hypoxia‐inducible factor consists of an oxygen‐regulated HIF‐α subunit (HIF‐1α, 2α and 3α) and a constitutively stable HIF‐β subunit (Maltepe et al. 1997). These heterodimers activate the transcription of numerous hypoxia‐inducible genes (Wang & Semenza 1993, Semenza et al. 1994, Wang et al. 1995, Jiang et al. 1996, Takeda et al. 2014). Under normoxic conditions, the HIF‐α subunit undergoes hydroxylation by the prolyl hydroxylase domain protein (PHD), and it is rapidly subjected to ubiquitination followed by proteasomal degradation (Epstein et al. 2001, Ivan et al. 2001, Jaakkola et al. 2001). There are at least three PHD isoforms in mammals (PHD1, 2 and 3), with PHD2 being the main isoform responsible for regulating HIF‐α degradation (Berra et al. 2003). The hydroxylase activity of PHDs is suppressed under hypoxic conditions; thus, under hypoxic conditions, stabilized HIF‐α accumulates, heterodimerizes with HIF‐β and transactivates hypoxia‐responsive genes by binding to hypoxia response elements in the promoter or enhancer regions of these genes (Wang & Semenza 1993, Semenza et al. 1994, Jiang et al. 1996, Hu et al. 2003, Kaelin 2005). Thus, the activities of PHDs act as a switch that regulates the stabilization of HIF and the subsequent hypoxic response.
Interestingly, previous studies (Takeda et al. 2007, Minamishima et al. 2008) showed that Phd2 deficiency stabilizes HIF‐1α and consequently elicits a series of HIF‐dependent transactivation without exposure to atmospheric hypoxia. The phenotype of Phd2‐deficient mice, including high haematocrit, was already described (Takeda et al. 2007, Minamishima et al. 2008); however, the contribution of the stabilization of HIF induced by Phd2 deficiency to exercise capacity is still unknown.
Additionally, while physiological changes induced by the activation of the HIF pathway may improve oxygen delivery (Bunn 2013, Zhang et al. 2014), an excessive elevation of haematocrit values may be associated with hypertension and thromboembolism, resulting in severe or even fatal clinical complications (Bertinieri et al. 1998, Vogel et al. 2003).
Overall, we believed that the Phd2‐deficient mouse model enabled us to elucidate the influence of the activated HIF pathway on the exercise training effect. We therefore hypothesized that the stabilization of HIF and the subsequent haematopoiesis and angiogenesis induced by Phd2 deficiency contribute to the improvement in exercise training effect. To examine this hypothesis, we investigated the maximal exercise capacity of Phd2‐deficient mice before and after a 4‐week regimen of exercise training.
Methods
Mouse strains and crosses
All experiments were conducted in accordance with the regulations of the Standards for Human Care and Use of Laboratory Animals of Tohoku University (Permit Number: 2015ikokumikae‐007, 2015ikodo‐008).
Because constitutive knockout of Phd2 is embryonically lethal (Takeda et al. 2006), we used an oestrogen receptor (ER) agonist‐induced Phd2 knockout mouse using the Cre‐loxP system. Phd2/flox mice (a gift from Dr G.H. Fong) were mated with Rosa26/Cre‐ER(T2) mice to generate Phd2 conditional knockout (cKO) mice (Phd2 f/f /Rosa26 CreERT2; Phd2 cKO) by referring to a previous report (Takeda et al. 2007). To delete the floxed Phd2 exon 2, the ER agonist tamoxifen (Sigma, St. Louis, MO, USA) was delivered to 8‐ to 12‐week‐old male Phd2 cKO mice by intraperitoneal injection (10 mg mL−1 in corn oil, 20 mg kg−1 day−1 for five consecutive days). Littermate male Phd2 f/f mice lacking Cre were used as controls and were similarly treated with tamoxifen. For genotyping, DNA was isolated from tails. The sequences of primers are presented in Table 1.
Table 1.
The primer sequences
| Forward | Reverse | |
|---|---|---|
| Phd2 | 5′‐CAAATGGAGATGGAAGATGC‐3′ | 5′‐TCAACTCGAGCTGGAAACC‐3′ |
| Cre | 5′‐GATATCTCACGTACTGACGG‐3′ | 5′‐TGACCAGAGTCATCCTTAGC‐3′ |
| Hif‐1α | 5′‐CAAGATCTCGGCGAAGCAA‐3′ | 5′‐GGTGAGCCTCATAACAGAAGCTTT‐3′ |
| Hif‐2α | 5′‐CAACCTGCAGCCTCAGTGTATC‐3′ | 5′‐CACCACGTCGTTCTTCTCGAT‐3′ |
| MT‐CO2 | 5′‐ACGAAATCAACAACCCCGTA‐3′ | 5′‐GGCAGAACGACTCGGTTATC‐3′ |
| Glut1 | 5′‐CTTCATTGTGGGCATGTGCTTC‐3′ | 5′‐AGGTTCGGCCTTTGGTCTCAG‐3′ |
| Cox5a | 5′‐TGCGAGCATGTAGACCGTTAAAT‐3′ | 5′‐GAGGTCCTGCTTTGTCCTTAACA‐3′ |
| β‐actin | 5′‐CTGGGTATGGAATCCTGTGG‐3′ | 5′‐GTACTTGCGCTCAGGAGGAG‐3′ |
Running capacity assessment and exercise training
The experimental design is shown in Figure 1. To determine the exercise capacity, a running test using a rodent treadmill was performed 2 weeks after tamoxifen treatment as a baseline before training. Before the test, the mice ran for 5 min at 10 m min−1 as a warm‐up. During the first 30 min, the speed was set at 10 m min−1 and was increased by 2 m min−1 every 15 min. Throughout the warm‐up and test running, the treadmill was set without slopes. The mice were encouraged to run by tail stimulation with a soft brush and a low‐voltage power grid. Exhaustion was determined to be the point at which the animal would not resume running for 15 s despite gentle brushing on the tail and a mild electrical foot shock.
Figure 1.
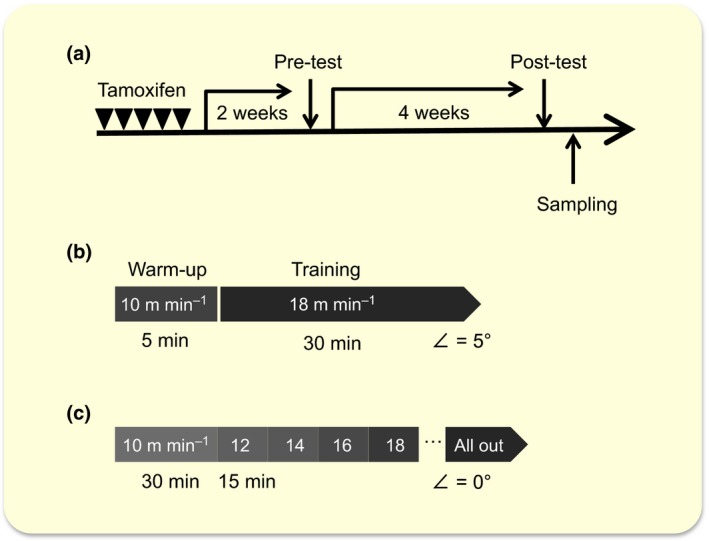
Experimental design. (a) A schematic representation of the study protocol. Two weeks after tamoxifen administration, a treadmill pre‐test was performed to determine the base line of exercise capacity. After 4 weeks of trained or untrained period, post‐test was performed. (b) The protocol for the 4‐week training. The mice in the trained group were trained for 30 min at a speed of 18 m min−1 with a fixed slope of 5° for 5 days per week. (c) The protocol for the maximal exercise test. Before the test, the mice ran for 5 min at 10 m min−1 as a warm‐up. During the first 30 min, the speed was set at 10 m min−1 and was increased by 2 m min−1 every 15 min. Throughout the warm‐up and test running, the treadmill was set without slopes.
After the test, the mice (26 control mice and 24 Phd2 cKO mice) were randomly divided into two groups: trained and untrained. The trained group was subjected to 4‐week treadmill training. Briefly, the mice in the trained group were trained for 30 min at a speed of 18 m min−1 with a fixed slope of 5° for 5 days per week. The mice that were reluctant to run were humanely stimulated by a soft brush on the tail. All mice in the trained group ran equal distances throughout 4‐week study. After 4 weeks, all mice of both groups were tested again for their maximal exercise capacity. All mice were killed by cervical dislocation under anaesthesia 2 days post‐test, and their organs were subsequently harvested for analysis.
Blood analysis
Whole blood was collected 6 weeks after tamoxifen administration from the control and Phd2 cKO mice via the buccal vein under anaesthesia. All blood components were analysed using Celltac Alpha (Nihon Kohden, Tokyo, Japan). After centrifugation, the supernatant was stored at −20 °C until further examination. Plasma erythropoietin (EPO), vascular endothelial growth factor (VEGF) and nitric oxide (NO) metabolite levels were measured using enzyme‐linked immunosorbent assay kits (R&D Systems, Minneapolis, MN, USA) according to the manufacturer's protocols. NO is a gaseous free radical with a short half‐life of a few seconds or less in vivo. Therefore, the levels of more stable NO metabolites, nitrite () and nitrate (), were evaluated for an indirect measurement of NO in biological fluids (Wennmalm et al. 1992).
RNA extraction and quantitative real‐time RT‐PCR analysis
The total RNA from the tibialis anterior (TA), soleus muscle and kidney samples were isolated with the RNeasy Mini Kit (Qiagen, Venlo, the Netherlands) and used for cDNA synthesis with a QuantiTect reverse transcription kit (Qiagen). Quantitative real‐time RT‐PCR (qPCR) was then performed on 15 ng cDNA equivalents using Fast SYBR Green PCR Master Mix (Life Technologies Corp., Carlsbad, CA, USA) on a StepOnePlus PCR System (Applied Biosystems, Foster City, CA, USA) following the manufacturer's instructions. The sequences of the primers are presented in Table 1. Gene expression levels were normalized to β‐actin.
Western blot analysis
Total protein extracts from the heart, kidney and skeletal muscle (e.g. TA) were prepared as previously described (Shin et al. 2015), and protein concentrations were measured using BCA Protein Assay Reagent (Thermo Fisher Scientific, Waltham, MA, USA). Immediately after tissue sampling, nuclear extractions from the excised skeletal muscle (gastrocnemius muscle) and the excised kidney were performed as previously described (Moslehi et al. 2010). The protein concentrations of the nuclear extracts were measured using a Pierce 660 nm Protein Assay reagent (Thermo Fisher Scientific), and the samples were immediately used for Western blotting or stored at −20 °C for further analyses. The aliquots for Western blotting analyses were separated by 5–20% gradient sodium dodecyl sulphate–polyacrylamide gel electrophoresis and were transferred onto polyvinylidene fluoride membranes. All samples were transferred onto the same membrane for each protein. Specific bands were detected with the following primary antibodies: rabbit polyclonal anti‐HIF‐1α (NB100‐479, 1 : 1000; Novus Biologicals, Littleton, CO, USA), rabbit polyclonal anti‐HIF‐2α (NB100‐122, 1 : 1000; Novus Biologicals), rabbit polyclonal anti‐PHD2 (#4835, 1 : 1000; Cell Signaling Technology, Danvers, MA, USA), rabbit monoclonal anti‐glyceraldehyde‐3‐phosphate dehydrogenase (GAPDH) (#2118, 1 : 2000; Cell Signaling Technology) and mouse monoclonal anti‐α‐tubulin (#3873, 1 : 2000; Cell Signaling Technology). The bound antibody was detected with secondary antibodies (7074S, 1 : 5000; Cell Signaling Technology; sc‐2005, 1 : 5000; Santa Cruz Biotechnology, Santa Cruz, CA, USA) followed by the ECL Prime Western Blotting Detection System (GE Healthcare, Buckinghamshire, UK).
Histological analysis of the skeletal muscle
To determine the capillary number, gastrocnemius muscle samples were harvested from the mice of both genotypes. The muscle samples were mounted on a cork disk. They were then frozen and stored. The middle portion of the frozen muscles was cut into 8‐μm sections for histological analysis. The immunostaining was conducted using primary antibodies (CD31, anti‐rat 1 : 30; BD Pharmingen, San Diego, CA, USA, and laminin 1 : 1000, anti‐rabbit; Sigma) and secondary antibodies (Alexa Fluor 488 anti‐rat, 1 : 800 and Alexa Fluor 555 anti‐rabbit, 1 : 800; Life Technologies). The samples were fixed for 20 min in cold (4 °C) 4% paraformaldehyde and washed in ice‐cold PBS three times for 5 min. The samples were blocked for 1 h in PBS with 0.3% Triton X‐100 and 10% goat serum prior to primary antibody incubation in a blocking buffer (1 : 300) overnight at 4 °C. After washing three times for 5 min with a wash buffer, slides were incubated with the secondary antibody in the blocking buffer (1 : 400) for 1 h at room temperature. Following the secondary incubation, the slides were washed three times for 5 min and mounted in a Vectashield mounting medium (Vector Labs, Burlingame, CA, USA) with DAPI.
The stained muscle sections were visualized under a microscope (20× magnification) (C2+; Nikon, Tokyo, Japan) and were analysed using NIS elements (Nikon) and imagej software version 1.48u4 (National Institutes of Health, Bethesda, MD, USA). CD31‐positive cells and the number of fibres were counted in randomly selected at least 10 separate fields per sample from the gastrocnemius muscle. Then, capillary‐to‐fibre ratio was calculated.
The section of the gastrocnemius muscle was also stained for succinate dehydrogenase (SDH), which is one of the representative oxidative enzymes (Ackrell 2002, Tanji & Bonilla 2008). Sections were first allowed to dry at room temperature and were then incubated in a solution containing nitro blue tetrazolium (0.5 mg mL−1), sodium succinate (50 mm) and phosphate buffer (50 mm) for 50 min at 37 °C. Cross‐sections were then washed three times with distilled water and then cover‐slipped using the glycerol‐based mounting medium. For the quantification of SDH‐positive fibres, 500‐μm square compartments were serially allocated along the surface of SDH‐stained section of gastrocnemius muscle to cover the whole outer segment of lateral gastrocnemius. To cover the outer segment of lateral gastrocnemius muscle, 8–13 compartments in average were allocated. All SDH‐positive fibres within the allocated compartments were counted and divided by the compartment covered area to calculate the number of SDH‐positive fibres per mm2 in outer segment of lateral gastrocnemius, where the effect of training on the increase in SDH‐positive fibres was apparently remarkable at this segment as compared to the other part of gastrocnemius muscle.
Statistical analysis
Data are presented as the mean ± SE. Groups were compared by an unpaired Student's t‐test or a two‐way anova using the ibm spss Statistics v.19.0 (IBM Corp, Armonk, NY, USA) software package.
The unpaired Student's t‐test was performed to compare the band intensities of each protein. The body and tissue weights, the results of ELISA, the quantitative data of staining and gene expressions were analysed by the two‐way anova [training (untrained or trained) × genotype (control or Phd2 cKO)]. The running time was compared with the two‐way repeated‐measures anova [time (pre or post) × genotype (control or Phd2 cKO)]. P‐values below 0.05 were considered significant.
Results
Phd2 expression after tamoxifen administration
Western blotting was performed to determine the expression of PHD2 protein. The representative Western blot images for each tissue are shown in Figure 2a. PHD2 protein expression was markedly lower than control in all the tissues examined. The quantified results of the TA muscle are demonstrated in Figure 2b with a statistical significance determined by Student's t‐test (P < 0.01).
Figure 2.
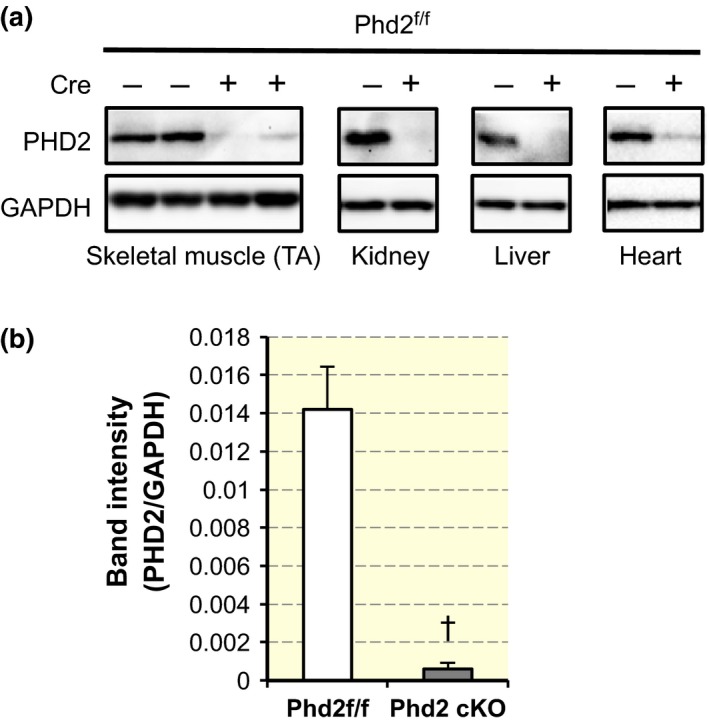
Phenotypes of Phd2 f/f /ROSA26 CreERT 2 mice. (a) Representative Western blots of PHD2 in the tibialis anterior (TA) muscle, kidney, liver and heart. (b) Quantification of band intensity of PHD2/GAPDH in TA (n = 4 per group). Values are shown as means ± SEM. † P < 0.01 compared with control using Student's t‐test.
Body weight and skeletal muscle weight
Body weight and skeletal muscle weight/body weight are presented in Table 2. The body weights of the control and Phd2 cKO mice were comparable (F 1,43 = 0.52, P = 0.475 for interaction). Similarly, there was no statistical significance observed for both the interaction and the main effect of genotype and training in the soleus muscle/body weight (F 1,43 = 2.17, P = 0.148 for interaction). On the other hand, the gastrocnemius weight/body weight of Phd2 cKO mice was significantly lower than that of control mice (F 1,43 = 7.404, P < 0.01), without significant interaction of training (F 1,43 = 0.279, P = 0.60 for interaction). The heart weight/body weight of Phd2 cKO mice was significantly higher than that of control mice (F 1,40 = 7.153, P < 0.05), but there was no significant interaction of training (F 1,40 = 0.00, P = 0.99 for interaction).
Table 2.
Body and organ weight
| Phd2 f/f | Phd2 cKO | |||
|---|---|---|---|---|
| Untrained | Trained | Untrained | Trained | |
| n = 11 | n = 13 | n = 11 | n = 12 | |
| Body weight (g) | 27.0 ± 0.63 | 25.1 ± 0.86 | 25.4 ± 0.9 | 24.7 ± 1.0 |
| GC/BW (mg g−1)a | 5.85 ± 0.06 | 5.95 ± 0.32 | 5.41 ± 0.08 | 5.30 ± 0.13 |
| SOL/BW (mg g−1) | 0.30 ± 0.01 | 0.32 ± 0.02 | 0.31 ± 0.01 | 0.28 ± 0.01 |
| n = 8 | n = 13 | n = 11 | n = 12 | |
|---|---|---|---|---|
| HW/BW (mg g−1)b | 5.38 ± 0.19 | 5.78 ± 0.28 | 6.31 ± 0.28 | 6.72 ± 0.47 |
BW, body weight; GC, gastrocnemius; SOL, soleus; HW, heart weight.
Values are shown as means ± SEM.
The main effect of genotype on GC/BW ratio was significant (F 1,43 = 7.404, P < 0.01), but there was no significant interaction of training (F 1,43 = 0.279, P = 0.60 for interaction).
The main effect of genotype on HW/BW ratio was significant (F 1,40 = 7.153, P < 0.05), but there was no significant interaction of training (F 1,40 = 0.00, P = 0.99 for interaction).
HIF‐dependent adaptive responses
HIF‐1α protein, the key factor in the hypoxic response, was stabilized in the gastrocnemius muscle in the Phd2 cKO mice compared with that in the gastrocnemius muscle in the control mice (Fig. 3a,b). Similarly, an accumulation of HIF‐1α protein in the kidney was observed as previously reported (Takeda et al. 2008; Fig. 3a). Additionally, HIF‐2α protein accumulated in the kidney of the Phd2 cKO mice (Fig. 3c,d). On the other hand, the expression levels of Hif‐1α mRNA in the TA muscle (Fig. 3e) and Hif‐2α mRNA in the kidney (Fig. 3f) were not different between the control and Phd2 cKO mice.
Figure 3.
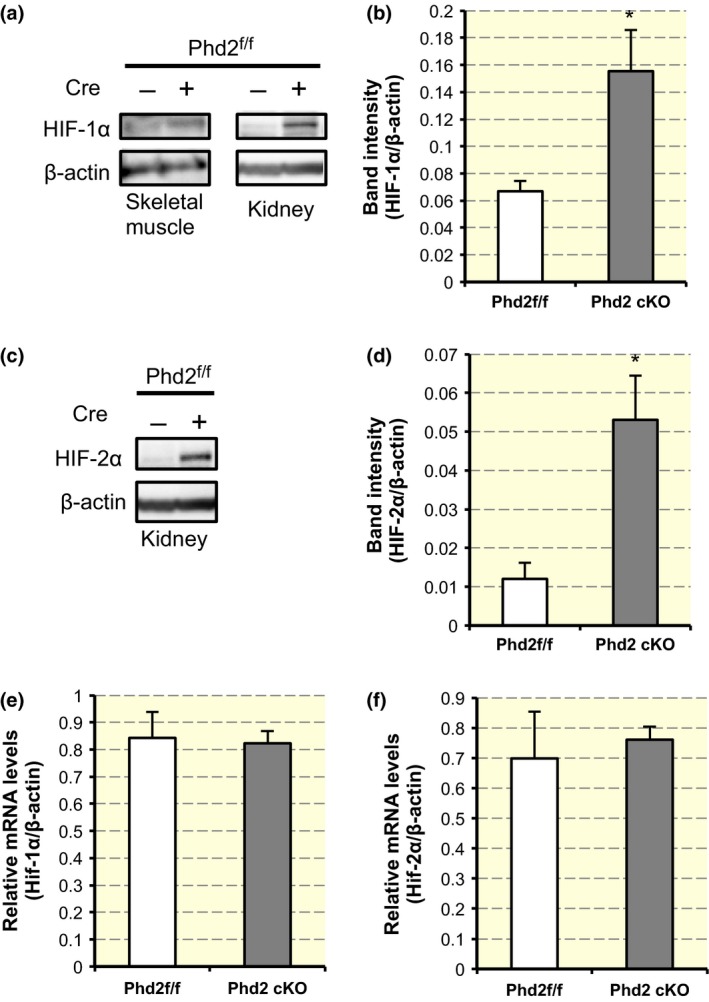
Stabilization of HIF‐α proteins in Phd2 cKO mice. (a) Anti‐HIF‐1α and anti‐β‐actin (loading control) Western blots of nuclear lysates from the kidney and gastrocnemius (GC). (b) Quantification of band intensity of HIF‐1α/β‐actin in GC (n = 4 per group). *Statistically significant differences compared with the control values using Student's t‐test (P < 0.05). (c) Anti‐HIF‐2α and anti‐β‐actin Western blots of nuclear lysates from the kidney. (d) Quantification of band intensity of HIF‐2α/β‐actin in kidney (n = 3 per group). *Statistically significant difference compared with the control values using Student's t‐test (P < 0.05). (e) The expression of Hif‐1α mRNA in the tibialis anterior (TA) muscle (n = 3 per group) (P = n.s., Student's t‐test). (f) The expression of Hif‐2α mRNA in the kidney (n = 3 per group) (P = n.s., Student's t‐test).
Next, we performed an enzyme‐linked immunosorbent assay to determine the plasma levels of HIF‐1‐ and HIF‐2‐dependent EPO (Fig. 4a) and VEGF (Fig. 4b). Phd2 deficiency mice showed a markedly high plasma level of EPO (F 1,14 = 1567.156, P < 0.01) and VEGF (F 1,14 = 2121.371, P < 0.01).
Figure 4.
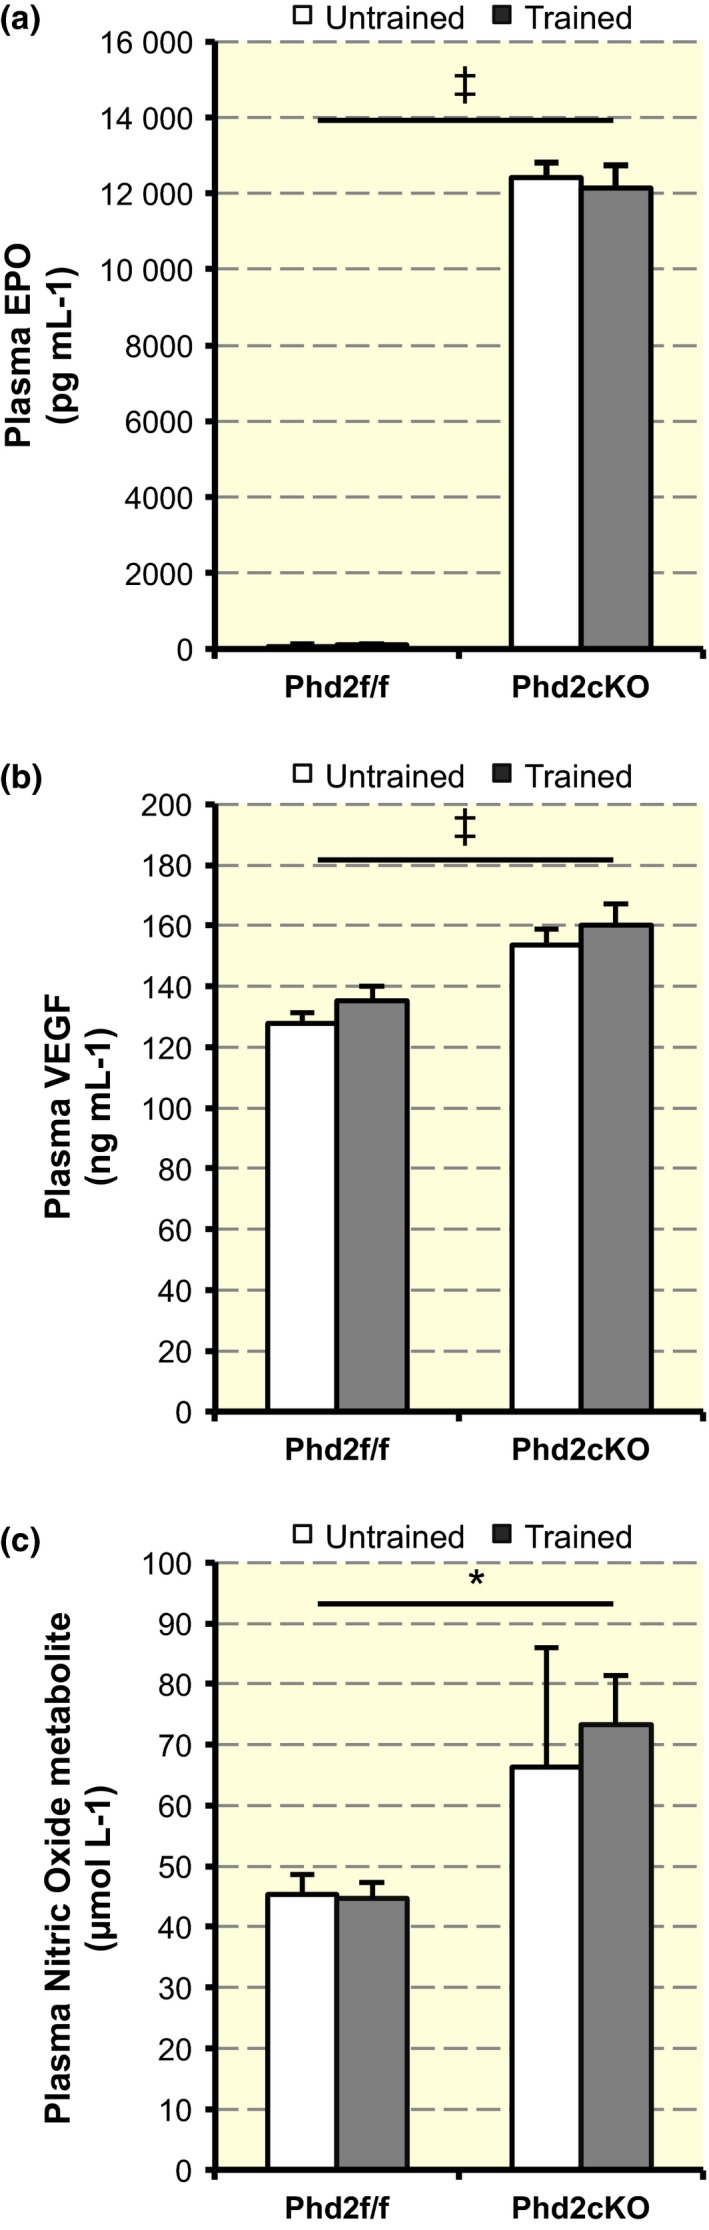
Upregulation of plasma EPO, VEGF and nitric oxide (NO) metabolite level. (a) Plasma levels of EPO (n = 4–5 per group). A two‐way anova [training (untrained or trained) × genotype (control or Phd2 cKO)] showed a statistically significant main effect of genotype in the EPO levels (F 1,14 = 1567.156, ‡ P < 0.001). There was no significant interaction between training and genotype (F 1,14 = 0.23, P = 0.639). Values are shown as means ± SEM. (b) Plasma levels of VEGF‐A (n = 4–5 per group). There was a statistically significant main effect of genotype in the VEGF levels (F 1,14 = 21.371, ‡ P < 0.001), but there was no significant interaction between training and genotype (F 1,13 = 0.08, P = 0.929). Values are shown as means ± SEM. (c) Total NO metabolite level in circulation (n = 4–5 per group). There was a statistically significant main effect of genotype in the plasma NO metabolite level (F 1,13 = 5.682, *P < 0.05), but there was no significant interaction between training and genotype (F 1,13 = 0.14, P = 0.714). Values are shown as means ± SEM.
Changes in blood components
To confirm whether the Phd2 cKO mice exhibited changes in blood components, their haematological parameters were compared (Table 3).
Table 3.
Haematological variables
| Phd2 f/f | Phd2 cKO | |||
|---|---|---|---|---|
| Untrained | Trained | Untrained | Trained | |
| RBC (106 per mm3)a | 917.8 ± 28.4 | 875.2 ± 39.3 | 1561.3 ± 72.9 | 1597.5 ± 29.6 |
| Hct (%)a | 42.4 ± 1.5 | 44.0 ± 0.6 | 74.5 ± 0.6 | 74.9 ± 1.2 |
| Hb (g dL−1)a | 13.7 ± 0.4 | 14.1 ± 0.3 | 21.4 ± 0.1 | 21.6 ± 0.4 |
RBC, red blood cell; Hct, haematocrit; Hb, haemoglobin.
Values are shown as means ± SEM.
The main effects of genotype were significant (RBC, F 1,20 = 218.499, P < 0.01; haemoglobin, F 1,12 = 518.695, P < 0.01; haematocrit, F 1,12 = 939.13, P < 0.01).
Phd2 cKO mice showed markedly higher red blood cell volume, haematocrit and haemoglobin compared with control mice (RBC, F 1,20 = 218.499, P < 0.01; haematocrit, F 1,12 = 939.13, P < 0.01; haemoglobin, F 1,12 = 518.695, P < 0.01). However, training did not affect the blood profile (RBC, F 1,20 = 0.728, P = 0.404 for interaction; haemoglobin, F 1,12 = 0.141, P = 0.714 for interaction; haematocrit, F 1,12 = 0.313, P = 0.586 for interaction).
Circulating NO metabolite level
A previous report (Ruschitzka et al. 2000) showed that endothelial NO maintains normotension and critically determines the in vivo survival under conditions of increased haematocrit values under EPO overexpression. We, therefore, speculated that the NO level would be increased in Phd2 cKO mice. The plasma NO metabolite level in the Phd2 cKO mice was significantly higher than that in the control mice (F 1,13 = 5.682, P < 0.05) (Fig. 4c), but there was no significant interaction between training and genotype (F 1,13 = 0.14, P = 0.714 for interaction). There was no significant effect of training on plasma NO metabolite level (F 1,13 = 0.096, P = 0.762).
Capillary number in the skeletal muscle
To determine the capillary number, we co‐stained the gastrocnemius muscle sections with CD31, an endothelial cell‐specific marker, DAPI and laminin (Fig. 5). The number of CD31‐positive cells per field was counted (Fig. 6a) and a two‐way anova [training (untrained or trained) × genotype (control or Phd2 cKO)] was performed. The capillary number was significantly increased in Phd2 cKO mice as compared to control mice (F 1,8 = 16.053, P < 0.05) (Fig. 6a) irrespective of training status (F 1,8 = 0.158, P = 0.701 for interaction). Similarly, the fibre number per field was significantly increased in Phd2 cKO mice as compared to control mice (F 1,8 = 27.268, P < 0.01), irrespective of training status (F 1,8 = 0.07, P = 0.934 for interaction) (Fig. 6b). Next, we calculated the capillary‐to‐fibre (C/F) ratio. The C/F ratio was significantly increased by training (F 1,8 = 8.407, P < 0.05), but genotype did not affect the C/F ratio (F 1,8 = 0.098, P = 0.762 for interaction) (Fig. 6c).
Figure 5.
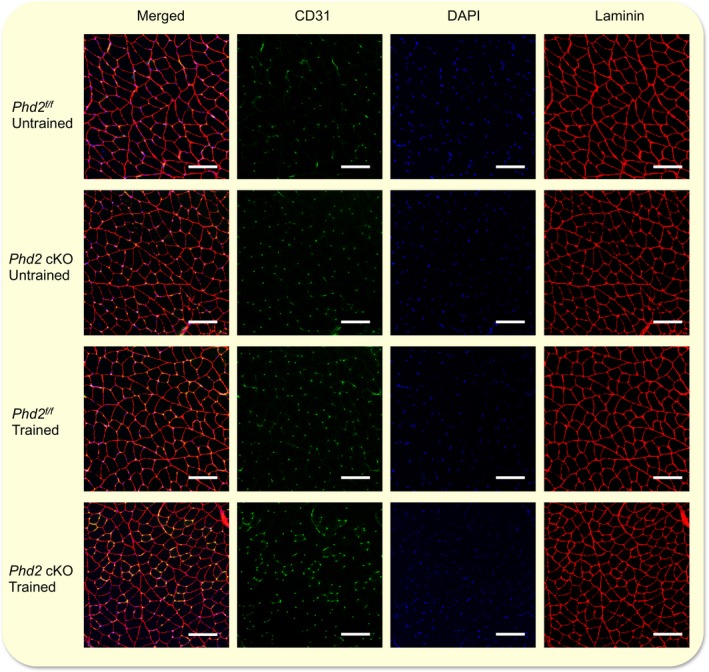
Comparison of CD31 expression and number of fibres in the skeletal muscle between control and Phd2 cKO mice. Co‐staining of the gastrocnemius muscle with CD31, DAPI and laminin. Scale bar: 100 μm.
Figure 6.
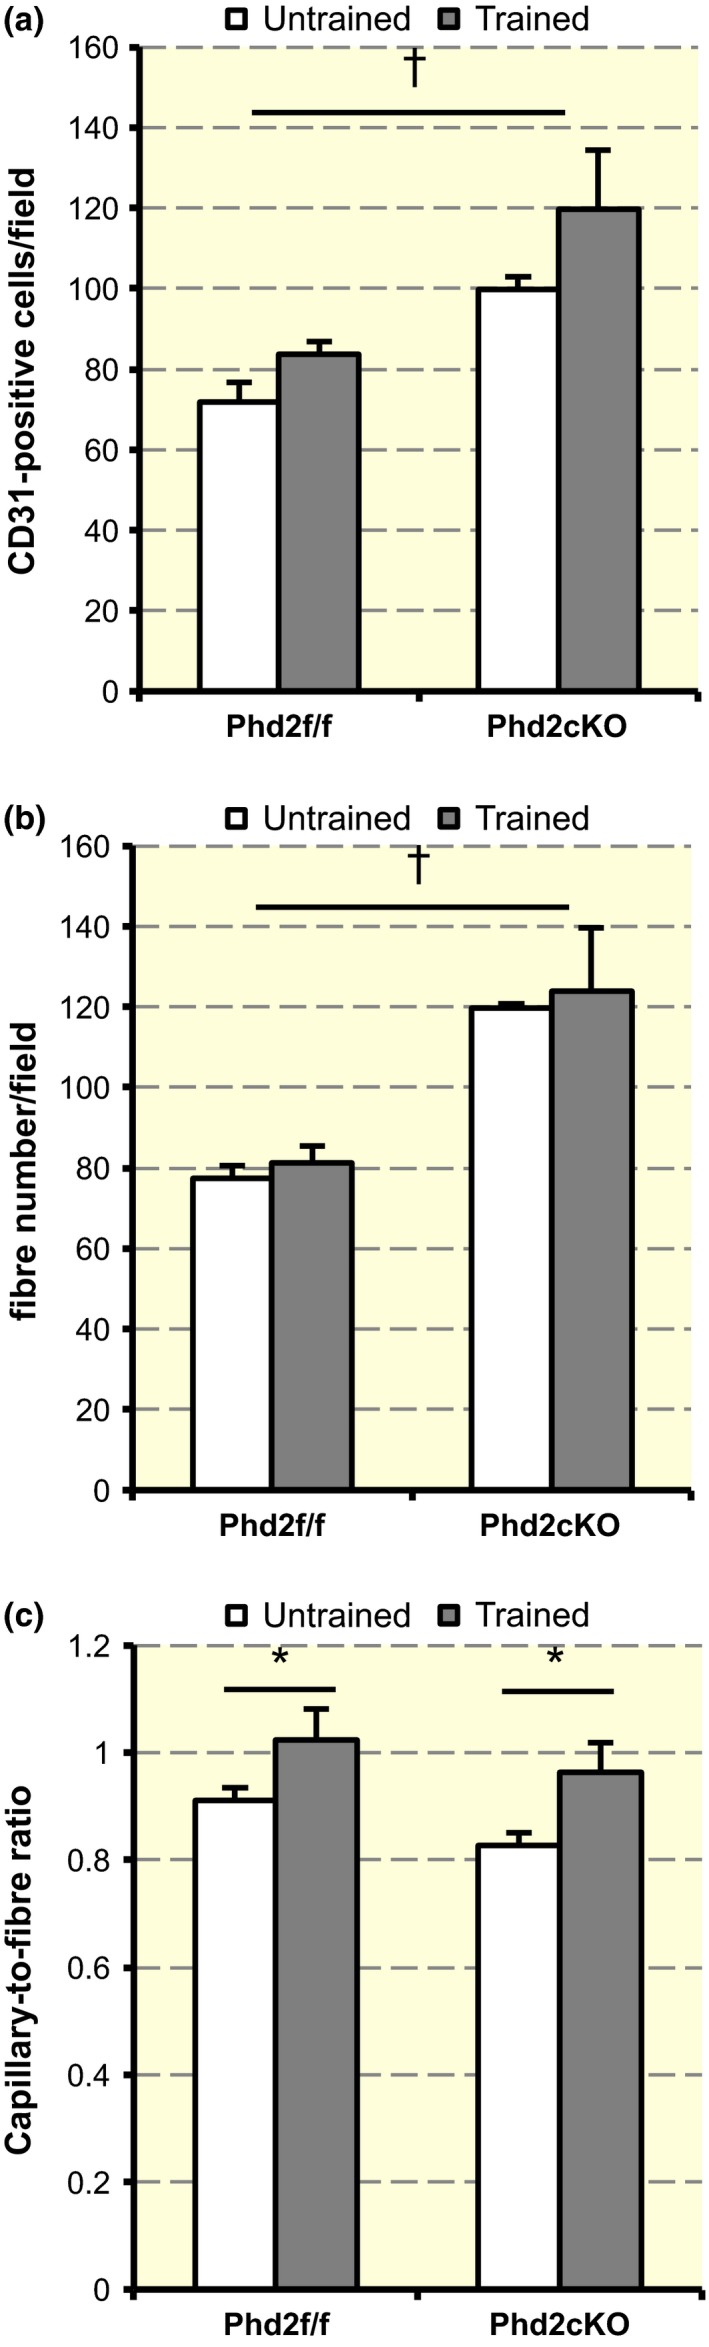
Quantification of Figure 5. (a) Quantitative results of CD31‐positive cells per field. A two‐way anova [training (untrained or trained) × genotype (control or Phd2 cKO)] showed a statistically significant main effect of genotype on the capillary number (F 1,8 = 16.053, † P < 0.01), but there was no significant interaction between training and genotype (F 1,8 = 0.158, P = 0.701). Values are shown as means ± SEM. (b) Quantitative results of number of fibres per field. There was a significant main effect of genotype (F 1,8 = 27.268, † P < 0.01), but there was no significant interaction between training and genotype (F 1,8 = 0.07, P = 0.934). Values are shown as means ± SEM. (c) Quantitative results of the C/F ratio. There was a statistically significant main effect of training on the C/F ratio (F 1,8 = 8.407, *P < 0.05), but there was no significant interaction between training and genotype (F 1,8 = 0.098, P = 0.762). Values are shown as means ± SEM.
SDH staining in skeletal muscle
Staining for SDH activity revealed an apparent increase in SDH‐positive fibres in the gastrocnemius muscles of the trained groups of both genotypes. SDH‐positive fibres were particularly spread into the outer segment of the lateral gastrocnemius muscle of the trained Phd2 cKO mice (F 1,8 = 12.553, P < 0.01 for interaction) (Fig. 7a,b).
Figure 7.
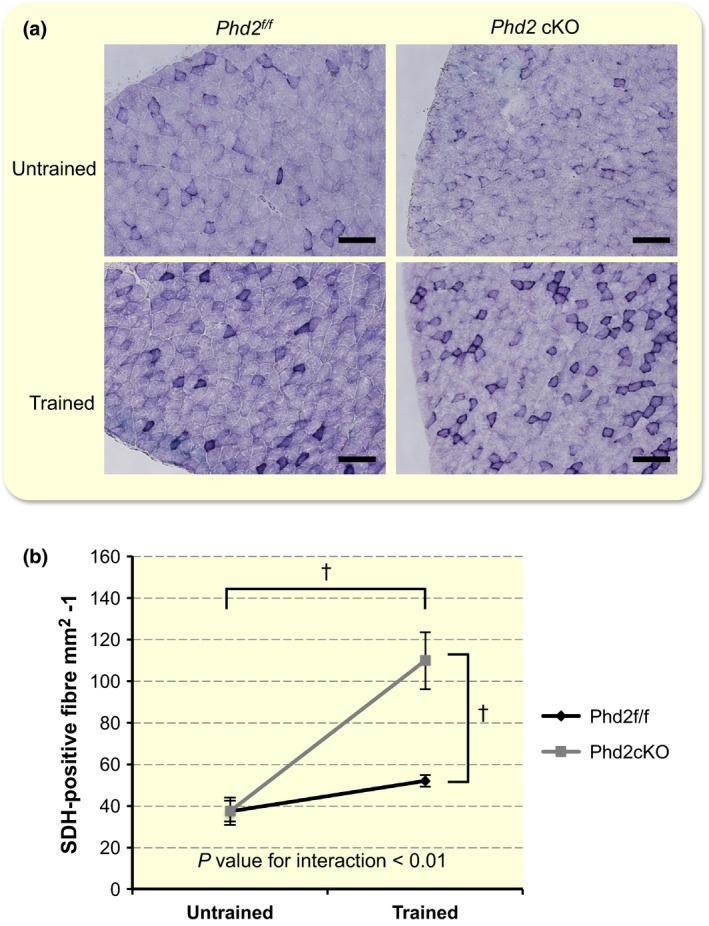
Succinyl dehydrogenase (SDH) staining of the gastrocnemius muscle. (a) Representative SDH staining of the lateral gastrocnemius muscle. Scale bar: 100 μm. (b) Quantitative results of SDH staining. A two‐way anova [training (untrained or trained) × genotype (control or Phd2 cKO)] showed a significant interaction between training and genotype (F 1,8 = 12.553, P < 0.01 for interaction). The main effect of training (F 1,8 = 28.590, † P < 0.01) and genotype (F 1,8 = 12.661, † P < 0.01) was significant. Values are shown as means ± SEM.
Gene expression in skeletal muscle
As the skeletal muscle is a major determinant of aerobic exercise capacity (Wisloff et al. 2005, Park et al. 2009), we examined the expression of some metabolic and mitochondrial genes in the soleus muscle. The expression of Glut1, which is one of the target genes of HIF, was upregulated in untrained Phd2 cKO mice, but not in trained Phd2 cKO mice (F 1,11 = 7.224, P < 0.05 for interaction) (Fig. 8a). Although there was no significant interaction between training and genotype (F 1,10 = 0.801, P = 0.39 for interaction), the expression of MT‐CO2 expression was lower in untrained Phd2 cKO mice as compared to untrained control mice (F 1,10 = 5.286, P < 0.05). The level of MT‐CO2 expression was upregulated to a similar level after training in both genotypes (F 1,10 = 6.625, P < 0.05). There was no interaction and main effect found for Cox5a (F 1,8 = 2.534, P = 0.15 for interaction) (Fig. 8c).
Figure 8.
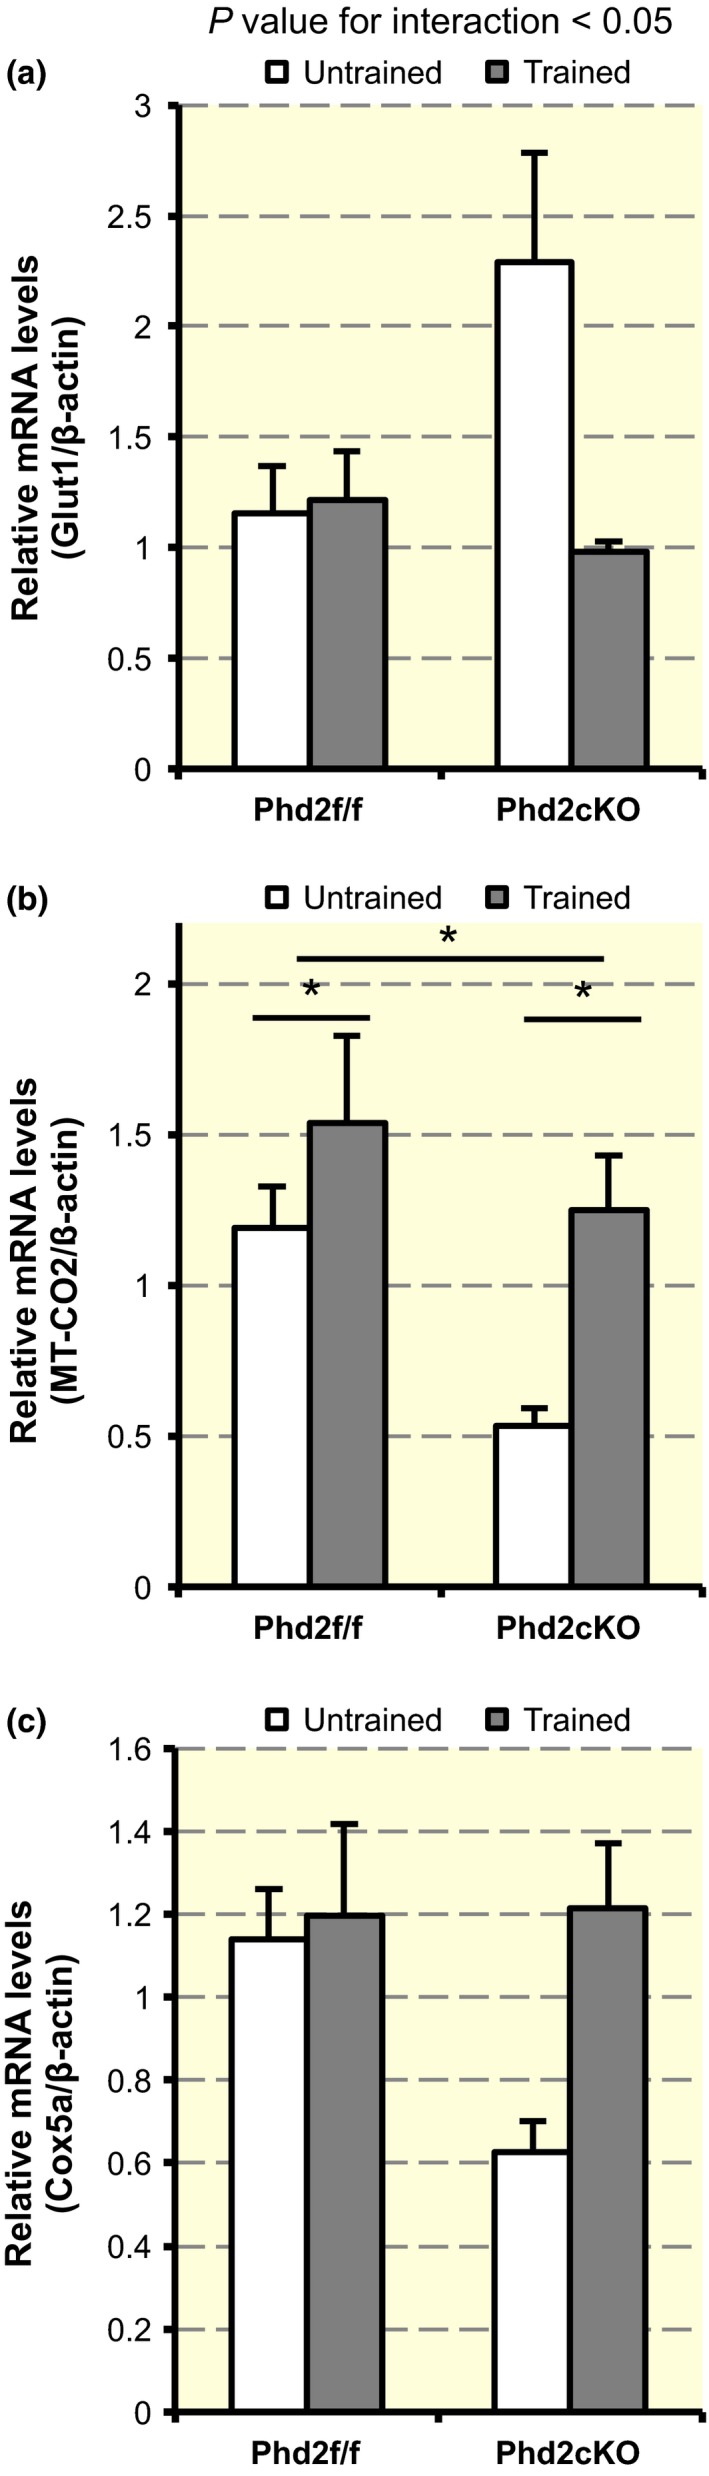
Gene expressions in the skeletal muscle. (a) The expression of Glut1 mRNA (n = 3–4 per group) in the soleus muscle. A two‐way anova exhibited a significant interaction between genotype and time (F 1,11 = 7.224, P < 0.05). Values are shown as means ± SEM. (b) The expression of MT‐CO2 mRNA (n = 3 per group) in the soleus muscle. There was a significant main effect of genotype (F 1,10 = 5.286, *P < 0.05) and training (F 1,10 = 6.625, *P < 0.05). Values are shown as means ± SEM. (c) The expression of Cox5a mRNA (n = 3 per group) in the soleus muscle. There was no interaction and main effect (F 1,8 = 2.534, P = 0.15 for interaction). Values are shown as means ± SEM.
Maximal exercise capacity
To examine whether Phd2 deficiency improved the effect of treadmill training, maximal exercise tests were performed before and after the 4‐week period with or without exercise training (for both the trained and untrained groups) (Fig. 9a,b). Although untrained mice showed a slight increase in running time (F 1,23 = 34.0, P < 0.01), the levels of improvement in the running time of control and Phd2 cKO mice were similar (F 1,23 = 3.157, P = 0.09 for interaction) (Fig. 9a). In contrast, a significant interaction between time and genotype was found in the trained group (F 1,23 = 9.353, P < 0.01 for the interaction) (Fig. 9b). The main effect of time (F 1,23 = 118.746, P < 0.01) and the main effect of genotype were both significant (F 1,23 = 4.802, P < 0.05).
Figure 9.
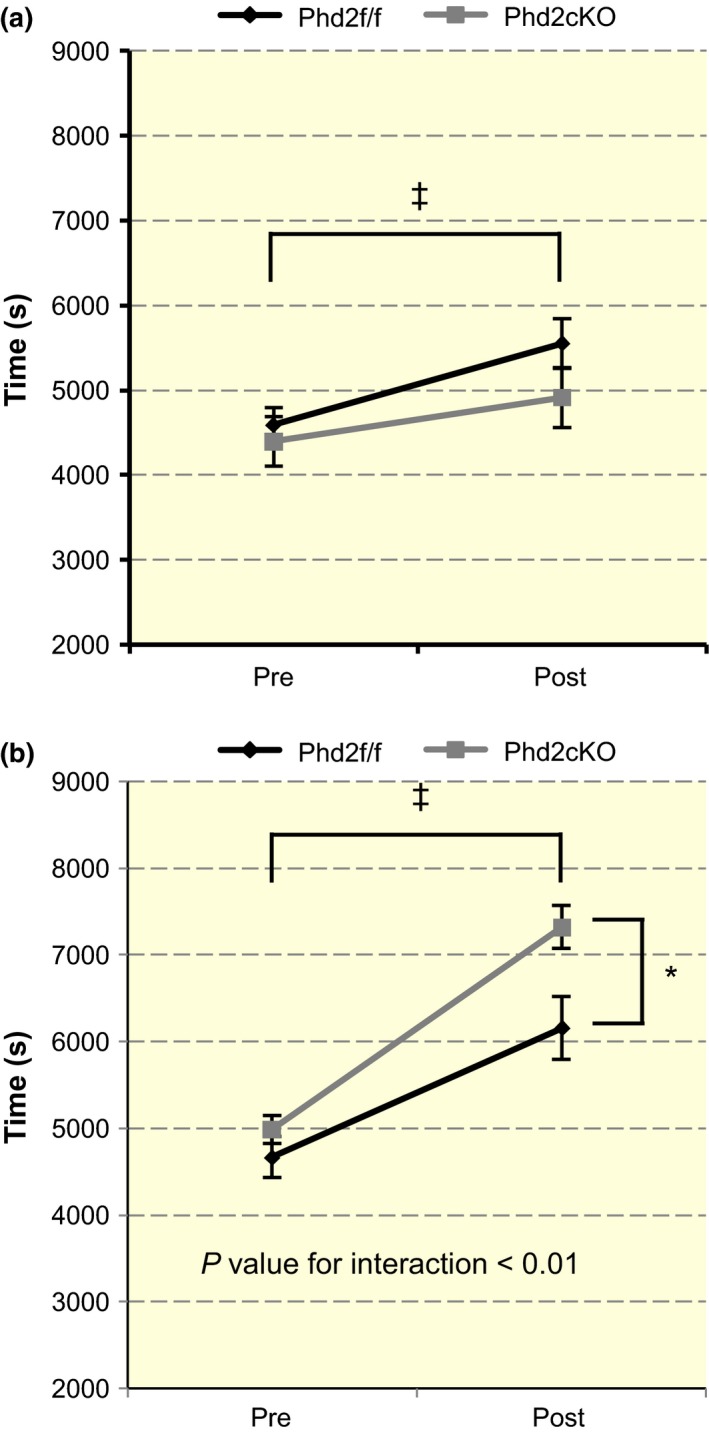
Running times of the control and Phd2 cKO mice. (a) The running time before and after the 4‐week period is shown for the untrained groups (n = 12–14 per group). A two‐way anova [time (pre or post) × genotype (control or Phd2 cKO)] showed a significant main effect of time (F 1,23 = 34.0, ‡ P < 0.001). There was no significant interaction between time and genotype in the untrained group (F 1,23 = 3.157, P = 0.09). Values are shown as means ± SEM. (b) The running time before and after training in the trained mice. A significant interaction between time and genotype was found (F 1,23 = 9.353, P < 0.01). The main effect of time (F 1,23 = 118.746, ‡ P < 0.001) and genotype was significant (F 1,23 = 4.802, *P < 0.05). Values are shown as means ± SEM.
Discussion
The results of this study suggest that the activation of the HIF pathway induced by PHD2 deficiency led to an improved effect of the 4‐week regimen of treadmill training. The upregulation of EPO induced by stabilized HIF was accompanied by a notable increase in the haemoglobin concentration and haematocrit value, as previously reported (Minamishima et al. 2008). An increase in capillary and fibre number in the skeletal muscle was also observed as a physiological reaction induced in the Phd2 cKO mice in response to HIF stabilization. The 4‐week running training elicited significant increases in the C/F ratio and oxidative capacity of the skeletal muscle in the trained groups in both genotypes. Most importantly, the increase in the running time after training was longer in the Phd2 cKO mice by a factor of approx. 1.57, compared with that in the control mice. These data suggest that PHD2 deficiency improved the effect of running training through the activation of HIF pathway and training‐induced improvement in oxidative capacity without being exposed to low atmospheric oxygen concentration.
The tamoxifen‐treated Phd2 f/f /Rosa26 CreERT2 mice exhibited PHD2 deficiency and the accumulation of HIF‐α protein subunits. However, there was no significant difference in the mRNA levels of Hif‐1α in the TA muscle and Hif‐2α in the kidney between the control and Phd2 cKO mice, as previously reported (Takeda et al. 2006, 2007). We previously found that there was no significant difference in the mRNA levels of Hif‐1α in the gastrocnemius muscle between control and Phd2 cKO mice (Shin et al. 2015). These results suggest that the accumulation of HIF‐1α and HIF‐2α proteins depends on the decrease in PHD2 expression rather than on the expression levels of Hif‐1α and Hif‐2α mRNA.
We predicted that excessive erythrocytosis might give some deleterious effect such as thromboembolism on the Phd2 cKO mice. However, contrary to our expectations, none of the mice experienced ill health, despite the fact that some Phd2 cKO mice had haematocrit values over 75%. Moreover, the Phd2 cKO mice that had experienced this high haematocrit value were able to perform the running exercise without a break. NO‐mediated vasodilatation may explain this phenomenon. A previous report showed that erythrocytotic mice neither developed hypertension nor displayed a change in heart rate or cardiac output, despite having haematocrit values of 80–90% in mice overexpressing EPO (Ruschitzka et al. 2000). They suggested that enhanced eNOS activity must have been due to increased blood viscosity that potentiates shear forces. NO‐mediated vasodilatation is one of the adaptive mechanisms to combat excessive erythrocytosis in mice that overexpress EPO, which protects the animals from cardiovascular complications including thromboembolism and hypertension (Ruschitzka et al. 2000). Additionally, iNOS is a hypoxia‐inducible gene because hypoxia‐responsive element is present in the iNOS promoter (Melillo et al. 1995). Therefore, increased NO production in Phd2 cKO could also be mediated by inflammatory cells expressing iNOS like macrophages, which needs further investigation.
Previously, Minamishima et al. (2008) proposed that Phd2 f/f; beta‐actin‐Cre‐ER mice, is a model of cardiomyopathy because they exhibited marked hypertrophy of cardiomyocytes and a wider space between myocardial fibres. Similarly, the heart weight of the Phd2 cKO mice was greater than that of the control mice, but they were able to run with no difficulty throughout the 4‐week training period. These data suggest that the increase in heart weight induced by Phd2 deficiency had little effect on either the running time or the improvement in running time.
Phd2 deficiency increased not only the capillary number but also the number of myofibres per field in the skeletal muscle. Therefore, the Phd2 deficiency per se may not be sufficient to increase the C/F ratio. The increased C/F ratio, supposed to improve O2 flux to the muscle fibres, was elicited by training, which could contribute to the improvement in the running time for both genotypes. Therefore, angiogenesis induced by Phd2 deficiency may be further complemented by an additional training‐induced increase in the capillary number.
Although type I myofibres were increased in the gastrocnemius muscles in Phd2 cKO mice without training as we previously reported (Shin et al. 2015), there was no marked increase in the SDH‐positive fibres in Phd2 cKO mice before or without training. An increase in the SDH activity was only observed following the exercise training. It is possible that the fibre type transition, as determined by myosin heavy chain I expression, does not necessarily accompany SDH or oxidative enzymatic activity. The increased slow fibres in Phd2 cKO mice may require endurance training to gain an improved oxidative capacity.
Furthermore, previous reports have suggested that HIF‐1 signalling limits oxidative metabolism in the skeletal muscle and that exercise training may prevent this process (Lundby et al. 2006, Mason et al. 2007). In accordance with these reports, we observed a downregulation in oxidative metabolism, as demonstrated by higher Glut1 gene expression, and reduced MT‐CO2 gene expression in the untrained Phd2 cKO mice. This suppression of oxidative metabolism may reduce the capacity to use oxygen, even when its availability is enhanced by increased haemoglobin concentration and haematocrit values. Conversely, the increase in Glut1 gene expression was suppressed and the reduction in MT‐CO2 gene expression was prevented in the trained Phd2 cKO mice. These data suggest that the 4‐week training regimen counteracted the suppression of oxidative metabolism in the skeletal muscle by the HIF signalling pathway.
Thus, the 4‐week running training regimen may have contributed to an improved oxygen utilization of the skeletal muscle in Phd2 cKO mice. From the reasons above, we suggest that a combination of adequate HIF activation (for oxygen availability) and valid running training (for oxygen utilization) is necessary to elicit a robust endurance training effect.
There was a mild improvement in the running time without training in both groups. Because the improvement was independent of genotypes, it is possible that this improvement in both genotypes was due to the growth of mice.
Interestingly, it has been reported that Chuvash polycythaemia (CP) patients can have haematocrit values over 60%, which is comparable to those of Phd2 cKO mice in this study. The patients’ exercise capacity, however, is reported to be lower compared with healthy controls, similar to Phd2 cKO mice without training (Formenti et al. 2010). They suggested that CP patients are limited in their exercise capacity because their muscles had limited oxygen utilization, even though they may have superior oxygen availability. Although there is no observation as to whether CP patients exhibit a higher adaptability to endurance training, an appropriate protocol of exercise may enhance their exercise capacity like in Phd2‐deficient mice, which needs to be cautiously investigated. The risk of high blood pressure or thromboembolism may be determined by the NO level, as well as the risk of altitude training or hypoxic training for athletes, which again needs to be carefully determined in further investigations.
In summary, we demonstrated the influence of the HIF pathway activated by PHD2 deficiency on running training without exposure to atmospheric hypoxia. As determined by the combination of marked phenotypes and exercise training, the Phd2‐deficient mice exhibited a significantly higher gain of running time. We conclude that the activation of the HIF pathway enhances the effects of endurance running training without exposure to atmospheric hypoxia.
Conflict of interest
There are no conflict of interests to declare.
We thank Dr. Norio Suzuki (United Centers for Advanced Research and Translational Medicine, Tohoku University Graduate School of Medicine), Dr. Yoji Andrew Minamishima (Department of Biochemistry, Keio University School of Medicine) and Dr. Mitsuharu Okutsu (Graduate School of Natural Sciences, Nagoya City University) for their technical advice and support and Dr. G.H. Fong (Center for Vascular Biology, Department of Cell Biology, University of Connecticut Health Center) for supplying Phd2‐floxed mice. This work was supported by a JSPS Grant‐in‐Aid for JSPS fellows (26‐3209) (A.N.).
A.N. and J.S. have contributed equally to this work.
See Editorial Commentary: D. R. Slivka. 2016. Skeletal muscle response to hypoxia. Acta Physiol (Oxf) 220, 9–10.
References
- Ackrell, B.A. 2002. Cytopathies involving mitochondrial complex II. Mol Aspects Med 23, 369–384. [DOI] [PubMed] [Google Scholar]
- Berra, E. , Benizri, E. , Ginouves, A. , Volmat, V. , Roux, D. & Pouyssegur, J. 2003. HIF prolyl‐hydroxylase 2 is the key oxygen sensor setting low steady‐state levels of HIF‐1alpha in normoxia. EMBO J 22, 4082–4090. [DOI] [PMC free article] [PubMed] [Google Scholar]
- Bertinieri, G. , Parati, G. , Ulian, L. , Santucciu, C. , Massaro, P. , Cosentini, R. , Torgano, G. , Morganti, A. & Mancia, G. 1998. Hemodilution reduces clinic and ambulatory blood pressure in polycythemic patients. Hypertension 31, 848–853. [DOI] [PubMed] [Google Scholar]
- Bunn, H.F. 2013. Erythropoietin. Cold Spring Harb Perspect Med 3, a011619. [DOI] [PMC free article] [PubMed] [Google Scholar]
- Epstein, A.C. , Gleadle, J.M. , McNeill, L.A. , Hewitson, K.S. , O'Rourke, J. , Mole, D.R. , Mukherji, M. , Metzen, E. , Wilson, M.I. , Dhanda, A. et al 2001. C. elegans EGL‐9 and mammalian homologs define a family of dioxygenases that regulate HIF by prolyl hydroxylation. Cell 107, 43–54. [DOI] [PubMed] [Google Scholar]
- Formenti, F. , Constantin‐Teodosiu, D. , Emmanuel, Y. , Cheeseman, J. , Dorrington, K.L. , Edwards, L.M. , Humphreys, S.M. , Lappin, T.R. , McMullin, M.F. , McNamara, C.J. et al 2010. Regulation of human metabolism by hypoxia‐inducible factor. Proc Natl Acad Sci U S A 107, 12722–12727. [DOI] [PMC free article] [PubMed] [Google Scholar]
- Forsythe, J.A. , Jiang, B.H. , Iyer, N.V. , Agani, F. , Leung, S.W. , Koos, R.D. & Semenza, G.L. 1996. Activation of vascular endothelial growth factor gene transcription by hypoxia‐inducible factor 1. Mol Cell Biol 16, 4604–4613. [DOI] [PMC free article] [PubMed] [Google Scholar]
- Hu, C.J. , Wang, L.Y. , Chodosh, L.A. , Keith, B. & Simon, M.C. 2003. Differential roles of hypoxia‐inducible factor 1alpha (HIF‐1alpha) and HIF‐2alpha in hypoxic gene regulation. Mol Cell Biol 23, 9361–9374. [DOI] [PMC free article] [PubMed] [Google Scholar]
- Ivan, M. , Kondo, K. , Yang, H. , Kim, W. , Valiando, J. , Ohh, M. , Salic, A. , Asara, J.M. , Lane, W.S. & Kaelin, W.G. Jr 2001. HIFalpha targeted for VHL‐mediated destruction by proline hydroxylation: implications for O2 sensing. Science 292, 464–468. [DOI] [PubMed] [Google Scholar]
- Jaakkola, P. , Mole, D.R. , Tian, Y.M. , Wilson, M.I. , Gielbert, J. , Gaskell, S.J. , von Kriegsheim, A. , Hebestreit, H.F. , Mukherji, M. , Schofield, C.J. , Maxwell, P.H. , Pugh, C.W. & Ratcliffe, P.J. 2001. Targeting of HIF‐alpha to the von Hippel‐Lindau ubiquitylation complex by O2‐regulated prolyl hydroxylation. Science 292, 468–472. [DOI] [PubMed] [Google Scholar]
- Jiang, B.H. , Rue, E. , Wang, G.L. , Roe, R. & Semenza, G.L. 1996. Dimerization, DNA binding, and transactivation properties of hypoxia‐inducible factor 1. J Biol Chem 271, 17771–17778. [DOI] [PubMed] [Google Scholar]
- Kaelin, W.G. 2005. Proline hydroxylation and gene expression. Annu Rev Biochem 74, 115–128. [DOI] [PubMed] [Google Scholar]
- Levine, B.D. & Stray‐Gundersen, J. 1997. “Living high‐training low”: effect of moderate‐altitude acclimatization with low‐altitude training on performance. J Appl Physiol 83, 102–112. [DOI] [PubMed] [Google Scholar]
- Lundby, C. , Gassmann, M. & Pilegaard, H. 2006. Regular endurance training reduces the exercise induced HIF‐1alpha and HIF‐2alpha mRNA expression in human skeletal muscle in normoxic conditions. Eur J Appl Physiol 96, 363–369. [DOI] [PubMed] [Google Scholar]
- Lundby, C. , Millet, G.P. , Calbet, J.A. , Bartsch, P. & Subudhi, A.W. 2012. Does ‘altitude training’ increase exercise performance in elite athletes? Br J Sports Med 46, 792–795. [DOI] [PubMed] [Google Scholar]
- Maltepe, E. , Schmidt, J.V. , Baunoch, D. , Bradfield, C.A. & Simon, M.C. 1997. Abnormal angiogenesis and responses to glucose and oxygen deprivation in mice lacking the protein ARNT. Nature 386, 403–407. [DOI] [PubMed] [Google Scholar]
- Mason, S.D. , Rundqvist, H. , Papandreou, I. , Duh, R. , McNulty, W.J. , Howlett, R.A. , Olfert, I.M. , Sundberg, C.J. , Denko, N.C. , Poellinger, L. & Johnson, R.S. 2007. HIF‐1alpha in endurance training: suppression of oxidative metabolism. Am J Physiol Regul Integr Comp Physiol 293, R2059–R2069. [DOI] [PubMed] [Google Scholar]
- Melillo, G. , Musso, T. , Sica, A. , Taylor, L.S. , Cox, G.W. & Varesio, L. 1995. A hypoxia‐responsive element mediates a novel pathway of activation of the inducible nitric oxide synthase promoter. J Exp Med 182, 1683–1693. [DOI] [PMC free article] [PubMed] [Google Scholar]
- Minamishima, Y.A. , Moslehi, J. , Bardeesy, N. , Cullen, D. , Bronson, R.T. & Kaelin, W.G. Jr 2008. Somatic inactivation of the PHD2 prolyl hydroxylase causes polycythemia and congestive heart failure. Blood 111, 3236–3244. [DOI] [PMC free article] [PubMed] [Google Scholar]
- Moslehi, J. , Minamishima, Y.A. , Shi, J. , Neuberg, D. , Charytan, D.M. , Padera, R.F. , Signoretti, S. , Liao, R. & Kaelin, W.G. Jr 2010. Loss of hypoxia‐inducible factor prolyl hydroxylase activity in cardiomyocytes phenocopies ischemic cardiomyopathy. Circulation 122, 1004–1016. [DOI] [PMC free article] [PubMed] [Google Scholar]
- Park, J.Y. , Wang, P.Y. , Matsumoto, T. , Sung, H.J. , Ma, W. , Choi, J.W. , Anderson, S.A. , Leary, S.C. , Balaban, R.S. , Kang, J.G. & Hwang, P.M. 2009. p53 improves aerobic exercise capacity and augments skeletal muscle mitochondrial DNA content. Circ Res 105, 705–712, 11 p following 712. [DOI] [PMC free article] [PubMed] [Google Scholar]
- Ruschitzka, F.T. , Wenger, R.H. , Stallmach, T. , Quaschning, T. , de Wit, C. , Wagner, K. , Labugger, R. , Kelm, M. , Noll, G. , Rulicke, T. et al 2000. Nitric oxide prevents cardiovascular disease and determines survival in polyglobulic mice overexpressing erythropoietin. Proc Natl Acad Sci U S A 97, 11609–11613. [DOI] [PMC free article] [PubMed] [Google Scholar]
- Semenza, G.L. 2002. HIF‐1 and tumor progression: pathophysiology and therapeutics. Trends Mol Med 8, S62–S67. [DOI] [PubMed] [Google Scholar]
- Semenza, G.L. , Nejfelt, M.K. , Chi, S.M. & Antonarakis, S.E. 1991. Hypoxia‐inducible nuclear factors bind to an enhancer element located 3′ to the human erythropoietin gene. Proc Natl Acad Sci U S A 88, 5680–5684. [DOI] [PMC free article] [PubMed] [Google Scholar]
- Semenza, G.L. , Roth, P.H. , Fang, H.M. & Wang, G.L. 1994. Transcriptional regulation of genes encoding glycolytic enzymes by hypoxia‐inducible factor 1. J Biol Chem 269, 23757–23763. [PubMed] [Google Scholar]
- Shin, J. , Nunomiya, A. , Kitajima, Y. , Dan, T. , Miyata, T. & Nagatomi, R. 2015. Prolyl hydroxylase domain 2 deficiency promotes skeletal muscle fiber‐type transition via a calcineurin/NFATc1‐dependent pathway. Skelet Muscle 6, 5. [DOI] [PMC free article] [PubMed] [Google Scholar]
- Takeda, K. , Ho, V.C. , Takeda, H. , Duan, L.J. , Nagy, A. & Fong, G.H. 2006. Placental but not heart defects are associated with elevated hypoxia‐inducible factor alpha levels in mice lacking prolyl hydroxylase domain protein 2. Mol Cell Biol 26, 8336–8346. [DOI] [PMC free article] [PubMed] [Google Scholar]
- Takeda, K. , Cowan, A. & Fong, G.H. 2007. Essential role for prolyl hydroxylase domain protein 2 in oxygen homeostasis of the adult vascular system. Circulation 116, 774–781. [DOI] [PubMed] [Google Scholar]
- Takeda, K. , Aguila, H.L. , Parikh, N.S. , Li, X. , Lamothe, K. , Duan, L.J. , Takeda, H. , Lee, F.S. & Fong, G.H. 2008. Regulation of adult erythropoiesis by prolyl hydroxylase domain proteins. Blood 111, 3229–3235. [DOI] [PMC free article] [PubMed] [Google Scholar]
- Takeda, K. , Duan, L.J. , Takeda, H. & Fong, G.H. 2014. Improved vascular survival and growth in the mouse model of hindlimb ischemia by a remote signaling mechanism. Am J Pathol 184, 686–696. [DOI] [PMC free article] [PubMed] [Google Scholar]
- Tanji, K. & Bonilla, E. 2008. Light microscopic methods to visualize mitochondria on tissue sections. Methods 46, 274–280. [DOI] [PubMed] [Google Scholar]
- Vogel, J. , Kiessling, I. , Heinicke, K. , Stallmach, T. , Ossent, P. , Vogel, O. , Aulmann, M. , Frietsch, T. , Schmid‐Schonbein, H. , Kuschinsky, W. & Gassmann, M. 2003. Transgenic mice overexpressing erythropoietin adapt to excessive erythrocytosis by regulating blood viscosity. Blood 102, 2278–2284. [DOI] [PubMed] [Google Scholar]
- Wang, G.L. & Semenza, G.L. 1993. Characterization of hypoxia‐inducible factor 1 and regulation of DNA binding activity by hypoxia. J Biol Chem 268, 21513–21518. [PubMed] [Google Scholar]
- Wang, G.L. , Jiang, B.H. , Rue, E.A. & Semenza, G.L. 1995. Hypoxia‐inducible factor 1 is a basic‐helix‐loop‐helix‐PAS heterodimer regulated by cellular O2 tension. Proc Natl Acad Sci U S A 92, 5510–5514. [DOI] [PMC free article] [PubMed] [Google Scholar]
- Wenger, R.H. 2002. Cellular adaptation to hypoxia: O2‐sensing protein hydroxylases, hypoxia‐inducible transcription factors, and O2‐regulated gene expression. FASEB J 16, 1151–1162. [DOI] [PubMed] [Google Scholar]
- Wennmalm, A. , Benthin, G. & Petersson, A.S. 1992. Dependence of the metabolism of nitric oxide (NO) in healthy human whole blood on the oxygenation of its red cell haemoglobin. Br J Pharmacol 106, 507–508. [DOI] [PMC free article] [PubMed] [Google Scholar]
- Wisloff, U. , Najjar, S.M. , Ellingsen, O. , Haram, P.M. , Swoap, S. , Al‐Share, Q. , Fernstrom, M. , Rezaei, K. , Lee, S.J. , Koch, L.G. & Britton, S.L. 2005. Cardiovascular risk factors emerge after artificial selection for low aerobic capacity. Science 307, 418–420. [DOI] [PubMed] [Google Scholar]
- Zhang, Y. , Wang, L. , Dey, S. , Alnaeeli, M. , Suresh, S. , Rogers, H. , Teng, R. & Noguchi, C.T. 2014. Erythropoietin action in stress response, tissue maintenance and metabolism. Int J Mol Sci 15, 10296–10333. [DOI] [PMC free article] [PubMed] [Google Scholar]