Abstract
Background. Scleral biomechanical properties may be important in the pathogenesis and progression of glaucoma. The goal of this study is to develop and validate an ultrasound method for measuring cross-sectional distributive strains in the sclera during elevations of intraocular pressure (IOP). Method of Approach. Porcine globes (n = 5) were tested within 24 hs postmortem. The posterior scleral shells were dissected and mounted onto a custom-built pressurization chamber. A high-frequency (55-MHz) ultrasound system (Vevo660, VisualSonics Inc., Toronto) was employed to acquire the radio frequency data during scans of the posterior pole along both circumferential and meridian directions. The IOP was gradually increased from 5 to 45 mmHg. The displacement fields were obtained from correlation-based ultrasound speckle tracking. A least-square strain estimator was used to calculate the strains in both axial and lateral directions. Experimental validation was performed by comparing tissue displacements calculated from ultrasound speckle tracking with those induced by an actuator. Theoretical analysis and simulation experiments were performed to optimize the ultrasound speckle tracking method and evaluate the accuracy and signal-to-noise ratio (SNR) in strain estimation. Results. Porcine sclera exhibited significantly larger axial strains (e.g., −5.1 ± 1.5% at 45 mmHg, meridian direction) than lateral strains (e.g., 2.2 ± 0.7% at 45 mmHg, meridian direction) during IOP elevations (P’s < 0.01). The strain magnitudes increased nonlinearly with pressure increase. The strain maps displayed heterogeneity through the thickness. The lateral strains were significantly smaller in the circumferential direction than the meridian direction at 45 mmHg (P < 0.05). Experimental validation showed that the ultrasound speckle tracking method was capable of tracking displacements at the accuracy of sub-micron to micron. Theoretical analysis predicted the dependence of the strain estimation SNR on the strain level, as well as signal processing parameters such as kernel size. Simulation results showed that ultrasound speckle tracking had a high accuracy for estimating strains of 1–5% and a high SNR for strains of 0.5–5%. Conclusions. A new experimental method based on ultrasound speckle tracking has been developed for obtaining cross-sectional strain maps of the posterior sclera. This method provides a useful tool to examine distributive strains through the thickness of the sclera during elevations of IOP.
Keywords: scleral mechanics, ultrasound speckle tracking, strain imaging, porcine sclera
1. Introduction
Characterization of scleral biomechanical properties is important for understanding prevalent ocular diseases such as glaucoma. Glaucomatous optic neuropathy is considered the world's second leading cause of blindness [1]. The optic nerve head (ONH) is the principal site of damage in glaucomatous vision loss. The mechanical environment of the ONH is believed to be critical for retinal ganglion cell pathophysiology [2]. Recent computational models have shown that scleral mechanical properties may play an important role in affecting the mechanical environment of the ONH [3,4]. It has also been proposed that changes in sclera mechanical properties are implicated in myopia progression [5]. For example, scleral thinning and weakening have been reported in the early development of myopia in tree shrew eyes [6]. Increased scleral creep has also been reported in mammalian eyes developing myopia, particularly at the posterior pole of the eye [7,8]. The understanding of scleral mechanical properties and their alterations may provide insight into the potential association between glaucoma and myopia [9].
The sclera is the major load-bearing tissue in the eye and consists primarily of collagen fibers, more than 90% of which are Type I [10]. Sclera mechanical properties have been characterized on dissected tissue specimens using uniaxial [11–16] or biaxial mechanical tests [17]. These studies have demonstrated that the mechanical behavior of the sclera is typically nonlinear, visco-elastic and anisotropic. Compression tests on scleral strips offered additional information of scleral biomechanics and revealed a much lower compressive modulus than tensile modulus [18,19]. Inflation tests have been used to investigate the mechanical behavior of the intact sclera under intraocular pressure loadings [20–24]. Surface optical tracking in combination with inverse finite element modeling has been used to measure scleral surface strains and reconstruct the mechanical properties [25,26]. Digital image correlation was recently used to measure the response of sclera surface under inflation [22,23]. The inflation tests and surface strain measurements have provided a delineation of sclera surface response under intraocular pressure (IOP) elevation. However, to our best knowledge, the distributive and average strains throughout the thickness of the sclera during intraocular pressure elevation have not been reported. These data may provide further insights into the mechanical responses of the sclera in vivo, particularly those of the posterior sclera that are likely involved in the disease processes of glaucoma and myopia.
Ultrasonic strain mapping (i.e., ultrasound elastography) has been developed to measure the distributive displacements and strains of soft tissue in response to internal or external loading [27,28]. This method has been primarily used to image pathologies in soft tissues including breast [29], heart [30], blood vessels [31], liver [32], kidney [33] and prostate [29,33,34], based on the fact that diseased tissue usually has altered stiffness. Ultrasound strain mapping is achieved using speckle tracking techniques applied to ultrasound signals acquired at both undeformed and deformed states. Ultrasound speckle tracking estimates tissue displacements using either cross correlation algorithms [27,28], sum of absolute differences [35], or optic flow methods [36]. The strain is calculated as the spatial gradient of the displacement field [37]. Tissue deformation is typically induced by quasi-static compression [27,28] or dynamic vibration [38,39].
The signal-to-noise ratio (SNR) of ultrasound elastography has been extensively studied in the past [40–44]. It has been shown that the strain image SNR is dependent on the strain levels, system characteristics (e.g., transducer center frequency and bandwidth), as well as signal processing parameters (e.g., kernel size) [41,44].
Previous work has demonstrated the feasibility of using high frequency ultrasound [45] and optical coherence tomography [46] for corneal strain mapping. In this study, we report a speckle tracking method based on high frequency ultrasound radio frequency data analysis to achieve cross-sectional strain mapping in the sclera during elevations of IOP. Porcine sclera was used and the accuracy and signal-to-noise ratio (SNR) of the strain estimation were evaluated both theoretically and experimentally.
2. Methods
2.1. Experimental Setup and Testing Protocol.
Five porcine globes were obtained from a slaughterhouse within 24 hs postmortem. The samples were stored in phosphate buffered saline (PBS) solution at 4 °C prior to experiments. The posterior scleral shells were dissected at about 2 mm posterior to the limbus and the vitreous, retina, and choroid were carefully removed. The sclera shells were mounted onto a custom-built pressurization chamber and the IOP was controlled by a saline column and confirmed by using a pressure sensor (Fig. 1). The sclera was clamped on a custom-built chamber with two O-rings that sandwiched the sclera in between. Plastic screws were used to tighten the O-rings. The chamber was clamped to a metal ring mount to prevent undesired rotation or other motion, and the chamber with the ring mount was placed in a saline bath. The posterior pole, i.e., the intersection of the optical axis and the sclera, was ensured to situate at the apex of the sclera mount. The ultrasound scans were taken from the posterior pole region in the temporal quadrant adjacent to the optic nerve head.
Fig. 1.
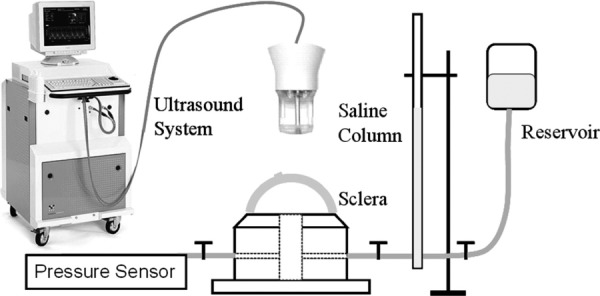
Schematics for sclera shell mounting and ultrasonic measurements
A high-frequency ultrasound system (Vevo660, VisualSonics Inc., Toronto) with a 55-MHz transducer was employed to perform cross-sectional scanning at the posterior pole and the raw radio frequency (RF) ultrasound signals were sampled by a digitizer (500 MHz, DP105; Acqiris, Monroe, NY). Before measurements, each scleral shell was subject to preconditioning consisting of five cycles of pressurization from 5 to 45 mmHg in 60 seconds, and the pressure was resumed to 5 mmHg for 360 seconds. IOP was then gradually increased from 5 to 45 mmHg at steps of 5 mmHg, with 360 seconds for equilibration prior to the acquisition of the RF signals at each step (Fig. 2(a)). Ultrasound scans at two different directions were performed: one tangential to the ONH (the circumferential direction) and the other perpendicular to the first (the meridian direction), as shown in Fig. 2(b).
Fig. 2.
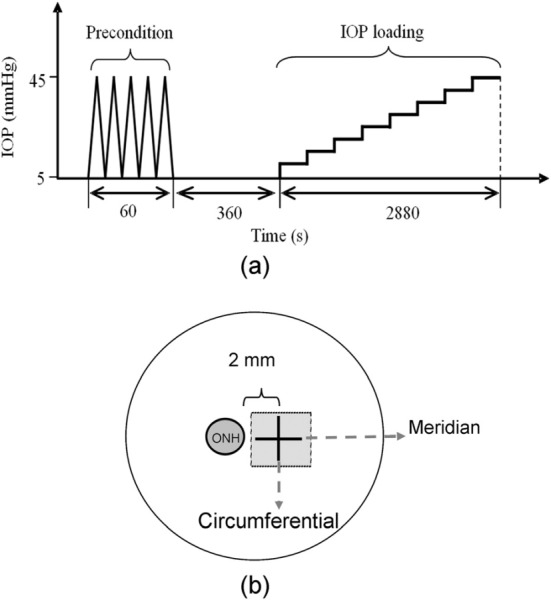
(a) The experimental protocol of preconditioning and IOP loading; (b) the scanning orientations for ultrasound data acquisition. The circumferential cross-section was about 2 mm from the ONH.
2.2. Ultrasound Speckle Tracking Algorithm.
The ultra-sound RF signals were first filtered using a band-pass filter with a bandwidth of 100 MHz centered at 55 MHz to remove noise. A correlation-based speckle tracking algorithm [47], which has been widely used in the ultrasound elastography field, was applied to the RF signals obtained at two consecutive pressure levels. Briefly, a kernel in the original signal A centered at (i0, j0) was compared with a series of kernels in the deformed signal B near the neighborhood of the original kernel. The correlation coefficient between the original kernel in signal A and the kernel in signal B centered at (i0 + l, j0 + m) is calculated as follows:
| (1) |
where a and b are the values in signal A and B, and the ā and are the average values of the corresponding kernels. The size of the kernel was (M + 1) × (N + 1) data points, corresponding to a region of (M + 1) × (N + 1) pixels in the ultrasound image.
The correlation coefficients were calculated for a search region around (i0, j0) in signal B by varying l and m, and interpolated using a spline function to achieve sub-pixel tracking. The location with the largest correlation coefficient magnitude was used to determine the displacement vector. The displacement fields were accumulated from 5 mmHg to 45 mmHg. A least-square strain estimator was used to calculate the strains in both the axial (along the ultrasound beam) and lateral (perpendicular to ultrasound beam) directions [37]. Although these two directions were selected in the present study, strains along any arbitrary direction could be obtained from the displacement field. Average strains along the axial and lateral directions were obtained within a region of interest at the posterior pole (about 2 mm wide and 1 mm thick). The strains at the two scanning orientations (i.e., circumferential and meridian) were compared. The strain fields were smoothed for plotting the strain images following the typical procedures used in the ultrasound elastography field [28,47].
2.3. Experimental Validation of Displacement Measurement.
The accuracy of the ultrasound speckle tracking method in calculating tissue displacements was evaluated experimentally by comparing the calculated displacements with known displacements induced by a motorized actuator (TRA25CC, Newport Corporation, Irvine, CA) [46]. The actuator has a resolution of 0.2 μm and an accuracy of ±5 μm for the travel distance of 20 mm. A porcine sclera shell was mounted onto the pressurization chamber as in Fig. 1 and the chamber was clamped to a metal ring mount and immersed in a saline bath placed on a positioning stage. The transducer was displaced first laterally and then axially by 100 μm at steps of 10 μm using the actuator to introduce controlled rigid-body displacement between the transducer and the sclera. The alignment of the transducer movement with respect to the ultrasound beam was ensured by careful visual inspection. In an additional experiment, two ultrasound scans were acquired consecutively on the same sample without any displacement.
Ultrasound RF data was acquired at each step and the ultrasound speckle tracking algorithm was used to calculate the displacement field. The average displacement within the region of interest was compared with the mechanical displacement induced by the actuator. The standard deviation of the displacement within the region of interest was calculated to evaluate the uncertainty in displacement measurement.
2.4. Theoretical Analysis of the Signal-to-Noise Ratio in Ultrasound Strain Mapping.
Previous studies have shown that the primary sources of noise in strain estimation based on ultra-sound speckle tracking are: the electronic and quantization noise, which is present in ultrasonic scanning and data acquisition; and the decorrelation noise, which results from the distortion of the speckles during tissue deformation [41]. The performance of ultrasound speckle tracking in strain estimation is typically evaluated by the signal-to-noise ratio of the strain image (SNRe) [40,41,44,48], which is defined as the ratio between the true strain and the overall noise/variance.
Conceptually, the actual strain level would affect the SNRe because very small true strains are likely less distinguishable from electronic noise while very large strains tend to distort the ultrasound speckles and deteriorate the correlation for speckle tracking. Therefore, for a given ultrasound system with a given data processing scheme, there typically exists an optimal intermediate range of strains that can be accurately measured by speckle tracking.
The concept of “strain filter” has been used to determine the theoretical bound of SNRe at different levels of strain, which corresponds to the tightest bound of noise in strain estimation [42]. This bound consists of several segments as described in Eq. (2), integrating the Cramér-Rao lower bound and the Barankin bound into the Ziv-Zakai lower bound . From Eq. (2), it can be seen that is determined by when the post-integration signal to noise ratio (i.e., B·T·SNRc) is large, and by when the post-integration signal to noise ratio is moderate [42]:
| (2) |
where SNRc is the combination of the sonographic signal-to-noise ratio (SNRs) associated with electronic noise and the correlation signal-to-noise ratio (SNRρ) associated with deformation-related decorrelation noise as defined in Eq. (3), B is the absolute bandwidth of the ultrasound system, T is the temporal length of the kernel, s is the mean value of the estimated strain, ΔT is the temporal separation between adjacent kernels, and Threshold1 and Threshold2 are exponential transitions between the segments [48].
| (3) |
and can be calculated using Eqs. (4) and (5).
| (4) |
| (5) |
where f0 is the center frequency of the ultrasound transducer and ρ is the correlation coefficient determined by tissue stretch ratio, ultrasound frequency, pulse width and correlation kernel size [43]. The parameters , , μ and are defined as follows [48]:
| (6) |
| (7) |
| (8) |
| (9) |
where is the inverse of and is the larger value of solutions for .
In the present study, the center frequency f0 of the transducer was 55 MHz. The relative bandwidth of the transducer was 100% and thus, B is 55 MHz. Several different temporal kernel lengths (i.e., T) which corresponded to 50, 100, 150, or 200 μm kernels, were investigated in order to identify the optimal T. A 50% kernel overlap (ΔT = T/2) was adopted to achieve the best trade-off between SNRe and spatial resolution of the strain map [40].
2.5. Analysis of Strain Estimation Accuracy Using Simulated RF Data.
The accuracy of the ultrasound speckle tracking algorithm in estimating scleral strains was evaluated using simulated ultrasound RF data where arbitrary patterns of strain were introduced in the “deformed” signal. The original RF data of a scleral cross-section were generated using the Field II Ultrasound Simulation Program [49,50] with a customized MATLAB sub-routine. The simulation program convolves the point spread function (PSF) of the ultrasound transducer used in this study with a 3D cloud of randomly distributed scatterers that simulate the sclera. Forty scatterers per resolution cell was used in order to simulate Rayleigh scattering [51] and form fully developed speckles [44] as seen in the ultrasound images of the sclera. Random noise that corresponds to a SNRs of 38-dB was added to the RF data to simulate electronic noise in the ultrasound system (this level of SNRs was typically observed in our experiments). The scatterers were then displaced to simulate uniform axial and lateral compression or extension at strain levels ranging from 0.1% to 15%. The “deformed” scatterer cloud was then convolved with the transducer point spread function to generate the “deformed” ultrasound RF signals using the simulation program. The “undeformed” and the “deformed” RF data were processed by the speckle tracking algorithm to calculate the displacement fields and corresponding strain images. The calculated average strains were compared with the predefined “true” strains induced in the scatterers.
In another simulation, the scatterers were divided into two equal-sized layers with the top layer subject to 1% uniform axial compression and lateral extension, while the bottom layer subject to 2% axial compression and lateral extension. The strain images were computed to examine how well the speckle tracking algorithm could differentiate the different strains in these two layers.
In a third simulation, the scatterers were divided into three regions (layers or zones, as defined below). In the first scenario, the scatterers were divided into three layers with the top and bottom layers subject to 1% uniform axial and lateral compression or extension, while the middle layer subject to 2% axial and lateral compression or extension. The total thickness of the three layers was 1 mm and the top and bottom layers had the same thickness. The middle layer was assigned with an increasingly smaller thickness (500 μm, 250 μm, 100 μm, and 50 μm) to evaluate the capability of the ultrasound speckle tracking algorithm in detecting small heterogeneities along the axial direction. In the second scenario, the scatterers were divided into three zones with the left and right zones subject to 1% uniform axial and lateral compression or extension, while the middle zone subject to 2% axial and lateral compression or lateral extension. The total width of the three zones was 4 mm and the left and right zones had the same width. The middle zone was assigned with an increasingly smaller width (2 mm, 1 mm, 400 μm, and 200 μm) to evaluate the capability of the ultrasound speckle tracking algorithm in detecting small heterogeneities along the lateral direction. The average calculated strains within the inhomogeneous regions were obtained as an indication of the accuracy and sensitivity of the ultrasound speckle tracking algorithm for detecting small inhomogeneous areas in a simulated sclera.
3. Results
3.1. Through-Thickness Strain Distribution in Porcine Posterior Sclera.
A cross-sectional ultrasound image of the posterior pole of a porcine sclera is presented in Fig. 3(a), showing the typical ultrasonic appearance of the sclera with bright and evenly distributed speckles. The boundaries of the sclera (the interior and exterior surfaces) were readily discernible.
Fig. 3.
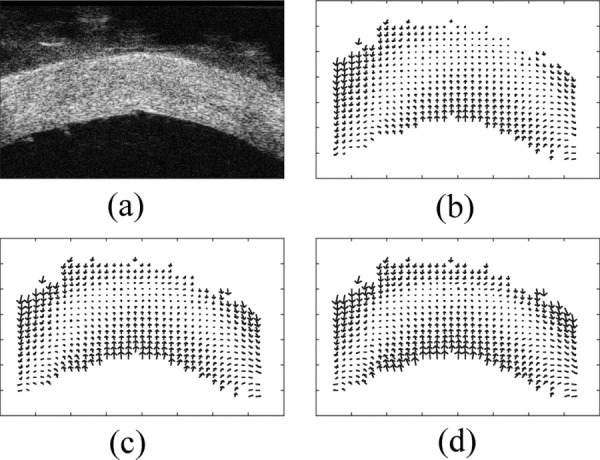
Displacement vector fields in a posterior porcine sclera obtained from ultrasound speckle tracking. (a) A cross-sectional ultrasound image of the sclera at 5 mmHg; (b) displacement field at 15 mmHg; (c) displacement field at 30 mmHg; (d) displacement field at 45 mmHg
The displacement fields relative to the average displacement of the entire the sclera at pressure elevations from 5 to 15, 30, and 45 mmHg are shown in Figs. 3(b), 3(c), and 3(d), respectively. The displacement fields showed a clear trend of compression along the axial direction and extension along the lateral direction. The corresponding strain images are presented in Fig. 4. In the present study, the spatial resolution of the strain images (defined as the distance between two adjacent kernels used in the ultrasound speckle tracking algorithm) was 75 μm (axial) by 100 μm (lateral).
Fig. 4.
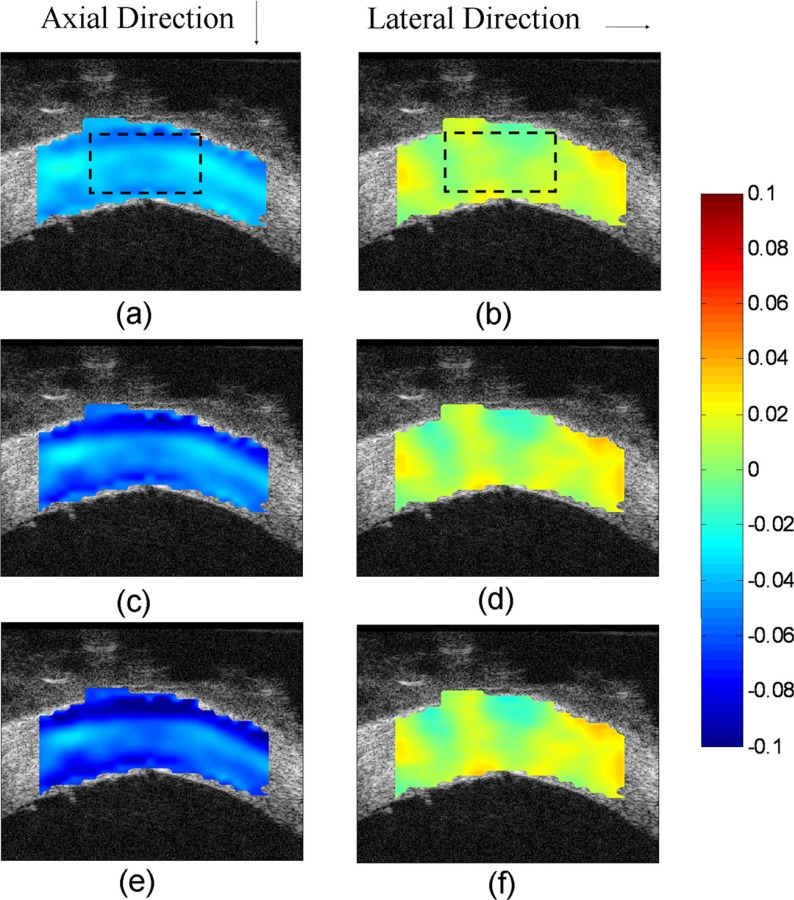
Strain images of porcine sclera: (a) axial strain at 15 mmHg (dashed rectangle indicates the region of interest at posterior pole); (b) lateral strain at 15 mmHg; (c) axial strain at 30 mmHg; (d) lateral strain at 30 mmHg; (e) axial strain at 45 mmHg; (f) lateral strain at 45 mmHg
The average axial and lateral strains within the region of interest were calculated at all pressure levels for the measured porcine sclera (Table 1). Figure 5 shows the average strains along the circumferential and the meridian directions. The average axial strains were greater in magnitude than the average lateral strains in both directions at all pressure levels (P's < 0.01). In general, the circumferential axial strains were greater than the meridian axial strains, while the circumferential lateral strains were smaller than the meridian lateral strains. At 45 mmHg, the circumferential lateral strains were significantly smaller than the meridian lateral strains (1.2 ± 0.6% versus 2.2 ± 0.7%, P < 0.05). No significant difference was found at other pressure levels.
Table 1.
Average scleral strains at different pressure levels
| Strain | 15 mmHg | 25 mmHg | 35 mmHg | 45 mmHg | |
|---|---|---|---|---|---|
| Axial a | Meridian | −2.4 ± 0.8% | −3.4 ± 1.2% | −4.2 ± 1.2% | −5.1 ± 1.5% |
| Circum | −3.1 ± 1.6% | 4.1 ± 1.8% | 5.0 ± 1.9% | −5.9 ± 2.2% | |
| Lateral a | Meridian | 1.4 ± 0.6% | 1.8 ± 0.7% | 2.1 ± 0.6% | 2.2 ± 0.7% b |
| Circum | 1.1 ± 0.5% | 1.1 ± 0.5% | 1.2 ± 0.6% | 1.2 ± 0.6% b |
The axial strains were significantly greater than the lateral strains at all pressure levels, P < 0.01.
For lateral strains, the circumferential was significantly smaller than the meridian at 45 mmHg, P < 0.05.
Fig. 5.
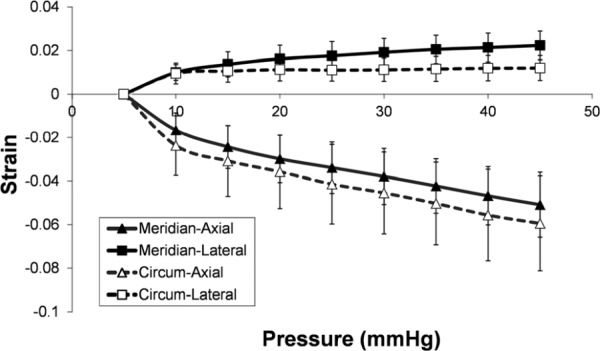
Average scleral strains at different pressure levels
3.2. Experimental Validation of Displacement Measurement.
The comparison between the actuator output and the calculated displacement is presented in Fig. 6. At an actuator output of 10 μm, the average displacements calculated from speckle tracking was 10.9 ± 0.4 μm (axial) and 9.4 ± 2.2 μm (lateral), respectively. At an actuator output of 100 μm, the calculated displacements were 102.8 ± 0.4 μm (axial) and 105.5 ± 1.7 μm (lateral), respectively. The standard deviation of the calculated displacement was consistent across different actuator output, i.e., below 1 μm for the axial direction and about 2 μm for the lateral direction.
Fig. 6.
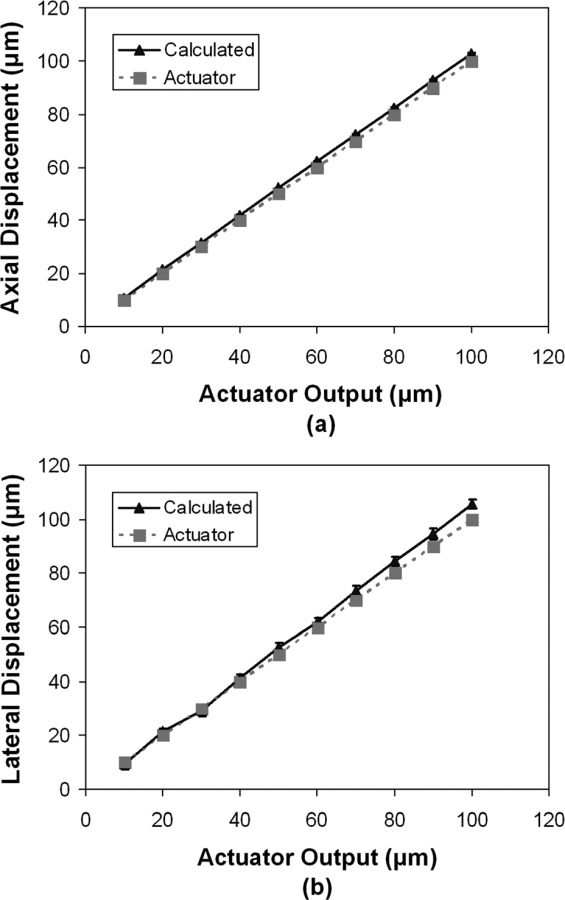
Comparison of the displacements calculated from speckle tracking and the actuator output: (a) calculated axial displacement versus motor output; (b) calculated lateral displacement versus motor output
In the experiment of acquiring two consecutive images on the same sclera without moving the sample or introducing deformation, the average displacement calculated from speckle tracking was −0.42 ± 0.25 μm (axial) and 0.65 ± 0.92 μm (lateral). Further calculations of the strains showed an average axial strain of (−0.008 ± 0.020)% and an average lateral strain of (−0.001 ± 0.080)%. These results suggested that the ultrasound speckle tracking algorithm was robust to random environmental noise.
3.3. Theoretical Analysis of the SNR in Strain Estimation.
The SNRe bounds as a function of strain (i.e., the strain filters) corresponding to different kernel sizes (50–200 μm) are presented in Fig. 7.
Fig. 7.
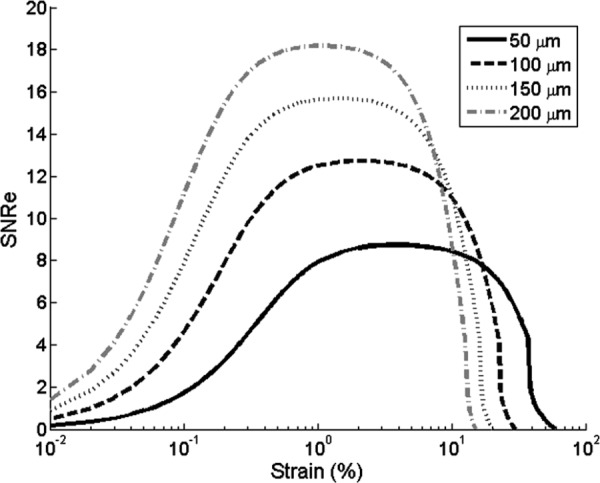
SNRe versus strain for different kernel sizes
The peak SNRe and the −3 dB range of the strain filter (i.e., the range of strains corresponding to an SNRe that is greater than 70% of the peak value) is presented in Table 2. With an increased kernel size, the peak SNRe increases while the −3 dB range shifts to the lower strain levels. This means that a larger kernel size gives higher SNRe in measuring small strains, at the cost of a decreased spatial resolution of the strain images and compromised performance at large strains.
Table 2.
The peak SNRe and the −3 dB range of the SNRe for different kernel sizes
| Kernel size | Peak SNRe | Low cutoff strain | High cutoff strain | |
|---|---|---|---|---|
| 50 μm | 8.73 | 0.49% | 28% | |
| 100 μm | 12.74 | 0.26% | 15% | |
| 150 μm | 15.71 | 0.17% | 10% | |
| 200 μm | 18.19 | 0.13% | 7.5% | |
3.4. Analysis of Strain Estimation Accuracy Using Simulated Data.
Figure 8 shows a simulated image of the sclera with typical ultrasonic scattering patterns. The comparison between the calculated strains and the simulated strains are presented in Table 3. For axial strains, the % error (|simulated strain – calculated strain|/simulated strain) was smaller than 3% for all strain levels between 0.1 to 5%. For lateral strains between 1 to 5%, the % error was smaller than 5%. For lateral strains between 0.1 to 0.75%, the % error was 16–40%. For strains larger than 5%, the % error was larger than 15% for both axial and lateral directions.
Fig. 8.
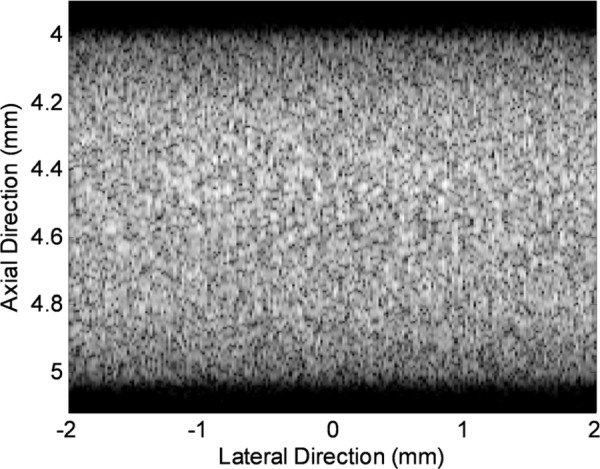
A simulated ultrasound image of the sclera using the Field II Ultrasound Simulation Program
Table 3.
Simulated vs. calculated strains under uniform compression or extension
|
Compression (Calculated) |
Extension (Calculated) |
|||
|---|---|---|---|---|
| Simulated | ||||
| Strain | Axial | Lateral | Axial | Lateral |
| 0.1% | 0.10 ± 0.05% | 0.07 ± 0.09% | 0.10 ± 0.05% | 0.06 ± 0.08% |
| 0.5% | 0.49 ± 0.07% | 0.37 ± 0.16% | 0.48 ± 0.09% | 0.35 ± 0.12% |
| 1% | 0.99 ± 0.09% | 1.0 ± 0.40% | 0.97 ± 0.10% | 0.94 ± 0.32% |
| 2% | 2.0 ± 0.14% | 2.1 ± 0.7% | 2.0 ± 0.14% | 2.1 ± 0.69% |
| 5% | 4.9 ± 0.44% | 5.0 ± 1.1% | 4.9 ± 0.40% | 5.0 ± 1.0% |
Integrating the results at different levels of strains, an SNRe curve was approximated by dividing the mean strain (signal) by the standard deviation of the strain (noise). The SNRe curves (Fig. 9) resembled the theoretical analysis (Fig. 7) showing the pattern of a low SNRe at very small or very large strains and a plateau region with a high SNRe for the intermediate range of strains. The SNRe curves were comparable between the two types of loading (e.g., compression versus extension). For both loading types, the axial direction had a much higher SNRe than the lateral direction.
Fig. 9.
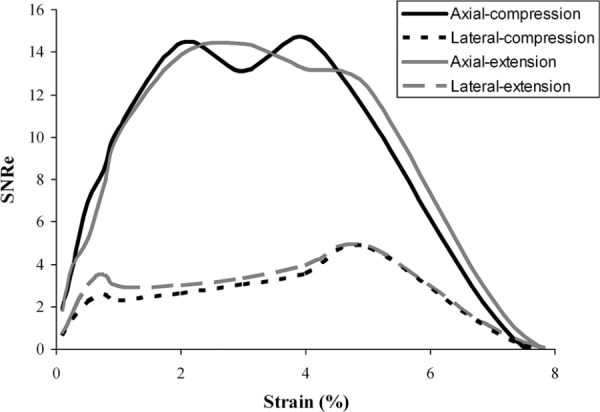
The approximated SNRe curves of the strain maps based on simulated data
Figure 10 shows the calculated displacement field and strain images from the simulation with 1% axial compression and lateral extension of the top layer and 2% axial compression and lateral extension of the bottom layer. The ultrasound speckle tracking algorithm could clearly differentiate the strains in these two layers.
Fig. 10.
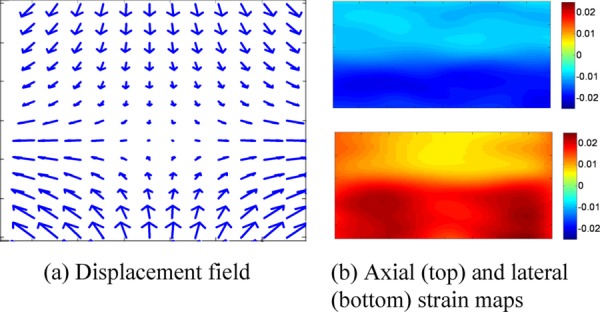
Displacement vector field and strain maps calculated from simulated RF signals for top 1% and bottom 2% strains
Table 4 summarizes the simulation results of the average calculated strains of a small inhomogeneity that has larger strains (2%) than the surrounding background (1% strain) in a simulated sclera. The strain maps are shown in Fig. 11. For axial strains, the % error of the strain estimation for the inhomogeneous area was lower than 20% for a layer thicker than 150 μm or a zone larger than 400 μm; and the % error of the strain estimation for the background was lower than 5%. For lateral strains, the % error of the strain estimation for the inhomogeneous area was lower than 25% for a layer thicker than 150 μm or a zone larger than 1 mm; however, the % error of the strain estimation for the background was typically higher (i.e., 10–15%). Figure 11 shows visually clear contrast of the inhomogeneous area in the axial strain maps.
Table 4.
Calculated strains for small heterogeneities (2% simulated strain) of various sizes surrounded by a background with 1% simulated strain
|
|
Compression |
Extension |
||||
|---|---|---|---|---|---|---|
| Type of heterogeneities | Size | axial | lateral | axial | lateral | |
| Axial Layers | 500 μm | −1.90% | −1.93% | 1.95% | 1.92% | |
| 250 μm | −1.68% | −1.90% | 1.71% | 1.91% | ||
| 150 μm | −1.64% | −1.74% | 1.69% | 1. 80% | ||
| 50 μm | −1.25% | −1.39% | 1.24% | 1.37% | ||
| Lateral Zones | 2 mm | −1.94% | −1.98% | 1.98% | 2.03% | |
| 1 mm | −1.82% | −1.55% | 1.88% | 1.56% | ||
| 400 μm | −1.62% | −1.07% | 1.65% | 1.08% | ||
| 200 μm | −1.37% | −0.75% | 1.37% | 0.79% | ||
Fig. 11.
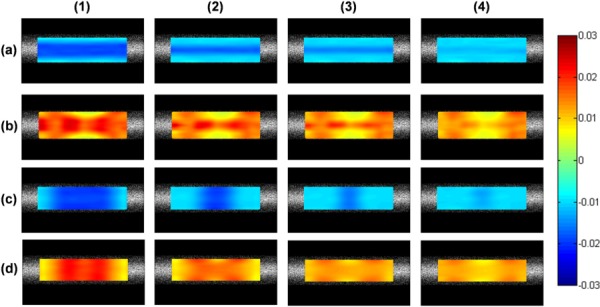
Strain images of a simulated sclera with an inhomogeneous region. Row (a) and (b) are axial and lateral strains, respectively, for an inhomogeneous layer with decreasing thickness: (1) 500 μm, (2) 250 μm, (3) 150 μm, and (4) 50 μm; Row (c) and (d) are axial strains and lateral strains, respectively, for an inhomogeneous zone with decreasing width: (1) 2 mm, (2) 1 mm, (3) 400 μm, and (4) 200 μm.
4. Discussion
In this study, we developed a new experimental method based on ultrasound speckle tracking to obtain cross-sectional strain maps of the posterior sclera during elevations of intraocular pressure. Theoretical analysis, simulation, and experimental validations were performed to examine the accuracy and the signal-to-noise ratio of this method for strain estimation.
The strain maps from the porcine sclera (Fig. 4) during IOP elevation from 5 to 45 mmHg showed negative axial strains and positive lateral strains. On average, the axial and lateral strains increased nonlinearly with the pressure increase (Fig. 5), which was consistent with the results in a previous study that reported nonlinear surface strains in porcine sclera [25].
Our results showed that the axial strains were on average more than twice as large as the lateral strains. For the area within the region of interest shown in Fig. 4, the axial and lateral directions were approximately corresponding to the radial and tangential directions. The results suggested that there was significant compression of the sclera during pressure elevation. Previous studies have reported a much smaller compressive modulus than tensile modulus in human and porcine sclera [18,19]. The large magnitude of the compressive strains suggested that compression, although not the primary form of mechanical loading in sclera, may warrant further study in understanding scleral mechanobiology. It is also of interest to note that the axial/compressive strains were typically heterogeneous through the thickness of the measured porcine sclera, where larger strains were found in the outer and inner layers and smaller strains were found in the middle layer of the sclera. Previous studies have reported different collagen bundle size and arrangement in the inner, middle, and outer layers of the sclera [10,52]. Scleral collagen bundles vary in size from the inner to outer layers with more narrower and thinner bundles in the outer layer [52]. In the innermost layer adjacent to the uvea, the collagen bundles are again smaller and blend into the underlying choroidal stroma [10]. These microstructural differences might be responsible for the observed heterogeneous strains. Conversely, the larger compression at the inner and outer layers might be associated with the poroelastic properties of the sclera (i.e., fluid being displaced out from the surfaces of the sclera during IOP elevation). Poroelasticity has been frequently observed in other soft tissues such as articular cartilage [53], ligament, and tendon [54]. The heterogeneity of the through-thickness compression was consistently found in most of the porcine sclera we have tested and also in human sclera (data not shown), suggesting a need to further elucidate the underlying mechanisms of this phenomenon and its implications to scleral biomechanics and pathophysiology.
We obtained cross-sectional strain maps along both the circumferential and the meridian directions to investigate if ultrasound speckle tracking could detect anisotropic properties as reported in previous studies [25]. Our results showed that the average lateral strains along the meridian direction were larger than those from the circumferential direction, which was consistent with previous reports and agreed with the typical microstructural observations that collagen fibers are preferentially aligned along the circumferential direction close to the ONH [55]. Previous modeling work has suggested a significant impact of the collagen fiber orientation in the peripapiliary sclera region on IOP-induced deformation of ONH [26]. Circumferential arrangement of collagen fibers around the ONH could significantly reduce canal expansion which is protective of the structural stability of the ONH [26].
In order to validate the accuracy of the ultrasound speckle tracking method in estimating scleral strains, we first examined how well the method could detect absolute displacement of a porcine sclera induced by an actuator. Our results showed that the displacements calculated from ultrasound speckle tracking agreed well with the actuator output (Fig. 6). For example, when the actuator displacement was 10 μm, the average calculated displacement of the ultrasound speckles were 10.9 ± 0.4 μm (axial) or 9.4 ± 2.2 μm (lateral). Assuming the actuator output was the true displacement, this result showed that the high-resolution ultrasound method was capable of tracking displacements at the accuracy of sub-micron to micron scale with an uncertainty (i.e., standard deviation) of the same scale. Our results also showed a larger variance in the calculated lateral displacement than axial displacement. This was consistent with previous reports that axial speckle tracking typically had better performance than lateral speckle tracking due to the additional phase information and higher sampling rate in the RF data along the axial direction [56]. At larger displacements, there was a small discrepancy between the actuator output and the ultrasound measurements. This is likely due to the potential small misalignment between the transducer movement and the ultrasound beam, as well as the inaccuracy of the actuator itself.
The theoretical analysis of the strain filter, i.e., the SNRe as a function of strain, showed the typical band-pass characteristics found in other ultrasound elastography systems [40,41,44,48]. The − 3 dB range of the strain filter was from 0.17% to 10%, which adequately covers the strain levels observed in sclera. Girard et al. reported an average maximum Lagrangian strain of 1.3% at 10 mmHg and 3.1% at 45 mmHg in porcine sclera shells [21]. Woo et al. reported a strain level of 0.5% on human sclera at 45 mmHg [20]. These strain values fall within the −3 dB range reported above. In the present study, a larger than 10% axial strains was sometimes observed in the porcine sclera when IOP was raised to 45 mmHg. This strain was determined accumulatively based on the speckle tracking results at multiple intermediate pressures and the strains corresponding to the intermediate steps were well within the −3 dB range. The current strain filter predicted a maximum SNRe of 15.7, which corresponds to 0.06% noise at a 1% actual strain. It is noted that this was predicted from the theoretical analysis without any further signal processing applied (e.g., filtering or smoothing). In practice, the SNRe can be further improved by applying least-square fitting on strain estimation [37] or low-pass filtering in both displacement fields and strain images [47], at the cost of decreased spatial resolution of the strain maps.
Based on the simulation experiments, the calculated strains matched well with the simulated strains in both the axial and lateral directions under either compression or extension for uniform samples (Table 3). The SNRe estimated from the simulation results was consistent with the theoretical analysis demonstrating a bandpass characteristic with the optimal strain levels ranging from 0.5% to 6%. The SNRe was generally lower in the lateral direction than in the axial direction, which was consistent with the aforementioned better performance of speckle tracking along the ultra-sound propagation direction (i.e., axial direction) [56]. It is noted that the scanning direction can be adjusted within the limits of tissue geometry so that the axial direction could be aligned towards the direction of interest to optimize the performance along that direction. The simulation results in two layers with different strains demonstrated the sensitivity of using ultrasound speckle tracking to detect heterogeneous tissue responses. The simulation results of an inhomogeneous area with increasingly smaller size showed that the axial strains were sensitive to an inhomogeneity of a few hundreds of microns, suggesting the suitability of this approach for acquiring axial deformation data of heterogonous tissue at a fine resolution. The lateral strains, due to the lower SNRe discussed above, suffered from more noise which made it more difficult to clearly differentiate the inhomogeneous areas unless the size is approaching the mm level. Future studies are needed to analyze how the ultrasound speckle tracking algorithm performs for strain contrasts at other levels and for stiffer heterogeneities that have lower strains than the background.
The limitations of the present study are as follows. First, only 2D cross-sectional data was obtained and analyzed. Potential outof-plane motion such as sample rotation could result in erroneous strain measurements. In the present study, the correlation coefficients for speckle tracking were high (generally over 0.8), suggesting minimal out-of-plane motion. Future 3D full-field studies are needed to fully characterize 3D strains and validate the results. This can be achieved by using 3D ultrasound scanning and 3D speckle tracking algorithms. Second, the present study only examined axial and lateral strains. Other types of strains including the principal strains and shear strains may provide additional insights into the mechanical behavior of the sclera and better description of potential tissue heterogeneity, and thus should be investigated in the future. In addition, the present study only examined one region of the posterior sclera (i.e., the temporal quadrant near the ONH), which may not be reflective of the general state of strains near the ONH but in different quadrants. Future studies are needed to examine potential regional heterogeneity in different quadrants of the posterior sclera. Third, the present study only examined the elastic responses of the sclera. New testing protocols should be developed to evaluate the viscoelastic properties which will provide important data for understanding the time-dependent scleral properties and their involvement in glaucoma disease processes. Fourth, the porcine sclera may have experienced some swelling prior to the experiments due to the storage in PBS, which could affect the measured strains (particularly, the axial strains). The swelling, however, was likely small because of the low concentration of proteoglycans and substantial interweaving of the collagen fibers in the sclera [57].
In summary, this study established the feasibility of a new experimental method for noninvasive measurement of distributive internal strains of the sclera at high accuracy and high signal-to-noise ratio.
Contributor Information
Junhua Tang, Department of Biomedical Engineering, , Ohio State University, , 1080 Carmack Road, , Columbus, OH 43210.
Jun Liu, Assistant Professor , Department of Biomedical Engineering, , Department of Ophthalmology, , Ohio State University, , 1080 Carmack Road, , Columbus, OH 43210.
References
- [1]. Kingman, S. , 2004, “Glaucoma is Second Leading Cause of Blindness Globally,” Bull. World Health Organ., 82(11), pp. 887–888. Available at http://www.scielosp.org/pdf/bwho/v82n11/v82n11a19.pdf [PMC free article] [PubMed] [Google Scholar]
- [2]. Burgoyne, C. F. , Downs, J. C. , Bellezza, A. J. , Suh, J. K. F. , and Hart, R. T. , 2005, “The Optic Nerve Head as a Biomechanical Structure: A New Paradigm for Understanding the Role of IOP-Related Stress and Strain in the Pathophysiology of Glaucomatous Optic Nerve Head Damage,” Prog. Retin. Eye Res., 24(1), pp. 39–73. 10.1016/j.preteyeres.2004.06.001 [DOI] [PubMed] [Google Scholar]
- [3]. Sigal, I. A. , Flanagan, J. G. , and Ethier, C. R. , 2005, “Factors Influencing Optic Nerve Head Biomechanics,” Invest. Ophthalmol. Visual Sci., 46(11), pp. 4189–4199. 10.1167/iovs.05-0541 [DOI] [PubMed] [Google Scholar]
- [4]. Sigal, I. A. , Flanagan, J. G. , Tertinegg, I. , and Ethier, C. R. , 2009, “Modeling Individual-Specific Human Optic Nerve Head Biomechanics. Part II: Influence of Material Properties,” Biomech. Model. Mechanobiol., 8(2), pp. 99–109. 10.1007/s10237-008-0119-0 [DOI] [PubMed] [Google Scholar]
- [5]. McBrien, N. A. , Cornell, L. M. , and Gentle, A. , 2001, “Structural and Ultra-structural Changes to the Sclera in a Mammalian Model of High Myopia,” Invest. Ophthalmol. Visual Sci., 42(10), pp. 2179–2187. Available at http://www.ncbi.nlm.nih.gov/pubmed/11527928 [PubMed] [Google Scholar]
- [6]. Phillips, J. R. , and Mcbrien, N. A. , 1995, “Form Deprivation Myopia – Elastic Properties of Sclera,” Ophthalmic Physiol. Opt., 15(5), pp. 357–362. 10.1016/0275-5408(95)00062-I [DOI] [PubMed] [Google Scholar]
- [7]. Siegwart, J. T. , and Norton, T. T. , 1999, “Regulation of the Mechanical Properties of Tree Shrew Sclera by the Visual Environment,” Vision Res., 39(2), pp. 387–407. 10.1016/S0042-6989(98)00150-3 [DOI] [PubMed] [Google Scholar]
- [8]. McBrien, N. A. , Jobling, A. I. , and Gentle, A. , 2009, “Biomechanics of the Sclera in Myopia: Extracellular and Cellular Factors,” Optom. Vision Sci., 86(1), pp. 23–30. [DOI] [PubMed] [Google Scholar]
- [9]. Mitchell, P. , Hourihan, F. , Sandbach, J. , and Wang, J. J. , 1999, “The Relationship Between Glaucoma and Myopia – The Blue Mountains Eye Study,” Ophthalmology, 106(10), pp. 2010–2015. 10.1016/S0161-6420(99)90416-5 [DOI] [PubMed] [Google Scholar]
- [10]. Watson, P. G. , and Young, R. D. , 2004, “Scleral Structure, Organisation and Disease. A Review,” Exp. Eye Res., 78(3), pp. 609–623. 10.1016/S0014-4835(03)00212-4 [DOI] [PubMed] [Google Scholar]
- [11]. Friberg, T. R. , and Lace, J. W. , 1988, “A Comparison of the Elastic Properties of Human Choroid and Sclera,” Exp. Eye Res., 47(3), pp. 429–436. 10.1016/0014-4835(88)90053-X [DOI] [PubMed] [Google Scholar]
- [12]. Elsheikh, A. , Geraghty, B. , Alhasso, D. , Knappett, J. , Campanelli, M. , and Rama, P. , 2010, “Regional Variation in the Biomechanical Properties of the Human Sclera,” Exp. Eye Res., 90(5), pp. 624–633. 10.1016/j.exer.2010.02.010 [DOI] [PubMed] [Google Scholar]
- [13]. Downs, J. C. , Suh, J. K. F. , Thomas, K. A. , Bellezza, A. J. , Hart, R. T. , and Burgoyne, C. F. , 2005, “Viscoelastic Material Properties of the Peripapillary Sclera in Normal and Early-Glaucoma Monkey Eyes,” Invest. Ophthalmol. Visual Sci., 46(2), pp. 540–546. 10.1167/iovs.04-0114 [DOI] [PubMed] [Google Scholar]
- [14]. Schultz, D. S. , Lotz, J. C. , Lee, S. M. , Trinidad, M. L. , and Stewart, J. M. , 2008, “Structural Factors That Mediate Scleral Stiffness,” Invest. Ophthalmol. Visual Sci., 49(10), pp. 4232–4236. 10.1167/iovs.08-1970 [DOI] [PubMed] [Google Scholar]
- [15]. Palko, J. R. , Pan, X. L. , and Liu, J. , 2011, “Dynamic Testing of Regional Visco-elastic Behavior of Canine Sclera,” Exp. Eye Res., 93(6), pp. 825–832. 10.1016/j.exer.2011.09.018 [DOI] [PMC free article] [PubMed] [Google Scholar]
- [16]. Curtin, B. J. , 1969, “Physiopathologic Aspects of Scleral Stress-Strain,” Trans. Am. Ophthalmol. Soc., 67, pp. 417–461. [PMC free article] [PubMed] [Google Scholar]
- [17]. Eilaghi, A. , Flanagan, J. G. , Tertinegg, I. , Simmons, C. A. , Brodland, G. W. , and Ethier, C. R. , 2010, “Biaxial Mechanical Testing of Human Sclera,” J. Bio-mechanics, 43(9), pp. 1696–1701. [DOI] [PubMed] [Google Scholar]
- [18]. Mortazavi, A. M. , Simon, B. R. , Stamer, W. D. , and Geest, J. P. V. , 2009, “Drained Secant Modulus for Human and Porcine Peripapillary Sclera Using Unconfined Compression Testing,” Exp. Eye Res., 89(6), pp. 892–897. 10.1016/j.exer.2009.07.011 [DOI] [PubMed] [Google Scholar]
- [19]. Battaglioli, J. L. , and Kamm, R. D. , 1984, “Measurements of the Compressive Properties of Scleral Tissue,” Invest. Ophthalmol. Visual Sci., 25(1), pp. 59–65. [PubMed] [Google Scholar]
- [20]. Woo, S. L-Y. , Kobayashi, A. S. , Schlegela, W. A. , and Lawrence, C. , 1972, “Nonlinear Material Properties of Intact Cornea and Sclera,” Exp. Eye Res., 14(1), pp. 29–39. 10.1016/0014-4835(72)90139-X [DOI] [PubMed] [Google Scholar]
- [21]. Girard, M. J. A. , Downs, J. C. , Burgoyne, C. F. , and Suh, J. K. F. , 2008, “Experimental Surface Strain Mapping of Porcine Peripapillary Sclera due to Elevations of Intraocular Pressure,” ASME J. Biomech. Eng., 130(4), p. 041017. 10.1115/1.2948416 [DOI] [PMC free article] [PubMed] [Google Scholar]
- [22]. Myers, K. M. , Cone, F. E. , Quigley, H. A. , Gelman, S. , Pease, M. E. , and Nguyen, T. D. , 2010, “The In Vitro Inflation Response of Mouse Sclera,” Exp. Eye Res., 91(6), pp. 866–875. 10.1016/j.exer.2010.09.009 [DOI] [PMC free article] [PubMed] [Google Scholar]
- [23]. Myers, K. M. , Coudrillier, B. , Boyce, B. L. , and Nguyen, T. D. , 2010, “The Inflation Response of the Posterior Bovine Sclera,” Acta Biomater., 6(11), pp. 4327–4335. 10.1016/j.actbio.2010.06.007 [DOI] [PubMed] [Google Scholar]
- [24]. Greene, P. R. , and Mcmahon, T. A. , 1979, “Scleral Creep Vs Temperature and Pressure In Vitro,” Exp. Eye Res., 29(5), pp. 527–537. 10.1016/0014-4835(79)90153-2 [DOI] [PubMed] [Google Scholar]
- [25]. Girard, M. J. A. , Downs, J. C. , Bottlang, M. , Burgoyne, C. F. , and Suh, J. K. F. , 2009, “Peripapillary and Posterior Scleral Mechanics-Part II: Experimental and Inverse Finite Element Characterization,” ASME J. Biomech. Eng., 131(5), p. 051011. 10.1115/1.3113682 [DOI] [PMC free article] [PubMed] [Google Scholar]
- [26]. Girard, M. J. A. , Downs, J. C. , Burgoyne, C. F. , and Suh, J. K. F. , 2009, “Peripapillary and Posterior Scleral Mechanics-Part I: Development of an Anisotropic Hyperelastic Constitutive Model,” ASME J. Biomech. Eng., 131(5), p. 051012. 10.1115/1.3113683 [DOI] [PMC free article] [PubMed] [Google Scholar]
- [27]. Ophir, J. , Cespedes, I. , Ponnekanti, H. , Yazdi, Y. , and Li, X. , 1991, “Elastography – A Quantitative Method for Imaging the Elasticity of Biological Tissues,” Ultrason. Imaging, 13(2), pp. 111–134. 10.1177/016173469101300201 [DOI] [PubMed] [Google Scholar]
- [28]. Odonnell, M. Skovoroda, A. R. Shapo, B. M. and Emelianov, S. Y. , 1994, “Internal Displacement and Strain Imaging Using Ultrasonic Speckle Tracking,” IEEE Trans. Ultrason. Ferroelectr. Freq. Control, 41(3), pp. 314–325. 10.1109/58.285465 [DOI] [Google Scholar]
- [29]. Krouskop, T. A. , Wheeler, T. M. , Kallel, F. , Garra, B. S. , and Hall, T. , 1998, “Elastic Moduli of Breast and Prostate Tissues under Compression,” Ultrason. Imaging, 20(4), pp. 260–274. Available at http://www.ncbi.nlm.nih.gov/pubmed/10197347 [DOI] [PubMed] [Google Scholar]
- [30]. Suffoletto, M. S. , Dohi, K. , Cannesson, M. , Saba, S. , and Gorcsan, J. , 2006, “Novel Speckle-Tracking Radial Strain From Routine Black-and-White Echo-cardiographic Images to Quantify Dyssynchrony and Predict Response to Cardiac Resynchronization Therapy,” Circulation, 113(7), pp. 960–968. 10.1161/CIRCULATIONAHA.105.571455 [DOI] [PubMed] [Google Scholar]
- [31]. Ryan, L. K. , and Foster, F. S. , 1997, “Ultrasonic Measurement of Differential Displacement Strain in a Vascular Model,” Ultrason. Imaging, 19(1), pp. 19–38. 10.1177/016173469701900102 [DOI] [PubMed] [Google Scholar]
- [32]. Righetti, R. , Kallel, F. , Stafford, R. J. , Price, R. E. , Krouskop, T. A. , Hazle, J. D. , and Ophir, J. , 1999, “Elastographic Characterization of HIFU-Induced Lesions in Canine Livers,” Ultrasound in Med. Biol., 25(7), pp. 1099–1113. 10.1016/S0301-5629(99)00044-7 [DOI] [PubMed] [Google Scholar]
- [33]. Kallel, F. , Ophir, J. , Magee, K. , and Krouskop, T. , 1998, “Elastographic Imaging of Low-Contrast Elastic Modulus Distributions in Tissue,” Ultrasound Med. Biol., 24(3), pp. 409–425. 10.1016/S0301-5629(97)00287-1 [DOI] [PubMed] [Google Scholar]
- [34]. Kallel, F. , Price, R. E. , Konofagou, E. , and Ophir, J. , 1999, “Elastographic Imaging of the Normal Canine Prostate In Vitro,” Ultrason. Imaging, 21(3), pp. 201–215. 10.1177/016173469902100304 [DOI] [PubMed] [Google Scholar]
- [35]. Bohs, L. N. , and Trahey, G. E. , 1991, “A Novel Method for Angle Independent Ultrasonic-Imaging of Blood-Flow and Tissue Motion,” IEEE Trans. Biomed. Eng., 38(3), pp. 280–286. 10.1109/10.133210 [DOI] [PubMed] [Google Scholar]
- [36]. Angelini, E. D. , and Gerard, O. , 2006, “Review of Myocardial Motion Estimation Methods From Optical Flow Tracking on Ultrasound Data,” 2006 28th Annual International Conference of the IEEE Engineering in Medicine and Biology Society, Vols. 1–15, pp. 6337–6340. [DOI] [PubMed] [Google Scholar]
- [37]. Kallel, F. , and Ophir, J. , 1997, “A Least-Squares Strain Estimator for Elastography,” Ultrason. Imaging, 19(3), pp. 195–208. Available at http://www.ncbi.nlm.nih.gov/pubmed/9447668 [DOI] [PubMed] [Google Scholar]
- [38]. Nightingale, K. R. , Palmeri, M. L. , Nightingale, R. W. , and Trahey, G. E. , 2001, “On the Feasibility of Remote Palpation Using Acoustic Radiation Force,” J. Acoust. Soc. Am., 110(1), pp. 625–634. 10.1121/1.1378344 [DOI] [PubMed] [Google Scholar]
- [39]. Konofagou, E. E. , and Hynynen, K. , 2003, “Localized Harmonic Motion Imaging: Theory, Simulations and Experiments,” Ultrasound Med. Biol., 29(10), pp. 1405–1413. 10.1016/S0301-5629(03)00953-0 [DOI] [PubMed] [Google Scholar]
- [40]. Srinivasan, S. , Righetti, R. , and Ophir, J. , 2003, “Trade-offs Between the Axial Resolution and the Signal-to-Noise Ratio in Elastography,” Ultrasound Med. Biol., 29(6), pp. 847–866. 10.1016/S0301-5629(03)00037-1 [DOI] [PubMed] [Google Scholar]
- [41]. Varghese, T. , and Ophir, J. , 1997, “A Theoretical Framework for Performance Characterization of Elastography: The Strain Filter,” IEEE Trans. Ultrason.Ferroelectr. Freq. Control, 44(1), pp. 164–172. 10.1109/58.585212 [DOI] [PubMed] [Google Scholar]
- [42]. Skovoroda, A. R. , Emelianov, S. Y. , Lubinski, M. A. , Sarvazyan, A. P. , and Odonnell, M. , 1994, “Theoretical-Analysis and Verification of Ultrasound Displacement and Strain Imaging,” IEEE Trans. Ultrason. Ferroelectr. Freq. Control, 41(3), pp. 302–313. 10.1109/58.285463 [DOI] [Google Scholar]
- [43]. Varghese, T. , Bilgen, M. , and Ophir, J. , 1998, “Multiresolution Imaging in Elastography,” IEEE Trans. Ultrason. Ferroelectr. Freq. Control, 45(1), pp. 65–75. 10.1109/58.646912 [DOI] [PubMed] [Google Scholar]
- [44]. Varghese, T. , Ophir, J. , Konofagou, E. , Kallel, F. , and Righetti, R. , 2001, “Tradeoffs in Elastographic Imaging,” Ultrason. Imaging, 23(4), pp. 216–248. Available at http://www.ncbi.nlm.nih.gov/pubmed/12051276 [DOI] [PubMed] [Google Scholar]
- [45]. Hollman, K. W. , Emelianov, S. Y. , Neiss, J. H. , Jotyan, G. , Spooner, G. J. R. , Juhasz, T. , Kurtz, R. M. , and O'Donnell, M. , 2002, “Strain Imaging of Corneal Tissue with an Ultrasound Elasticity Microscope,” Cornea, 21(1), pp. 68–73. 10.1097/00003226-200201000-00015 [DOI] [PubMed] [Google Scholar]
- [46]. Ford, M. R. , Dupps, W. J. , Rollins, A. M. , Roy, A. S. , and Hu, Z. L. , 2011, “Method for Optical Coherence Elastography of the Cornea,” J. Biomed. Optics, 16(1), p. 016005. 10.1117/1.3526701 [DOI] [PMC free article] [PubMed] [Google Scholar]
- [47]. Cohn, N. A. , Emelianov, S. Y. , Lubinski, M. A. , and ODonnell, M. , 1997, “An Elasticity Microscope. 1. Methods,” IEEE Trans. Ultrason. Ferroelectr. Freq. Control, 44(6), pp. 1304–1319. 10.1109/58.656634 [DOI] [Google Scholar]
- [48]. Weinstein, E. , and Weiss, A. J. , 1984, “Fundamental Limitations in Passive Time-Delay Estimation. 2. Wideband Systems,” IEEE Trans. Acoust., Speech, Signal Process., 32(5), pp. 1064–1078. 10.1109/TASSP.1984.1164429 [DOI] [Google Scholar]
- [49]. Jensen, J. A. , 1996, “Field: A Program for Simulating Ultrasound Systems,” 10th Nordicbaltic Conference on Biomedical Imaging, Vol. 4(1), pp. 351–353. [Google Scholar]
- [50]. Jensen, J. A. , and Svendsen, N. B. , 1992, “Calculation of Pressure Fields from Arbitrarily Shaped, Apodized, and Excited Ultrasound Transducers,” IEEE Trans. Ultrason. Ferroelectr. Freq. Control, 39(2), pp. 262–267. 10.1109/58.139123 [DOI] [PubMed] [Google Scholar]
- [51]. Zagzebski, J. A. , Chen, J. F. , Dong, F. , and Wilson, T. , 1999, “Intervening Attenuation Affects First-Order Statistical Properties of Ultrasound Echo Signals,” IEEE Trans. Ultrason. Ferroelectr. Freq. Control, 46(1), pp. 35–40. 10.1109/58.741421 [DOI] [PubMed] [Google Scholar]
- [52]. Komai, Y. , and Ushiki, T. , 1991, “The 3-Dimensional Organization of Collagen Fibrils in the Human Cornea and Sclera,” Invest. Ophthalmol. Visual Sci., 32(8), pp. 2244–2258. [PubMed] [Google Scholar]
- [53]. Haider, M. A. , and Guilak, F. , 2007, “Application of a Three-Dimensional Poroelastic BEM to Modeling the Biphasic Mechanics of Cell-Matrix Interactions in Articular Cartilage,” Comput. Methods Applied Mech. Eng., 196(31-32), pp. 2999–3010. 10.1016/j.cma.2006.08.020 [DOI] [PMC free article] [PubMed] [Google Scholar]
- [54]. Ma, J. , Narayanan, H. , Garikipati, K. , Grosh, K. , and Arruda, E. M. , 2010, “Experimental and Computational Investigation of Viscoelasticity of Native and Engineered Ligament and Tendon,” Proc. IUTAM Symposium on Cellular, Molecular and Tissue Mechanics, Vol. 16, pp. 3–17. [Google Scholar]
- [55]. Greene, P. R. , 1980, “Mechanical Considerations in Myopia - Relative Effects of Accommodation, Convergence, Intraocular-Pressure, and the Extra-Ocular Muscles,” Am. J. Optom. Physiol. Opt., 57(12), pp. 902–914. 10.1097/00006324-198012000-00004 [DOI] [PubMed] [Google Scholar]
- [56]. Chen, X. C. , Zohdy, M. J. , Emelianov, S. Y. , and O'Donnell, M. , 2004, “Lateral Speckle Tracking Using Synthetic Lateral Phase,” IEEEeee Trans. Ultrason. Ferroelectr. Freq. Control, 51(5), pp. 540–550. 10.1109/TUFFC.2004.1320827 [DOI] [PubMed] [Google Scholar]
- [57]. Huang, Y. , and Meek, K. M. , 1999, “Swelling Studies on the Cornea and Sclera: The Effects of pH and Ionic Strength,” Biophys. J., 77(3), pp. 1655–1665. 10.1016/S0006-3495(99)77013-X [DOI] [PMC free article] [PubMed] [Google Scholar]


