

Abstract
Peroxisome proliferator-activated receptor γ (PPARγ) is a master regulator of adipocyte differentiation, and genome-wide studies indicate that it is involved in the induction of most adipocyte genes. Here we report, for the first time, the acute effects of the synthetic PPARγ agonist rosiglitazone on the transcriptional network of PPARγ in adipocytes. Treatment with rosiglitazone for 1 hour leads to acute transcriptional activation as well as repression of a number of genes as determined by genome-wide RNA polymerase II occupancy. Unlike what has been shown for many other nuclear receptors, agonist treatment does not lead to major changes in the occurrence of PPARγ binding sites. However, rosiglitazone promotes PPARγ occupancy at many preexisting sites, and this is paralleled by increased occupancy of the mediator subunit MED1. The increase in PPARγ and MED1 binding is correlated with an increase in transcription of nearby genes, indicating that rosiglitazone, in addition to activating the receptor, also promotes its association with DNA, and that this is causally linked to recruitment of mediator and activation of genes. Notably, both rosiglitazone-activated and -repressed genes are induced during adipogenesis. However, rosiglitazone-activated genes are markedly more associated with PPARγ than repressed genes and are highly dependent on PPARγ for expression in adipocytes. By contrast, repressed genes are associated with the other key adipocyte transcription factor CCAAT-enhancer binding proteinα (C/EBPα), and their expression is more dependent on C/EBPα. This suggests that the relative occupancies of PPARγ and C/EBPα are critical for whether genes will be induced or repressed by PPARγ agonist.
Adipocyte differentiation proceeds through the activation of a cascade of early and late adipogenic transcription factors (1–3). The nuclear receptor peroxisome proliferator-activated receptor γ (PPARγ) is a late acting key regulator of adipocyte differentiation and function (4). Recent genome-wide analyses of PPARγ binding sites in mouse (5–7) and human adipocytes (8, 9) have shown that PPARγ binds near most genes that are induced during adipocyte differentiation, suggesting that PPARγ is directly involved in the activation of the entire adipogenic gene program. Another important late-acting adipogenic transcription factor is CCAAT-enhancer binding protein α (C/EBPα), and several lines of evidence indicate that PPARγ and C/EBPα constitute key components of the second and final wave of adipogenic transcription factors. The two factors cooperate by mutually inducing the expression of each other and by jointly activating common target genes (10–13). Interestingly, C/EBPα co-occupy a high percentage (30%–60%) of all PPARγ binding sites in murine 3T3-L1 and in human Simpson-Golabi-Behmel syndrome cells (5, 9), indicating that the 2 factors directly cooperate on several enhancers in the genome.
In addition to its role in adipocyte differentiation, PPARγ is a main regulator of insulin sensitivity at a cellular level in adipocytes as well as at a systemic level (4). High-affinity PPARγ agonists such as thiazolidinediones (TZDs) function as potent insulin sensitizers through mechanisms involving multiple tissues and cell types (14). PPARγ-mediated changes in adipocytes are particularly important for the insulin-sensitizing actions in vivo. These insulin-sensitizing mechanisms in adipocytes involve increased de novo adipogenesis and lipogenesis, increased expression of adiponectin, inhibition of the expression of proinflammatory genes (4), and probably increased expression of components of the insulin signaling pathway (15, 16). In addition, the recently demonstrated browning effect of TZDs on white adipocytes (17–20) may also contribute to increased cellular and systemic insulin sensitivity.
Consistent with PPARγ being a master regulator of adipocyte differentiation, administration of TZDs to mature adipocytes in culture leads to increased expression of a large number of adipocyte-specific genes, many of which has been shown to be direct PPARγ target genes (21–26). Interestingly, however, a few adipocyte genes are also repressed by TZD treatment. These include the PPARγ gene itself (27, 28) as well as the genes encoding resistin (29, 30), leptin (31), and the β3-adrenergic receptor (32). The molecular mechanism for this repression and the regulatory features that distinguish adipocyte genes that are activated, not affected or repressed by TZD, are currently unknown. More recent results from Vernochet et al. (19) indicate that C/EBPα may be required for the ability of TZDs to repress these genes in mature adipocytes over a time window of 2 days, and that the repression may involve the corepressors C-terminal-binding protein 1 and 2.
Here we have investigated, for the first time, the acute genome-wide effects of the TZD rosiglitazone on the transcriptional network of PPARγ and C/EBPα in adipocytes. The short exposure time of 1 hour allows us to assess the direct effect of rosiglitazone on PPARγ activation. We show that although the overall PPARγ binding pattern is not affected by rosiglitazone, there is an increase in both PPARγ and mediator subunit 1 (MED1) occupancy at putative enhancers correlating with the rosiglitazone-induced increase in transcription of nearby genes. This identifies a subset of putative rosiglitazone-responsive enhancers that are likely to be involved in the regulation of rosiglitazone-induced genes. Notably, the rosiglitazone-regulated genes, whether activated or repressed, are generally genes that are induced during adipocyte differentiation. However, the rosiglitazone-induced genes are more associated with PPARγ than with C/EBPα, whereas genes that are acutely repressed by rosiglitazone are more associated with C/EBPα. These results indicate that the ratio between binding of the 2 key adipogenic transcription factors, PPARγ and C/EBPα, may play a role in determining whether adipocyte genes are induced or repressed by rosiglitazone.
Materials and Methods
3T3-L1 cell culture
3T3-L1 preadipocytes were differentiated as described previously (24). The differentiation medium was changed a final time at day 6 of differentiation, and experiments were carried out on day 7. Lipid accumulation was assessed using oil red O staining as described previously (33). Rosiglitazone or dimethylsulfoxide (DMSO) was added to aliquots of culture media previously removed from the cells and added back to the culture dish directly inside the incubators to final concentration of 1 μM rosiglitazone and/or 0.1% DMSO. Gene expression was analyzed at mRNA and pre-mRNA levels using quantitative real-time PCR as described previously (6, 34). PPARγ and transcription factor (TF)IIB protein levels were determined by Western blotting using anti-PPARγ (sc-7273; Santa Cruz Biotechnology, Inc., Santa Cruz, California) and anti-TFIIB (sc-225; Santa Cruz) as primary antibodies as described previously (34).
Chromatin immunoprecipitation (ChIP) and ChIP sequencing (ChIP-seq)
ChIP was performed as described previously (35) except that only formaldehyde was used for cross-linking and nuclei were isolated from the cells before sonication. The later was achieved by harvesting the cross-linked cells in ice-cold lysis buffer (5 mM PIPES pH 8.0, 85 mM KCL, 0.5% Nonidet P-40), and nuclei were subsequently released using a Dounce homogenizer. Crude nuclei were resuspended at 107 ml−1 in radioimmune precipitation assay buffer (1% Nonidet P-40, 0.5% sodium deoxycholate, 0.1% sodium dodecyl sulfate) and sonicated at high setting in a Bioruptor-Twin (Diagenode, Denville, New Jersey) at a volume of 300 μL in 1.5-mL tubes for 40 cycles of 30 seconds on and 30 seconds off. The following antibodies directed against RNA polymerase II (RNAPII) (AC-055–100; Diagenode), PPARγ (sc-7196; Santa Cruz), C/EBPα (sc-61; Santa Cruz), MED1 (sc-8998; Santa Cruz), and cAMP-responsive element-binding protein 1 (CREB)-binding protein (CBP) (sc-369; Santa Cruz) were used. For ChIP-seq the ChIP reactions were scaled to gain enough material (minimum 10 ng of DNA). Sonicated samples were diluted in ChIP incubation buffer and processed downstream as described previously (35). ChIP-seq sample preparation and sequencing were performed according to the instructions by the manufacturer (Illumina, San Diego, California). Sequenced reads were mapped to the reference genome (mm9) using Bowtie (36). For visualization of genome-wide distribution of mapped reads, BigWig tracks were generated using the HOMER next-gen sequencing analysis suite (37) and visualized using the University of California Santa Cruz (UCSC) genome browser. Raw ChIP-seq data files have been deposited into GEO under the accession number GSE49423.
RNAPII density and differential expression
Raw RNAPII reads were counted within the gene bodies (including introns) of RefSeq genes longer than 1 kb using the HOMER package. To avoid counting reads from stalling of the RNAPII at the promoter, reads mapping to the initial 250 bases of the gene bodies were left out. RNAPII reads were counted as total reads per gene but were normalized to gene length to filter out genes expressed at or below background. Only genes having a RNAPII read density higher than background in all libraries were used for further calculations. Background was defined as the total amount of unique mapped reads divided by the effective genome size (1.87 × 10⁹ bp). Differential expression was called based on the raw counts from 2 replicate experiments using the edgeR package using the recommended settings for a paired experimental design (38). Gene Ontology (GO) categories associated with induced or repressed genes were identified using GOseq using the recommended settings (39).
Identification and quantification of TF binding sites
The sequenced reads from rosiglitazone and DMSO libraries were pooled to 1 library, and binding sites were identified using the HOMER package (standard settings) using a sonicated input sample as control. Binding intensity was scored for identified binding sites by counting reads from each library mapping within the enriched genomic regions using the HOMER package. Binding intensity at TF binding sites were normalized to a total read depth of 10 million reads. Total occupancy in vicinity of genes was determined by summarizing all reads from all peaks located within a 100-kb window centered on the transcription start site. The strongest PPARγ binding site located near genes were identified as the PPARγ binding site within the same 100-kb window containing most reads in the DMSO library sample. Wilcoxon rank-sum tests were used to statistically compare different factor occupancies at a population of loci, whereas Wilcoxon signed-rank tests were used to compare factor occupancies between different populations of loci.
RNA interference
Day 7 3T3-L1 adipocytes were detached from the culture dish using trypsin-EDTA solution and suspended in PBS. The cells were spun down at 200 × g, washed once in PBS, and suspended in 3.5 mL PBS/149-mm culture dish. Small interfering RNA (siRNA) (100 pmol) (siGENOME SMARTpool; Dharmacon, Lafayette, Colorado) was electroporated into 0.5 mL cell suspension using a Gene Pulser (Bio-Rad Laboratories, Inc., Hercules, California) as described previously for plasmid DNA (40). Post electroporation, the cells were washed twice in fresh media and as much floating lipid and cell debris as possible were carefully removed. The cells were seeded in 6-well culture plates, and mRNA expression was evaluated after 24 hours.
Results
Rosiglitazone induces both acute and delayed effects in 3T3-L1 adipocytes
The effects of PPARγ agonists like TZDs on adipocyte gene expression have previously been investigated following exposure for several hours (41) or days (42–44). To investigate the time course of these changes, we induced murine 3T3-L1 cells to undergo differentiation using the standard hormonal cocktail and subsequently treated the mature adipocytes (day 7) with either 1 μM of the PPARγ agonist rosiglitazone or DMSO (vehicle). The differentiation efficiency was evaluated based on presence of lipid droplets by phase-contrast microscopy and visualized using oil red O staining (Supplemental Figure 1 published on The Endocrine Society's Journals Online web site at http://mend.endojournals.org). For all adipocyte cultures used for these experiments, the extent of differentiation was estimated to be greater than 90%. We determined mRNA transcript levels of selected target genes by qPCR at several time points following treatment, and in addition, to more directly assess the effects of TZDs on transcription, we also determined the pre-mRNA levels of these transcripts. Our analyses showed that rosiglitazone-induced genes could be divided into at least 2 groups, depending on the kinetics by which they are induced (Figure 1A). The first group responds rapidly and reaches the maximum change in transcriptional activity as early as 1 hour after rosiglitazone administration, which leads to changes in mRNA abundance after 3 hours. This group contains classic PPARγ target genes, such as Fabp4 and Pck1 encoding adipocyte fatty acid-binding protein (FABP4) and phosphoenolpyrovate carboxykinase. Another group of genes displays a delayed response to rosiglitazone following prolonged treatment, indicating that their induction involves indirect effects. This group contains the Ppargc1a and Cidea genes encoding PPARγ coactivator 1 α and cell death-inducing DNA fragmentation factor α like effector A, respectively. These genes are induced at the mRNA level following treatment with rosiglitazone for 24 hours, whereas transcription is unchanged within the first 3 hours. The time course studies also revealed acute down-regulation of genes previously known to be repressed by rosiglitazone, such as the PPARγ gene itself, Pparg (27, 28), and Retn (45) encoding resistin. A decrease in the mRNA level of these genes was evident after 3 hours, whereas their pre-mRNA levels were maximally reduced already by 1 hour, indicating a direct effect of rosiglitazone on the transcription of these genes. Of note, despite the rapid decrease in PPARγ mRNA, the protein level of PPARγ is not reduced within the first 3 hours following rosiglitazone treatment (Figure 1B).
Figure 1.

Rosiglitazone Treatment Induces Both Acute and Delayed Effects on Gene Expression in Mature 3T3–L1 Adipocytes. 3T3–L1 cells were differentiated to day 7 postinduction and subsequently treated with either 1 μM rosiglitazone (Rosi) or DMSO for the indicated time points. A, Levels of both mRNA (top) and pre-mRNA (bottom) of genes representing 3 groups that respond differently to rosiglitazone treatment are depicted relative to the expression of TFIIB mRNA. B, Levels of PPARγ and TFIIB protein as determined by Western blotting in day 7 3T3–L1 adipocytes treated with rosiglitazone or DMSO for the indicated duration of time. Error bars indicate the data range of parallel biological replicates. Results are representative of 3 independent experiments.
Thus, these results demonstrate that rosiglitazone leads to acute transcriptional changes in 3T3-L1 adipocytes and that both activation and repression are maximal, as evaluated by the pre-mRNA levels, as early as after 1 hour of exposure. Furthermore, our data indicate that some of the previously reported rosiglitazone-induced changes in gene expression are delayed by many hours and therefore are likely to involve indirect effects of the treatment.
Acute genome-wide effects of rosiglitazone on transcription and on PPARγ and C/EBPα occupancy in adipocytes
To determine the acute effects of rosiglitazone on gene transcription at a genome-wide level, we performed RNAPII ChIP-seq on chromatin from 3T3-L1 adipocytes treated with rosiglitazone or DMSO for 1 hour. In order to investigate the activity of putative PPARγ enhancers at a genome-wide level, we performed ChIP-seq of PPARγ and C/EBPα, the 2 major transcription factors governing adipocyte gene expression. C/EBPα has previously been shown to bind to a large percentage of PPARγ binding sites in mature adipocytes, indicating a high degree of cross talk between these 2 adipogenic factors (5, 6, 9). Furthermore, we profiled 2 coactivators that have been shown to be associated with enhancer activity (46, 47), MED1 and CREB-binding protein (CBP). The binding profiles of these factors are visualized using the UCSC genome browser for the acutely induced gene Pck1 (Figure 2A) and for the acutely repressed gene Retn (Figure 2B). We have recently used RNAPII ChIP-seq to assess transcriptional activity during adipogenesis (6). In the present study, RNAPII ChIP-seq was performed in 2 bio-logical replicates. Transcriptional activity was scored by counting the number of reads that map within annotated gene bodies obtained from the NCBI reference sequence database (RefSeq). Differentially expressed genes were identified using the edgeR method (38). By this approach, we identified 397 acutely induced and 111 acutely repressed genes, with a false discovery rate (FDR) below 0.05 (Figure 2C; see Supplemental Table 1, A and B, for lists of top 50 induced or repressed genes). As previously demonstrated (6), the fold change in transcriptional activity observed using RNAPII ChIP-seq was highly correlated with the fold change in nascent RNA level of the genes analyzed (data not shown). Among the most significantly induced or repressed genes we find many genes previously described to be PPARγ target genes. The most robustly induced genes are Pck1, Angptl4 (encoding angiopoitin-related protein 4), and Tmem120A (encoding transmembrane protein 120A), and the most robustly repressed genes are Pparg, Clec2d (encoding C-type lectin domain family 2 member D), and Cav1 (encoding Caveolin-1) (see Supplemental Figure 2 for additional screenshots of the binding profiles). We searched for gene ontology (GO) categories enriched (FDR < 0.01) within the sets of genes acutely induced or repressed by rosiglitazone using GOseq (39). The GO category most associated with the rosiglitazone-induced gene program is “lipid metabolic process,” and most other associated categories are subcategories to that, such as “fatty acid β-oxidation” (Supplemental Table 2A). The repressed genes associate with GO categories involved in cell proliferation and death, as well as broad categories such as “regulation of metabolic process” (Supplemental Table 2B). Thus the GO analysis confirms the role of PPARγ as a direct activation of genes involved in cellular lipid metabolism and indicates that repressed genes are more involved in regulation of cellular signaling.
Figure 2.

Acute Genome-Wide Effects of Rosiglitazone on Transcription and Binding of PPARγ, C/EBPα, MED1, and CBP in Adipocytes. A and B, ChIP-seq profiles of RNAPII, PPARγ, C/EBPα, MED1, and CBP from 3T3–L1 adipocytes treated with 1 μM rosiglitazone (Rosi) or DMSO for 1 hour are visualized using the UCSC genome browser. Screen shots of (A) the induced gene Pck1 and (B) the repressed gene Retn are shown. The y-axis shows the number of mapped reads at each position along the x-axis. The genomic scales are indicated above the tracks, and the annotated RefSeq gene bodies are indicated below. C, MA plot illustrating difference in gene expression in 3T3–L1 cells treated with rosiglitazone and DMSO. Mapped RNAPII reads from 2 independent biological replicates were counted within RefSeq gene bodies from +250 bp and differential expression was called using edgeR. The y-axis shows the compute fold change in RNAPII occupancy. and the x-axis shows the mean expression in counts per million reads (cpm). Differentially expressed genes are shown in red (FDR < .05). D and E, Scatter plots comparing tag count of PPARγ binding sites (D), and C/EBPα binding sites (E) in 3T3 treated with 1 μM rosiglitazone or DMSO.
Comparison of the PPARγ binding profiles with or without rosiglitazone showed that, unlike what is the case for many other nuclear receptors, the number of PPARγ binding sites is not dramatically changed in response to the agonist (Figure 2D and Supplemental Figure 3A). Thus, most new sites induced by rosiglitazone are low-intensity binding sites, and all sites that are lost with rosiglitazone treatment are low-intensity sites in the control sample. Interestingly however, rosiglitazone leads to an increase in PPARγ occupancy at most and, in particular, the more intense, PPARγ target sites (Figure 2D). A similar general induction in PPARγ occupancy was observed in an independent biological replicate (Supplemental Figure 3B) and was observed at selected sites by ChIP-PCR in 9 additional experiments (Supplemental Figure 3D). In contrast, rosiglitazone does not lead to major overall changes in the occurrence or intensity of C/EBPα binding sites (Figure 2E). Because we are relying on a model system in which adipocytes are differentiated from precursor cells, there is always the possibility that undifferentiated cells in the population contribute to the observed effects. However, since 90% of the cells were differentiated and since 3T3-L1 preadipocytes express almost no PPARγ compared with mature adipocytes (6), it is very unlikely that the observed rosiglitazone-induced increase in PPARγ occupancy is caused by increased PPARγ occupancy in undifferentiated 3T3-L1 preadipocytes resident within the cultures.
Gene activation by rosiglitazone is associated with increased PPARγ, MED1, and CBP occupancy
To evaluate factor occupancy relative to changes in gene expression we determined for each of the factors the total number of tags in peaks in a 100-kb window centered on the transcription start site (TSS) of all actively transcribed genes. Genes were subsequently grouped according to whether they were transcriptionally induced, repressed, or unchanged by rosiglitazone. To compare differences in occupancies between different groups of genes, we employed Wilcoxon signed-rank and rank-sum tests where appropriate. In the absence of agonist total PPARγ occupancy is highly enriched near genes that are acutely induced compared with genes that are unchanged (P < 2.2 × 10⁻¹⁶) or repressed (P = 5.3 × 10⁻¹¹) by rosiglitazone (Figure 3A). However, repressed genes are also generally more associated with PPARγ than genes that are not affected by rosiglitazone (P = 2.2 × 10⁻¹¹). Similar to PPARγ, total occupancy of C/EBPα is highly associated with genes that are rosiglitazone responsive (P < 2.2 × 10⁻¹⁶) but is not significantly associated with induced genes over repressed genes (Figure 3A). This indicates that both PPARγ and C/EBPα may regulate rosiglitazone-responsive genes, but that high total PPARγ occupancy is a signature of genes that are induced by rosiglitazone. The cofactors MED1 and CBP are also highly enriched near rosiglitazone-responsive genes compared with constitutive genes (P < 2.2 × 10⁻¹⁶), indicating that the rosiglitazone-regulated genes are genes that are highly active in adipocytes (Figure 3A). In response to rosiglitazone there is a further marked increase in total PPARγ (P < 2.2 × 10⁻¹⁶), MED1 (P < 2.2 × 10⁻¹⁶), and CBP (P < 2.2 × 10⁻¹⁶) occupancy near induced genes, whereas genes that are unchanged or repressed by rosiglitazone are only associated with minor increases in PPARγ, MED1, and CBP occupancy (Figure 3A). These data indicate that the increase in PPARγ, MED1, and CBP occupancy are likely to be involved in the acute activation of genes in response to rosiglitazone. Furthermore, because there is no consistent loss of occupancy of PPARγ, C/EBPα, MED1, or CBP near repressed genes, decreased occupancy of these factors is unlikely to play a major role in repression.
Figure 3.

Rosiglitazone Treatment Enhances Total PPARγ, MED1, and CBP Occupancy Near Induced Genes. A, For each expressed gene that either was not affected, induced, or repressed by rosiglitazone the total occupancy of PPARγ, C/EBPα, MED1, and CBP in peaks was determined for a 100-kb window centered on the TSS. B and C, Expressed genes were divided into 10 bins based on their fold change in RNAPII occupancy in response to rosiglitazone (Rosi) treatment. For each bin the mean log2 ratio (Rosi/DMSO) of total factor occupancy of PPARγ (B) and C/EBPα (C) was plotted. The dots represent the means of changes in transcriptional activity (x-axis) and changes in total factor occupancy (y-axis) for all genes in the respective bins. The lines at the x-axis indicate the range of the fold change in transcriptional activity on the genes in each bin.
To further investigate the relationship between changes in PPARγ occupancy and the change in transcriptional activity of nearby genes following rosiglitazone treatment, we correlated the observed changes in gene expression of all genes expressed at a detectable level to changes in total PPARγ binding in a 100-kb window centered on the TSS, and found a positive correlation. This correlation further supports that the rosiglitazone-induced increase in PPARγ occupancy play a direct role in the acute transcriptional activation of genes. To visualize this correlation, we divided all genes into bins based on their fold change in response to rosiglitazone, and plotted the mean fold change in total PPARγ binding intensity associated with genes in each bin (Figure 3B). A similar but much weaker correlation was found for C/EBPα occupancy (Figure 3C). We also investigated gain in PPARγ occupancy at a per site basis and found that PPARγ binding sites near rosiglitazone-induced genes are generally stronger and display a higher fold gain in PPARγ occupancy in response to rosiglitazone compared with PPARγ sites near repressed or unchanged genes (Supplemental Figure 4A). Similar results were obtained for the replicate PPARγ ChIP-seq analysis (Supplemental Figures 3C and 4A). By contrast to PPARγ, C/EBPα binding sites located near repressed genes are generally slightly stronger than those near induced (P = 2.1 × 10⁻³) and unchanged (P = 1.2 × 10⁻³) genes (Supplemental Figure 4B).
These data demonstrate that rosiglitazone-activated PPARγ target genes are characterized by high PPARγ, MED1, and CBP binding. Furthermore, the rosiglitazone-induced increase in PPARγ, MED1, and CBP occupancy is positively correlated with changes in gene expression, indicating that these factors all play a role in mediating the response to the agonist. Notably however, rosiglitazone treatment does not lead to decreased occupancy of PPARγ, C/EBPα, MED1, or CBP near repressed genes, indicating that diminished occupancy of these factors does not contribute to loss of expression.
Rosiglitazone-induced gain in PPARγ occupancy correlates with increase in MED1 recruitment
To gain further insight into the function of putative rosiglitazone-activated enhancers, we asked to what extent gain in PPARγ occupancy was associated with increased MED1 and CBP occupancy. The high intensity (highest intensity quartile) PPARγ binding sites were divided in 2 groups that either did (log2 ratio > 1), or did not (−0.4 < log2 ratio < 0.4) increase PPARγ occupancy in response to rosiglitazone (Figure 4A). CBP occupancy was moderately increased by rosiglitazone at both groups of high intensity PPARγ binding sites (P < 2.2 × 10⁻¹⁶), indicating that the increase in CBP occupancy is independent of gain in PPARγ occupancy. Interestingly however, MED1 occupancy was only increased at the group of PPARγ binding sites gaining PPARγ occupancy (P < 2.2 × 10⁻¹⁶) (Figure 4A). These results indicate that MED1 recruitment in response to rosiglitazone is dependent on increased binding of PPARγ, whereas CBP recruitment is not. Consistent with this, there is a strong positive correlation between changes in PPARγ and MED1 occupancy at PPARγ binding sites co-occupied by MED1 (Figure 4C) but no correlation between changes in PPARγ and CBP occupancy at PPARγ binding sites occupied by CBP (Supplemental Figure 5A).
Figure 4.
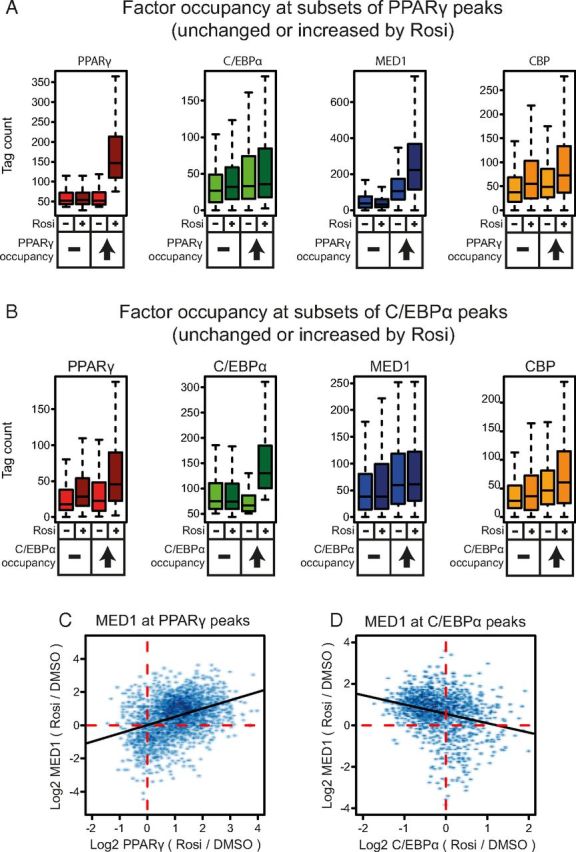
Gain in PPARγ Occupancy Correlates with Recruitment of MED1. A and B, Occupancy of PPARγ, C/EBPα, MED1, and CBP in the presence of 1 μM rosiglitazone or DMSO at PPARγ (A) and C/EBPα (B) binding sites that do, or do not, gain occupancy in response to rosiglitazone (Rosi) treatment. C and D, Scatter plot showing the rosiglitazone-induced fold change in MED1 occupancy plotted against the rosiglitazone-induced fold change in PPARγ (C) and C/EBPα (D) occupancy at high intensity PPARγ and C/EBPα binding sites, respectively. The black lines show the linear regression between plotted values, and the red dotted lines indicate the location of zero at the axis.
We also grouped high-intensity C/EBPα sites depending on whether they do (log2 ratio > 0.6) or do not (−0.25 < log2 ratio < 0.25) gain C/EBPα occupancy in response to rosiglitazone. This showed that neither MED1 nor CBP recruitment seems to be dependent on an increase in C/EBPα occupancy (Figure 4B). In fact, we observed an inverse correlation between changes in C/EBPα and MED1 occupancy at C/EBPα binding sites occupied by MED1 (Figure 4D) and no correlation between changes in CBP and C/EBPα occupancy at C/EBPα binding sites occupied by CBP (Supplemental Figure 5B).
Taken together, these results demonstrate that rosiglitazone treatment leads to increased PPARγ occupancy at a large fraction of the PPARγ binding sites. The recruitment of the receptor per se appears to be a major driving force in recruitment of MED1. By contrast, although CBP is recruited in response to rosiglitazone, the recruitment does not appear to be dependent on increased PPARγ occupancy.
Genes repressed by rosiglitazone are more C/EBPα dependent than rosiglitazone-induced genes
Our data demonstrating that binding of the key adipogenic factors, PPARγ and C/EBPα, are highly enriched near rosiglitazone-regulated genes, prompted us to investigate how these genes are regulated during adipogenesis. To do this we crossed changes in RNAPII occupancy in response to rosiglitazone with our previously published change in RNAPII occupancy during 3T3-L1 adipogenesis (day 0 to day 4) (Figure 5A). As expected, rosiglitazone-induced genes are mainly genes that are induced during adipogenesis (Figure 5B). Interestingly and consistent with the enrichment of PPARγ and C/EBPα binding near genes that are repressed by rosiglitazone, there is a general trend that the repressed genes are also induced during adipogenesis (Figure 5, A and B).
Figure 5.

Genes Regulated by Rosiglitazone in Adipocytes Are Mainly Genes Induced during Adipogenesis. Induced genes are dominated by PPARγ. A, Rosiglitazone-induced changes in transcription of genes as determined by RNAPII occupancy plotted against the fold induction of these genes during 3T3–L1 adipogenesis (Day 4/Day 0) determined in a previous study (6). Red and blue dots indicate genes that are significantly induced or repressed following 1 hour of rosiglitazone (Rosi) treatment, respectively. B, Box plot showing the fold changes in expression during adipogenesis (Day 4/Day 0) for genes that were constitutively expressed, induced, or repressed by 1 hour of rosiglitazone treatment in adipocytes. C, Effect of knockdown of PPARγ and C/EBPα in 3T3–L1 adipocytes. 3T3–L1 adipocytes were differentiated to day 7 and transfected with siRNA. A nontargeting siRNA (siLuc) was used as control. The mRNA levels of selected genes were determined after 24 hours using real-time PCR, and the expression is depicted relative to the expression of TFIIB mRNA. Error bars indicate the SD of 3 parallel biological replicates. Similar results were obtained in 3 independent biological experiments. Genes induced and repressed by rosiglitazone are shown in red, and blue, respectively. D, Number of strong PPARγ and C/EBPα binding sites located within a 100-kb window centered on the TSS of adipocyte genes that are either unaffected, induced, or repressed by 1 hour of rosiglitazone treatment. Error bars indicate the SEM. E and F, The ratios of PPARγ tags relative to C/EBPα tags in peaks associated with adipocyte genes that are induced or repressed by rosiglitazone. The ratio of total PPARγ:C/EBPα tags (E) and the ratio of PPARγ:C/EBPα tags at the strongest PPARγ binding site (F) in a 100-kb window centered at the TSS. G, MED1 occupancy at the strongest PPARγ binding site within a 100-kb window centered on the TSS of each gene unaffected, induced, or repressed by rosiglitazone.
To investigate the relative dependencies of these 2 key adipocyte transcription factors on rosiglitazone-regulated genes in adipocytes, we used siRNA to knock down PPARγ and C/EBPα in mature 3T3-L1 adipocytes. We were able to obtain a 50% knockdown of PPARγ and a 75% knockdown of C/EBPα mRNA by 24 hours postelectroporation (Figure 5C). Knockdown of PPARγ or C/EBPα did not result in gross changes of cell morphology, such as loss of lipid droplets, compared with control cells, as evaluated by phase-contrast microscopy (Supplemental Figure 6). Consistent with previous results (5), C/EBPα mRNA expression is also reduced in response to the PPARγ knockdown, indicating that expression of C/EBPα is highly dependent on PPARγ (Figure 5C). By contrast, PPARγ mRNA expression is not affected by the acute knockdown of C/EBPα expression. We then examined the impact of PPARγ and C/EBPα knockdown on the mRNA expression of selected adipocyte genes that were either acutely induced by rosiglitazone treatment (Pck1, Fabp4, and Cidec [encoding Cell death activator CIDE-3]), or acutely repressed by rosiglitazone (Retn, Rgs2 [encoding regulator of G-protein signaling 2] and Adrb3 [encoding β-3 adrenergic receptor]) (Figure 5C). Knockdown of PPARγ, but not C/EBPα, resulted in a reduction of Fabp4 mRNA, indicating that basal Fabp4 expression is maintained mainly by PPARγ in 3T3-L1 adipocytes. The expression of Pck1 and Cidec mRNA is affected by knockdown of both factors; however, knockdown of PPARγ has the highest impact, thereby indicating that PPARγ is also the main regulator of Pck1 and Cidec expression in mature 3T3-L1 adipocytes. On the contrary, the mRNA expression of the repressed genes Retn and Adrb3 are more affected by C/EBPα knockdown than by PPARγ knockdown, indicating that C/EBPα is a more important regulator of these genes than PPARγ. The exact relative importance of C/EBPα and PPARγ in activation of the genes cannot be determined by such analyses due to differences in the efficiency of the knockdown and the interdependencies of the expression of these 2 key transcription factors. However, these results indicate that rosiglitazone-induced genes are primarily activated by PPARγ in adipocytes, whereas the rosiglitazone-repressed genes are primarily activated by C/EBPα.
To obtain further genome-wide insight into the relative importance of C/EBPα and PPARγ in the regulation of rosiglitazone-induced and -repressed genes, we determined the relative association of these factors with regulated genes. This showed that genes that are induced by rosiglitazone on average have more high-intensity PPARγ binding sites than high-intensity C/EBPα binding sites, whereas genes that are repressed by rosiglitazone have more C/EBPα than PPARγ binding sites (Figure 5D). Further, the ratio of total PPARγ occupancy to C/EBPα occupancy is higher near adipocyte genes induced by rosiglitazone than near genes repressed by rosiglitazone (Figure 5E). This difference in the PPARγ to C/EBPα ratio is also evident when focusing only on the strongest PPARγ binding site for each gene (Figure 5F). The PPARγ:C/EBPα ratio is significantly higher for the strongest PPARγ binding sites near induced compared with repressed genes. Interestingly, although total MED1 occupancy is not reduced near repressed genes (Figure 3A), we detect a small but significant drop in MED1 occupancy at the strongest PPARγ binding site associated with repressed genes (P = 8.7e-3) (Figure 5G), possibly reflecting decreased transcriptional activity of these putative enhancers.
Taken together, our results indicate that rosiglitazone-induced adipocyte genes generally are highly PPARγ-dependent genes, whereas adipocyte genes that are acutely repressed by rosiglitazone are more dependent on C/EBPα.
Discussion
In this report we investigate, for the first time, the acute genome-wide effects of the synthetic PPARγ agonist rosiglitazone on the PPARγ and C/EBPα transcriptionally network in mature mouse adipocytes. Previous genome-wide analyses have indicated that PPARγ is a direct activator of the entire adipocyte gene program rather than a factor that induces a few key downstream targets (2, 48). These analyses also demonstrated a marked overlap between the binding sites of PPARγ and C/EBPα at a genome-wide level (5, 6, 9).
Using RNAPII ChIP-seq to profile acute transcriptional changes, we identify a large number of genes that are transcriptionally activated or repressed by rosiglitazone as early as 1 hour after administration. Both genes that are acutely activated by rosiglitazone as well as genes that are acutely repressed by rosiglitazone are generally genes induced during adipocyte differentiation (Figure 6). Many of the acutely activated genes belong to GO categories involving lipid-metabolizing processes, well in agreement with results from previous microarray studies of PPARγ function (26, 43, 44). Among rosiglitazone-repressed genes that are induced during differentiation, there are few that have previously been documented to be PPARγ target genes such as Retn (49) and Lpl (encoding lipoprotein lipase) (23), but for the majority it is not known how their expression is activated during adipogenesis. We have previously determined putative PPARγ target genes by acute adenoviral expression of PPARγ2 in 3T3-L1 preadipocytes (our unpublished data). Subsequent microarray analyses of gene expression showed a large number of significantly induced and repressed genes (285 and 451, respectively). Interestingly, of the rosiglitazone-repressed genes induced during adipogenesis, only 3 genes (Lpl, Txnip [encoding thioredoxin-interacting protein] and Glul [encoding glutamine synthetase]) are significantly induced by PPARγ overexpression in preadipocytes. Thus, most of the rosiglitazone-repressed genes induced during adipogenesis are not affected by PPARγ overexpression in 3T3-L1 preadipocytes. These genes may not be PPARγ target genes at all, or PPARγ may not be sufficient to induce these genes in a preadipocyte context. In either case, other adipogenic factors (such as C/EBPα) appear to be required to induce these genes during adipogenesis.
Figure 6.

Proposed Model: PPARγ- and C/EBPα-Dominated Genes in Adipocytes Are Acutely Induced or Repressed by Rosiglitazone, Respectively. Genes acutely induced or repressed by rosiglitazone (Rosi) in 3T3–L1 adipocytes are mainly genes induced during adipocyte differentiation. In mature adipocytes in the absence of synthetic PPARγ agonists, both groups of genes are associated with PPARγ and C/EBPα, and with the coactivators MED1 and CBP. However, the rosiglitazone-induced genes have higher PPARγ occupancy and a higher PPARγ:C/EBPα ratio than repressed genes, as well as higher occupancy of MED1 and CBP. Upon rosiglitazone treatment, PPARγ, MED1, and CBP occupancies are increased, in particular near rosiglitazone-induced genes. The gain in MED1 occupancy is particularly prominent at rosiglitazone-enhanced PPARγ binding sites. RXR, retinoid X receptor.
Several studies have shown that long-term treatment with PPARγ agonists induce browning of white adipocytes in culture (18–20). Notably however, we do not detect any of the genes previously reported to be involved in browning of adipocytes to be acutely induced by rosiglitazone, indicating that these genes are induced, at least in part, by indirect mechanisms that involve induction of other transcription factors or cofactors.
It has been unclear to what extent binding of PPARs to chromatin is sensitive to agonists. The determination of ligand dependency of PPAR association with chromatin is complicated by the fact that PPARs are activated by a large variety of endogenous fatty acids and fatty acid derivatives (50). Many other nuclear receptors are known to significantly increase both the number and intensity of binding sites in response to agonist, including liver X receptor (51), estrogen receptor α (52, 53), androgen receptor (54, 55), glucocorticoid receptor (56, 57), and vitamin D receptor (58, 59). We have previously reported that synthetic agonists increase the occupancy of ectopically expressed PPARs in a fibroblast setting (34). However, under such conditions PPARs need to gain access to new target sites in the fibroblast chromatin context, which lacks many adipocyte transcription factors. It is therefore possible that the association of PPAR with chromatin at sites that need to be remodeled is more dependent on agonist. Here we show that PPARγ occupancy at existing target sites in adipocytes is indeed acutely enhanced in response to the potent agonist rosiglitazone. This increase is particularly evident when analyzed at a genome-wide level.
The genome-wide approach furthermore allows us to demonstrate a significant correlation between changes in PPARγ and MED1 occupancy and the increase in transcriptional activity of nearby genes, indicating that increased PPARγ and MED1 recruitment is causally involved in the activation of nearby genes (Figure 6). Interestingly, our data also show that MED1 recruitment correlates with increased PPARγ occupancy, indicating that PPARγ occupancy per se may be rate limiting for recruitment of the Mediator in response to rosiglitazone.
Importantly, our data also show that PPARγ binding sites are associated with MED1 and CBP even in the absence of rosiglitazone. It is likely that the binding and activity of PPARγ in the absence of rosiglitazone is dependent on endogenous ligands in the adipocytes, however it is important to note that PPARγ N-terminal contains a ligand-independent activation function, which have been shown to be able to recruit CBP (26). In addition, PPARγ has been shown to retain the adipogenic potential even without a functional ligand-binding domain (60). This demonstrates that PPARγ is transcriptionally active in adipocytes also in the absence of agonist binding.
The rosiglitazone-regulated genes, whether activated or repressed, are generally genes that are induced during adipocyte differentiation. Consistent with this, these genes are also significantly more associated with PPARγ and C/EBPα as well as the cofactors CBP and MED1 in the absence of rosiglitazone compared with nonregulated genes. The rosiglitazone-induced genes are characterized by being particularly highly associated with PPARγ binding, and expression in adipocytes of the ones we tested was very dependent on PPARγ. By contrast, the rosiglitazone-repressed genes have a higher C/EBPα:PPARγ ratio and are more dependent on C/EBPα (Figure 6).
The negative effect of rosiglitazone on a subset of adipocyte genes, many of which appear to be highly dependent on C/EBPα, is intriguing. C/EBPα occupancy is increased in response to rosiglitazone near induced genes, indicating a cooperative function between PPARγ and C/EBPα. Yet a high dependence on C/EBPα relative to PPARγ seems to be a predictor of repression by rosiglitazone. Hints to a negative cross-talk between C/EBPα and PPARγ were first provided by Lowell and Hollenburg et al. (61), who demonstrated that PPARγ antagonized the transactivation of the leptin promoter by C/EBPα in transient transfections, whereas C/EBPα antagonized the transactivation of the Fabp4 promoter/enhancer by PPARγ. Whereas the relevance of suppression of the Fabp4 promoter is controversial (62, 63), the suppression of leptin by PPARγ agonist is well documented (29, 31). Recently, Farmer and colleagues (19) provided important evidence that C/EBPα is required for the ability of TZDs to repress adipocyte genes in mature adipocytes over a time window of 2 days. These studies did not address whether C/EBPα is directly involved in the TZD repression or whether C/EBPα is involved in maintaining transcriptional activity of these genes that can then be repressed by a TZD-induced mechanism. Our study indicates that the latter is the case, because we found no evidence that C/EBPα in itself becomes repressive by rosiglitazone treatment, and because the repressed genes are highly C/EBPα dependent. The mechanism of repression remains to be determined but is likely dependent on the binding of other factors or combinations of factors. Our data indicate that repression does not involve major changes in the occupancy of PPARγ, C/EBPα, MED1, or CBP.
In conclusion, we have shown that rosiglitazone treatment of adipocytes leads to an acute increase in PPARγ occupancy at many target sites and that this increase correlates with increased transcription of neighboring genes. This indicates that the increase in PPARγ occupancy per se plays a role in the rosiglitazone response of adipocytes. Our data suggest that this increase in PPARγ occupancy promotes transcription, in part, by increasing MED1 recruitment. This identifies a subset of PPARγ biding sites in mature adipocytes that are particularly sensitive to rosiglitazone treatment. It remains an open question why some adipocyte genes that are associated with PPARγ are acutely induced whereas other genes are acutely repressed by rosiglitazone. However, our data indicate that high density of PPARγ binding near the TSS is predictive of rosiglitazone-induced genes, whereas genes that are repressed by rosiglitazone appear to rely more on C/EBPα for expression in adipocytes. Whether this difference involves a negative cross-talk between rosiglitazone-bound PPARγ and C/EBP-dominated enhancers will be an important question for the future.
Acknowledgments
We thank the members of the Mandrup laboratory for fruitful discussions and Per Sauerberg (Novo Nordisk A/S), for the kind gift of rosiglitazone.
This work was supported by grants from the Danish Independent Research Council | Natural Sciences and the Novo Nordisk Foundation.
Disclosure Summary: The authors have nothing to disclose.
Footnotes
- CBP
- CREB-binding protein
- C/EBPα
- CCAAT-enhancer binding protein
- ChIP
- chromatin immunoprecipitation
- ChIP-seq
- ChIP sequencing
- CREB
- cAMP-responsive element-binding protein 1
- DMSO
- dimethylsulfoxide
- FABP
- fatty acid-binding protein
- FDR
- false discovery rate
- GO
- gene ontology
- MED1
- mediator subunit 1
- PPAR
- peroxisome proliferator-activated receptor
- RNAPII
- RNA polymerase II
- siRNA
- small interfering RNA
- TF
- transcription factor
- TSS
- transcriptional start site
- TZD
- thiazolidinedione.
References
- 1. Farmer SR. Transcriptional control of adipocyte formation. Cell Metab. 2006;4:263–173. [DOI] [PMC free article] [PubMed] [Google Scholar]
- 2. Cristancho A , Lazar MA. Forming functional fat: a growing understanding of adipocyte differentiation. Nat Rev Mol Cell Biol. 2011;12:722–734. [DOI] [PMC free article] [PubMed] [Google Scholar]
- 3. Siersbæk R , Nielsen R , Mandrup S. Transcriptional networks and chromatin remodeling controlling adipogenesis. Trends Endocrinol Metab. 2012;23:56–64. [DOI] [PubMed] [Google Scholar]
- 4. Tontonoz P , Spiegelman BM. Fat and beyond: the diverse biology of PPARγ. Annu Rev Biochem. 2008;77:289–312. [DOI] [PubMed] [Google Scholar]
- 5. Lefterova MI , Zhang Y , Steger DJ, et al. . PPARγ and C/EBP factors orchestrate adipocyte biology via adjacent binding on a genome-wide scale. Genes Dev. 2008;22:2941–2952. [DOI] [PMC free article] [PubMed] [Google Scholar]
- 6. Nielsen R , Pedersen TA , Hagenbeek D, et al. . Genome-wide profiling of PPARγ:RXR and RNA polymerase II occupancy reveals temporal activation of distinct metabolic pathways and changes in RXR dimer composition during adipogenesis. Genes Dev. 2008;22:2953–2967. [DOI] [PMC free article] [PubMed] [Google Scholar]
- 7. Hamza M , Pott S , Vega V, et al. . De-novo identification of PPARγ/RXR binding sites and direct targets during adipogenesis. PLoS One. 2009;4. [DOI] [PMC free article] [PubMed] [Google Scholar]
- 8. Mikkelsen TS , Xu Z , Zhang X, et al. . Comparative epigenomic analysis of murine and human adipogenesis. Cell. 2010;143:156–169. [DOI] [PMC free article] [PubMed] [Google Scholar]
- 9. Schmidt SF , Jørgensen M , Chen Y , Nielsen R , Sandelin A , Mandrup S. Cross species comparison of C/EBPα and PPARγ profiles in mouse and human adipocytes reveals interdependent retention of binding sites. BMC Genomics. 2011;12:152. [DOI] [PMC free article] [PubMed] [Google Scholar]
- 10. Wu Z , Xie Y , Bucher NL , Farmer SR. Conditional ectopic expression of C/EBP β in NIH-3T3 cells induces PPAR γ and stimulates adipogenesis. Genes Dev. 1995;9:2350–2363. [DOI] [PubMed] [Google Scholar]
- 11. El-Jack AK , Hamm JK , Pilch PF , Farmer SR. Reconstitution of insulin-sensitive glucose transport in fibroblasts requires expression of both PPARγ and C/EBPα. J Biol Chem. 1999;274:7946–7951. [DOI] [PubMed] [Google Scholar]
- 12. Olswang Y , Blum B , Cassuto H, et al. . Glucocorticoids repress transcription of phosphoenolpyruvate carboxykinase (GTP) gene in adipocytes by inhibiting its C/EBP-mediated activation. J Biol Chem. 2003;278:12929–12936. [DOI] [PubMed] [Google Scholar]
- 13. Qiao L , Maclean PS , Schaack J, et al. . C/EBPα regulates human adiponectin gene transcription through an intronic enhancer. Diabetes. 2005;54:1744–1754. [DOI] [PubMed] [Google Scholar]
- 14. Cariou B , Charbonnel B , Staels B. Thiazolidinediones and PPARγ agonists: time for a reassessment. Trends Endocrinol Metab. 2012;23:205–215. [DOI] [PubMed] [Google Scholar]
- 15. Ribon V , Johnson JH , Camp HS , Saltiel AR. Thiazolidinediones and insulin resistance: peroxisome proliferator activated receptor γ activation stimulates expression of the CAP gene. Proc Natl Acad Sci USA. 1998;95:14751–14756. [DOI] [PMC free article] [PubMed] [Google Scholar]
- 16. Smith U , Gogg S , Johansson A , Olausson T , Rotter V , Svalstedt B. Thiazolidinediones (PPARγ agonists) but not PPARα agonists increase IRS-2 gene expression in 3T3–L1 and human adipocytes. FASEB J. 2001;15:215–220. [DOI] [PubMed] [Google Scholar]
- 17. Sell H , Deshaies Y , Richard D. The brown adipocyte: update on its metabolic role. Int J Biochem Cell Biol. 2004;36:2098–2104. [DOI] [PubMed] [Google Scholar]
- 18. Elabd C , Chiellini C , Carmona M, et al. . Human multipotent adipose-derived stem cells differentiate into functional brown adipocytes. Stem Cells. 2009;27:2753–2760. [DOI] [PubMed] [Google Scholar]
- 19. Vernochet C , Peres SB , Davis KE, et al. . C/EBPα and the corepressors CtBP1 and CtBP2 regulate repression of select visceral white adipose genes during induction of the brown phenotype in white adipocytes by peroxisome proliferator-activated receptor γ agonists. Mol Cell Biol. 2009;29:4714–4728. [DOI] [PMC free article] [PubMed] [Google Scholar]
- 20. Petrovic N , Walden TB , Shabalina IG , Timmons JA , Cannon B , Nedergaard J. Chronic peroxisome proliferator-activated receptor γ (PPARγ) activation of epididymally derived white adipocyte cultures reveals a population of thermogenically competent, UCP1-containing adipocytes molecularly distinct from classic brown adipocytes. J Biol Chem. 2010;285:7153–7164. [DOI] [PMC free article] [PubMed] [Google Scholar]
- 21. Tontonoz P , Hu E , Graves RA , Budavari AI , Spiegelman BM. mPPAR γ 2: tissue-specific regulator of an adipocyte enhancer. Genes Dev. 1994;8:1224–1234. [DOI] [PubMed] [Google Scholar]
- 22. Tontonoz P , Hu E , Devine J , Beale EG , Spiegelman BM. PPAR γ 2 regulates adipose expression of the phosphoenolpyruvate carboxykinase gene. Mol Cell Biol. 1995;15:351–357. [DOI] [PMC free article] [PubMed] [Google Scholar]
- 23. Schoonjans K , Peinado-Onsurbe J , Lefebvre AM , Heyman RA , Briggs M , Deeb S , Staels B , Auwerx J. PPARα and PPARγ activators direct a distinct tissue-specific transcriptional response via a PPRE in the lipoprotein lipase gene. EMBO J. 1996;15:5336–5348. [PMC free article] [PubMed] [Google Scholar]
- 24. Helledie T , Grøntved L , Jensen SS, et al. . The gene encoding the Acyl-CoA-binding protein is activated by peroxisome proliferator-activated receptor γ through an intronic response element functionally conserved between humans and rodents. J Biol Chem. 2002;277:26821–26830. [DOI] [PubMed] [Google Scholar]
- 25. Arimura N , Horiba T , Imagawa M , Shimizu M , Sato R. The peroxisome proliferator-activated receptor γ regulates expression of the perilipin gene in adipocytes. J Biol Chem. 2004;279:10070–10076. [DOI] [PubMed] [Google Scholar]
- 26. Bugge A , Grøntved L , Aagaard MM , Borup R , Mandrup S. The PPARγ2 A/B-domain plays a gene-specific role in transactivation and cofactor recruitment. Mol Endocrinol. 2009;23:794–808. [DOI] [PMC free article] [PubMed] [Google Scholar]
- 27. Camp HS , Whitton AL , Tafuri SR. PPARγ activators down-regulate the expression of PPARγ in 3T3–L1 adipocytes. FEBS Lett. 1999;447:186–190. [DOI] [PubMed] [Google Scholar]
- 28. Perrey S , Ishibashi S , Yahagi N, et al. . Thiazolidinedione- and tumor necrosis factor α-induced downregulation of peroxisome proliferator-activated receptor γ mRNA in differentiated 3T3–L1 adipocytes. Metabolism. 2001;50:36–40. [DOI] [PubMed] [Google Scholar]
- 29. Kallen CB , Lazar MA. Antidiabetic thiazolidinediones inhibit leptin (ob) gene expression in 3T3–L1 adipocytes. Proc Natl Acad Sci USA. 1996;93:5793–5796. [DOI] [PMC free article] [PubMed] [Google Scholar]
- 30. Hartman HB , Hu X , Tyler KX , Dalal CK , Lazar MA. Mechanisms regulating adipocyte expression of resistin. J Biol Chem. 2002;277:19754–19761. [DOI] [PubMed] [Google Scholar]
- 31. De Vos P , Lefebvre AM , Miller SG, et al. . Thiazolidinediones repress ob gene expression in rodents via activation of peroxisome proliferator-activated receptor γ. J Clin Invest. 1996;98:1004–1009. [DOI] [PMC free article] [PubMed] [Google Scholar]
- 32. Bakopanos E , Silva JE. Thiazolidinediones inhibit the expression of beta3-adrenergic receptors at a transcriptional level. Diabetes. 2000;49:2108–2115. [DOI] [PubMed] [Google Scholar]
- 33. Hansen JB , Petersen RK , Larsen BM , Bartkova J , Alsner J , Kristiansen K. Activation of peroxisome proliferator-activated receptor γ bypasses the function of the retinoblastoma protein in adipocyte differentiation. J Biol Chem. 1999;274:2386–2393. [DOI] [PubMed] [Google Scholar]
- 34. Nielsen R , Grøntved L , Stunnenberg HG , Mandrup S. Peroxisome proliferator-activated receptor subtype- and cell-type-specific activation of genomic target genes upon adenoviral transgene delivery. Mol Cell Biol. 2006;26:5698–5714. [DOI] [PMC free article] [PubMed] [Google Scholar]
- 35. Siersbæk MS , Loft A , Aagaard MM, et al. . Genome-wide profiling of peroxisome proliferator-activated receptor γ in primary epididymal, inguinal, and brown adipocytes reveals depot-selective binding correlated with gene expression. Mol Cell Biol. 2012;32:3452–3463. [DOI] [PMC free article] [PubMed] [Google Scholar]
- 36. Langmead B , Trapnell C , Pop M , Salzberg SL. Ultrafast and memory-efficient alignment of short DNA sequences to the human genome. Genome Biol. 2009;10:R25. [DOI] [PMC free article] [PubMed] [Google Scholar]
- 37. Heinz S , Benner C , Spann N, et al. . Simple combinations of lineage-determining transcription factors prime cis-regulatory elements required for macrophage and B cell identities. Mol Cell. 2010;38:576–589. [DOI] [PMC free article] [PubMed] [Google Scholar]
- 38. Robinson MD , McCarthy DJ , Smyth GK. edgeR: a Bioconductor package for differential expression analysis of digital gene expression data. Bioinformatics. 2010;26:139–140. [DOI] [PMC free article] [PubMed] [Google Scholar]
- 39. Young MD , Wakefield MJ , Smyth G , Oshlack A. Gene ontology analysis for RNA-seq: accounting for selection bias. Genome Biol. 2010;11:R14. [DOI] [PMC free article] [PubMed] [Google Scholar]
- 40. Okada S , Mori M , Pessin JE. Introduction of DNA into 3T3–L1 adipocytes by electroporation. Methods Mol Med. 2003;83:93–96. [DOI] [PubMed] [Google Scholar]
- 41. Gerhold DL , Liu F , Jiang G, et al. . Gene expression profile of adipocyte differentiation and its regulation by peroxisome proliferator-activated receptor-γ agonists. Endocrinology. 2002;143:2106–2118. [DOI] [PubMed] [Google Scholar]
- 42. Berger JP , Petro AE , Macnaul KL, et al. . Distinct properties and advantages of a novel peroxisome proliferator-activated protein γ selective modulator. Mol Endocrinol. 2003;17:662–676. [DOI] [PubMed] [Google Scholar]
- 43. Wang P , Renes J , Bouwman F , Bunschoten A , Mariman E , Keijer J. Absence of an adipogenic effect of rosiglitazone on mature 3T3–L1 adipocytes: increase of lipid catabolism and reduction of adipokine expression. Diabetologia. 2007;50:654–665. [DOI] [PMC free article] [PubMed] [Google Scholar]
- 44. Sears DD , Hsiao A , Ofrecio JM , Chapman J , He W , Olefsky JM. Selective modulation of promoter recruitment and transcriptional activity of PPARγ. Biochem Biophys Res Commun. 2007;364:515–521. [DOI] [PMC free article] [PubMed] [Google Scholar]
- 45. Steppan CM , Bailey ST , Bhat S, et al. . The hormone resistin links obesity to diabetes. Nature. 2001;409:307–312. [DOI] [PubMed] [Google Scholar]
- 46. Visel A , Blow MJ , Li Z, et al. . ChIP-seq accurately predicts tissue-specific activity of enhancers. Nature. 2009;457:854–858. [DOI] [PMC free article] [PubMed] [Google Scholar]
- 47. Kagey MH , Newman JJ , Bilodeau S, et al. . Mediator and cohesin connect gene expression and chromatin architecture. Nature. 2010;467:430–435. [DOI] [PMC free article] [PubMed] [Google Scholar]
- 48. Siersbæk R , Nielsen R , Mandrup S. PPARγ in adipocyte differentiation and metabolism—novel insights from genome-wide studies. FEBS Lett. 2010;584:3242–3249. [DOI] [PubMed] [Google Scholar]
- 49. Tomaru T , Steger DJ , Lefterova MI , Schupp M , Lazar MA. Adipocyte-specific expression of murine resistin is mediated by synergism between peroxisome proliferator-activated receptor γ and CCAAT/enhancer-binding proteins. J Biol Chem. 2009;284:6116–6125. [DOI] [PMC free article] [PubMed] [Google Scholar]
- 50. Schupp M , Lazar M. Endogenous ligands for nuclear receptors: digging deeper. J Biol Chem. 2010;285:40409–40415. [DOI] [PMC free article] [PubMed] [Google Scholar]
- 51. Boergesen M , Pedersen TÅ , Gross B, et al. . Genome-wide profiling of liver X receptor, retinoid X receptor, and peroxisome proliferator-activated receptor α in mouse liver reveals extensive sharing of binding sites. Mol Cell Biol. 2012;32:852–867. [DOI] [PMC free article] [PubMed] [Google Scholar]
- 52. Kininis M , Chen BS , Diehl AG, et al. . Genomic analyses of transcription factor binding, histone acetylation, and gene expression reveal mechanistically distinct classes of estrogen-regulated promoters. Mol Cell Biol. 2007;27:5090–5104. [DOI] [PMC free article] [PubMed] [Google Scholar]
- 53. Welboren WJ , van Driel MA , Janssen-Megens EM, et al. . ChIP-Seq of ERα and RNA polymerase II defines genes differentially responding to ligands. EMBO J. 2009;28:1418–1428. [DOI] [PMC free article] [PubMed] [Google Scholar]
- 54. Wang Q , Li W , Liu X, et al. . A hierarchical network of transcription factors governs androgen receptor-dependent prostate cancer growth. Mol Cell. 2007;27:380–392. [DOI] [PMC free article] [PubMed] [Google Scholar]
- 55. Wyce A , Bai Y , Nagpal S , Thompson C. Research Resource: The androgen receptor modulates expression of genes with critical roles in muscle development and function. Mol Endocrinol. 2010;24:1665–1674. [DOI] [PMC free article] [PubMed] [Google Scholar]
- 56. Reddy TE , Pauli F , Sprouse RO, et al. . Genomic determination of the glucocorticoid response reveals unexpected mechanisms of gene regulation. Genome Res. 2009;19:2163–2171. [DOI] [PMC free article] [PubMed] [Google Scholar]
- 57. John S , Sabo PJ , Thurman RE, et al. . Chromatin accessibility pre-determines glucocorticoid receptor binding patterns. Nat Genet. 2011;43:264–268. [DOI] [PMC free article] [PubMed] [Google Scholar]
- 58. Ramagopalan SV , Heger A , Berlanga AJ, et al. . A ChIP-seq defined genome-wide map of vitamin D receptor binding: associations with disease and evolution. Genome Res. 2010;20:1352–1360. [DOI] [PMC free article] [PubMed] [Google Scholar]
- 59. Heikkinen S , Väisänen S , Pehkonen P , Seuter S , Benes V , Carlberg C. Nuclear hormone 1α,25-dihydroxyvitamin D3 elicits a genome-wide shift in the locations of VDR chromatin occupancy. Nucleic Acids Res. 2011;39:9181–9193. [DOI] [PMC free article] [PubMed] [Google Scholar]
- 60. Walkey CJ , Spiegelman BM. A functional peroxisome proliferator-activated receptor-γ ligand-binding domain is not required for adipogenesis. J Biol Chem. 2008;283:24290–24294. [DOI] [PMC free article] [PubMed] [Google Scholar]
- 61. Hollenberg AN , Susulic VS , Madura JP, et al. . Functional antagonism between CCAAT/Enhancer binding protein-α and peroxisome proliferator-activated receptor-γ on the leptin promoter. J Biol Chem. 1997;272:5283–5290. [DOI] [PubMed] [Google Scholar]
- 62. Christy RJ , Yang VW , Ntambi JM, et al. . Differentiation-induced gene expression in 3T3–L1 preadipocytes: CCAAT/enhancer binding protein interacts with and activates the promoters of two adipocyte-specific genes. Genes Dev. 1989;3:1323–1335. [DOI] [PubMed] [Google Scholar]
- 63. Ross SR , Graves RA , Greenstein A, et al. . A fat-specific enhancer is the primary determinant of gene expression for adipocyte P2 in vivo. Proc Natl Acad Sci USA. 1990;87:9590–9594. [DOI] [PMC free article] [PubMed] [Google Scholar]