

Abstract
We present SplashRNA, a sequential classifier to predict potent microRNA-based short hairpin RNAs (shRNAs). Trained on published and novel datasets, SplashRNA outperforms previous algorithms and reliably predicts the most efficient shRNAs for a given gene. Combined with an optimized miR-E backbone, >90% of high-scoring SplashRNA predictions trigger >85% protein knockdown when expressed from a single genomic integration. SplashRNA can significantly improve the accuracy of loss-of-function genetics studies and facilitates the generation of compact shRNA libraries.
Experimental RNA interference (RNAi) acts by providing exogenous sources of double-stranded RNA that mimic endogenous triggers and enable reversible, transcript-specific gene knockdown1. While short interfering RNAs (siRNAs) allow for rapid gene knockdown, they are unfit for many long-term and in vivo studies due to their transient nature. Stem-loop short hairpin RNAs (shRNAs) can be used as a continuous source of RNAi triggers when expressed from suitable vectors, but suffer from various technical limitations including inaccurate processing2 and off-target effects through saturation of the endogenous microRNA machinery3–5. State-of-the-art microRNA-based shRNA vectors can overcome these limitations by providing a natural substrate of the RNAi pathway that is accurately and efficiently processed6–9, resulting in minimal or no off-target effects when expressed from a single genomic integration (single-copy)10,11. Still, our limited understanding of RNAi processing requirements and lack of robust algorithms for the design of microRNA-based shRNAs with high potency and low off-target activity has hampered the utility of RNAi tools.
To understand the sequence requirements of potent RNAi and identify efficient microRNA-based shRNAs for any gene, we previously developed a functional high-throughput “Sensor” assay that enables biological assessment of tens of thousands of shRNAs in parallel (Sup Figure S1a)10. We used this assay to generate focused and genome-wide shRNA libraries11,12. Furthermore, to increase the potency of all shRNAs, especially when expressed at single-copy, we established “miR-E”7, an optimized microRNA backbone that boosts processing efficiency7,13 and leads to stronger target knockdown when compared to standard miR-30 designs7.
To build an accurate miR-E shRNA predictor, here we developed “SplashRNA”, a sequential learning algorithm combining two support vector machine (SVM) classifiers trained on judiciously integrated datasets (Sup Table S1). SplashRNA models the sequential advances in shRNA technology to enable efficient learning on unbiased and biased data (Figure 1a, b). To train the algorithm, we generated a large-scale miR-30 dataset (referred to as “M1”, Sup Figure S1b-f) and a miR-E dataset (referred to as “miR-E”, Sup Figure S1g) using our RNAi Sensor and reporter assays, respectively (Sup Table S2, Methods)7,10. We also used the previously published TILE10 and UltramiR12 sets. TILE is unbiased as it was generated by complete tiling of nine genes. By contrast, M1, miR-E and UltramiR are based on preselected input libraries showing biased coverage of the sequence space and divergence in the nucleotide composition of potent shRNAs (Sup Figure S1h). Yet, together these data sets comprehensively sample the distributions of features of non-functional and functional shRNAs. Effective integration of all sets is thus crucial for efficient miR-E shRNA prediction.
Figure 1.
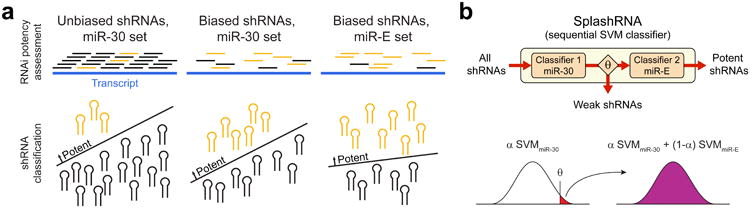
Computational modeling of advancements in shRNA technology.
(a) Sequential advances in shRNA dataset development. The schematic shows diverse biological shRNA potency datasets and their feature and class label distribution biases. Unbiased large-scale sets include a comprehensive representation of negatives but contain few positives (left panel). Sets selected using prediction tools show higher rates of positives, leading to a more complete representation of this class, at the cost of changing the feature distribution of the negatives (middle panel). Use of the optimized miR-E backbone that boosts primary microRNA processing changes the requirements for potent RNAi, altering the target prediction rule (right panel).
(b) Concept and equation of SplashRNA. We model the advancement in shRNA technology as a sequential support vector machine (SVM) classifier. The first classifier is trained on miR-30 data to remove non-functional sequences and the second classifier is trained on miR-E data to increase prediction performance of the remaining shRNAs. The final output is a weighted combination of the scores from both classifiers.
Combining diverse datasets presents a machine learning challenge. Our approach of using a sequential classifier stems from classification strategies used in face detection14,15, where a first classifier evaluates simple face-like features to reject obvious non-faces and a second classifier evaluates refined features on retained potential faces. Similarly, SplashRNA contains a sequence of two SVM classifiers trained on miR-30 and miR-E data. The miR-30 classifier evaluates shRNA sequence features to reject obvious non-functional shRNAs, whereas the miR-E classifier evaluates refined sequence features for retained, potentially potent shRNAs (Figure 1b, Sup Figure S2a). Each classifier is composed of a combination of k-mer feature representations16,17. To capture AU content and position-specific k-mer features10, we represented an shRNA as a sum of a spectrum kernel on sequence positions 1-15, a spectrum kernel on sequence positions 16-22 and a weighted degree kernel on the entire sequence (Sup Figure S2b, Methods). We found that this kernel combination yields the best performance (Sup Figure S2c, d).
Initially we trained the miR-30 classifier on the combined positives and negatives from the TILE and M1 sets (Sup Table S1). This yielded a classifier that scored well in validation tests but was outperformed by one trained on TILE alone (Sup Figure S2e, f). The M1 negatives deteriorated the performance due to their biased selection and lowered the relative importance of the unbiased TILE negatives. Consequently, our best miR-30 classifier (SplashmiR-30) was obtained by training on a combined dataset of TILE and M1 positives (Sup Figure S2f-h). The miR-E classifier (SplashmiR-E) was trained on the miR-E + UltramiR datasets using the same kernel combination (Methods). For the final SplashRNA predictor, SplashmiR-30 and SplashmiR-E were combined by tuning the two hyperparameters theta (above which predictions are passed to the second classifier) and alpha (the relative weighting of the scores from the two classifiers, Figure 1b). We calculated the precision-recall trade-off between the two classifiers and chose a theta and alpha that maintain the high performance of the first classifier while also predicting well on miR-E data. This sequential classification strategy outperformed linear convex classifiers on our datasets (Sup Figure S3a-c).
When tested on miR-30 (Figure 2a, Sup Figure S4a-c) and miR-E (Figure 2b, Sup Figure S4d) datasets, SplashRNA clearly outperformed DSIR18, the current reference algorithm in the field (originally developed for siRNA design). SplashRNA also outperformed the miR-30 based shERWOOD algorithm on the UltramiR set (Sup Figure S4e), compared to its published maximum performance12. Additionally, SplashRNA consistently showed the highest predictive performance on independent datasets when benchmarked against DSIR and two other shRNA prediction tools, sequence score19 (seqScore) and miR_Scan20.
Figure 2.
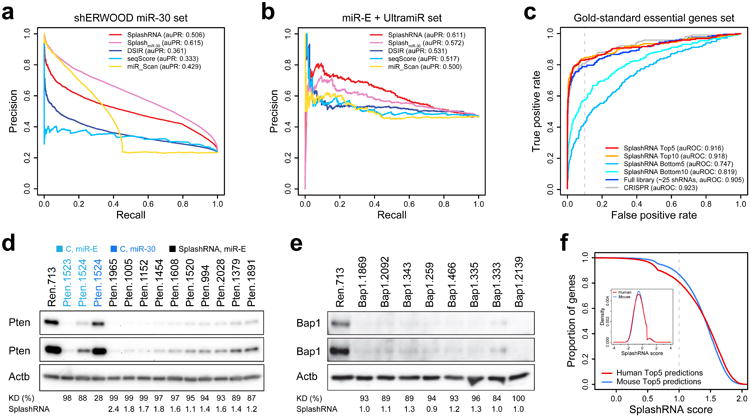
Benchmarking SplashRNA prediction performance.
(a) Precision-recall curves of SplashRNA performance on the external shERWOOD miR-30 dataset. The first classifier alone, SplashmiR-30 (area under the precision-recall curve, auPR: 0.615), shows the best performance. SplashRNA (area under the precision-recall curve, auPR: 0.506) compromises slightly on miR-30 data to increase prediction accuracy on miR-E shRNAs (b), while still outperforming three other si/shRNA prediction tools (DSIR, seqScore, miR_Scan).
(b) SplashRNA performance on miR-E data. SplashRNA (auPR: 0.611) clearly outperforms the miR-30 classifier alone (auPR: 0.572) as well as three other prediction tools.
(c) Identification of “gold-standard” essential genes. The hit detection accuracy of top SplashRNA predictions was compared to larger sets of shRNAs and to CRISPR tools. Prediction performance as measured by the area under the receiver operating characteristic (auROC) curve indicates that the accuracy of the top 10 SplashRNA predictions is no different than the performance obtained by testing 25 shRNAs (the entire library). Additionally, the 10 top scoring shRNAs are significantly better predictors of the gold-standard genes set than the 10 bottom scoring shRNAs by SplashRNA (p < 0.001, empirical permutation test) and the bottom 5 SplashRNA predictions have lesser predictive value than the bottom 10 (auROC: 0.747 vs. 0.819, respectively). The dashed line represents the 10% false positive rate (FPR) threshold.
(d-e) Western blot validation of de novo SplashRNA predictions. All shRNAs were expressed using LEPG at single-copy conditions. β-Actin (Actb) was used for normalization. Short (top) and long (bottom) exposures are shown. Immunoblotting of (d) Pten (median knockdown 96%, median score 1.60) and (e) Bap1 (median knockdown 93%, median score 1.05) in NIH/3T3s (Sup Figure 6i). C, miR-30 and miR-E control shRNAs.
(f) Score distribution of fifth highest SplashRNA predictions for all human and mouse genes, indicating the proportion of genes with 5 predictions above a given score. Predictions were run only on the intersection of all transcript variants per gene and after shortening of transcripts due to ApA. The inset shows the score distribution of all human and mouse SplashRNA predictions. The kink in the curves represents the transition from SplashmiR-30 to combined SplashRNA scores. At least 80% of genes have five shRNAs with prediction scores above 1.
We also observed the high performance of SplashRNA on two large-scale biological RNAi screens19,21 run with shRNAs functionally equivalent to miR-E (Sup Figure S4f, g)22 and testing approximately 25 preselected shRNAs per gene. In both cases, SplashRNA was able to retrospectively predict which shRNAs were potent and thus were enriched or depleted in the positive or negative selection screen, respectively. SplashRNA achieved the most significant difference in potency between its top five and bottom five predictions per targeted gene and was the only algorithm to reach significance in both screens (p < 0.01, one-sided Wilcoxon rank sum test). Top SplashRNA predictions also showed equally good or better accuracy compared to larger sets of preselected shRNAs when tested on a subset of the negative-selection screen including only a previously established set of “gold-standard” essential genes21,23. The top ten SplashRNA predictions identified true positives significantly better than the bottom ten (p < 0.001, empirical permutation test), minimizing off-target hit identification (Figure 2c).
Robust shRNA prediction starts with the selection of the right transcript region. Analyses of unbiased TILE data showed that efficient shRNAs are more prevalent in 3′UTRs compared to coding sequences and 5′UTRs (Sup Figure S5a), likely due to the shared high AU content (Sup Figure S5b-d)10. Whereas 3′UTRs often present ample design space because of their lengths, when validating top predictions in mouse fibroblasts, many shRNAs targeting the distal end of Pten resulted in minimal or no protein knockdown (Sup Figure S5e, Sup Table S2). Inspection of the Pten mRNA (NCBI, NM_008960) revealed that all these shRNAs target regions past alternative cleavage and polyadenylation (ApA) signals, which lead to shorter transcript variants24 lacking the respective target sites (Sup Figure S5f). Hence, to eliminate ApA as a source of non-functional shRNAs, we used ApA atlases25,26 to annotate the human and mouse reference transcriptomes (NCBI) and discard 3′UTR portions that may be absent due to ApA. Similarly, we report predictions only on the intersection of all transcript variants for each gene and filter multi-matching sequences (Methods).
Testing an extensive set of individual de novo predictions targeting Pten, Bap1, Pbrm1, Rela, Bcl2l11, Axin1, NF2 and Cd9 (Sup Table S2) under single-copy conditions7 by conventional western blotting (Figure 2d, e, Sup Figure S6a-f) or flow cytometry based immunofluorescence of surface proteins (Sup Figure S6g), we found that protein knockdown levels were very high: 91% of predictions (41/45) with a SplashRNA score of >1 showed more than 85% protein knockdown (Sup Figure S6h). Even in the case of human NF2, a gene with nine annotated transcript variants that share only 198 nucleotides (excluding the 5′UTR, Sup Figure S6e), the top 8 SplashRNA predictions triggered 77-96% (median 89%) protein suppression under single-copy conditions (Sup Figure S6f). Additionally, Cd9 knockdown analyses in mouse fibroblasts showed that SplashRNA clearly outperforms DSIR in de novo prediction and achieves near knockout levels comparable to CRISPR-Cas9 (Sup Figure S6g). Potent microRNA-based shRNAs have an equally low chance of off-target effects as non-functional sequences when expressed at single-copy (Methods)11.
Extrapolating beyond the tested shRNAs, we calculated the proportion of genes for which SplashRNA would find at least 5 shRNAs above a given threshold (Figure 2f). After shortening of transcripts due to ApA and only considering the intersection of all transcript variants per gene, we found that 87% of mouse genes and 81% of human genes have at least 5 shRNAs with SplashRNA scores above 1, corresponding to an 80% probability (e.g. 4 out of 5 shRNAs) of more than 85% knockdown at single-copy (Sup Figure S6h).
Building on our Sensor assay and the optimized miR-E backbone, here we have established a robust algorithm to predict ultra-potent microRNA-based shRNAs targeting nearly any gene. SplashRNA is able to accurately predict the potency of independently validated and novel shRNAs and clearly outperforms existing algorithms. Our sequential predictor approach facilitates the integration of biased and unbiased datasets and can serve as a blueprint for other prediction problems. An open source implementation of SplashRNA is accessible at http://splashrna.mskcc.org. Mouse and human genome-wide predictions are also provided separately (Sup Table S3).
Online methods
Selection of an RNAi expression system
MicroRNA-based shRNAs and minimization of off-target effects
Though RNAi triggers can be expressed as simple stem-loop shRNAs from RNA polymerase III (Pol-III) promoters in mammalian cells, such strategies can lead to off-target effects associated with high shRNA expression levels3, likely due to saturation of the endogenous microRNA machinery27. Many Pol-III based systems also suffer from inaccurate processing of precursor molecules2, yielding undesired mature small RNAs. In contrast, use of microRNA-embedded shRNAs expressed from RNA polymerase II (Pol-II) promoters results in accurate processing8,9 and can alleviate the toxic side effects4,5,28, especially when used at single genomic integration (single-copy)11. Notably, highly potent miR-30 based shRNAs expressed at single-copy show the same low levels or absence of off-target effects as analogous weak and non-functional sequences11. Hence, to develop an improved shRNA prediction algorithm, we focused on the optimized miR-E system that is based on the endogenous human MIR30A7.
Here, to determine the extent of sequence-based off-target effects we applied the GESS algorithm29 to shRNAs validated by immunoblotting, and to previously reported Sensor assay and gene expression microarray results10,11. GESS analyzes genome-wide enrichment of seed sequence matches. We tested whether potent shRNAs do not have more off-target effects than their weaker counterparts and if these targets have common sequences.
First, to investigate sequence-based off-target effects, we analyzed RNA expression microarray data from Trp53-/- MEF cells infected at single or high copy with one of six Trp53 shRNAs11. Repetition of the published differential expression analysis found zero differentially expressed genes in the single-copy transfection setting relative to control experiments for either potent or weak shRNAs. In the high-copy transfection setting, 702 genes were up-regulated and 326 genes were down-regulated in the cells with potent shRNA with respect to control experiments (FDR < 0.05). Additionally, 2437 genes were up-regulated and 1731 genes were down-regulated in cells transfected with weak shRNA relative to their controls. Therefore, potent shRNAs in this setting did not induce more gene expression changes than weak shRNAs. Furthermore, both the potent and weak high-copy transfections resulted in near identical lists of differentially expressed genes: 702 genes were significantly up-regulated in both lists and 324 genes were significantly down-regulated in both lists. These intersections significantly overlapped (up regulated: p < 2.2e-16, down regulated: p < 2.2e-16, Fisher's exact test), indicating that the main changes in gene expression are similar regardless of potency or shRNA sequence composition.
Second, we applied the GESS algorithm29 to our validation shRNAs that were quantified by immunoblotting to determine potential sequence-based off-target effects in our current experiments. We attributed our shRNAs to three categories based on western blot knockdown: Low (less than 80% knockdown), Mid (between 80% and 95% knockdown), High (95% knockdown or greater). For each gene and potency-level group, we ran GESS and found the genes that were potentially targeted by all the shRNAs in the group. We found no statistically significant off-targeted genes by GESS (FDR < 0.1). We also tested if the level of potency is associated with the number of potential off-target genes as measured by the number of perfect 7-mer seed matches (nucleotides 2-8). Grouping shRNAs into three groups by percent knockdown, High: >95%, Medium: 90%-95%, and Low: 80%-90%, and testing for a significant difference in the number of gene seed matches found no statistically significant difference between any pair of groups (p = 0.74, 0.53, and 0.73 for Low vs Medium, Low vs High, and Medium vs High, respectively).
Third, we calculated all perfect 22-mer multi-mapping matches transcriptome-wide, since perfect matching of an shRNA to several genes would be highly undesirable. Consequently, we incorporated an additional feature into the SplashRNA algorithm and web site that alerts the user if a predicted hairpin perfectly matches multiple genes in the human or mouse transcriptomes (hg38, mm10).
Sequence requirements of potent RNAi and prediction rules
The initial rules of RNAi potency contained many non-sequence elements30–32, but later rules inferred from larger screens found that sequence based features are more predictive18,33 and capture the other characteristics34. BIOPREDsi, a neural network approach, was trained on over 2,000 functionally tested siRNAs and set a new performance standard33. Using the same dataset, DSIR improved prediction through the use of an L1 regularized linear model with a combination of position-specific nucleotide features and mono-, di-, and tri-nucleotide counts18,35. However, the rules governing siRNA potency differ from the ones dictating shRNA potency due to the additional biogenesis steps10,36, and siRNA based algorithms perform relatively poorly in shRNA prediction tasks. Hence, we and others have previously used our large-scale datasets to generate miR-30 specific prediction algorithms12,20. Yet, with a shift towards the more efficiently processed miR-E backbone, these algorithms are no longer designed for the task at hand as key sequence requirements have changed (Figure 1a).
Building datasets
TILE, mRas + hRAS, and shERWOOD datasets
Over the years, a series of diverse shRNA potency datasets have been created, each having different characteristics and leveraging knowledge gained from previous studies. In the initial RNAi Sensor assay (referred to as “TILE”)10, we screened nearly 20,000 miR-30 based shRNAs that tiled 9 mammalian genes in an unbiased manner to test all possible 22-mer sequences within these genes. This sampling strategy produces a low fraction of potent shRNAs. To reduce costs and increase the ratio of potent shRNAs, subsequent screens only assessed shRNAs that were predicted to be efficient by various in silico methods; these include the “mRas + hRAS”11 and “shERWOOD”12 datasets. These datasets contain a higher percentage of potent shRNAs (as assessed by immunoblotting and functional RNAi screens, data not shown; Sub Table S1), but also represent a biased sampling of the sequence space. Additionally, the recent shift towards the use of “miR-E type” backbones7,12,19 that contain a 5′-DCNNC-3′ motif in their 3′-flank for improved pri-miRNA processing7,13 has further increased the fraction of efficient shRNAs and altered the overall sequence requirements for potent RNAi by relaxing constraints of Drosha processing (Sup Figure S1h).
Sensor assay and M1 dataset generation
A drawback of the unbiased TILE dataset is that it contains few positives (potent shRNAs), with the benefit that it includes a large and comprehensive representation of negatives. Using the Sensor assay10, we thus set out to establish a second large-scale miR-30 based dataset containing a more comprehensive representation of positives (here referred to as “M1”, Sup Figure S1a-f, h, Sup Table S2).
The Sensor assay evaluates pools of shRNAs under conditions of single-copy genomic integration (“single-copy”) for their ability to repress a cognate target sequence placed downstream of a fluorescent reporter expressed in cis. This surrogate system showed an 85-90% specificity in identifying potent shRNAs when compared to knockdown of the corresponding endogenous genes by immunoblotting10. Here, the Sensor assay was carried out as previously described10,11, with several improvements to enhance deep-sequencing library preparation and readout accuracy. To assemble the candidate list, 60 shRNAs per gene were selected using a combination of algorithmic predictions and “Sensor rules” requiring shRNA-specific features. Specifically, to generate the M1 shRNA Sensor library, a custom oligonucleotide array (Agilent Technologies) was designed containing 20,400 185-mer sequences (Sup Table S2). This included 19 standard Sensor control shRNAs spotted 5×, 325 performance control shRNAs that had been tested in previous Sensor assays spotted 1× (65 shRNAs per gene targeting mouse Bcl2, Kras, Mcl1, Myc and Trp53), and 19,980 shRNAs targeting 332 mouse and 1 rat genes (60 shRNAs per gene). For each of the 333 new genes, 300 primary predictions were generated by calculating the intersection of all transcript variants per gene (NCBI) and using DSIR18 supplemented with Sensor rules7,10 to further impose shRNA-specific sequence requirements. All shRNAs containing restriction sites used for cloning (XhoI, EcoRI, MluI, MfeI, BamHI) within the 60 nt target region encompassing the 22 nt guide sequence, as well as shRNAs closer than 15 nt to an artificial transcript junction (site where the common regions of transcript variants are joined), were eliminated. From the remaining set, the top 60 predictions per gene were selected, resulting in 20,324 unique sequences including the controls.
The vector libraries were constructed using the previously described two-step cloning procedure10,11. In step 1, oligonucleotides were amplified using the Sens3′Mfe (5′-TACAATACTCGAGAAGGTATATTGCTGTTGACAGTGAGCG-3′, IDT) and Sens5′Xho (5′-ATTCATCACAATTGTCCGCGTCGATCCTAGG-3′, IDT) primers, XhoI/MfeI (NEB) digested, and ligated into an XhoI/EcoRI (NEB) digested pTNL backbone vector. Ligation products were MfeI-HF (NEB) digested to reduce background noise. In step 2, the missing 3′miR30-PGK-Venus fragment was cloned into the EcoRI/MluI sites, followed by BamHI-HF (NEB) digestion of the resulting ligation product to further reduce background noise. During each cloning step, a representation of at least 1,000-fold the complexity of the library was maintained. All cell culture and flow cytometry procedures of the Sensor assay, to gradually enrich for the most potent shRNAs, were conducted as previously described10,11.
High-throughput sequencing based quantification of library composition and analysis of changes in shRNA representation over sort cycles were carried out as previously described10,11, with several adaptations to enhance readout precision. In contrast to previous procedures, deep-sequencing template libraries were generated by PCR amplification of shRNA guide strands including adjacent 3′ flanking regions, from vector libraries or genomic DNA, leading to longer PCR products (361 nt). The forward primer binding to the shRNA loop, HiSeq_Loop (p7+loop, 5′-CAAGCAGAAGACGGCATACGAGATTAGTGAAGCCACAGATGT-3′, IDT), was shortened by one nucleotide in order for each PCR to start with the same base. To enable sequencing of pooled libraries, an index primer binding site and 6 nt indices were included in the reverse primers (HiSeq_Index-p5-N5, 5′-AATGATACGGCGACCACCGAGATCTGATCGGAAGAGCACACGTCTGAACTCCAGTCACNNNNNNACTTGTGTAGCGCCAAGTGCCCAGC-3′, N = index, IDT). The indices used were (index, library): 5′-CGATGT-3′ for Vector 1, 5′-TTAGGC-3′ for Vector 2, 5′-TGACCA-3′ for Sort3-R1, 5′-ACAGTG-3′ for Sort3-R2, 5′-GCCAAT-5′ for Sort5-R1, 5′-CAGATC-3′ for Sort5-R2. All libraries were sequenced using the miR30EcoRIseq primer (5′-TAGCCCCTTGAATTCCGAGGCAGTAGGCA-3′, IDT) that reads reverse into the guide strand. Per library, 4 to 38 million initial sequencing reads were obtained (Illumina). For each shRNA and condition, the number of completely matching sequences was determined, normalized to the total reads per sample, and imported into a database for further analysis (Access 2007, Microsoft).
Deep sequencing after two-step cloning of the shRNA-Sensor libraries showed that >99.7% of all designed vectors were successfully constructed and detected in both replicates (Sup Table S2). Five iterative rounds of fluorescence-activated cell sorting, with gates set to progressively select for only the most functional shRNAs, enriched for potent shRNAs (Sup Figure S1b, c), as previously shown10,11. While independent biological replicates correlated throughout the sorting procedure, correlation to the initial representation was progressively lost, showing that the assay specifically enriched potent shRNAs. The final Sensor score was uncorrelated to the initial representation (Sup Figure S1d), and known controls behaved as expected and in high correlation with previous Sensor runs, even for non-functional shRNAs (Sup Figure S1e, f). A Sensor score was computed as readout for shRNA potency (Sup Table S2). The Sensor score represents an integration of shRNA enrichment over all replicates. Sensor score = log2((eScoS3*eScoS52)+1); eScoS3 = geometric-mean(S3)/mean(V), eScoS5 = geometric-mean(S5)/mean(V). To avoid potential division by 0, the counts used for the calculations were reads (parts per million, ppm) + 1. Potent shRNAs were identified for all genes, with a modest change in top score distribution across all assayed transcripts.
Reporter assay, miR-E dataset generation and UltramiR dataset
We established a miR-E specific training dataset (referred to as “miR-E”) by using a modified version of our Sensor assay specialized for high-accuracy one-by-one evaluation of shRNA potency7. This two-component RNAi reporter assay shows higher resolution in separating good shRNAs from the top candidates when compared to the pooled version. Using our neutral chicken reporter cell line10, we evaluated nearly 400 miR-E shRNAs targeting human and mouse genes in 42 individual batches (Sup Figure S1g, Sup Table S2).
Candidate miR-E shRNAs were designed to target all transcript variants per gene (NCBI), and selected using DSIR18 supplemented with Sensor rules7,10. All candidate shRNAs were cloned into the LEPG vector for potency assessment, while double-stranded DNA gBlocks (IDT) were used to generate the target inserts of the respective TtNPT reporter vectors7. To produce stable reporter cell lines, ERC chicken reporter cells10 were infected with TtNPT viruses at high-copy, and selected in presence of doxycycline (0.5-1.0 μg/ml) and G418 (1500-2000 μg/ml). Experimental and control shRNAs were then transduced one-by-one, at single-copy (<20% infected cells), into the respective reporter cell lines. Quantification of reporter construct knockdown was assessed by flow cytometry 3-6 days after infection (LSR II, BD Biosciences), acquiring at least 1000-5000 live GFP+ cells for each sample (n >1000).
Since reporter transcript characteristics can affect relative knockdown performance in this assay, established controls (miR-E Ren.713, miR-30 Pten.1524, miR-E Pten.1523, miR-E Pten.1524) were used to monitor the performance of the assay, and scale the data for comparison across different batches and for training of the algorithm. All constructs were tested in 42 individual batches. After normalization and scaling, reference shRNAs and cell line controls showed tight potency distributions (Sup Figure S1g), indicating robust assay performance. For training of the miR-E predictor, all gene specific shRNAs were divided into a positive and negative class based on a threshold value of 80% reporter knockdown relative to controls, giving rise to two similarly sized populations.
To increase the size of the miR-E dataset, we also used shRNA performance data from a pooled cell viability (negative selection) screen that was previously run using UltramiR shRNAs (referred to as “UltramiR”)12, which contain the same basic backbone structure as miR-E shRNAs. This screen quantified the depletion of cells expressing shRNAs targeting 78 essential genes, alongside negative controls. When taken together, the miR-E and UltramiR data established a robust set of examples representing miR-E specific processing requirements (Sup Table S1).
SplashRNA predictor
Assessing the potency of an shRNA for the TILE and M1 datasets
A Sensor score was computed as readout for shRNA potency (Sup Table S2). The Sensor score represents an integration of shRNA enrichment over all replicates. The Sensor score for each shRNA sequence (x) was quantified as the log fold change of the number of read counts (rho) between third sort (S3) and its respective vector library (v), averaged over replicates (r). Thus the potency score takes the form:
To avoid potential division by 0, the counts used for the calculations were reads (parts per million, ppm) + 1. To distinguish positives from negatives and integrate the datasets, we defined score cutoffs based on the score distributions for each dataset. The distribution of scores for the TILE dataset gives a clear separation of positive and negative shRNAs (Figure S2c, Sup Table S1). Thus we selected a threshold at the minimum score density between the two modes. The M1 set was generated by selecting shRNAs that were likely to be potent, and therefore the score distributions of the negatives and positives are less distinct. To determine the label for different shRNAs in the M1 set, we fit each mode of the distribution with a Gaussian. Using these two Gaussians we calculated two thresholds, one at a false positive rate of 5% and one at a false negative rate of 5% (Sup Figure S2e, Sup Table S1) in order to define the positive and negative examples.
Assessing the potency of an shRNA for the shERWOOD dataset
This dataset was previously published12.
Assessing the potency of an shRNA for the miR-E dataset
The score for each shRNA in the miR-E set was calculated as the relative reporter knockdown level measured by flow cytometry, normalized to the knockdown level measured for miR-E Ren.713 and miR-30 Pten.1524 in the same batch. The data was scaled independently for each batch to set miR-E Ren.713 at 100% and miR-30 Pten.1524 at 60% relative knockdown. All shRNAs above 80% were classified as positive, while all shRNAs below 80% were classified as negative (Sup Figure S1g, S4d, Sup Table S1).
Assessing the potency of an shRNA for the UltramiR dataset
The scores from the UltramiR cell viability screen were previously published (NCBI Gene Expression Omnibus, Series GSE62185)12. We limited our analysis to the shRNAs targeting 78 essential genes, as defined in the shERWOOD paper (Sup Table S2). UltramiR shRNAs were considered to be potent if they had a depletion score of less than -0.5 (Sup Figure S4d).
Assessing the potency of an shRNA for the Essential genes dataset
This dataset was previously published21. Phenotypes for each shRNA were calculated as the mean log2 fold change for the two replicates. Gene-level scores were calculated as the mean phenotype for the 5 shRNAs with the most negative phenotypes for each gene.
Assessing the potency of an shRNA for the Sensitivity genes dataset
This dataset was previously published19. Only shRNAs appearing in both replicates were used for the analyses. Hit genes were defined as those with a reported p-value less than 0.05. The top sensitivity genes were those with the most positive mean phenotypes of their top 5 targeting shRNAs. Phenotype is defined as log2 (toxin-treated/untreated).
Identifying gold-standard essential genes
The set of gold-standard essential genes and gold-standard non-essential genes was previously published23. We reevaluated data from a published RNAi screen that used approximately 25 shRNAs per gene, or 4 sgRNAs per gene21, to assess the efficiency of SplashRNA predictions to identify hit genes. We ranked shRNAs according to their SplashRNA score and compared the mean cell depletion values for the top scoring shRNAs against the reported gene-level cell depletion values using the reported gold-standard genes. We found that a library made from the top 10 SplashRNA predictions per gene performed at least as well as the full library when identifying the gold standard genes (Figure 2c). Additionally, a library created by selecting the 10 lowest scoring SplashRNA predictions for each gene performed statistically worse than a library created by selecting the 10 top scoring shRNAs per gene (p < 0.001, empirical permutation test). This shows that SplashRNA allows selecting superior shRNAs, which in turn decreases off-target effects by reducing the false discovery rate. The need for fewer shRNAs per gene also enables minimizing the complexity of RNAi libraries for multiplexed screens.
Classifier kernel
All SVMs were trained with the Shogun package37 using a weighted-degree kernel of order 22 and two spectrum kernels (k-mer length = 3). Each of our classifiers was constructed by the following kernel combination: ClassifierKernel = SpectrumKernel(pos1-15) + SpectrumKernel(pos16-22) + WeightedDegreeKernel(pos1-22) (Sup Figure S2b, d).
Training the miR-30 classifier
When fitting the regularization parameter C for our miR-30 SVM, we used leave-one-gene-out nested cross-validation. We grouped shRNAs from the TILE miR-30 dataset by target gene into outer-folds. For each outer fold, we held out shRNAs targeting one gene and optimized the parameter C on the shRNAs targeting the remaining genes through 10-fold cross-validation. The M1 positive set was added to all training sets but was not used for selection of C or for validation. Performance on the TILE set is reported on the outer held-out genes (Sup Figure S2f). We trained our final classifier with the parameter setting C = 15 using all the TILE data and the M1 positive shRNAs. This classifier was used to predict on all other datasets.
Training the miR-E classifier
We used nested 10-fold cross-validation to fit the C parameter for our miR-E SVM. We did not use leave-one-gene-out due to the lower number of shRNAs targeting each gene. The miR-E and UltramiR shRNAs were combined and split into 10 outer folds. Within each of these folds, 10-fold cross validation was performed to determine the optimal C parameter for that fold. Performance on the miR-E and UltramiR sets is reported on the outer held-out folds (Sup Figure S3c). We trained our final classifier with the parameter setting C = 15 using all the miR-E and UltramiR data. This classifier was used to predict on all other datasets.
Calculating sequential predictor (SplashRNA) scores
The potency scores for all shRNA are first calculated using the miR-30 classifier. If the score does not exceed the threshold theta, this partial score is the final score for the shRNA. If the score does exceed the threshold, the final score is a weighted combination of the predicted scores from the miR-30 and miR-E classifiers.
Here x is the sequence of the shRNA to be evaluated, alpha (α) is the mixing proportion between the two classifiers and theta (θ) is the threshold.
Optimizing the sequential predictor
We set alpha (α) to 0.6 and theta (θ) to 1.1 to retain good performance on miR-30 classification after analysis of the precision-recall trade-off between the miR-30 and miR-E classifiers. This performance accuracy is unattainable by a simple linear classifier αSVMmiR30+(1-α)SVMmiRE (Sup Figure S3a-c).
Calculation of DSIR scores
DSIR scores were calculated according to the published 21nt linear model18,35.
Calculation of sequence score (seqScore) scores
Scores were calculated as described in the paper19.
Calculation of miR_Scan scores
Scores were calculated using software provided by the authors20.
Calculation of intersections of all transcript variants per gene
Genomic regions and annotations for hg38 and mm10 were downloaded using the makeTranscriptDbFromUCSC function from the GenomicFeatures Bioconductor package38,39. Transcript variants were grouped by gene using their Entrez ID and regions shared across all RefSeq transcript variants were calculated in R using the BiocGenerics intersect function. Sequences for these intersections were then extracted using the BSgenome.Hsapiens.UCSC.hg38 and BSgenome.Mmusculus.UCSC.mm10 packages.
Primary data for hg38 was obtained from: Team TBD. BSgenome.Hsapiens.UCSC.hg38: Full genome sequences for Homo sapiens (UCSC version hg38). R package version 1.4.1.
Primary data for mm10 was obtained from: Team TBD. BSgenome.Mmusculus.UCSC.mm10: Full genome sequences for Mus musculus (UCSC version mm10). R package version 1.4.0.
Validation studies
Cell culture
Phoenix HEK293T viral packaging cells were grown in DMEM supplemented with 10% fetal bovine serum (FBS), 100 U/ml penicillin and 100 μg/ml streptomycin (100-Pen-Strep). ERC chicken reporter cells were grown in DMEM supplemented with 10% FBS, 1 mM sodium pyruvate and 100-Pen-Strep, and frozen in 5% DMSO, 70% FBS and 25% culture medium. NIH/3T3 (ATCC) cells were maintained in DMEM with 10% bovine calf serum or 10% fetal bovine serum (FBS) containing 100-Pen-Strep and were tested for absence of mycoplasma contamination. A375 (kind gift from Dr. Neal Rosen, MSKCC) were maintained in DMEM with 10% FBS and 100-Pen-Strep. All cell cultures were maintained in a 37°C incubator at 5% CO2.
Retroviral transduction
Cells were transduced as previously described10. Transduction efficiency was assessed 48 h post infection by quantification of fluorescent reporters using flow cytometry (Guava EasyCyte, Millipore). Where a specific infection rate was desired, test infections were carried out at different dilution rates and ideal infection ratios deduced. All shRNAs were assessed at single copy genomic integration (“single-copy”) by infecting target cell population at <20% of their maximal infection rate, guaranteeing <2% cells with multiple integrations10. Transduced cell populations were usually selected 48 h after infection, using 1.0-2.0 μg/ml puromycin (Sigma-Aldrich) or 500-2000 μg/ml G418 (Geneticin, Gibco-Invitrogen).
Immunoblotting
Cells were transduced at single-copy with the constitutive retroviral vector LEPG7 expressing the indicated miR-E shRNA constructs. NIH/3T3 or A375 cell pellets were lysed in Laemmli buffer (100 mM Tris-HCl pH 6.8, 5% glycerol, 2% SDS, 5% 2-mercaptoethanol). Equal amounts of protein were separated on SDS-polyacrylamide gels and transferred to PVDF membranes. The abundance of β-actin (ACTB, Actb) was monitored to ensure equal loading. Images were analyzed using the AlphaView software (ProteinSimple) and quantified by ImageJ. Immunoblotting was performed using antibodies for Pten (1:1,000, Cell Signaling Technology, #9188, https://media.cellsignal.com/pdf/9188.pdf), Bap1 (1:500, Bethyl Laboratories, #A302-243A, http://www.bethyl.com/product/pdf/A302-243A.pdf), Pbrm1 (1:500, Bethyl Laboratories, #A301-591A, https://www.bethyl.com/product/pdf/A301-591A.pdf), NF2 (1:1,000, Abcam, #ab109244, http://www.abcam.com/NF2-Merlin-antibody-EPR25732-ab109244.pdf), Axin1 (1:1,000, Cell Signaling, Technology, #2087, https://media.cellsignal.com/pdf/2087.pdf), Bcl2l11 (a.k.a. Bim, 1:1,000, Cell Signaling Technology, #2933, https://media.cellsignal.com/pdf/2933.pdf), Rela (a.k.a. NFκB p65, 1:1,000, Santa Cruz, sc-372, https://datasheets.scbt.com/sc-372.pdf), β-actin (1:10,000, Sigma-Aldrich, clone AC-15, http://www.sigmaaldrich.com/content/dam/sigma-aldrich/docs/Sigma/Datasheet/6/a5441dat.pdf).
Evaluation of shRNA and CRISPR-Cas9 based suppression of Cd9 in immortalized MEFs
miR-E shRNAs targeting murine Cd9 were designed using SplashRNA or our previous design strategy involving DSIR18 predictions filtered by “Sensor rules”10,40. The six top predictions from each algorithm were cloned into RT3CEN (TRE3G-mCherry-miRE-PGK-Neo; generated based on RT3GEN7). sgRNAs were cloned into a retroviral vector (RU6sgC; pSIN.U6.sgRNA-EF1as-mCherry), which we constructed based on the pQCXIX backbone (Clontech). Parallel Tet-inducible shRNA and CRISPR-Cas9 based loss-of-function studies were performed in immortalized double-transgenic MEFs (CRT-MEFs) constitutively expressing Cas9 and rtTA-M2 from transgenic knock-in alleles at the Rosa26 loci. These MEFs were isolated from Rosa26.CAGGS-Cas9.P2A.GFP41; Rosa26.rtTA-M242 double-transgenic embryos (using standard protocols) and immortalized through retroviral transduction of a potent shRNA targeting Trp53 (MSCV-shTrp53.814), followed by serial passaging. Retroviral shRNA/sgRNA expression vectors were packaged using standard calcium-phosphate based transfection into Platinum-E cells (Cellbiolabs) and transduced into CRT-MEFs and RRT-MEFs10 under strict single-copy conditions, as previously described10. Two days post-infection, shRNA expression was induced through addition of doxycycline (1 μg/ml); six days later cells were stained for surface Cd9 expression (Anti-mouse Cd9-APC, eBioscience, #17-0091-82). Cd9 expression was analyzed in mCherry+/shRNA-expressing cells and quantified by flow cytometry (LSR-II Fortessa, BD Biosciences). The sgRNA transduced cells were analyzed in the same way, quantifying Cd9 expression in mCherry+/sgRNA-expressing cells eight days post-infection.
Statistical analysis
Specific statistical tests used are indicated in all cases.
Code availability
Source code that implements the main SplashRNA algorithm is provided (Supplementary Code).
Data availability
Screen data from the M1 Sensor assay and the miR-E reporter assay is provided (Supplementary Table S2). UltramiR data is also provided (Supplementary Table S2). Data from the other screens used for SplashRNA training and validation (Supplementary Table S1) has been previously published as reported.
Supplementary Material
Acknowledgments
We thank J.A. Doudna, G.J. Hannon, L.E. Dow and S.N. Floor for continuous support and valuable discussions. We gratefully acknowledge assistance and support from A. Banito, V. Sridhar, L. Faletti, C.C. Chen and S. Tian. C.F. was supported in part by a K99/R00 Pathway to Independence Award (K99GM118909) from the National Institutes of Health (NIH), National Institute of General Medical Sciences (NIGMS). C.F. is a founder of Mirimus Inc., a company that develops RNAi-based reagents and transgenic mice. This work was also supported in part by grant CA013106 (S.W.L.). S.W.L. is a founder and member of the scientific advisory board of Mirimus Inc., the Geoffrey Beene Chair of Cancer Biology at MSKCC, and an investigator of the Howard Hughes Medical Institute. J.Z. is a member of the scientific advisory board, and P.K.P. is a founder and employee of Mirimus Inc. C.S.L. was supported in part by NHGRI U01 grants HG007033 and HG007893 and NCI U01 grant CA164190.
Footnotes
Author contributions: R.P., L.F., C.S.L. and C.F. conceived and designed the study, developed the data integration framework, built the algorithm, and carried out the model training and computational validation. C.H., N.S., D.L., Y.G., P.K.P., D.F.T, T.H., J.Z., S.W.L. and C.F. generated the biological datasets and validated knockdown potency. R.P., L.F., C.W. and V.T.S. built the web page. V.T. and G.R. assisted with study design and advised on algorithmic development. Q.X. and R.J.G. helped with validation of predictions. R.P., L.F., C.H., T.H., J.Z., S.W.L., C.S.L. and C.F. analyzed data and wrote the manuscript.
Competing financial interests: C.F. is a founder of Mirimus Inc., a company that develops RNAi-based reagents and transgenic mice. S.W.L. is a founder and member of the scientific advisory board of Mirimus Inc. J.Z. is a member of the scientific advisory board of Mirimus Inc. P.K.P. is a founder and employee of Mirimus Inc.
References
- 1.Fellmann C, Lowe SW. Stable RNA interference rules for silencing. Nat Cell Biol. 2014;16:10–8. doi: 10.1038/ncb2895. [DOI] [PMC free article] [PubMed] [Google Scholar]
- 2.Guda S, et al. miRNA-embedded shRNAs for Lineage-specific BCL11A Knockdown and Hemoglobin F Induction. Mol Ther. 2015;23:1465–74. doi: 10.1038/mt.2015.113. [DOI] [PMC free article] [PubMed] [Google Scholar]
- 3.Grimm D, et al. Fatality in mice due to oversaturation of cellular microRNA/short hairpin RNA pathways. Nature. 2006;441:537–541. doi: 10.1038/nature04791. [DOI] [PubMed] [Google Scholar]
- 4.McBride JL, et al. Artificial miRNAs mitigate shRNA-mediated toxicity in the brain: implications for the therapeutic development of RNAi. Proc Natl Acad Sci U S A. 2008;105:5868–5873. doi: 10.1073/pnas.0801775105. [DOI] [PMC free article] [PubMed] [Google Scholar]
- 5.Baek ST, et al. Off-target effect of doublecortin family shRNA on neuronal migration associated with endogenous microRNA dysregulation. Neuron. 2014;82:1255–1262. doi: 10.1016/j.neuron.2014.04.036. [DOI] [PMC free article] [PubMed] [Google Scholar]
- 6.Zuber J, et al. Toolkit for evaluating genes required for proliferation and survival using tetracycline-regulated RNAi. Nat Biotechnol. 2011;29:79–83. doi: 10.1038/nbt.1720. [DOI] [PMC free article] [PubMed] [Google Scholar]
- 7.Fellmann C, et al. An optimized microRNA backbone for effective single-copy RNAi. Cell Rep. 2013;5:1704–13. doi: 10.1016/j.celrep.2013.11.020. [DOI] [PubMed] [Google Scholar]
- 8.Gu S, et al. The Loop Position of shRNAs and Pre-miRNAs Is Critical for the Accuracy of Dicer Processing In Vivo. Cell. 2012;151:900–911. doi: 10.1016/j.cell.2012.09.042. [DOI] [PMC free article] [PubMed] [Google Scholar]
- 9.Watanabe C, Cuellar TL, Haley B. Quantitative evaluation of first, second, and third generation hairpin systems reveals the limit of mammalian vector-based RNAi. RNA Biol. 2016;13:25–33. doi: 10.1080/15476286.2015.1128062. [DOI] [PMC free article] [PubMed] [Google Scholar]
- 10.Fellmann C, et al. Functional identification of optimized RNAi triggers using a massively parallel sensor assay. Mol Cell. 2011;41:733–46. doi: 10.1016/j.molcel.2011.02.008. [DOI] [PMC free article] [PubMed] [Google Scholar]
- 11.Yuan TL, et al. Development of siRNA payloads to target KRAS-mutant cancer. Cancer Discov. 2014;4:1182–97. doi: 10.1158/2159-8290.CD-13-0900. [DOI] [PMC free article] [PubMed] [Google Scholar]
- 12.Knott SRV, et al. A computational algorithm to predict shRNA potency. Mol Cell. 2014;56:796–807. doi: 10.1016/j.molcel.2014.10.025. [DOI] [PMC free article] [PubMed] [Google Scholar]
- 13.Auyeung VCC, Ulitsky I, McGeary SEE, Bartel DPP. Beyond secondary structure: primary-sequence determinants license pri-miRNA hairpins for processing. Cell. 2013;152:844–858. doi: 10.1016/j.cell.2013.01.031. [DOI] [PMC free article] [PubMed] [Google Scholar]
- 14.Viola P, Jones M. Rapid object detection using a boosted cascade of simple features. Proc IEEE Comput Soc Conf Comput Vis Pattern Recognit. 2001;1:511–518. [Google Scholar]
- 15.Pelossof R, Jones M, Ying Z. Speeding-up margin based learning via stochastic curtailment. Proceedings of the 26th International Conference on Machine Learning; Haifa, Israel. 2010. [Google Scholar]
- 16.Leslie C, Eskin E, Noble WS. The spectrum kernel: a string kernel for SVM protein classification. Pac Symp Biocomput. 2002;575:564–75. [PubMed] [Google Scholar]
- 17.Sonnenburg S, Rätsch G, Rieck K. Large Scale Learning with String Kernels. Large-scale Kernel Mach. 2007:73–103. doi:10.1.1.84.6387. [Google Scholar]
- 18.Vert JP, Foveau N, Lajaunie C, Vandenbrouck Y. An accurate and interpretable model for siRNA efficacy prediction. BMC Bioinformatics. 2006;7:520. doi: 10.1186/1471-2105-7-520. [DOI] [PMC free article] [PubMed] [Google Scholar]
- 19.Kampmann M, et al. Next-generation libraries for robust RNA interference-based genome-wide screens. Proc Natl Acad Sci U S A. 2015;112:E3384–91. doi: 10.1073/pnas.1508821112. [DOI] [PMC free article] [PubMed] [Google Scholar]
- 20.Matveeva OV, Nazipova NN, Ogurtsov AY, Shabalina SA. Optimized models for design of efficient miR30-based shRNAs. Front Genet. 2012;3:163. doi: 10.3389/fgene.2012.00163. [DOI] [PMC free article] [PubMed] [Google Scholar]
- 21.Morgens DW, Deans RM, Li A, Bassik MC. Systematic comparison of CRISPR/Cas9 and RNAi screens for essential genes. Nat Biotechnol. 2016;34:634–6. doi: 10.1038/nbt.3567. [DOI] [PMC free article] [PubMed] [Google Scholar]
- 22.Kampmann M, Bassik MC, Weissman JS. Integrated platform for genome-wide screening and construction of high-density genetic interaction maps in mammalian cells. Proc Natl Acad Sci U S A. 2013;110:E2317–26. doi: 10.1073/pnas.1307002110. [DOI] [PMC free article] [PubMed] [Google Scholar]
- 23.Hart T, Brown KR, Sircoulomb F, Rottapel R, Moffat J. Measuring error rates in genomic perturbation screens: gold standards for human functional genomics. Mol Syst Biol. 2014;10:733. doi: 10.15252/msb.20145216. [DOI] [PMC free article] [PubMed] [Google Scholar]
- 24.Spies N, Burge CB, Bartel DP. 3′ UTR-isoform choice has limited influence on the stability and translational efficiency of most mRNAs in mouse fibroblasts. Genome Res. 2013;23:2078–90. doi: 10.1101/gr.156919.113. [DOI] [PMC free article] [PubMed] [Google Scholar]
- 25.Derti A, et al. A quantitative atlas of polyadenylation in five mammals. Genome Res. 2012;22:1173–83. doi: 10.1101/gr.132563.111. [DOI] [PMC free article] [PubMed] [Google Scholar]
- 26.Lianoglou S, Garg V, Yang JL, Leslie CS, Mayr C. Ubiquitously transcribed genes use alternative polyadenylation to achieve tissue-specific expression. Genes Dev. 2013;27:2380–2396. doi: 10.1101/gad.229328.113. [DOI] [PMC free article] [PubMed] [Google Scholar]
Supplementary references
- 27.Yi R, Doehle BP, Qin Y, Macara IG, Cullen BR. Overexpression of exportin 5 enhances RNA interference mediated by short hairpin RNAs and microRNAs. RNA. 2005;11:220–226. doi: 10.1261/rna.7233305. [DOI] [PMC free article] [PubMed] [Google Scholar]
- 28.Boudreau RL, Martins II, Davidson BL. Artificial MicroRNAs as siRNA Shuttles: Improved Safety as Compared to shRNAs In vitro and In vivo. Mol Ther. 2008;17:169–175. doi: 10.1038/mt.2008.231. [DOI] [PMC free article] [PubMed] [Google Scholar]
- 29.Sigoillot FD, et al. A bioinformatics method identifies prominent off-targeted transcripts in RNAi screens. Nat Methods. 2012;9:363–366. doi: 10.1038/nmeth.1898. [DOI] [PMC free article] [PubMed] [Google Scholar]
- 30.Khvorova A, Reynolds A, Jayasena SD. Functional siRNAs and miRNAs exhibit strand bias. Cell. 2003;115:209–216. doi: 10.1016/s0092-8674(03)00801-8. [DOI] [PubMed] [Google Scholar]
- 31.Reynolds A, et al. Rational siRNA design for RNA interference. Nat Biotechnol. 2004;22:326–30. doi: 10.1038/nbt936. [DOI] [PubMed] [Google Scholar]
- 32.Schwarz DS, et al. Asymmetry in the assembly of the RNAi enzyme complex. Cell. 2003;115:199–208. doi: 10.1016/s0092-8674(03)00759-1. [DOI] [PubMed] [Google Scholar]
- 33.Huesken D, et al. Design of a genome-wide siRNA library using an artificial neural network. Nat Biotechnol. 2005;23:995–1001. doi: 10.1038/nbt1118. [DOI] [PubMed] [Google Scholar]
- 34.Saetrom P, Snøve O, Snove O., Jr A comparison of siRNA efficacy predictors. Biochem Biophys Res Commun. 2004;321:247–253. doi: 10.1016/j.bbrc.2004.06.116. [DOI] [PubMed] [Google Scholar]
- 35.Filhol O, et al. DSIR: assessing the design of highly potent siRNA by testing a set of cancer-relevant target genes. PLoS One. 2012;7:e48057. doi: 10.1371/journal.pone.0048057. [DOI] [PMC free article] [PubMed] [Google Scholar]
- 36.Taxman DJ, et al. Criteria for effective design, construction, and gene knockdown by shRNA vectors. BMC Biotechnol. 2006;6:7. doi: 10.1186/1472-6750-6-7. [DOI] [PMC free article] [PubMed] [Google Scholar]
- 37.Sonnenburg S, et al. The SHOGUN Machine Learning Toolbox. J Mach Learn Res. 2010;11:1799–1802. [Google Scholar]
- 38.Huber W, et al. Orchestrating high-throughput genomic analysis with Bioconductor. Nat Meth. 2015;12:115–121. doi: 10.1038/nmeth.3252. [DOI] [PMC free article] [PubMed] [Google Scholar]
- 39.Lawrence M, et al. Software for Computing and Annotating Genomic Ranges. PLoS Comput Biol. 2013;9 doi: 10.1371/journal.pcbi.1003118. [DOI] [PMC free article] [PubMed] [Google Scholar]
- 40.Dow LE, et al. A pipeline for the generation of shRNA transgenic mice. Nat Protoc. 2012;7:374–93. doi: 10.1038/nprot.2011.446. [DOI] [PMC free article] [PubMed] [Google Scholar]
- 41.Platt RJ, et al. CRISPR-Cas9 knockin mice for genome editing and cancer modeling. Cell. 2014;159:440–55. doi: 10.1016/j.cell.2014.09.014. [DOI] [PMC free article] [PubMed] [Google Scholar]
- 42.Hochedlinger K, Yamada Y, Beard C, Jaenisch R. Ectopic expression of Oct-4 blocks progenitor-cell differentiation and causes dysplasia in epithelial tissues. Cell. 2005;121:465–77. doi: 10.1016/j.cell.2005.02.018. [DOI] [PubMed] [Google Scholar]
Associated Data
This section collects any data citations, data availability statements, or supplementary materials included in this article.
Supplementary Materials
Data Availability Statement
Screen data from the M1 Sensor assay and the miR-E reporter assay is provided (Supplementary Table S2). UltramiR data is also provided (Supplementary Table S2). Data from the other screens used for SplashRNA training and validation (Supplementary Table S1) has been previously published as reported.