Abstract
We present a simple technique to generate stable hydrodynamically focused flows by driving the flow with hydrostatic pressure from liquid columns connected to the inlets of a microfluidic device. Importantly, we compare the focused flows generated by hydrostatic pressure and classical syringe pump driven flows and find that the stability of the hydrostatic pressure driven technique is significantly better than the stability achieved via syringe pumps, providing fluctuation-free focused flows that are suitable for sensitive microfluidic flow cytometry applications. We show that the degree of flow focusing with the hydrostatic method can be accurately controlled by the simple tuning of the liquid column heights. We anticipate that this approach to stable flow focusing will find many applications in microfluidic cytometry technologies.
I. INTRODUCTION
The development of microfluidic techniques in recent years has been leading to an emergence of enhanced lab-on-a-chip (LOC) devices.1,2 Such LOC devices demonstrate the potential of replacing existing larger scale technologies in bio-chemical, bio-physical, and bio-medical processes.3–5 A major advantage of LOC devices is the ability to provide a quasi-natural environment to cells that are under observation by controlling flow properties such as laminarity,6,7 physical parameters such as flowrate,7,8 and the size of the microchannels.7 The application of hydrodynamic focusing in these microfluidic flows provides an additional advantage by narrowing the flows toward the size of a single cell.9 For example, in a flow cytometer,10 single cells are hydrodynamically flow focused to a narrow stream that passes through an interrogating zone where the individual cells are interrogated by optical11 or electrical systems12,13 for diagnostics and sorting applications. In addition to flow cytometry, focused flows are also useful in applications such as drug discovery,14,15 drug delivery and release,14 deoxyribonucleic acid (DNA)-stretching,16 and reagent mixing in microfluidics.17
Typical microfluidic experiments use constant flow-rate syringe pumps to drive the fluid flow.5 The flows generated by syringe pumps visually appear to be precise,18 but measurements show that the diameter of focused flows from syringe pumps can fluctuate significantly: one recent publication shows a radial variation of 13 μm when the average diameter is 217 μm.19 The authors detect the fluctuations of syringe pumps by tracking the interface of ultralow interfacial tension aqueous two phase systems (ATPS) and demonstrate that the fluctuations are directly related to the steps of the stepper motor in the pumps. In a similar approach, another publication shows that the flow fluctuations are related to the pressure fluctuations in the syringe pumps.20 These syringe pumps also produce periodic oscillations in the flows due to the frictional forces between the syringe piston and the syringe wall.21
These flow instabilities caused by syringe pumps may have a detrimental effect on the effectiveness of new and highly sensitive microfluidic flow cytometry methods.22 Indeed, the requirements for narrow and consistent flow focusing in these newly developed microfluidic flow cytometry techniques are highlighted in a recent publication by Strohm et al.,23 where the researchers are attempting to characterize cells and particles using acoustics in microfluidics.
In this paper, we demonstrate the application of hydrostatic pressure-driven flow to achieve precise and stable flow focusing. We compare the experimental results from hydrostatic and syringe pump-driven flow focusing and find that hydrostatics achieves superior flow focusing stability in a range of focused widths. Finally, we show that our hydrostatic-based flow focusing technique is easily tunable to control the width of the focused flow. We anticipate that this stable and easily tunable hydrostatic-based flow focusing method will find utility in many sensitive microfluidic flow cytometry applications that require highly stable focused flows.
II. EXPERIMENTAL METHODS
A. Device fabrication
The microfluidic devices in our experiments are fabricated using the classical soft lithography technique.24 A photomask is designed using computer-aided design (CAD) software (AutoCAD 2010, Autodesk, Inc., Dan Rafael, CA, USA), printed on a transparency sheet (25 400 dpi, CAD/ART Services Inc., Bandon, OR, USA), and patterned on a silicon wafer in a single SU-8 layer by photolithography. The pattern is transferred to a polydimethylsiloxane (PDMS, Sylgard 184 silicone elastomer kit, Dow Corning, Midland, MI, USA) sheet. Inlet and outlet holes on the PDMS base are opened using a 1 mm diameter biopsy punch (Integra Miltex, Inc., Rietheim-Weilheim, Germany). The PDMS sheet is then bonded to a glass microscope slide by oxygen plasma treatment (Harrick Plasma, Ithaca, NY, USA).
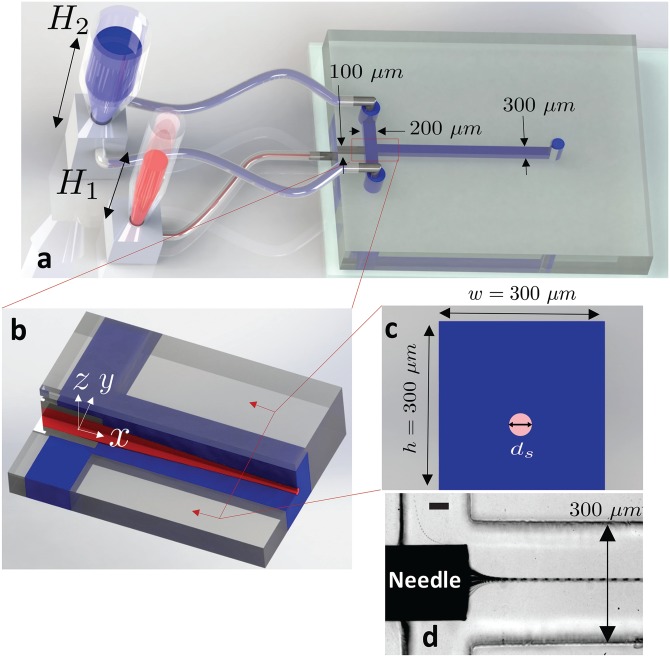
Upstream of the flow focusing cross-junction, the sheath flow channels and the sample channel are 100 and 200 μm wide, respectively (Fig. 1(a)). The channel downstream of the cross-junction is w = 300 μm wide (Fig. 1(a)). The height of all channels is h = 300 μm. To obtain flow focusing, a nano-needle (ID = 100 μm, OD = 200 μm; Japan Bio Products, Tokyo, Japan) is manually guided through the sample inlet channel up to the cross junction (Fig. 1(b)). After inserting the needle, we align the needle in the lateral direction under a stereo microscope (E-Zoom 6 V, Edmund Optics Inc., Barrington, NJ, USA). For vertical positioning, we place two layers of a thin transparent tape (3 M, St. Paul, MN, USA) underneath the needle to achieve a 40 μm gap between the needle and the bottom of the channel, resulting in a 60 μm gap above the needle. The sheath flows, above and below the sample flow, cause an axis-symmetric effect on the focused flow in both lateral (x-y) and vertical (x-z) axes (see the video in the supplementary material). Finally, the needle is bonded to the glass substrate, and the guiding channel is sealed using two-component epoxy glue (Henkel Canada Corporation, Mississauga, ON, Canada). To connect the needle inlet to the liquid columns, we bind the outer end of the needle to Tygon tubing using the two-component epoxy glue.
FIG. 1.
The hydrostatic-based microfluidic device. Schematic illustrations show that (a) fluid flow is driven by hydrostatic pressure that is controlled by the liquid column heights and of the sample (red) and sheath (blue) liquids, respectively. The sample flow is supplied to the microchannel via a needle that is inserted into the side of the PDMS slab, and the sheath flow enters the microchannel via tubing connected from the top of the device. (b) Extended isometric sectional view of the flow focusing cross-junction shows that the sheath flow surrounds and flow focuses the sample flow. Sample and sheath fluids both flow in the direction indicated by the x-axis. (c) Cross-sectional view of the microchannel downstream of the cross-junction shows the diameter, ds, of the flow of the sample fluid. (d) Experimental image showing the flow focusing of the sample fluid near the cross junction. The scale bar represents 50 μm.
B. Experimental setup
To drive the flow inside the microchannels, we introduce liquid columns containing the sample and sheath fluids. The hydrostatic pressure due to the liquid columns drives the sample and sheath flows. Measuring pipettes (Corning Inc., Corning, NY, USA) with internal diameters 3 mm and 8 mm are used as sample and sheath liquid columns, respectively. The tapered end of the measuring pipettes are inserted into pre-fabricated PDMS cubes, and Tygon tubing is used to connect the cubes to the inlets of the microfluidic devices (Fig. 1(a)). The sample and sheath flow liquid columns have heights and , respectively. To compare the results from hydrostatic-based flow focusing with classical syringe pump based flow focusing, we also perform experiments using the same microfluidic geometries with Pump 11 Elite syringe pumps (Harvard Apparatus, Holliston, MA, USA).
We use permanent black ink (Higgins, Chartpak Inc., Leeds, MA, USA) as sample fluid and deionized (DI) water as sheath fluid for all of our experiments. The ink is filtered through a syringe filter (Corning Inc., Corning, NY, USA), with 0.45 μm diameter pores. The color contrast between the ink and the DI water provides clear visualization of the focused sample flow. Fig. 1(d) is a representative experimental image of the flow focusing of a narrow sample fluid in our microfluidic system. Here, we include 3 μm diameter polystyrene particles in the sample fluid to further enhance the imaging contrast.
The focused flow is imaged using a high-speed camera (Phantom M110, Vision Research, Wayne, NJ, USA) attached to an inverted microscope (Olympus Corporation, Tokyo, Japan). For all the experiments, the objective is focused in a region approximately 15 mm downstream of the cross-junction. We measure the focused flow diameter, ds, at the same location in the microchannel for all our experiments. We use an in-house Matlab program to extract individual frames from the videos and analyze the intensity of each pixel in each frame. The program uses the intensity values to measure the focused flow diameter, ds, for on each individual frame and calculate the average focused flow diameter. We use the Otsu greyscale thresholding algorithm for intensity thresholding in the frames.25
III. RESULT AND DISCUSSION
A. The stability of hydrostatic and syringe pump based flow focusing
In our comparison of hydrostatic and syringe pump based microfluidic flow focusing, we use a baseline sample flow diameter, ds = 59 μm, to compare the stability of both systems under equally narrow flow focusing requirements. To attain the focused flow diameter, ds = 59 μm, we apply sample and sheath liquid column heights, H1 = 149 mm and H2 = 48 mm, respectively, in the hydrostatic experiment, and sample and sheath flow rates, Q1 = 1.5 μl/min and Q2 = 30 μl/min, respectively, in the syringe pump experiment.
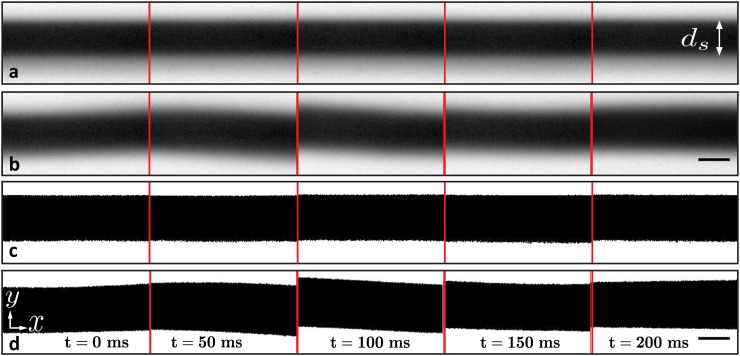
Fig. 2 shows representative sequential images from the same section of the focused sample flow taken from experimental videos. These sequential images are extracted at an interval of 50 ms apart. The dark sections indicate the sample flow, and the bright sections represent the sheath fluid. Figs. 2(a) and 2(b) show bright field images, and Figs. 2(c) and 2(d) show the binary version of the same images after the Otsu thresholding.
FIG. 2.
Experimental images of the sample fluid (black) focused inside a microchannel downstream of the focusing junction. These images are taken from video frames of the experiments whose focused flow average diameter ds = 59 μm, and the frames are selected at an interval of 50 ms. Brightfield images of the focused flows controlled by (a) hydrostatic pressure and (b) constant flow-rate syringe pumps. Thresholded images of the same focused flows produced with (c) hydrostatic pressure and (d) constant flow-rate syringe pumps. The image sequences show qualitatively that the hydrostatic-controlled focused flow has a more consistent diameter, ds, than syringe pump driven flow. Syringe-pump driven focused flows also exhibit more erratic flow behavior. Flow is in the direction indicated by the x-axis. The scale bars represent 50 μm.
The experimental thresholded images from hydrostatic based focusing (Fig. 2(c)) show a consistent focused diameter ds, both spatially and temporally, in comparison to the thresholded images from syringe pump experiments (Fig. 2(d)). Additionally, the syringe pump based focused flow exhibits more erratic behavior. For example, the frame taken at 100 ms shows the focused flow tilting on an angle relative to the longitudinal axis of the flow. As hypothesized in previous reports on microfluidic flows with syringe pumps, the variation of the focused width in the syringe pump experiments may arise from the pulsation of the stepping mechanism in the pumps,19,20 and the tilted focused flow may be due to stiction between the syringe piston and the syringe walls.21
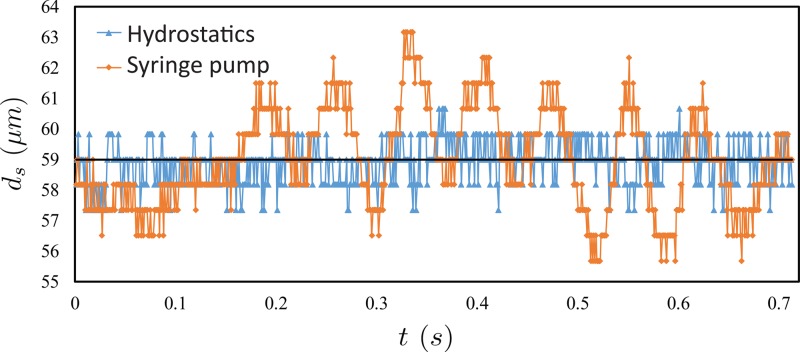
For a quantitative comparison of the stability of the focused flows from the two experimental setups, we plot the focused sample flow diameter, ds, versus time, t (Fig. 3). Here, the average focused flow diameter ds = 59 μm. Blue triangles represent the experimental data from hydrostatic experiments, and red diamonds represent data from syringe pump based experiments. Fig. 3 demonstrates that hydrostatic based flow focusing results in consistently lower variation of the focused flow diameter, ds, when compared to syringe pump based experiments. The standard deviation of the focused flow diameter, ds, is 0.685 μm for hydrostatics, versus 1.589 μm for the syringe pump experiment.
FIG. 3.
A plot of the focused flow diameter, ds, versus time, t, for experiments using hydrostatic pressure (blue triangle) and syringe pumps (red diamond) over a period = 0.7 s. The average diameter, ds, of the focused flow in both hydrostatic and syringe-pump experiments is ds = 59 μm (indicated by the black line). t = 0 s represents the first frame of the high speed video. The data show significantly larger fluctuations in the syringe pump experiments.
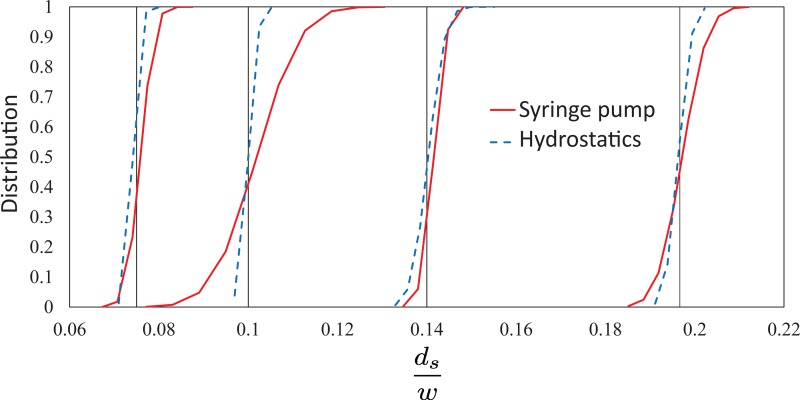
Fig. 4 shows a plot of the cumulative distribution function of the dimensionless focused flow diameter, , for cases where = 0.075, 0.100, 0.140, and 0.197. Here, blue dashed lines represent data from hydrostatic experiments and red solid lines represent data from syringe pump experiments. Black solid vertical lines indicate the mean values of . The distribution of the focused flow diameter is measured from individual diameters of the focused flow in each frame of the videos taken from the experiments. For hydrostatic experiments, we record videos for a duration of 0.7 s at a frame rate of 1000 fps, and for the syringe pump experiments, the videos are recorded for a duration of 16 s at a frame rate of 200 fps.
FIG. 4.
A plot of the cumulative normal distribution function versus dimensionless focused flow diameter, , in the microfluidic channel driven by hydrostatic pressure (blue dashed lines) and syringe pumps (red solid lines). The four sets of data correspond to averaged focused flow widths, = 0.075, 0.100, 0.140, and 0.197 (from left to right). Hydrostatic-controlled flows show consistently narrower distributions of the focused width, , compared to the focused flow generated by syringe pumps.
The curves in Fig. 4 show that the cumulative normal distributions of the focused flow diameter in the hydrostatic experiments are consistently narrower for all the experiments. The distributions of the focused flow diameter in the pump experiments are inconsistent and do not show any specific trend in the narrowness of the flow. For example, the experiments with = 0.140 show that the distributions of the syringe pump and hydrostatic experiments are nearly the same, while for = 0.100, the pump experiment results in a significantly wider distribution than the hydrostatic experiment. These results suggest that the hydrostatic flow focusing technique is better than focusing a flow using syringe pumps for sensitive applications that require accurate and consistent focused flows. We also find that the hydrostatic-based system maintains a near constant focused flow diameter, ds, for at least several minutes in each experiment, before increasing due to changes in the liquid column heights of the sample and sheath fluids with time (see details in the supplementary material). We note that these changes could be reduced by continually filling the liquid columns with liquid or by increasing the diameter of the liquid columns. The liquid columns can be continuously supplied with liquid using a liquid reservoir connected to the columns. Alternatively, a continuous liquid supply can be achieved by using a syringe pump to infuse the liquid at a flowrate equal to the rate at which the column discharges liquid to the microfluidic device. These methods may help to maintain constant fluid column heights.
B. Controlling hydrostatic based flow focusing
In syringe-pumped based flow focusing systems, the focused sample flow diameter scales as26
| (1) |
where Q1 and Q2 are the sample and sheath fluid flow rates, respectively. The Poiseuille flow relationship has a linear proportionality between the flow rate, Q, and the pressure drop, , such that . Hydrostatics dictates that the pressure drop, , scales linearly with the height, H, of a liquid column. Therefore, our hydrostatically flow focused sample fluid will have a resulting normalized diameter
| (2) |
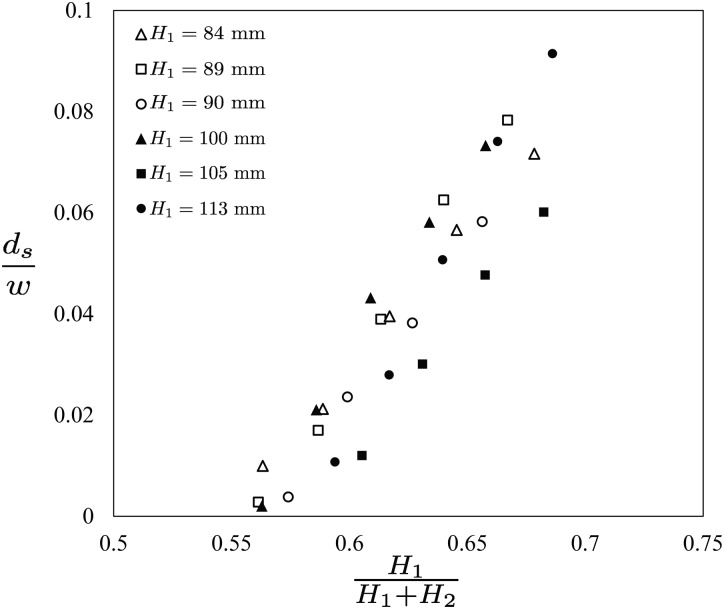
Fig. 5 shows the dimensionless focused sample flow diameter , plotted against the ratio of liquid column heights, . Here, in six experiments, we fix the sample fluid's liquid column height H1 = 84, 89, 90, 100, 105, and 113 mm and tune the sheath flow column height, H2, to obtain a range of dimensionless focused sample flow diameters . In all the experiments, we observe that the sample flow diameter, ds, is approximately proportional to the parameter . Therefore, these results suggest that the sample flow diameter, ds, is directly controllable by simply adjusting the ratio .
FIG. 5.
A plot of the dimensionless focused sample flow diameter, , versus the ratio of liquid column heights, . Here, the data show results from six experiments where the sample liquid column height, H1 = 84, 89, 90, 100, 105, and 113 mm, and the sheath flow liquid column height, H2, are varied to achieve different focused sample flow diameters, . The results indicate the monotonic and approximately proportional increase of the focused sample flow diameter, , with the ratio of liquid column heights, , suggesting that the parameter is a good controller for the degree of hydrostatic based flow focusing.
IV. CONCLUSION
In this work, we describe a stable hydrostatic pressure actuated hydrodynamically focused flow in a single layer microfluidic device. We validate the stability of the focused flow by comparing our results with values from conventional syringe pump actuated flow focusing. Overall, our results show that hydrostatic actuated flow focusing is more stable than syringe pump based flow focusing.
Additionally, we find that hydrostatic based focused flow diameter, ds, is easily adjustable by tuning the ratio of the heights of the liquid columns, , which enables simple control by changing a single parameter. We expect that the stability and ease-of-control of this flow focusing technique will make it highly useable in a variety of microfluidic flow cytometer systems.
V. SUPPLEMENTARY MATERIAL
See supplementary material for more information on hydrostatic experiments on the controlled focus flow diameter and for a confocal microscopy video showing an axis-symmetric effect on the focused flow in both lateral (x-y) and vertical (x-z) axes.
ACKNOWLEDGMENTS
S. S. H. Tsai and M. C. Kolios acknowledge funding support from the Canadian Natural Sciences and Engineering Research Council (NSERC) Discovery grant program. M. C. Kolios is also grateful for funding from a Collaborative Health Research Projects grant that is jointly supported by NSERC and the Canadian Institutes of Health Research (CIHR).
References
- 1. Auroux P. A., Iossifidis D., Reyes D. R., and Manz A., Anal. Chem. 74, 2637 (2002). 10.1021/ac020239t [DOI] [PubMed] [Google Scholar]
- 2. Manz A., Widmers H. M., and Graber N., Sens. Actuators, B 1, 244 (1990). 10.1016/0925-4005(90)80209-I [DOI] [Google Scholar]
- 3. Mark D., Haeberle S., Roth G., von Stetten F., and Zengerle R., Chem. Soc. Rev. 39, 1153 (2010). 10.1039/b820557b [DOI] [PubMed] [Google Scholar]
- 4. Millet L. J., Lucheon J. D., Standaert R. F., Rettererab S. T., and Doktyczab M. J., Lab Chip 15, 1799 (2015). 10.1039/C5LC00094G [DOI] [PubMed] [Google Scholar]
- 5. Stone H. A., Stroock A. D., and Ajdari A., Annu. Rev. Fluid Mech. 36, 381 (2004). 10.1146/annurev.fluid.36.050802.122124 [DOI] [Google Scholar]
- 6. Pai S.-I., Viscous Flow Theory: Laminar Flow (D. Van Nostrand, 1956). [Google Scholar]
- 7. Ducree J. and Zengerle R., Microfluidics (Springer-Verlag, 2004) p. 520. [Google Scholar]
- 8. Yang A. S. and Hsieh W. H., Biomed. Microdevices 9, 113 (2007). 10.1007/s10544-006-9003-9 [DOI] [PubMed] [Google Scholar]
- 9. Lee G.-B., Hung C.-I., Ke B.-J., Huang G.-R., Hwei B.-H., and Lai H.-F., J. Fluids Eng. 123, 672 (2001). 10.1115/1.1385514 [DOI] [Google Scholar]
- 10. Watson J. V., Introduction to Flow Cytometry (Cambridge University Press, 2004). [Google Scholar]
- 11. Brown M. and Wittwer C., Clin. Chem. 46, 1221 (2000). [PubMed] [Google Scholar]
- 12. Gawad S., Schild L., and Renaud P. H., Lab Chip 1, 76 (2001). 10.1039/b103933b [DOI] [PubMed] [Google Scholar]
- 13. Sun T. and Morgan H., Microfluid. Nanofluid. 8, 423 (2010). 10.1007/s10404-010-0580-9 [DOI] [Google Scholar]
- 14. Xu Q., Hashimoto M., Dang T. T., Hoare T., Kohane D. S., Whitesides G. M., Langer R., and Anderson D. G., Small 5, 1575 (2009). 10.1002/smll.200801855 [DOI] [PMC free article] [PubMed] [Google Scholar]
- 15. Dittrich P. S. and Manz A., Nat. Rev. Drug Discov. 5, 210 (2006). 10.1038/nrd1985 [DOI] [PubMed] [Google Scholar]
- 16. Wong P. K., Lee Y.-K., and Ho C.-M., J. Fluid Mech. 497, 55 (2003). 10.1017/S002211200300658X [DOI] [Google Scholar]
- 17. Knight J., Vishwanath A., Brody J., and Austin R., Phys. Rev. Lett. 80, 3863 (1998). 10.1103/PhysRevLett.80.3863 [DOI] [Google Scholar]
- 18. Ward T., Faivre M., Abkarian M., and Stone H. A., Electrophoresis 26, 3716 (2005). 10.1002/elps.200500173 [DOI] [PubMed] [Google Scholar]
- 19. Li Z., Mak S. Y., Sauret A., and Shum H. C., Lab a Chip 14, 744 (2014). 10.1039/c3lc51176f [DOI] [PubMed] [Google Scholar]
- 20. Zeng W., Jacobi I., Beck D. J., Li S., and Stone H. A., Lab Chip 15, 1110 (2015). 10.1039/C4LC01347F [DOI] [PubMed] [Google Scholar]
- 21. Atencia J. and Beebe D. J., Lab Chip 6, 567 (2006). 10.1039/b514070f [DOI] [PubMed] [Google Scholar]
- 22. Mao X., Lin S.-C. S., Dong C., and Huang T. J., Lab Chip 9, 1583 (2009). 10.1039/b820138b [DOI] [PubMed] [Google Scholar]
- 23. Strohm E. M., Gnyawali V., Van De Vondervoort M., Daghighi Y., Tsai S. S. H., and Kolios M. C., Proc. SPIE 9708, 97081A (2016). 10.1117/12.2211740 [DOI] [Google Scholar]
- 24. Xia Y. and Whitesides G. M., Annu. Rev. Mater. Sci. 28, 153 (1998). 10.1146/annurev.matsci.28.1.153 [DOI] [Google Scholar]
- 25. Otsu N., IEEE Trans. Syst. Man. Cybern. 9, 62–66 (1979). 10.1109/TSMC.1979.4310076 [DOI] [PubMed] [Google Scholar]
- 26. Stiles T., Fallon R., Vestad T., Oakey J., Marr D., Squier J., and Jimenez R., Microfluid. Nanofluid. 1, 280 (2005). 10.1007/s10404-005-0033-z [DOI] [Google Scholar]
Associated Data
This section collects any data citations, data availability statements, or supplementary materials included in this article.
Supplementary Materials
See supplementary material for more information on hydrostatic experiments on the controlled focus flow diameter and for a confocal microscopy video showing an axis-symmetric effect on the focused flow in both lateral (x-y) and vertical (x-z) axes.


