

Abstract
Some genera of ciliates, such as Oxytricha and Stylonychia, undergo massive genome reorganization during development and provide model organisms to study DNA rearrangement. A common feature of these ciliates is the presence of two types of nuclei: a germline micronucleus and a transcriptionally-active somatic macronucleus containing over 16,000 gene sized “nanochromosomes”. During conjugation the old parental macronucleus disintegrates and a new macronucleus forms from a copy of the zygotic micronucleus. During this process, macronuclear chromosomes assemble through DNA processing events that delete 90-98% of the DNA content of the micronucleus. This includes the deletion of noncoding DNA segments that interrupt precursor DNA regions in the micronucleus, as well as transposons and other germline-limited DNA. Each macronuclear locus may be present in the micronucleus as several nonconsecutive, permuted, and/or inverted DNA segments. Here we investigate the genome-wide range of scrambled gene architectures that describe all precursor-product relationships in Oxytricha trifallax, the first completely sequenced scrambled genome. We find that five general, recurrent patterns in the sets of scrambled micronuclear precursor pieces can describe over 80% of Oxytricha's scrambled genes. These include instances of translocations and inversions, and other specific patterns characterized by alternating stretches of consecutive odd and even DNA segments. Moreover, we find that iterating patterns of alternating odd-even segments up to four times can describe over 96% of the scrambled precursor loci. Recurrence of these highly structured genetic architectures within scrambled genes presumably reflects recurrent evolutionary events that gave rise to over 3,000 of scrambled loci in the germline genome.
Keywords: scrambled genes, genome rearrangement, homologous recombination, DNA inversion, translocation
The ciliates Oxytricha and Stylonychia are microbial eukaryotes that undergo massive genome rearrangement during their sexual life-cycle. We provide a short description of the biological phenomenon and refer the reader to recent reviews [1, 2] and references therein for more details. Ciliates have two types of nuclei, a germline micronucleus (MIC) and a transcriptionally-active somatic macronucleus (MAC). The macronuclear DNA of O. trifallax consists of multiple copies of over 16,000 different gene-sized nano-chromosomes [3]. During sexual reproduction, the parental MAC disintegrates and a new MAC forms from a copy of the new zygotic micronucleus. In the midst of this process, macronuclear chromosomes assemble through DNA processing events involving global deletion of 90-98% of the germline DNA, eliminating nearly all so-called “junk” DNA, including short DNA segments (internal eliminated sequences, IESs) that interrupt precursor of macronuclear gene loci in the micronucleus. Because IESs often interrupt coding regions, each macronuclear gene may appear as several nonconsecutive segments (macronuclear destined sequences, MDSs) in the micronucleus. Moreover, the precursor order of these MDS segments for over 3,500 genes can be permuted in the micronucleus [4]. During macronuclear development, the IESs that interrupt MDSs are deleted, and the MDSs rearrange to form the gene-sized chromosomes. Assembly of the new macronuclear chromosomes may require any combination of the following three events: descrambling of segment order, DNA inversion, and IES removal. Telomere addition also occurs at both nanochromosome ends. Several theoretical models have studied these DNA recombination processes [5, 6, 7, 8, 9]. The more recent models include an additional template RNA (or DNA) that guides the recombination process [8, 9], as experimentally demonstrated in [10]. A theoretical model based on spatial graphs was also introduced in [9]. This model describes a micronuclear locus as a spatial graph, called an assembly graph, where vertices represent the homologous recombination sites, while a macronuclear chromosome is represented as a special path in the graph.
Recently the whole macronuclear (MAC) [3] and micronuclear (MIC) genomes for O. trifallax have been reported [4], allowing for a genome-wide annotation of the rearrangement maps between the MIC and the MAC sequences. Although the somatic genome sequences for other species of ciliates have been reported as well, e.g., [11, 12, 13, 14]. Chen et al. [4] provides the first published germline genome for any ciliate species. This allows us to draw a thorough comparison of the genetic sequences between the two types of nuclei, and to study the scrambled genetic patterns on a genome-wide scale.
In this paper we analyze the patterns of scrambled genes of Oxytricha trifallax. Specifically, we identify the distributions of scrambled and nonscrambled genes, and for scrambled genes, we identify the precursor scrambled patterns with two representations: (a) DNA sequence rearrangement maps and (b) assembly graph representations. Five basic types of scrambled patterns are present in the sequences: 1) translocation, 2) inversion, 3) translocation together with inversion, and 4,5) two types of global rearrangement maps of successive odd-even arrangements. These descriptions account for 81.7% of all scrambled genes. Moreover, combinations of two or three of these steps or operations can account for over 90% of all scrambled genes. We further analyze scrambled patterns in the remaining complex cases and find that most of these loci (96.4%) can derive from nested cases (up to 5 iterations) of the previous operations, reflecting multiple layers of DNA rearrangements during evolution.
1. Materials and Methods
1.1. The analyzed data set
The MDS annotations analyzed in this paper are presented in [4], and can be downloaded directly from http://trifallax.princeton.edu/cms/raw-data/genome/mic/Oxytricha_trifallax_micronuclear_genome_MDS_IES_maps.gff, where the whole genome of Oxytricha trifallax is reported. This file contains MDS annotations for the 16,220 MAC contigs whose precursor MDSs map completely (>90% covered) to single MIC loci, which constitutes over 88% all the contigs in the complete MAC assembly. The MDSs of the scrambled MAC genes are disproportionately mapped to multiple MIC loci [4], but at least 2,021 scrambled MAC loci are contained within single MIC loci. The data annotation includes the locations of MDSs in the MIC genome, labeled with their relative order of appearance, and whether the sequence of each MAC contig contains either or both telomeres (indicating the extent of the completion of the MAC contig assembly). The presence of two telomere sequences in a MAC contig indicates a complete somatic chromosome sequence (most of which are short and contain a single gene). MAC contigs can exhibit alternative fragmentation, with telomeres present at different sites, leading to multiple isoforms of a gene [3].
We filtered the data so that consecutive MDSs for a single MAC contig that overlap or have no nucleotide gap (adjacent) in the MIC are merged (correcting previous annotation artifacts). Further, a MAC contig is excluded from the dataset for analysis if either (a) it contains non-consecutive MDSs that overlap in a MIC contig, that is, two segments that are distant in the MAC contig overlap in a MIC contig, or (b) the MAC contig is an alternative fragmentation of a longer MAC contig. See Supplementary Materials for a detailed description of the data processing.
Let represent the processed dataset. Specifically, is the set of MDS sequences describing all MAC contigs in the annotation provided in [4] that remain after the above filtering steps, and represents 97.5% of the MAC contigs with >90% coverage in the MIC, together with their corresponding MIC loci. Table 1 shows different cases of MAC contigs in , which contains 15,811 MAC contigs in total. There are 2,958 MAC contigs whose MDSs overlap with MDSs of other MAC loci, for example when the telomere addition site often overlaps between the end of one locus and the beginning of the next locus [4]. If a MAC contig C overlaps with another contig C′, then both of them are counted as overlapping contigs. The remaining contigs belong to the non-overlapping category.
Table 1.
Summary of the processed O. trifallax MIC MDS annotation reported in [4]. Each MAC contig is categorized according to the proximity of its MDSs with those of another MAC contig within a MIC locus.
| Oxytricha trifallax MAC contigs and their corresponding MIC loci (16,220) | |||
| Filtered MAC contigs and their MIC loci (15,811), data | |||
| Overlapping (2,958) | Non-overlapping (12,853) | ||
| Interleaving (790) | Non-interleaving (12,063) | ||
| Sole MAC contig on a MIC contig (1,252) | Multiple MAC contigs on a MIC contig (10,811) | ||
A MAC contig C is called interleaving if two or more of its precursor MDSs are separated by a segment containing an MDS of another contig. There are 790 interleaved contigs and 12,063 non-interleaved contigs among the non-overlapping MAC contigs. There are 1,252 MIC contigs in the previously published genome assembly that contain the precursor MDSs for only a single MAC contig and all are non-interleaving. The remaining 10,811 MAC contigs reside within MIC contigs that contain precursor sequences for multiple MAC loci.
1.2. Definition of a Rearrangement Pattern
For a macronuclear (MAC) contig and a micronuclear (MIC) contig that contain corresponding MDSs, a micronuclear rearrangement map is a description of both the position and the orientation of each MDS in the micronuclear contig, relative to the macronuclear contig. Up to four different sequence rearrangement maps, according to choices of the DNA strands in the MIC and MAC contigs, describe the same pattern of rearranged sequence. For instance in Fig. 1, the nucleotide sequence for the MDS M*=AAACTATTTTGTGAATTCT, on strand ①, appears in both the macronuclear and micronuclear contigs, but its annotation position and orientation are dependent on the DNA strands chosen as reference. Reading from 5′ to 3′, M* is either third MDS, labeled M3, when the annotation uses strand ③, or it is the second MDS, labeled M2, when the annotation uses strand ④. Once a MAC strand ③ or ④ is chosen, depending on the longest open frame (or the transcription unit in the case of RNA genes), the order of the MDS M* in the MAC contig is fixed. The orientation of M* is described relative to a MIC reference strand, ① or ②. If ① and ③ are chosen as the reference strands, then M* appears inverted, denoted by M̄3, in the micronuclear contig relative to the macronuclear contig, whereas if ② and ④ are chosen, M* appears non-inverted, and is denoted M2.
Figure 1.

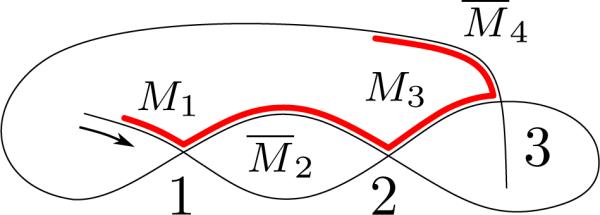
A recombination pattern that could be annotated with the four possible rearrangement maps α = M2M̄3M1M̄4, αI = M̄4M̄1M3M̄2, αA = M̄3M2M̄4M̄1, and αAI = M1M4M̄2M3, which correspond to the choice of micronuclear and macronuclear strands ① & ③, ② & ③, ① & ④, and ② & ④ respectively. Corresponding schematic diagrams of rearrangement maps are depicted below where MAC, the MDSs are labeled from left to right.
In general, if a MAC contig consists of n MDSs, then the ith MDS with respect to one of the strands of the MAC contig might also be described as an inverted (n + 1 – i)th segment with respect to the other strand of the MAC contig. Mathematically, we define a permutation ρ : {1, . . . , n} → {1, . . . , n} with ρ(i) = n + 1 – i which we call the reverse-index operation.
Given a set Δ = {M1, M2, . . . , Mn} a micronuclear rearrangement map is a sequence
where (i1, i2, . . . , in) is a permutation of indices {1, 2, . . . , n} and ϵi ∈ {1, −1} for i = 1, . . . , n. Each symbol Mi indicates an MDS in a MAC contig. A rearrangement map is a reading of the MDS segments in a micronuclear contig annotated with respect to fixed strand in the MAC contig and a fixed strand in the MIC contig. If ϵj = −1 then we say that Mij is inverted and we also write M̄ij. The inverse of rearrangement map α is which corresponds to reading of the MDSs with respect to the other strand of the MIC contig. The reverse-index rearrangement map of α is which corresponds to ordering of the MDSs with respect to the complementary strand of the MAC contig. Finally, the fourth possible rearrangement map corresponding to the same MIC-MAC contig is the inverse reverse-index rearrangement map . We say that two rearrangement maps α and β, which describe unrelated MAC loci, are equivalenet and write α ≡ β if β ∈ {α, αI, αA, αAI}. A rearrangement pattern (or just a pattern) is an equivalence class of rearrangement maps. A rearranegement map α is scrambled if it is not equivalent to M1M2 · · · Mn, and we say that the pattern represented by α is also scrambled.
Since each pattern may be represented by up to four equivalent rearrangement maps, for each pattern we choose a pattern representative that 1) has minimal number of inverted MDSs in the rearrangement map, 2) has the lowest numerical lexicographic order for the MDS positions, and 3) delays the first inversion as late as possible, applied in order of precedence 1, 2 and 3. Thus, when two equivalent rearrangement maps do not have the same number of inverted MDSs, priority is given to the rearrangement map with fewer non-inverted segments. If there are two such rearrangement maps, the priority is given to the one with smaller lexicographic order of the MDSs. For example, in Fig. 1 both α and αAI minimize the number of inversions, but αAI has a lower lexicographic order so it is chosen to represent the scrambled pattern.
1.3. Reducing MDS Rearrangement Maps
MDSs for nonscrambled patterns appear as consecutive in the MIC.
Experimental data for a small number of loci suggests that the excision of IESs separating consecutive MDSs occurs early in macronuclear development (before DNA unscrambling) [15]. In terms of rearrangement maps, excision of IESs flanked by consecutive MDSs Mj, Mj+1, . . . , Mj+k, can be rewritten as
and
For convenience, we relabel such a reduced rearrangement map so that there are no breaks in consecutive MDS positions. In these cases, we say that the MDSs Mj · · · Mj+k are merged into Mj (or M̄j, respectively). For example, the consecutive MDSs in the rearrangement map α = M2M3M1M̄6M̄5M̄4M7 are (M2M3) and (M̄6M̄5M̄4), so α reduces to (M2)M1(M̄4)M7 which we relabel to αred = M2M1M̄3M̄4. With this convention, all nonscrambled rearrangement maps have a reduced rearrangement map of either αred = M1 or M̄1 because all MDSs merge into M1.
1.4. Double occurrence words and assembly graphs
MDSs in the MIC begin and end with short sequences, denoted “pointers,” that provide some of the information for linking consecutive MDSs. The ith MDS in a MAC contig ends with a short (typically 2–20 bp) nucleotide repeat that also occurs at the beginning of the (i + 1)st MDS. These pointers annotate recombination junctions that form the MAC contig (dark blue in Fig. 1). After recombination, these pointer sequences appear as only one copy in the MAC contig. We model the rearrangement process with graphs and their corresponding words. For detailed explanation of the model, we refer the reader to [9, 16].
The pointers at the beginning and end of every MDS Mi are represented by a pair of integers i – 1 and i, respectively, and for brevity we call them pointers i – 1 and i. The first MDS has pointers b and 1, with b indicating the beginning of a MAC gene (5′ telomere sequence), and the last (nth) MDS of the gene has pointers n – 1 and e, with e indicating the end of the gene (3′ telomere sequence). A word associated with a rearrangement map is the list of pointers, in order, as one traces an annotated MIC contig, reading 5′ to 3′. If a MAC contig consists of a single MDS in the MIC then it corresponds to the word be, i.e., beginning and end, because there are no pointers. For the MIC contig depicted in Fig. 1 and the choice of MDS order according to strands ① and ③, we obtain the (ordered) pointer list 1232b13e. Since the 5′ telomere addition site, b, of the first MDS M1 and the 3′ telomere addition site, e, of the last MDS M4 do not participate in the MDS reordering process, we can delete them in our representation. In the remaining word, 123213, every symbol, denoting an authentic pointer, appears twice. A double occurrence word (DOW for short) is a word in which every symbol appears exactly twice. For every pointer list obtained from a MIC contig, there is a corresponding DOW as described above. In the case of a single MDS MAC contig with a pointer list be, the corresponding DOW is the empty word ∅.
We associate a spatial graph with every DOW in the following way. Place vertices (points) on the plane labeled with pointer symbols i, a starting point s, and a final point f. Starting from the vertex (point) s (indicating the 5′ end of a MIC locus corresponding to strand ①), connect the vertices with line segments (edges) in the order of the symbols that appear in the given DOW. Since each symbol in the DOW appears twice, we visit every vertex (points labeled with symbols from the DOW) twice. When we visit a vertex for the second time, we go straight through it, intersecting the existing line, to the opposite side forming a cross at the vertex. The path terminates at vertex f. A graph constructed in this manner is called an assembly graph and corresponds to the MIC loci. The vertices labeled with DOW symbols represent the pointers. Note that s and f, representing the MIC loci ends, can differ from b and e which denote the 5′ and 3′ ends of the MAC loci – except when the terminal MDSs and hence the telomere addition sites, flank the MIC locus. In Fig. 2, the graph corresponds to the DOW 123213, representing the MIC contig, and its pointer list, shown in Fig. 1. The MDSs are indicated with bold red, and their order is labeled according to choice of strands ① and ③, as described above for the DOW 123213. The MAC contig associated with this description represents a specific path through the graph (red portion) with all segments in the order M1M2M3M4. Since the graph represents a specific MIC contig, reading the path of the graph from s to f produces the rearrangement map α = M2M̄3M1M4. Reading the MDSs from f to s (reading strand ② from 5′ to 3′ in Fig. 1) produces the equivalent rearrangement map αI = M̄4M̄1M3M̄2. Similarly, relabeling the MDSs in Fig. 2 as M1M2M3M4 from e to b (reading strand ④ from 5′ to 3′ in Fig. 1) produces the equivalent rearrangement map αA = M̄3M2M̄4M̄1.
Figure 2.

The assembly graph 123213 that corresponds to the MIC and MAC contigs of Fig 1. The thin black path, s123213f, that transverses the assembly graph represents the (precursor) locus on the MIC contig, and the bold red path, b123e, indicates the (product) MAC contig. The vertices of the graph represent the recombination junctions, i.e., the overlapping pointers. The segments between the vertices represent the MDSs of the MAC contig. Because the paths related to the MIC and MAC contigs follow the directions of the strands ① and ③ in Fig 1, respectively, the MDSs encountered when following the path from s to f are expressed through the rearrangement map α = M2M̄3M1M4.
We note that there may be several patterns that correspond to a given assembly graph. In particular, the map M1M3M̄2M̄4 has the same pointer sequence 123213 as α = M2M̄3M1M4 but its pattern (represented by the path in red in Fig. 3) is distinct from the pattern of α. Both correspond to the same assembly graph depicted in Fig. 2.
Figure 3.
Another rearrangement pattern represented by the same assembly graph as in Fig. 2.
The reverse of a word w = a1 · · · ak is wR = ak · · · a1. Two double occurrence words are equivalent if, after renaming of the symbols, either they are identical or one is the reverse of the other. For example, w = 123213 is equivalent to its reverse wR = 312321 and w′ = 123132 is equal to wR after renaming in w′: 1 with 3, 2 with 1, and 3 with 2. Therefore w, wR, and w′ are equivalent. Note that this does not distinguish between the sense or antisense strand order, but is an independent pattern. Two assembly graphs are isomorphic if and only if they correspond to equivalent DOWs [16].
For convenience we choose a DOW representative where 1 is the letter assigned to the first vertex that is encountered in the graph starting from s, 2 is the next vertex, and so on. A DOW is in ascending order if the first occurrence of the numbers is in the order 1, 2, 3, . . .. For example, w = 123213 is an assembly word in ascending order. Its reverse, with the same letters, is wR = 312321, which is not in ascending order, but by renaming the letters, we obtain w′ = 123132 in ascending order, which represents the same graph ordering the vertices from f to s.
Consecutive MDSs in a rearrangement map correspond to a consecutive repetition of symbols. Reduction of a rearrangement map removes the consecutive symbols that are equal, corresponding to a DNA recombination event between the two matching pointers, or simplifying the DNA sequence by eliminating simple IESs separating consecutive, nonscrambled MDSs. A similar operation on DOWs was considered in [5]. In the example from Section 1.3, the reduction of α = M2M3M1M̄6M̄5M̄4M7 to αred = M2M1M3M4 corresponds to the removal of the repeated letters 2, 4, and 5 from the DOW w = 122316554436, which becomes 131636 and is relabeled in ascending order to wred = 121323. Biologically, during macronuclear development, evidence [15] suggests that simple IESs between nonscrambled MDSs may be eliminated first, before translocations or inversions that descramble the remaining MDS segments. This lends support to the proposed model.
1.5. Repeat and Return Words
We observe that the particular patterns
occur highly among the scrambled MIC loci, where the portions indicated “· · ·” can contain any other MDS sequence in the MAC contig (see Fig. 4). These MDS rearrangement maps correspond to 12345 · · · 12345, which is a repeat word, as in Fig. 4(A) and 12345 · · · 54321, which is a return word, as in Fig. 4(B) in the DOW. To analyze all general appearances of these patterns in the genome, we define the following formal notions.
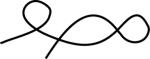
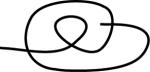
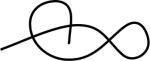
Figure 4.

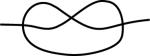
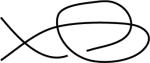
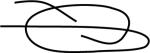
Assembly graphs corresponding to (A) repeat and (B) return words, associated with odd-even patterns.
A word u, where u = i(i + 1) · · · (i + j) for some positive integers i, j, is called a repeat of w, if w can be written as w0uw1uw2. This means that u has at least two symbols and occurs twice in w.
A word u, where u = i(i + 1) · · · (i + j) for some positive integer i, j, is called a return of w, if w can be written as w0uw1uRw2. Here both uuR and w0w1w2 are DOWs with no letters in common.
A word u is a subword of w if w is written as w = v1uv2, where v1 and v2 are also words. A repeat or return u of w is called maximal if it is maximal with respect to the inclusion (of subwords). That is, u is not a proper subword of another repeat or return word.
In a broader sense, the maximal repeat and return words capture the longest run of consecutive odd-even interleaving MDS segments in a scrambled MIC contig. For example, in the word w = 12345677651234, the words 12 and 123 are both repeat words of w and subwords of the maximal repeat word 1234 of w. Similarly 67 is a return word of w and a subword or the maximal return word 567 of w. A special case of repeat and return words are studied in [17], which analyzed the nested appearances of these words in a given DOW. Here we perform similar analysis of nested repeat and return words for the annotated data to estimate all appearances of odd-even interleaved MDS patterns in Oxytricha trifallax. An example of a contig whose graph contains two step nested repeat and return words is depicted in Fig. 5.
Figure 5.

(A) Assembly graph representation of Contig19801.0, highlighting nested sequences of repeat words and the corresponding DOW. Vertices are labeled in ascending order, and those that correspond to pointers of consecutive MDSs (incident to loops) are in parenthesis. (B) Reducing the rearrangement map (as described in Section 1.2) corresponds to removal of the loops (red boxes). The reduced DOW 156789(10)5689(10)17 relabeled in ascending order is 12345672356714. (C) The repeats 23 and 567 (indicated with parentheses in the DOW and red boxes in the graph) are removed in the first iteration to yield the word 1414, which is 1212 (D) in ascending order and a repeat. Figure is not drawn to scale.
Repeat-return iterations
In order to analyze the nested appearances of repeat and return words we interactively remove their appearances in the DOWs. For each scrambled rearrangement map α in , we perform the following:
Merge consecutive MDSs in α to reduce it as described in Section 1.2. Construct the corresponding DOW w in ascending order. This is iteration 0.
Remove all maximal repeat and return words from w to obtain a new word w′ .
If w′ ≠ w, then increase the count of the number of iterations by one. If w′ is equal to w or the empty word, then return the number of iterations. Otherwise go to step 2.
We say that the word w stabilizes after the obtained number of iterations. Observe that a reduced word 1 1 can be considered trivially as a repeat or return word, but the iterative steps stop at the moment w becomes 1 1. Details of the above algorithm are included in the Supplementary Materials under Nested Repeat-Return Algorithm section.
2. Results
We examine the rearrangement maps corresponding to according to their respective reduced patterns and assembly graphs. In Section 2.1 we analyze the number of consecutive, nonscrambled MDSs contained in the micronuclear loci in , and describe the most frequent patterns that occur upon reducing their rearrangement maps. In Section 2.2 we show the assembly graphs corresponding to the most frequent reduced patterns in , and investigate their graph structures in terms of nested repeat-return patterns.
2.1. Frequency of Rearrangement Patterns
In order to characterize the scrambled patterns that occur in the O. trifallax genome, we investigated all micronuclear rearrangement maps in . Most (87.2%) MIC loci in are nonscrambled, i.e., they simply contain consecutive MDSs interrupted by IESs (note that this conclusion differs from [4] because is a subset of the data). The histogram in Fig. 6 represents the number of consecutive MDSs merged (IESs removed) during the rearrangement reducing process, as described in Section 1.2. The blue histogram represents the total number of MDSs merged in each nonscrambled rearrangement map in . The red portion of the histogram shows the number of consecutive, nonscrambled MDSs present in all scrambled rearrangement maps in . These nonscrambled MDSs can likewise be merged during the reduction. Figure 6 shows that most of the rearrangement maps have either 2 (1,332 nonscrambled and 160 scrambled loci) or 3 (1,333 nonscrambled and 162 scrambled loci) consecutive, nonscrambled MDSs, representing 18.9% of the rearrangement maps in . For nonscrambled rearrangement maps, the number of MDSs merged during the reduction process equals the number of MDSs in the original rearrangement map, and therefore this histogram reflects the total number of MDSs in these cases (similar to Fig. 2A in [4]). In contrast, the number of MDSs that can be reduced in the scrambled rearrangement maps is sometimes zero or slightly fewer than the number of MDSs annotated for this locus in the MIC genome. 51.5% of the MAC contigs contain between 1-6 nonscrambled (consecutive) MDSs that can be merged in this process. The maximal number of MDSs that can be merged is 149, and belongs to the scrambled gene Contig13198.0 which has total of 154 MDSs (including a total of 149 nonscrambled MDSs). Fig. 7 lists the number of MDSs remaining in the reduced rearrangement maps. The most complex case is the scrambled Contig16618.0.1, which has 89 scrambled segments, none of which can be reduced.
Figure 6.

Number of consecutive, nonscrambled MDSs present in nonscrambled loci (blue) and scrambled loci (red). These can be respectively merged in the rearrangement map reduction process.
Figure 7.

Number of MDSs remaining in the reduced rearrangement maps. All nonscrambled loci contain only one MDS in their reduced form (hence the spike at 1), whereas the scrambled rearrangement maps have multiple MDSs.
The dataset contains 2,021 scrambled rearrangement maps for MAC contigs. Here we analyze their reduced forms. We follow the convention to describe pattern representatives as described at the end of Section 1.2. The patterns appear as five basic types that describe over 90% of the scrambled rearrangement maps. Translocations are scrambled patterns containing a block of consecutive MDSs repositioned elsewhere in the MIC genome but in the same orientation. For instance, M2M1, M1M3M2, and M1M3M2M4 are translocations in Fig. 8(A). Inversions are scrambled patterns with reduced representation of the form M1M̄2 or M1M̄2M3 (Fig. 8(B)). A translocation-inversion pattern refers to the situation in which a block of MDSs are repositioned in the MIC contig in the opposite orientation (Fig. 8(C)). An example of a reduced pattern representative with translocation-inversion is M1M3M̄2.
Figure 8.

Schematic representation of the most frequently occurring types of scrambled patterns in O. trifallax.
The fourth type of pattern frequently observed is a sequence of increasing odd numbered MDSs followed by increasing even numbered MDSs, or an odd-even repeat pattern, for example M1M3M5M2M4M6. A schematic representation of this pattern is shown in Fig. 8(D). The fifth type of pattern observed is a sequence of increasing odd numbered MDSs followed by a decreasing and inverted even numbered MDSs, which we call an odd-even return pattern, for example M1M3M5M̄6M̄4M̄2. The schematics of this pattern is represented in Fig. 8(E). Return and repeat pattern types correspond to return and repeat DOWs, and their associated assembly graphs are depicted in Fig. 4.
Table 2 lists the frequencies of each scrambled pattern that occurs in the Oxtricha trifallax genome annotations [4]. Among the 2,021 scrambled loci, 854 (42.3% of the scrambled rearrangement maps) are represented by the pattern M1M̄2, i.e., consist of a single inversion at one end of the map. By contrast, a single inversion in the interior of the MIC loci, M1M̄2M3, occurs only 27 times (1.3% of the scrambled rearrangement maps). After inversion, the next most common rearrangement event is translocation, among which the most common reduced map is the circular permutation M2M1 (307 occurrences). Odd-even patterns appear quite often (290 times) while translocation-inversion occurs least often (only 59 occurrences). These five types of patterns account for 81.7% of the scrambled loci. Of the remaining 370 types of scrambled loci, 243 are composites of two of the five recurrent patterns and these account for 93.7% of all scrambled reduced loci. For example, the pattern M1M̄4M̄2M3 can be explained as the odd-even return pattern M1M3M̄4M̄2 together with a translocation of M3 to the end of the sequence. A complete list of all patterns that occur at least twice is included in the Supplementary Materials.
Table 2.
Frequency of different patterns in the MIC loci in Oxytricha trifallax. The table includes pattern representatives as described in Section 1.2. For example, the rearrangement map M2 M4 . . . M2k M1 M3 . . . M2k+1 is not listed in the table because its pattern is equivalent to M1 M3 . . . M2k+1 M2 M4 . . . M2k.
| Pattern type | Locus | Reduced MIC pattern representative | Count |
|---|---|---|---|
| Non-scrambled (13,790) | – | M 1 | 13,790 |
| Inversion (881) | End | 854 | |
| Inner | M1 M̄2 M3 | 27 | |
| Translocation (421) | End-End | M2 M1 | 307 |
| End-Inner | M1 M3 M2 | 79 | |
| Inner-Inner | M1 M3 M2 M4 | 35 | |
| Translocation & Inversion (59) | Inner-End | M1 M3 M̄2 | 34 |
| End-Inner | M1 M̄3 M2 | 21 | |
| Inner-Inner | M1 M3 M̄2 M4 | 4 | |
| Odd-Even Global Patterns (290) | Repeat | M1 M3 . . . M2k–1 M2 M4 . . . M2k (k > 2) | 99 |
| M1 M3 . . . M2k+1 M2 M4 . . . M2k (k > 2) | 96 | ||
| M2 M4 . . . M2k M1 M3 . . . M2k–1 (k > 1) | 29 | ||
| Return | M1 M3 . . . M2k–1 M̄2k . . . M̄4 M̄2 (k > 1) | 40 | |
| M1 M3 . . . M2k+1 M̄2k . . . M̄4 M̄2 (k > 1) | 26 | ||
| Other (370) | – | see Supplementary Materials | 370 |
2.2. Graph Patterns of Scrambled Rearrangement Maps
We now consider the DOWs and graph structures corresponding to all reduced rearrangement maps in . The set of DOWs (written in ascending order) obtained from MDS lists in consists of 15, 811 words. As in Section 1.2 we reduce each DOW by removing the symbols that correspond to pointers of consecutive, nonscrambled MDSs (MaMa+1) in the original rearrangement map, i.e., that appear as aa in the DOW. We denote with the list of all reduced double occurrence words obtained from . The list contains DOWs of length 0 through 88, and the words of up to three symbols are summarized in Table 3.
Table 3.
Double occurrence words and assembly graphs corresponding to reduced rearrangement maps that contain four or fewer MDSs. The remaining 505 scrambled MAC contigs, with reduced rearrangement maps of five or more MDSs, can be found in the Supplementary Materials.
| DOW | Contigs | Patterns |
|---|---|---|
| 11 | 1, 161 | 2 |
| Total | 1, 161 (7.3%) | 2 |
| DOW | Contigs | Patterns |
|---|---|---|
| 1212 | 177 | 7 |
| 1221 | 47 | 2 |
| 1122 | 17 | 1 |
| Total | 241 (1.5%) | 10 |
| DOW | Contigs | Patterns | Graphs |
|---|---|---|---|
| 123123 | 60 | 5 of 10 |
|
| 123321 | 15 | 2 of 2 |

|
| 123213 | 12 | 6 of 20 |

|
| 123231 | 9 | 5 of 11 |
|
| 121233 | 6 | 1 of 4 |
|
| 121323 | 4 | 1 of 14 |
|
| 122133 | 4 | 1 of 1 |
|
| 122313 | 3 | 3 of 6 |
|
| 123312 | 1 | 1 of 2 |
|
| Total | 114 (0.7%) | ||
Original word is ∅ which reduces to ∅
Original word is 1122 . . . which also reduces to ∅
834 MAC contigs (5.3%) lack IESs and thus consist of a single MDS. Their rearrangement map corresponds to the empty DOW. 12,956 nonscrambled MAC contigs contain more than one MDS (maximum 120) and these contigs correspond (before reduction) to DOWs consisting of a list of consecutive identical letters, e.g., 1122 · · · which also reduce to the empty word. Hence, 87.2% of all MAC contigs in represent nonscrambled MAC contigs (first row of Table 2). We concentrate below on the remaining 2,021 (or 11.8%) scrambled MAC contigs.
Over half of all scrambled loci, or 1,161 MAC contigs have a reduced representation as the DOW aa for a single letter a. This means that the original DOW sequence can be written as w = w1aw2a, where both w1 and w2 comprise a string of nonscrambled MDSs, represented as a sequence of consecutive pairs of identical letters that reduces to the empty word. For example, 1122344553 has this property, where a = 3, w1 = 1122, and w2 = 4455. There are only two nonequivalent patterns that correspond to this situation: M1M̄2 and M2M1 (compare with Table 2). The distributions of occurrences for each of the two situations are given in Fig. 9, and their assembly graphs are depicted in Fig. 10. The rearrangement map M1 · · · MkM̄nM̄n–1 · · · M̄k+1 for some k in Fig. 10(A) corresponds to the pattern M1M̄2, and Mk+1Mk+2 · · · MnM1 · · · Mk (Fig. 10(B)), corresponds to the pattern M2M1.
Figure 9.

Contigs that reduce to the word “11” corresponding to pattern (A) M1M̄2 and (B) M2M1. The x-axis and y-axis represent the number of consecutive MDSs merged into M1 and M2 respectively, the z-axis shows the number of MAC contigs. In (B), due to the symmetry of the pattern M2M1, we chose M1 to represent the reduced arrangement with more consecutive MDSs merged than M2.
Figure 10.

Two assembly graphs with reduced DOW “11”, corresponding to the rearrangement maps (A) M1 · · · MkM̄nM̄n–1 · · · M̄k+1 and (B) Mk+1Mk+2 · · · MnM1 · · · Mk with respective patterns M1M̄2 and M2M1.
There are three possibilities for DOWs with two symbols: aabb, abab, and abba. Table 3 shows the numbers of appearances of words for each case among the scrambled contigs. These graphs correspond to patterns with three segments (after merging MDSs). For three letters, the DOWs and their occurrences are listed in Table 3. Curiously, the repeat word 123123 appears in the list of reduced DOWs far more often (60 times) than the others (15 or less). The third column of the table indicates the number of patterns detected versus the number of possible patterns reflected by the same word. For example, out of 60 occurrences of the repeat word 123123, 53 are represented by the odd-even repeat pattern: M1M3M2M4, suggesting that it is highly overrepresented. We investigate this trend further by subjecting the data to nested repeat-return pattern analysis as described at the end of Section 1.5.
After the first iteration removing maximal repeat and return words, out of 860 contigs corresponding to reduced words with at least two symbols, 634 contigs have words that reduce to the empty word, and the remaining 226 stabilize after 5 iterations. Table 4(A) indicates the number of MAC contigs whose words stabilize to the empty word after 1, 2, 3, and 4 iterations, respectively. All patterns in Table 2, except M1 M3 M̄2 M4 (which corresponds to translocation-inversion of an inner segment within an inner portion of the molecule) are special cases of repeat or return words. The number of contigs whose words do not stabilize to the empty word is 176. Four stabilize to words correspond to pattern M1 M3 M̄2 M4 and all the rest stabilize to patterns included in “other” in Table 2. Out of these 176 words, 103 stabilize to a word aa. Considering that aa corresponds to the simplest odd-even patterns, M2M1 and M1M̄2, only 73 patterns, or 3.6% of all scrambled loci cannot be explained with nested combinations of repeats and returns. Therefore, approximately 96.4% of all scrambled MIC contigs have patterns that require various combinations of nested repeat and return words for their description.
Table 4.
Number of repeat-return iterations necessary for the reduced DOWs with two or more letters, which correspond to rearrangement maps of scrambled genes, to stabilize. (A) Double occurrence words that iterate to the empty word correspond to genes that could arise from multiple iterations of the process that generates repeat-return patterns. On the other hand, words that stabilize before reaching the empty word (B) contain scramble patterns that are more complex than nested instances of the repeat-return patterns.
| Repeat-return iterations | DOWs of Scrambled Maps |
|---|---|
| 1 | 634 |
| 2 | 37 |
| 3 | 11 |
| 4 | 2 |
| Reduceda | 176 |
| Total | 860 |
Not a nested sequence of the repeat and return patterns
Contig7885.0, Contig22552.0, Contig15736.0, Contig11366.0.0, and Contig5956.0
Contig12243.0
Contig19180.0
Computations from the algorithm in Section 1.5 indicate that all words stabilize after 5 iterations. Table 4 lists the 176 words that do not stabilize to the empty word, but stabilize after 0, 1, 2, 3, 4, and 5 iterations. Of those that do not stabilize to aa, 32 stabilize to a word aabb. Of the remaining 41, 19 have 3 symbols and 22 have 4 or more symbols, and it appears that the MDS rearrangement maps in those 41 contigs have varied scrambled patterns. Most of them have a single occurrence in the set .
3. Discussion
In this paper, we initiate and introduce a mathematical formulation for analyzing patterns in gene rearrangements, and we apply this method to the completely sequenced, encrypted genome of O. trifallax. Rearrangements (as processes) have been studied with string rewriting operations (e.g. [6, 18]) and graph operations (e.g.[6, 9]), but the patterns in which segments appear in the scrambled genome and the extent of their appearance have not been considered, especially on a genome-wide scale. The notion of a rearrangement map pattern – as defined here – describes the relative sequence rearrangement between genetic precursor and product sequences, and it can be described with double occurrence words and also depicted with spatial graphs. Even the earliest sequencing of scrambled genes [19, 20] revealed the presence of even-odd patterns (the most prevalent patterns by our analysis). The description of patterns in rearrangement maps via assembly graphs offers a tool to classify and characterize the patterns. The recent sequencing of two (precursor and product) O. trifallax genomes [3, 4] permits a comprehensive study of the scrambled patterns in the micronuclear genome. Our study describes the patterns that appear at greatest frequency. We suggest that the theoretical models of gene rearrangement should focus on operations that can be applied to those frequent patterns.
The vast majority of the micronuclear genes in O. trifallax (~87.2% in data ) are nonscrambled and can therefore be described by simple nonscrambled rearrangement maps, similar to the situation in many other distant species of ciliates, such as Paramecium. In addition, many large regions of the scrambled micronuclear gene loci contain high number of consecutive, nonscrambled MDSs separated by IESs. Therefore their rearrangement maps, after compression of all the sequential nonscrambled MDSs, simply reduce to the same five fundamental types as seen before (e.g. [21]): inversion, translocation, translation-inversion, and various odd-even patterns. However, we note that inversion and translocation-inversion are the simplest instance of an odd-even return pattern [22], and translocation is the simplest version of the odd-even repeat pattern. From this perspective, the odd-even repeat and return patterns account for 81.7% of the 2,021 scrambled MAC contigs in . Almost all scrambled MIC contigs (96.4%) of the studied annotation are nested appearances of repeat-return words. Development of theoretical models that address rearrangement processes of these patterns, as well as experimental findings of intermediate molecules appearing during the rearrangement process may be of interest. The most complex rearrangement maps that do not conform to the iterative odd-even repeat-return patterns will be the subject of another study.
The evolutionary expansion of these recurring patterns in the germline loci must themselves have arisen from germline meitoic or mitotic recombination events that produce inversions and translocations in the MIC. This also suggests that the germline micronuclei may be particularly prone to recombination events that introduce or propagate the recurring odd/even split patterns in the genome, as proposed in [22] and described empirically in [23, 24, 25]. Chang et al. [23], in particular, noted the evolutionary trend towards expansion of the number of MDSs within odd-even clusters among later diverging lineages, including Oxytricha. More comparisons among orthologous genes in other species with scrambled genomes will reveal whether these patterns are conserved or embellished over evolutionary time. Once a locus has become scrambled, the chromosomal region may continue to become more complex during germline evolution via additional translocations or inversions [23]. Hence the iterative process that this study describes for reducing the scrambled rearrangement maps to their underlying simpler ones may allow us to estimate how many layers of germline recombination events have historically shaped these genomic regions. Comparative germline genomics among closely related species will be the best way to test these hypotheses and to infer the evolutionary steps through which a genome became so densely scrambled.
Supplementary Material
Acknowledgments
We wish to thank Kelsi Lindblad, Talya Yerlici, and Leslie Beh for their valuable comments. This study was supported by NIH grant GM109459 and NSF grant CCF-1526485.
Footnotes
Publisher's Disclaimer: This is a PDF file of an unedited manuscript that has been accepted for publication. As a service to our customers we are providing this early version of the manuscript. The manuscript will undergo copyediting, typesetting, and review of the resulting proof before it is published in its final citable form. Please note that during the production process errors may be discovered which could affect the content, and all legal disclaimers that apply to the journal pertain.
References
- 1.Yerlici VT, Landweber LF. Programmed genome rearrangements in the Ciliate Oxytricha. Microbiol. Spectrum. 2014;2(6) doi: 10.1128/microbiolspec.MDNA3-0025-2014. MDNA3–0025–2014. doi:10.1128/microbiolspec.MDNA3-0025-2014. [DOI] [PMC free article] [PubMed] [Google Scholar]
- 2.Bracht JR, Fang W, Goldman AD, Dolzhenko E, Stein EM, Landweber LF. Genomes on the edge: Programmed genome instability in ciliates. Cell. 2013;152(3):406–416. doi: 10.1016/j.cell.2013.01.005. doi:10.1016/j.cell.2013.01.005. [DOI] [PMC free article] [PubMed] [Google Scholar]
- 3.Swart EC, Bracht JR, Magrini V, Minx P, Chen X, Zhou Y, Khurana JS, Goldman AD, Nowacki M, Schotanus K, Jung S, Fulton RS, Ly A, McGrath S, Haub K, Wiggins JL, Storton D, Matese JC, Parsons L, Chang W-J, Bowen MS, Stover NA, Jones TA, Eddy SR, Herrick GA, Doak TG, Wilson RK, Mardis ER, Landweber LF. The Oxytricha trifallax macronuclear genome: A complex eukaryotic genome with 16,000 tiny chromosomes. PLoS Biol. 2013;11(1):e1001473. doi: 10.1371/journal.pbio.1001473. doi:10.1371/journal.pbio.1001473. [DOI] [PMC free article] [PubMed] [Google Scholar]
- 4.Chen X, Bracht JR, Goldman AD, Dolzhenko E, Clay DM, Swart EC, Perlman DH, Doak TG, Stuart A, Amemiya CT, Sebra RP, Landweber LF. The architecture of a scrambled genome reveals massive levels of genomic rearrangement during development. Cell. 2014;158(5):1187–1198. doi: 10.1016/j.cell.2014.07.034. doi:10.1016/j.cell.2014.07.034. [DOI] [PMC free article] [PubMed] [Google Scholar]
- 5.Ehrenfeucht A, Harju T, Petre I, Prescott DM, Rozenberg G. Computation in Living Cells: Gene Assembly in Ciliates, Natural Computing Series. Springer; Berlin Heidelberg: 2004. doi:10.1007/978-3-662-06371-2. [Google Scholar]
- 6.Ehrenfeucht A, Harju T, Rozenberg G. Gene assembly through cyclic graph decomposition. Theor. Comput. Sci. 2002;281(12):325–349. selected Papers in honour of Maurice Nivat. doi:10.1016/S0304-3975(02)00019-1. [Google Scholar]
- 7.Kari L, Landweber LF. Computational power of gene rearrangement. In: Winfree E, Gifford DK, editors. Proceedings of DNA Based Computers V, Vol. 54 of DIMACS: Series in Discrete Mathematics and Theoretical Computer Science. American Mathematical Society; 1999. pp. 207–216. [Google Scholar]
- 8.Prescott DM, Ehrenfeucht A, Rozenberg G. Template-guided recombination for IES elimination and unscrambling of genes in stichotrichous ciliates. J. Theoret. Biol. 2003;222(3):323–330. doi: 10.1016/s0022-5193(03)00037-7. doi:10.1016/S0022-5193(03)00037-7. [DOI] [PubMed] [Google Scholar]
- 9.Angeleska A, Jonoska N, Saito M, Landweber LF. RNA-guided DNA assembly. J. Theoret. Biol. 2007;248(4):706–720. doi: 10.1016/j.jtbi.2007.06.007. doi:10.1016/j.jtbi.2007.06.007. [DOI] [PubMed] [Google Scholar]
- 10.Nowacki M, Vijayan V, Zhou Y, Schotanus K, Doak TG, Landweber LF. RNA-mediated epigenetic programming of a genome-rearrangement pathway. Nature. 2008;451(7175):153–158. doi: 10.1038/nature06452. doi:10.1038/nature06452. [DOI] [PMC free article] [PubMed] [Google Scholar]
- 11.Aeschlimann SH, Jnsson F, Postberg J, Stover NA, Petera RL, Lipps H-J, Nowacki M, Swart EC. The draft assembly of the radically organized Stylonychia lemnae macronuclear genome. Genome Biol. Evol. 2014;6(7):1707–1723. doi: 10.1093/gbe/evu139. doi:10.1093/gbe/evu139. [DOI] [PMC free article] [PubMed] [Google Scholar]
- 12.Eisen JA, Coyne RS, Wu M, Wu D, Thiagarajan M, Wortman JR, Badger JH, Ren Q, Amedeo P, Jones KM, Tallon LJ, Delcher AL, Salzberg SL, Silva JC, Haas BJ, Majoros WH, Farzad M, Carlton JM, Smith RK, Jr., Garg J, Pearlman RE, Karrer KM, Sun L, Manning G, Elde NC, Turkewitz AP, Asai DJ, Wilkes DE, Wang Y, Cai H, Collins K, Stewart BA, Lee SR, Wilamowska K, Weinberg Z, Ruzzo WL, Wloga D, Gaertig J, Frankel J, Tsao C-C, Gorovsky MA, Keeling PJ, Waller RF, Patron NJ, Cherry JM, Stover NA, Krieger CJ, del Toro C, Ryder HF, Williamson SC, Barbeau RA, Hamilton EP, Orias E. Macronuclear genome sequence of the ciliate Tetrahymena thermophila, a model eukaryote. PLoS Biol. 2006;4(9):e286. doi: 10.1371/journal.pbio.0040286. doi:10.1371/journal.pbio.0040286. [DOI] [PMC free article] [PubMed] [Google Scholar]
- 13.Ricard G, de Graaf R, Dutilh B, Duarte I, van Alen T, van Hoek A, Boxma B, van der Staay G, Moon-van der Staay S, Chang W-J, Landweber LF, Hackstein J, Huynen M. Macronuclear genome structure of the ciliate Nyctotherus ovalis: Single-gene chromosomes and tiny introns. BMC Genomics. 2008;9(1):587. doi: 10.1186/1471-2164-9-587. doi:10.1186/1471-2164-9-587. [DOI] [PMC free article] [PubMed] [Google Scholar]
- 14.Vinogradov D, Tsoi O, Zaika A, Lobanov A, Turanov A, Gladishev V, Gelfand M. Draft macronucleus genome of Euplotes crassus ciliate. Molecular Biology. 2012;46(2):328–333. doi:10.1134/S0026893312020197. [PubMed] [Google Scholar]
- 15.Möllenbeck M, Zhou Y, Cavalcanti AR, Jönsson F, Higgins BP, Chang W-J, Juranek S, Doak TG, Rozenberg G, Lipps HJ, Landweber LF. The pathway to detangle a scrambled gene. PLoS ONE. 2008;3(6):e2330. doi: 10.1371/journal.pone.0002330. doi:10.1371/journal.pone.0002330. [DOI] [PMC free article] [PubMed] [Google Scholar]
- 16.Angeleska A, Jonoska N, Saito M. DNA recombination through assembly graphs. Discrete Appl. Math. 2009;157(14):3020–3037. doi:10.1016/j.dam.2009.06.011. [Google Scholar]
- 17.Arredondo R. On double occurrence words. Congr. Numer. 2013;218:43–56. [Google Scholar]
- 18.Angeleska A, Jonoska N, Saito M. Rewriting rule chains modeling DNA rearrangement pathways. Theor. Comput. Sci. 2012;454:5–22. doi:10.1016/j.tcs.2012.04.041. [Google Scholar]
- 19.Mitcham JL, Lynn AJ, Prescott DM. Analysis of a scrambled gene: the gene encoding α-telomere-binding protein in oxytricha nova. Gene Dev. 1992;6(5):788–800. doi: 10.1101/gad.6.5.788. doi:10.1101/gad.6.5.788. [DOI] [PubMed] [Google Scholar]
- 20.Hoffman D, Prescott DM. The germline gene encoding dna polymerase alpha in the hypotrichous ciliate oxytricha nova is extremely scrambled. Nucl. Acids Res. 1996;24:3337–3340. doi: 10.1093/nar/24.17.3337. doi:10.1093/nar/24.17.3337. [DOI] [PMC free article] [PubMed] [Google Scholar]
- 21.Prescott DM, Greslin AF. Scrambled actin I gene in the micronucleus of Oxytricha nova. Developmental Genetics. 1992;13(1):66–74. doi: 10.1002/dvg.1020130111. doi:10.1002/dvg.1020130111. [DOI] [PubMed] [Google Scholar]
- 22.Landweber LF. IEEE Proceedings of Symposia on Intelligence and Systems ’98, May 21-23, 1998. IEEE Computer Society Press; 1998. The evolution of DNA computing: Nature's solution to a path problem; pp. 133–139. [Google Scholar]
- 23.Chang W-J, Bryson PD, Liang H, Shin MK, Landweber LF. The evolutionary origin of a complex scrambled gene. Proc. Natl. Acad. Sci. U.S.A. 2005;102(42):15149–15154. doi: 10.1073/pnas.0507682102. doi:10.1073/pnas.0507682102. [DOI] [PMC free article] [PubMed] [Google Scholar]
- 24.Wong LC, Landweber LF. Evolution of programmed DNA rearrangements in a scrambled gene. Mol. Biol. Evol. 2006;23(4):756–763. doi: 10.1093/molbev/msj089. doi:10.1093/molbev/msj089. [DOI] [PubMed] [Google Scholar]
- 25.Hogan DJ, Hewitt EA, Orr KE, Prescott DM, Müller KM. Evolution of IESs and scrambling in the actin I gene in hypotrichous ciliates. Proc. Natl. Acad. Sci. U.S.A. 2001;98(26):15101–15106. doi: 10.1073/pnas.011578598. doi: 10.1073/pnas.011578598. [DOI] [PMC free article] [PubMed] [Google Scholar]
Associated Data
This section collects any data citations, data availability statements, or supplementary materials included in this article.