

SUMMARY
Squamous cell carcinoma in the head and neck (HNSCC) is a common yet poorly understood cancer, with adverse clinical outcomes due to treatment resistance, recurrence, and metastasis. Putative cancer stem cells (CSCs) have been identified in HNSCC and BMI1 expression has been linked to these phenotypes, but optimal treatment strategies to overcome chemotherapeutic resistance and eliminate metastases have not yet been identified. Here, we show through lineage tracing and genetic ablation that BMI1+ CSCs mediate invasive growth and cervical lymph node metastasis in a mouse model of HNSCC. This model and primary human HNSCC samples contain highly tumorigenic, quiescent, and cisplatin-resistant BMI1+ CSCs, which exhibit increased AP-1 activity that drives invasive growth and metastasis of HNSCC. Inhibiting AP-1 or BMI1 sensitized tumors to cisplatin-based chemotherapy and eliminated lymph node metastases by targeting CSCs and the tumor bulk, suggesting potential regimens to overcome resistance to treatments and eradicate HNSCC metastasis.
Keywords: Head and neck squamous cell carcinoma, Bmi1, Cancer Stem Cells, Metastasis, cisplatin resistance
In Brief
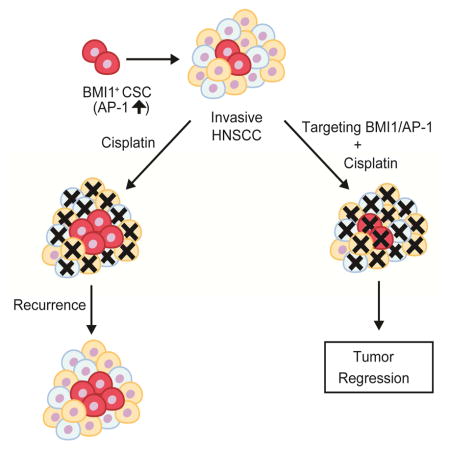
Chen et al. show BMI1+ CSCs drive invasive growth and cervical lymph node metastasis in squamous cell carcinoma. BMI1+ CSCs have increased AP-1 activity and are chemoresistant, and combination therapy that targets BMI1+ CSCs and the tumor bulk yields better outcomes and effectively eliminates metastasis.
INTRODUCTION
Squamous cell carcinoma (SCC) is the most common malignancy of head and neck mucosa and the second most common skin cancer. Currently, the standard of care for HNSCC includes surgical excision and combination of chemotherapy and radiotherapy (Chinn and Myers, 2015; Haddad and Shin, 2008). Nevertheless, the five-year survival rates for patients with HNSCC have remained low due to the high incidence of treatment resistance with consequent recurrence and lymph node metastasis (Hedberg et al., 2015; Polverini and Nor, 1999; Wang et al., 2012). Therefore, identifying the cellular and molecular mechanisms of treatment resistance and metastasis has become a prime target for novel drug discovery and design in an effort to develop effective therapies.
Growing evidence shows that, among all neoplastic cells, a very small fraction of cells serve as CSCs or cancer initiating cells that are critical for tumor initiation and growth and might be associated with metastasis and recurrence (Al-Hajj et al., 2003; Brooks et al., 2015; Kreso and Dick, 2014; Lathia et al., 2015). For the last decade, CSCs have been identified in a broad range of human solid tumors using cell surface markers, which are associated with their stem cell phenotype (Al-Hajj et al., 2003; Chakrabarti et al., 2014; Hermann et al., 2007; Liu et al., 2010; Zhu et al., 2014). These studies have identified and characterized CSCs largely based upon transplantation assays in which human tumor cells were isolated according to their expression of cell surface markers and then grafted into host mice. However, there are several limitations for these transplantation assays. For example, putative human CSCs might be perturbed during the change of tissue microenvironment and might be artificially selected due to manipulation in vitro (Brooks et al., 2015; Kreso and Dick, 2014). A mouse model will be beneficial to investigate the cellular and molecular mechanisms that underlie CSCs in HNSCC in vivo. Based on the CSC hypothesis, CSCs are located at the hierarchical apex of tumor cells that can self-renew as well as differentiate into the various cell types that comprise the tumor at large. Recently, lineage-tracing studies in mice has provided genetic evidence for CSC-driven clonal tumor growth in several types of malignancies and has become a golden standard for characterization of CSCs in vivo (Driessens et al., 2012; Nakanishi et al., 2013; Boumahdi et al., 2014;Oshimori et al., 2015; Schepers et al., 2012).
CSCs in HNSCC were first characterized based on the expression of the CD44 surface marker (Prince et al., 2007). Other features such as aldehyde dehydrogenase (ALDH) activity, expression of c-Met, ability to efflux vital dyes (side population), sphere-forming ability or a combination of these features have also been used to isolate and characterize putative CSCs in HNSCC in xenograft assays (Clay et al., 2010; Krishnamurthy et al., 2010; Lim et al., 2014; Song et al., 2010; White et al., 2013). Still, the role of CSCs in the initiation and progression of HNSCC has not been rigorously examined in vivo in unperturbed tumors. Moreover, based on the CSC hypothesis, CSCs are generally believed to be the origin of a tumor, which may give rise to secondary cancers at metastatic sites that follow a similar hierarchical organization as that of the primary tumor (Oskarsson et al., 2014). Unlike skin SCCs, HNSCC frequently metastasizes to cervical lymph nodes, and many patients with HNSCC are diagnosed at an advanced stage where tumor cells have seeded the cervical lymph nodes. HNSCC with lymph node involvement carries a poor prognosis and is an important factor in predicting recurrence and survival after removal of the primary tumor (Chinn and Myers, 2015; Hedberg et al., 2015). There are several unanswered questions that remain central to understanding the behavior of HNSCC as well as to improving the survival of HNSCC patients: First, are CSCs responsible for HNSCC cervical lymph node metastasis? Cervical lymph node metastasis portends a poor prognosis (Hedberg et al., 2015). As of yet, genetic lineage analysis has not been able to definitively show that CSCs mediate lymph node metastasis largely due to the experimental limitations of previous model systems. Second, are CSCs responsible for tumor recurrence or resistance after chemotherapy? While previous studies suggest that CSCs are resistant to chemotherapy, it has not been directly tested in vivo in an unperturbed tumor microenvironment. Third, if CSCs are the source of metastasis or recurrence, what therapeutic strategies can be employed to target these cells? Based on the CSC hypothesis, what is the optimal therapeutic strategy for HNSCC? In other words, should we solely target the rare CSCs by monotherapy or both CSCs and the tumor bulk with combination therapy, in order to achieve optimal outcomes?
Moloney murine leukemia virus insertion site 1 (Bmi1) is a core component of the polycomb repressive complex 1 (PRC1) that mediates gene silencing via monoubiquitination of histone H2A (Park et al., 2003; Wang et al., 2004). Bmi1 is an important stem cell self-renewal factor. Bmi1 has been found to be abnormally expressed in HNSCC and might be associated with the self-renewal of CSCs in HNSCC (Prince et al., 2007; Siddique and Saleem, 2012). For example, endothelial cells-derived growth factors potently promote the survival and self-renewal of CSCs in HNSCC by upregulating Bmi1 (Krishnamurthy et al., 2010). Cisplatin treatment has been found to induce Bmi1 expression and increase CSC populations in HNSCC (Nor et al., 2014). Epithelial-mesenchymal transition (EMT), tumor metastasis and CSC formation might be interconnected (Tam and Weinberg, 2013). In human HNSCC, Twist1 and Bmi1 act cooperatively to induce EMT and stemness, thereby indicating a role for Bmi1 in HNSCC metastasis (Yang et al., 2010). Based on these findings, we hypothesized that Bmi1+ tumor cells might represent CSCs in HNSCCs and be associated with therapy resistance in vivo. To address this hypothesis, we utilized a well-established mouse model of HNSCC induced by 4-Nitroquinoline (4NQO), which recapitulates the initiation, development and metastasis of human HNSCC (Squarize et al., 2013; Vitale-Cross et al., 2012). Using genetic lineage tracing, we show that Bmi1+ cells were slow-cycled tumor-initiating stem cells that were not only responsible for HNSCC development, but also mediated cervical lymph node metastasis. Bmi1+ CSCs in HNSCC had increased AP-1 activities, and were cisplatin-resistant that could recur after chemotherapy. Importantly, we showed that targeting the tumor bulk and Bmi1+ CSCs by combination therapy effectively inhibited HNSCC growth and eliminated metastasis.
RESULTS
Bmi1 is expressed in a subset of slow-cycling tumor propagating cells in HNSCC
To explore CSCs in HNSCC in vivo, mice were treated with 4NQO in their drinking water for 16 weeks before returning to normal drinking water for another 10 weeks (Figure 1A), as described previously (Vitale-Cross et al., 2012). Mice were then euthanized for the collection of their tongues and cervical lymph nodes. Consistent with previous reports (Vitale-Cross et al., 2012), mice developed lesions on the dorsal, ventral, and lateral borders of the tongue upon treatment of 4NQO (Figure1B). Histological staining showed that mice developed various squamous lesions ranging from hyperplasia, benign papilloma and overt SCC in the tongue tissue at week 26 (Figure 1C). To determine whether Bmi1 labeled CSCs in HNSCC, we performed tamoxifen-induced Cre-mediated lineage tracing in Bmi1CreER;RosatdTomato mice bearing HNSCC. Animals at 26 weeks after initial treatment of 4NQO were injected with a single dose of tamoxifen. One day after the injection, Tomato+ cells were found mostly located in the keratin 5-positive basal layer and near the integrin α6 positive basement membrane in the adjacent normal tongue epithelium (Figure 1C). The number of Tomato+ cells was increased in epithelial hyperplasia and papilloma lesions (Figure 1C). Most of the Tomato+ cells were found in the invasive front of HNSCC (Figure 1C). Tomato+ cells were not observed in HNSCC without tamoxifen treatment (data not shown). To confirm the expression pattern of Bmi1 in HNSCC, we performed Bmi1 in situ hybridization. Consistent with the lineage tracing experiments, Bmi1 mRNA was expressed in a subset of benign papilloma and SCC tumor cells (Figure 1D).
Figure 1. Bmi1 is expressed in a subset of cancer cells in HNSCC in vivo.

(A) Experimental design for tracing Bmi1+ cells in mouse HNSCC induced by 4NQO.
(B) Representative image of tongue lesions 26 weeks after 4NQO treatment. Representative of at least three independent experiments.
(C) Representative H&E staining of adjacent normal tongue tissue (Adj normal), hyperplasia, papilloma and SCC. Tamoxifen was injected into 4NQO-treated BmiCreER;Rosa26tdTomato mice. 24 hours after tamoxifen treatment, tongues were harvested and analyzed by immunostaining. The majority of Bmi1+ cells (red) resided within basal layer of SCC were stained by cytokeratin 5 (K5; green). Integrin α6 (α6; green) denotes the boundary of tumor epithelia and stroma. Scale bars, 50 μm.
(D) Expression pattern of Bmi1 mRNA in both papilloma and SCC was detected by in situ hybridization. Scale bars, 50 μm.
(E) Representative images of Bmi1+ cell-driven lineage tracing in primary HNSCC in vivo. Nuclei were stained with DAPI (blue). White dashed lines demarks tumor-stromal junction.
(F) Immunostaining of Keratin14 (K14; green, left) or Keratin10 (K10; green, right) in mouse HNSCC. Scale bars, 50 μm.
(G) Immunostaining of CD44 (green, left) or Sox2 (green, right) in mouse HNSCC. Scale bars, 50 μm.
(H) A representative image of primary tumor cells labeled with EdU (green). Scale bars, 50 μm.
(I) Quantification of EdU incorporation in Bmi1+ and Bmi1− tumor cells. Values are mean ± SD. from one of three independent experiments at least. **p < 0.01 by unpaired two-tailed Student’s t-test; n = 3 animals.
(J) Representative images of Bmi1+ cell-driven lineage tracing and proliferation in cervical lymph nodes in vivo. Metastatic tumor cells (green) in cervical lymph nodes were stained with anti-pan-cytokeratin (PCK) or EdU. Nuclei were stained with DAPI (blue). Scale bars, 50 μm.
To determine whether Bmi1+ tumor cells could self-renew and differentiate in primary tumors in situ, we traced Tomato+ cells in Bmi1CreER;RosatdTomato mice over a period of 6 weeks. At 7 days after the tamoxifen injection, single cells or small clusters of 2–4 Tomato+ tumor cells were observed (Figure 1E). The colonies, formed by labeled cells at the invasive front and then expanded progressively over time. After 6 weeks, Tomato+ tumor cells occupied a large chunk of the tumor (Figure 1E). The Tomato+ clones expressed both basal marker Keratin 14 and suprabasal differentiation marker Keratin 10, indicating the differentiation ability of Bmi1+ cells (Figure 1F). Importantly, the vast majority of Bmi1+ cells expressed CD44 and Sox2, two known markers that have been utilized for isolating CSCs (Figure 1G) (Boumahdi et al., 2014; Prince et al., 2007). However, it appeared that these markers had a more broad expression pattern. Stem cells in many tissues display a slow-cycling phenotype. Therefore, we tested the relationship between Bmi1+ cells and cycling cells using EdU labeling. We found that most of the Bmi1+ cells were not actively proliferating (Figure 1H and I). HNSCCs often metastasize to cervical lymph nodes. We also observed Tomato+ colonies in cervical lymph nodes, which increased in size along time (Figure 1J). Because some hematopoietic cells can express Bmi1, we confirmed that Bmi1+ cells in cervical lymph nodes represent metastatic SCC cells with an anti-pan-cytokeratin antibody specific for epithelial cells (Figure 1J). Tomato+ cells at early time points of metastasis remained largely quiescent. However, once the clones developed, active proliferating cells were detected within the clones (Figure 1J). Although we could not distinguish the stem cell population from their progenies, it was likely that Bmi1+ cells at the metastatic sites gave rise to transient-amplifying cells, which were responsible for EdU positive staining. Collectively, genetic lineage tracing demonstrates that Bmi1 marks a slow-cycling population that is capable of self-renewal, producing tumor progeny and metastasizing to lymph nodes.
Bmi1+ tumor cells are highly tumorigenic and chemo-resistant
To determine whether Bmi1+ tumor cells hold higher self-renewal ability than Bmi1− tumor cells, we isolated Bmi1+ tumor cells (double positive for the epithelial cell adhesion molecule and Tomato+; EpCAM+Tomato+) and Bmi1− tumor cells (EpCAM+Tomato−) from primary mouse HNSCC (Figure 2A). We then measured their self-renewal ability by performing a sphere-forming assay in an in vitro Matrigel system. While EpCAM+Tomato− cells formed very few small spheres, EpCAM+Tomato+ cells formed large ones (Figure 2B and C). Moreover, single cells from the primary spheres of EpCAM+Tomato+ cells have higher capability of forming secondary spheres (Figure 2B and C). Xenotransplantation and limiting dilution assay results revealed a greater ability to form tumors by EpCAM+Tomato+ cells compared to the EpCAM+Tomato− tumor cells in vivo (Figure 2D). To examine whether these EpCAM+Tomato+ cells and their progenies retain the ability to develop SCC in the orthotopic site and metastasize to cervical lymph nodes, they were injected submucosally in the tongue of nude mice. HNSCCs were detected in nude mice after the orthotopic implantation of EpCAM+Tomato+ cells, but the mice that were injected with the same number of EpCAM+Tomato− tumor cells failed to form primary tumors (Figure 2E and F). Moreover, fluorescence microscopic analysis revealed that EpCAM+Tomato+ cells yielded higher rates of lymph node metastasis (Figure 2E and F). The primary tumors in the tongue and metastatic tumors in lymph nodes were further confirmed histologically (Figure 2G and H).
Figure 2. Bmi1+ cells are highly tumorigenic, metastatic and chemo-resistant.

(A) Representative FACS plots of EpCAM+/Tomato+ tumor cells isolated from mouse primary HNSCC 24hr after tamoxifen injection.
(B) Sphere formation assays for EpCAM+/Tomato+ and EpCAM+/Tomato− tumor cells isolated from HNSCC. Scale bars, 250 μm.
(C) Quantification of primary and secondary spheres from EpCAM+/Tomato+ and EpCAM+/Tomato− tumor cells. Values are mean ± SD. from one of three independent experiments. **p < 0.01 by unpaired two-tailed Student’s t-test; n = 12.
(D) In vivo limiting dilution analysis of HNSCC formation frequency of primary EpCAM+/Tomato+ and EpCAM+/Tomato− tumor cells. The frequency of allograft formation at each cell dose injected was shown.
(E and F) Tumors were detected in the tongue of mice inoculated with EpCAM+/Tomato+ cells, but not EpCAM+/Tomato−.
(G) Visualization of Tomato+ tumor cells in primary HNSCC and cervical lymph node metastasis with a brightfield or fluorescence microscope.
(H) Histological analysis of Tomato+ cells in cervical lymph nodes. Scale bars, 50 μm.
(I) Representative images of EdU incorporation (green) and Bmi1+ CSCs (red) in HNSCC from mice treated with saline or cisplatin. Scale bar, 50 μm.
(J) Quantifications of EdU percentage in Tomato+ or Tomato−tumor cells after treatment. Values are mean ± SD. from one of three independent experiments. ** p < 0.01 by two-way ANOVA; n = 6 animals.
(K) Quantification of the percentage of Tomato+ cells in HNSCC after saline or cisplatin treatment. Values are mean ± SD. *p < 0.05 by Student’s t-test; n = 6.
(L) Representative images of active-caspase3-positive cells (green) and Bmi1+ cells (red) in primary HNSCC from mice treated with cisplatin. Scale bar, 50 μm.
(M) Bmi1− tumor cells displayed significantly higher apoptosis than Bmi1+ tumor cells. Nuclei were stained with DAPI (blue). Values are mean ± SD. **p < 0.01 by Student’s t test; n = 6.
(N) Experimental design for Bmi1 lineage tracing of HNSCC recurrence.
(O) Representative images of Bmi1+ cell-driven lineage tracing in relapsed HNSCC in vivo after cisplatin treatment. White dashed lines demarks tumor-stromal junction. Scale bar, 50 μm.
Cisplatin is the most common chemotherapeutic drug for HNSCC. However, over 50% of HNSCC patients are predicted to recur or metastasize after therapy (de Mello et al., 2014). Moreover, HNSCC often already have cervical lymph node metastasis by the time of diagnosis (Hedberg et al., 2015). To evaluate the chemotherapeutic response of Bmi1+ CSCs, we administered tumor-bearing mice after 24 weeks of 4NQO treatment with saline or 5 successive doses of cisplatin and injected them with EdU 2 hr prior to euthanasia. The cisplatin-treated mice displayed a marked decrease of EdU+ tumor cells compared to the saline-treated mice, suggesting that cisplatin potently kills mitotic tumor cells (Figure 2I and J). In contrast, Bmi1+ CSCs was enriched after cisplatin treatment (Figure 2I and K). IF staining with anti-active caspase 3 antibodies revealed that apoptosis was mainly induced in Bmi1− tumor cells rather than in Bmi1+ CSCs after the cisplatin treatment (Figure 2L and M). To examine the fate of the Bmi1+ CSCs following the cisplatin treatment, we performed lineage tracing of these cells (Figure 2N). We found that Bmi1+ CSCs and their progenies were maintained in the recurrent/persistent tumors (Figure 2O).
Bmi1+ CSCs are required for SCC invasive growth and metastasis
To test the requirement of Bmi1+ CSCs for tumor growth, we bred the Bmi1CreER mice with R26DTA mice that conditionally express an attenuated form of the diphtheria toxin (DTA). To achieve efficient recombination activity, three successive applications of tamoxifen were topically applied to the oral cavity of Bmi1CreER;R26DTA and Bmi1CreER mice 24 weeks after initial 4NQO treatment (Figure 3A). Two days after tamoxifen injection, we observed active-caspase3-positive tumor cells, suggesting apoptosis in Bmi1CreER;R26DTA mice (Figure 3B). Lineage tracing results confirmed that tamoxifen treatment effectively eliminated Bmi1+ tumor cells in HNSCC of Bmi1CreER;R26tdTomato;R26DTA mice (Figure 3C). Two weeks after eliminating the Bmi1+ cells, tumors and lymph node samples were collected. A significant difference was detected in the overall affected lesion surface areas between Bmi1CreER;R26DTA and Bmi1CreER mice (Figure 3D and E). Histological analysis revealed that the number of SCCs was significantly reduced after ablation of Bmi1+ cells (Figure 3F). Moreover, mice rarely developed highly invasive carcinomas when Bmi-1+ cells were depleted (Figure 3G). A significant decrease in Bmi1+ cells and EdU-positive proliferating cells was detected in SCCs of Bmi1CreER;R26DTA mice compared to Bmi1CreER mice upon tamoxifen treatment (Figure 3H and I). Moreover, we found that ablating Bmi1+ CSCs also significantly reduced the number of Bmi1CreER;R26DTA mice with lymph node metastasis (Figure 3J). Histological examination found that lymph node metastasis in Bmi1CreER;R26DTA was less invasive compared to the Bmi1CreER mice upon tamoxifen treatment (Figure 3K).
Figure 3. Ablation of Bmi1+ cells in combination with chemotherapy inhibits primary HNSCC growth and lymph node metastasis.

(A) Experimental design for lineage ablation of Bmi1+ cells in HNSCC in vivo. Three administrations of tamoxifen were given to BmiCreER;Rosa26DTA (DTA) or control mice to achieve maximal frequency of Cre-LoxP-mediated cell ablation.
(B) Representative staining for active-caspase3 cells. Scale bar, 50 μm.
(C) Lineage tracing confirmed the depletion of Bmi1+ cells. Scale bar, 50 μm.
(D) Representative H&E staining of HNSCC after treatment. Scale bar, 50 μm.
(E) Quantification of lesion areas visible in the tongue from different treatment groups. Values are mean ± SD. from the pool of two independent experiments (n = 9 to 14). *p < 0.05, **p < 0.01; two-way ANOVA.
(F) Quantification of dysplasia and SCC numbers in the control and DTA groups. Values are mean ± SD. from the pool of two independent experiments (n = 9 to 14). *p<0.05, ** p<0.01; two-way ANOVA.
(G) Quantification of HNSCC invasion grades in different treatment groups. *p < 0.05; Cochran-Armitage test (n = 9 to 14).
(H) Representative images of EdU incorporation (green) and Bmi1+ CSCs (red) in HNSCC from mice treated with different conditions. Scale bar, 50 μm.
(I) Quantifications of EdU percentage in tumor cells after treatments. Values are mean ± SD. from the pool of two independent experiments (n = 9 to 14). *p < 0.05, ** p < 0.01; two-way ANOVA.
(J) The percentage of mice having lymph node metastasis after treatment. *p < 0.05, ** p<0.01; Fisher exact test. Number of mice used in each groups were indicated in the figure;
(K) Immunostaining of metastatic cells in cervical lymph nodes using anti-pan-cytokeratin (PCK). Scale bar, 250 μm.
Depletion of Bmi1+ cells did not completely eradicate the tumor as well as lymph node metastasis. It was possible that remaining tumors contained transient-amplifying cells or differentiating cells. Those cells could proliferate or survive for several generations before they stopped cycling or were exhausted. We then tested if cisplatin treatment could improve the outcome of Bmi1+ cell depletion (Figure 3A). Histological analysis revealed that the combination of Bmi1+ cell ablation and cisplatin treatment had a strong inhibition of SCC growth (Figure 3D–G). EdU-positive proliferating cells were significantly reduced in SCCs after the combination of Bmi1+ cell ablation and cisplatin treatment as compared to Bmi1+ cell ablation alone (Figure 3H and I). Moreover, the combination treatment potently inhibited lymph node metastasis (Figure 3J and K).
Combination of Bmi1 inhibitor and cisplatin potently inhibits HNSCC
Our results suggest that targeting the tumor bulk and Bmi1+ CSCs with combination therapy might be critical for achieving optimal outcomes. To investigate whether targeting Bmi1’s functions could block the fuel role of Bmi1+ CSCs in HNSCC, we took advantage of the specific inhibitor of Bmi1 PTC-209 (Kreso et al., 2014). Four groups of tumor-bearing mice were given the control vehicle, cisplatin, PTC-209, or cisplatin plus PTC-209. We confirmed that PTC-209 functionally inhibited the ubiquitination of histone H2A in SCC cells by inhibiting BMI activity (Figure S1A). Mice were treated with tamoxifen for lineage tracing 5 days after the first treatment and then sacrificed 3 weeks later (Figure 4A). The inhibition of Bmi1 by PTC-209 in tumors was confirmed by Western blotting (Figure 4B). Whereas cisplatin or PTC-209 treatment alone partially reduced the lesion surface areas, cisplatin plus PTC-209 had the strongest inhibitory effect (Figure 4C). Importantly, histological examination revealed that cisplatin plus PTC-209 had a strong inhibition of HNSCC formation in mice as compared to cisplatin or PTC-209 alone (Figure 4D and E). Because there were some remaining tumors in the cisplatin plus PTC-209 group, we further compared the invasiveness of HNSCC. HNSCCs from the cisplatin plus PTC-209 group developed significantly less invasive tumors compared to cisplatin or PTC-209 treatment alone (Figure 4F). Of note, PTC-209 treatment did not affect adjacent normal epithelial tissues (Figure S1B). To examine how the monotherapy and combination therapy affected Bmi1+ CSCs and proliferating tumor bulk cells, a subgroup of mice that were pre-labeled with EdU for 2 hr were sacrificed 24 hr after tamoxifen treatment. Whereas Bmi1+ CSCs were enriched 5 days after cisplatin treatment, PTC-209 treatment potently reduced Bmi1+ CSCs (Figure 4G). On the contrary, cisplatin treatment was more potent to eliminate proliferating tumor cells than PTC-209 treatment (Figure 4G and H). Cisplatin plus PTC-209 treatment dramatically reduced both Bmi1+ and proliferating tumor cells after 5 days (Figure 4G and H). At the end of our experiments, lineage tracing revealed that cisplatin treatment did not inhibit Bmi1+ CSCs-derived tumor cell growth compared to PTC-209 treatment. Cisplatin plus PTC-209 treatment exhibited the most dramatic inhibition of Bmi1+ CSCs-derived tumor cell growth compared to cisplatin or PTC-209 treatment alone (Figure 4I).
Figure 4. The combination therapy of cisplatin plus PTC-209 potently eradicates Bmi1+ CSCs and inhibits tumor progression by lineage tracing.

(A) Schematic diagrams show the experimental strategies for the combination therapy and lineage tracing of primary HNSCC in BmiCreER;RosatdTomato mice. Mice were randomly divided into 4 experimental groups: control vehicle; PTC-209; cisplatin; and cisplatin plus PTC-209. 100 mg EdU were injected into mice 2hr before sacrifice.
(B) Western blots showed that Bmi1 was reduced in tumors treated with PTC-209.
(C) Quantification of lesion areas from different treatment groups. Values are mean ± SD. from the pool of two independent experiments (n = 16). *p<0.05, **p<0.01 by one-way ANOVA
(D) Representative H&E staining of HNSCC in different treatment groups. Cis+PTC, cisplatin plus PTC-209.
(E) Quantification of dysplasia and SCC numbers in different treatment groups. Values are mean ± SD. from the pool of two independent experiments (n = 16). *p<0.05, ** p<0.01 by one-way ANOVA
(F) Quantification of HNSCC invasion grades in different treatment groups. *p < 0.05; Cochran-Armitage test; n = 16.
(G) Representative immunofluorescence images of primary tumor cells labelled with EdU (green) and Bmi1+ cell (red) 5 days after different treatments. Cis+PTC, cisplatin plus PTC-209. Nuclei were stained with DAPI (blue). White dashed lines demarks tumor-stromal junction. Scale bar, 50μm. Cis+PTC, cisplatin plus PTC-209.
(H) Percentage of EdU+ cells in all tumor cells after different treatment. Values are mean ± SD. from the pool of two independent experiments (n = 16). *p<0.05; ** p<0.01; one-way ANOVA.
(I) Representative images of lineage tracing in HNSCC after different treatments. Nuclei are stained with DAPI (blue). Scale bar, 50μm. White dashed lines demarks tumor-stromal junction.
(J) Experimental design for examining the tumor cells in recurrent HNSCC after cisplatin and PTC-209 treatment. Briefly, mice after first round of cisplatin and PTC-209 treatment were maintained for 8 additional weeks. Mice with recurred HNSCC lesion received second round of cisplatin and PTC-209 treatment and harvested in 1 day.
(K) Lineage tracing showed presence of Bmi1+ CSCs in recurrent tumors after cisplatin and PTC-209 treatment.
(L) Immunostaining of Ki67 and active-caspase3 in recurrent HNSCC after cisplatin plus PTC-209 treatment.
(M) Reduction of Ki67+ cells in recurrent HNSCC after cisplatin plus PTC-209 treatment. Values are mean ± SD. **p < 0.01; Student’s t-test; n = 3–4.
(N) Cisplatin plus PTC-209 treatment activated caspase-3 in recurrent HNSCC. Values are mean ± SD. **p < 0.01; Student’s t-test; n = 3–4.
(O) Cisplatin plus PTC-209 treatment eliminated Bmi1+ CSCs in recurrent HNSCC. Values are mean ± SD. **p < 0.01; Student’s t-test; n = 3–4.
See also Figure S1.
To determine whether recurrent or relapsed HNSCC responded to cisplatin plus PTC-209, we set up a large new experiment and extended our endpoint for an additional one month to obtain mice bearing recurrent HNSCC (Figure 4J). Tomato labeling detected Bmi1+ CSCs in these recurrent HNSCC (Figure 4K), suggesting that cisplatin plus PTC-209 might be unable to completely eliminate Bmi1+ CSCs. However, it also was possible that Bmi1+ CSCs became resistant to cisplatin plus PTC-209. Therefore, we further examined whether these recurrent HNSCC responded to cisplatin plus PTC-209. Immunostaining revealed that the second round of cisplatin plus PTC-209 treatment was able to reduce proliferating tumor cells (Figure 4L–N) and Bmi1+ CSCs in recurrent HNSCC again (Figure 4O). Our results suggest that Bmi1+ CSCs in recurrent HNSCC remained sensitive to cisplatin plus PTC-209. Due to a variety of factors in vivo, cisplatin plus PTC-209 could not eliminate Bmi1+ CSCs completely. Moreover, because some mice also had recurrent HNSCC after the combination of ablating Bmi1+ CSCs with DTA and cisplatin, we determined whether recurrent HNSCC responded to the combination of Bmi1+ CSCs depletion and cisplatin again. We gave a second dose of Tamoxifen and cisplatin to mice carrying recurrent tumors (Figure S1C). Tomato+ CSCs were detected in the relapsed tumors after secondary tamoxifen injection (Figure S1D). The combination of Bmi1+ CSCs ablation and cisplatin also significantly reduced HNSCC invasive growth (Figure S1E and F) and killed proliferating tumor cells and Bmi1+ CSCs again (Figure S1G and H).
To examine whether inhibiting Bmi1 affected cervical lymph node metastasis, cervical lymph nodes of mice from different treatments were immunostained with anti-pan-keratin antibodies. Cisplatin or PTC-209 treatment alone partially reduced the SCC invasive growth in lymph nodes compared to the control vehicle (Figure 5A). Whereas cervical lymph node metastasis was detected in 14 out of 16 mice (87.5%) in the control group, 10 out of 16 mice (62.5%) in the cisplatin group, and 9 out of 16 mice (56.3%) in the PTC-209 group, only 4 out of 16 mice (25%) in the cisplatin plus PTC-209 group had metastasis (Figure 5A and B). Lineage tracing found that PTC-209 potently inhibited Bmi1+ CSCs-derived tumor cell growth in lymph nodes compared to cisplatin. However, cisplatin plus PTC-209 treatment showed a more dramatic inhibition of metastatic tumor cell growth in lymph nodes compared to PTC-209 or cisplatin treatment alone (Figure 5C). Metastatic tumor cells are very resistant to chemotherapy (Hedberg et al., 2015). To examine whether cisplatin plus PTC-209 could directly eliminate metastatic Bmi1+ CSCs in lymph nodes, we treated mice at 26 weeks after 4NQO induction at which lymph node metastasis was readily established (Figure 5D). We found that cisplatin plus PTC-209 also directly eradiated metastatic Bmi1+ CSCs and proliferating tumor cells compared to cisplatin or PTC-209 alone (Figure 5E–G).
Figure 5. The combination therapy of cisplatin and PTC-209 potently eliminates Bmi1+ CSCs and prevents HNSCC lymph node metastasis by lineage tracing.

(A) Representative staining of metastatic tumor cells in cervical lymph nodes from different treatment groups using anti-pan-cytokeratin (PCK). Scale bar upper, 250 μm; Scale bar lower, 50 μm.
(B) The percentage of mice having with lymph node metastasis after treatments. Values are from the pool of two independent experiments (n = 16). *p < 0.05; **p < 0.01; n=16; Fisher exact test. Scale bar, 50 μm. Cis+PTC, cisplatin plus PTC-209.
(C) Representative images of Tomato+ tumor cells (red) and PCK (green) staining in lymph nodes after different treatments. Nuclei were stained with DAPI (blue). Scale bar, 50μm.
(D) Experimental design for examining the metastatic tumor cells in cervical lymph nodes.
(E) Representative images of Tomato+ tumor cells (red) and EdU-labeled tumor cells (green) in cervical lymph nodes. Scale bars, 50 μm.
(F) The percentage of Tomato+ cells in metastatic tumor cells of lymph nodes. Values are mean ± SD. *p < 0.05; **p < 0.01; one-way ANOVA; n = 6.
(G) The percentage of EdU+ cells in metastatic tumor cells of lymph nodes. Values are mean ± SD. *p < 0.05; **p < 0.01; one-way ANOVA; n = 6.
Increased AP-1 mediates the invasive growth and metastasis of Bmi1+ CSCs
To further characterize Bmi1+ CSCs, we compared the gene expression profile of Tomato+ and Tomato− tumor cells by RNA-seq. We found 1107 genes up-regulated and 1481 genes down-regulated in Tomato+ tumor cells by more than two folds compared to Tomato− tumor cells (Table S1). Genes upregulated in Bmi1+ CSCs were associated with known CSC signatures (Bmi1, Hmga2, Met, Cd44, Aldh7a1, Aldh1a3, Krt14, Krt5), cell motion and migration (Cap1, Flt1, Gli2, Gli3, Ccr1, Cxcl2, Cxcl3, Cxcr4, Kitl, Hif1a, Itga1), and cell adhesion (Cd33, Suc, Cdh3, Cdh5, Col7a1, Emcn, Lama3, Rhob, Spp1, Spon2) (Figure 6A). On the other hand, genes associated with keratinocyte differentiation were downregulated in Bmi1+ CSCs (Figure 6A). Importantly, bioinformatics analysis revealed that the expression of activator protein-1 (AP-1)-dependent target genes (Fosl1, Il1b, Sox9, Hif1a, Tgfb1, Vegfa, Ptgs2, Mmp3, Mmp9, S100a3, S100a6, S100 a8, S100a9 and S100a11) were significantly increased in Bmi1+ CSCs, indicating AP-1 activities are increased in Bmi1+ CSCs. AP-1 is a transcription factor that plays a critical role in tumor progression, metastasis and chemoresistance (Ding et al., 2013; Sun et al., 2014). Increased AP-1 activities in Bmi1+ CSCs might be responsible for Bmi1+ CSC-mediated tumorigenesis and chemoresistance. Real-time RT-PCR confirmed that Fosl1 and other AP-1 dependent genes were highly expressed in Bmi1+ CSCs (Figure 6B). Although our RNA-seq did not detect that Jun was changed in Bmi1+ CSCs, Real-time RT-PCR did find that Jun was also increased in Bmi1+ CSCs (Figure 6B). FOSL1 is a family member of FOS proteins that dimerizes with JUN to form the AP-1 complex, thereby activating AP-1 target gene transcription. Fosl1 expression is also positively regulated by AP-1, and increased Fosl1 expression is an indicator of AP-1 activation (Ding et al., 2013). Immunostaining further confirmed that FOSL1 was highly expressed in Bmi1+ CSCs (Figure 6C).
Figure 6. Abnormal activation of AP-1 in Bmi1+ CSCs facilitates HNSCC invasive growth and chemoresistance.

(A) Heatmap displayed genes that were differentially expressed between EpCAM+Tomato− and EpCAM+Tomato+ tumor cells isolated from primary mouse HNSCC.
(B) qRT-PCR showed that the expression of AP-1 target genes was significantly higher in EpCAM+Tomato+ cells than in EpCAM+Tomato− cells. Data represent mean ± SD. **p < 0.05.
(C) Co-immunostaining for FOSL1 (green) and Tomato (red) in primary HNSCC of BmiCreER;RosatdTomato mice after 1 day of tamoxifen administration. Nuclei were stained with DAPI (blue). White dashed lines demarks tumor-stromal junction.
(D) Schematic diagrams show the experimental strategy for the combination therapy of cisplatin and 3-PA. Mice were randomly divided into 4 experimental groups: control vehicle; 3-PA; cisplatin; and cisplatin plus 3-PA.
(E) Representative H&E staining of HNSCC after 4 different treatments.
(F) Quantification of lesion areas from different treatment groups. Values are mean ± SD. **p < 0.01; one-way ANOVA; n = 6.
(G) Quantification of SCC numbers in 4 different treatment groups. Values are mean ± SD. **p < 0.01; one-way ANOVA; n = 6.
(H) Quantification of HNSCC invasion grades in different treatment groups. *p < 0,05; Cochran-Armitage test.
(I) Representative images of primary tumor cells labelled with EdU (green) and Bmi1+ cell (red) 1 day after different treatments.
(J) Quantifications the percentage of EdU+ cells in tumors 5 days after different treatments. Values are mean ± SD. *p < 0,05, **p < 0.01; one-way ANOVA; n = 6.
(K) Representative images of lineage tracing in tumors 28 days after treatments. Nuclei are stained with DAPI (blue). Scale bar, 50 μm.
(L) Representative staining of metastatic tumor cells in cervical lymph nodes from different treatment groups using anti-pan-cytokeratin.
To investigate whether AP-1 played a functional role in Bmi1+ CSC-mediated HNSCC development and chemoresistance, we took advantage of a specific inhibitor of AP-1, 3-(5-(4-(cyclopentyloxy)-2-hydroxybenzoyl)-2-((3-hydroxybenzo[d]isoxazol -6-yl)methoxy)phenyl) propanoic acid (3-PA) that has been used for treating mouse arthritis in vivo by inhibiting AP-1 (Ye et al., 2014). Real-time RT-PCR confirmed that 3-PA potently inhibited AP-1 activities in Bmi1+ CSCs (Figure S2). Four groups of tumor-bearing mice were given the control vehicle, cisplatin, 3-PA, or cisplatin plus 3-PA. Mice were treated with tamoxifen for lineage tracing 5 days after the first treatment and then sacrificed 3 weeks later (Figure 6D). Whereas cisplatin or 3-PA treatment alone partially reduced the lesion surface areas, cisplatin plus 3-PA had the strongest inhibitory effect (Figure 6E). Importantly, histological examination revealed that cisplatin plus 3-PA significantly reduced the number of HNSCC in mice compared to cisplatin or 3-PA alone (Figure 6F and G). Cisplatin plus 3-PA also significantly reduced the HNSCC invasion grade (Figure 6H). To examine how the monotherapy and combination therapy affected Bmi1+ CSCs and proliferating tumor bulk cells, a subgroup of mice that were pre-labeled with EdU for 2 hr were sacrificed 24 hr after tamoxifen treatment (Figure 6D). Cisplatin treatment was more potent in eliminating proliferating tumor cells than 3-PA treatment. Whereas Bmi1+ CSCs were enriched 5 days after cisplatin treatment, 3-PA treatment potently reduced Bmi1+ CSCs (Figure 6I and J). Cisplatin plus 3-PA treatment dramatically reduced both Bmi1+ and proliferating tumor cells after 5 days (Figure 6I and J). At the end of our experiments, lineage tracing revealed that 3-PA treatment inhibit Bmi1+ CSCs-derived tomato+ tumor cell growth compared to cisplatin. Cisplatin plus 3-PA treatment exhibited the most dramatic inhibition of Bmi1+ CSCs-derived Tomato+ tumor cell growth compared to cisplatin or 3-PA treatment alone (Figure 6K). Moreover, cisplatin plus 3-PA also significantly inhibited lymph node metastasis (Fig. 6L)
Inhibiting BMI1 or AP-1 overcomes chemoresistance and prevents metastasis of human HNSCC
Cisplatin has been found to induce Bmi1 and increase putative CSCs in human HNSCC cell lines in vitro (Nor et al., 2014). Based on the results from our mouse model, we were interested in determining whether targeting BMI1 could overcome cisplatin resistance in human HNSCC. ALDHhighCD44+ have been widely used as markers for isolating CSCs from human HNSCC cell lines and primary tumors. Tumorsphere formation assays confirmed that ALDHhigh/CD44+ cells from human primary HNSCC formed more tumorspheres in vitro than ALDHhigh/CD44−, ALDHlow/CD44−, and ALDHlow/CD44+ tumor cells (Figure S3A). We isolated ALDHhighCD44+ cells from parental SCC1 cells and cisplatin-resistant SCC1 cells (SCC1R) that were maintained in 5 μM of cisplatin (Figure S3B). Consistent with previous studies (Nor et al., 2014), Real-time RT-PCR showed that BMI1 was highly expressed in CSCs isolated from SCC1 cells. CSCs isolated from SCC1R cells had the highest expression of BMI1 (Figure S3C). Similarly, BMI1 expression was significantly higher in CSCs isolated from other HNSCC cell lines, including SCC23, SCC9 and HN13 (Figure S3D). The inhibition of BMI1 by PTC-209 restored SCC1R cells sensitivity to cisplatin-induced apoptosis (Figure S3E–G). The combination of PTC-209 and cisplatin also potently induced apoptosis in SCC23 and SCC9 cells (Figure S3H and I). More importantly, cisplatin plus PTC-209 significantly inhibited tumor invasive growth and metastasis of CSCs that were isolated from SCC1R cells in vivo (Figure S4).
We further examined whether BMI1 was highly expressed in CSCs isolated from human primary HNSCC tissues using ALDHhighCD44+EpCAM+ markers (Figure 7A). Real-time RT-PCR demonstrated that BMI1 was highly expressed in ALDHhighCD44+EpCAM+ tumor cells compared with ALDHlowCD44−EpCAM+ cells (Figure 7B). Moreover, AP-1 target genes, including FOSL1, MMP3, MMP9 and MET, were also highly expressed in ALDHhighCD44+EpCAM+ tumor cells, indicating AP-1 activities are abnormally increased in human primary CSCs (Figure 7B). ALDHhighCD44+EpCAM+ tumor cells, but not ALDHlowCD44−EpCAM+ tumor cells, were highly tumorigenic when they were xenografted into nude mice. To investigate whether targeting BMI1 had a direct effect on CSCs, we assessed the self-renewal potential of human CSCs by detecting their ability to form tumor spheres in vitro. Knockdown of BMI1 by two different siRNAs inhibited the formation of tumor spheres by human CSCs (Figure S5A–C). Knockdown of FOSL1 by two different siRNAs also inhibited the formation of tumor spheres by human primary CSCs (Figure S5B–D). Consistently, treatment of PTC-209 or 3-PA also resulted in a significant reduction in the sphere formation of human CSCs (Figure S5E–H). The ectopic expression of FOSL1 was able to rescue tumorsphere formation inhibited by PTC-209 or BMI1 knockdown (Figure S5I–M).
Figure 7. Targeting BMI1 or AP-1 impairs tumorigenic and metastatic properties of CSCs in human primary HNSCC.

(A) FACS sorting showed the proportion of ALDHhighCD44+EpCAM+ cells in primary human HNSCC.
(B) qRT-PCR showed that AP1 target genes were significantly up-regulated in human CSCs. Values mean ± SD from one of three independent experiments. *p < 0.05; Student’s t test; n = 3.
(C) Representative image of xenografted human HNSCC tumors from CSCs in nude mice after treatment.
(D) Quantification of human HNSCC tumor growth in nude mice after treatment. Values are mean ± SD from one of two independent experiments. *p < 0.05; **p < 0.01; one-way ANOVA; n = 8.
(E) Representative staining of metastatic tumor cells in cervical lymph nodes of mice after treatment using anti-pan-cytokeratin (PCK). Scale bar upper, 250 μm. Scale bar lower, 50 μm.
(F) The percentage of mice having lymph node metastasis after treatment. Data are from one of two independent experiments. **p < 0.01; Fisher exact test; n = 8.
(G) Representative image of xenografted human HNSCC tumors derived from CSCs in nude mice after treatment.
(H) Quantification of human HNSCC tumor growth in nude mice after treatment. Values are mean ± SD from one of two independent experiments. *p < 0.05; **p < 0.01; one-way ANOVA; n = 8.
(I) Representative staining of metastatic tumor cells in cervical lymph nodes of nude mice after treatment using anti-pan-cytokeratin (PCK). Scale bar upper, 250 μm. Scale bar lower, 50 μm.
(J) The percentage of mice having lymph node metastasis after treatment. Data are from one of two independent experiments. **p < 0.05; Fisher exact test; n = 8.
See also Figure S3 to S6 and Table S2.
To examine whether the inhibition of BMI1 by PTC-209 overcame human primary CSC resistance to cisplatin and prevented metastasis in vivo, we injected 1X10⁴ CSCs, isolated from human primary HNSCC, submucosally in the tongue of nude mice. The mice were randomly divided into four different groups and treated with the control vehicle, cisplatin, PTC-209, or cisplatin plus PTC-209. Cisplatin plus PTC-209 significantly inhibited tumor growth compared to cisplatin or PTC-209 alone (Figure 7C and D). Moreover, histological analysis demonstrated that human CSCs metastasized to cervical lymph nodes with high efficiency. Cisplatin treatment did not significantly prevent cervical lymph node metastasis compared to the control vehicle. While 5 out of 8 mice (62.5%) had lymph node metastasis after PTC-209 treatment, cisplatin plus PTC-209 had significantly less lymph node metastasis (12.5%) (Figure 7E and F).
Due to the fact that AP-1 activities were found to be increased in human primary CSCs, we further examined whether inhibiting AP-1 could also overcome CSC resistance to cisplatin and prevent metastasis in vivo. Nude mice injected with human primary CSCs were randomly divided into four groups and treated with the control vehicle, cisplatin, 3-PA, or cisplatin plus 3-PA. While 3-PA or cisplatin treatment alone partially reduced tumor growth, cisplatin plus 3-PA potently inhibited tumor growth in vivo (Figure 7G and H). Moreover, histological analysis revealed that cisplatin plus 3-PA significantly prevented cervical lymph node metastasis compared to cisplatin or 3-PA treatment alone (Figure 7I–J).
To further confirm whether BMI1 was associated with human HNSCC lymph node metastasis, we performed immunostaining to compare BMI1 expression in human HNSCC specimens with or without lymph node metastasis. Immunostaining revealed that the levels of BMI1 were significantly higher in human primary HNSCC specimens with metastasis than in HNSCC specimens without metastasis (Figure S5A and B). Because there were some conflicting reports regarding BMI1 in HNSCC (Hayry et al., 2010), we further examined the expression of BMI1 in metastatic tumor cells in lymph nodes. Compared to human primary HNSCC specimens, the levels of BMI1 were further significantly increased in the majority of human SCC lymph node metastases (Figure S6A and B). Pearson correlation analysis showed that BMI1 was positively correlated with the levels of FOSL1 in HNSCC (r=0.796, p < 0.01; Table S2). Moreover, double staining revealed that BMI1 and FOSL1 were co-expressed in the nuclei of human HNSCC tumor cells (Figure S6C).
DISCUSSION
Using genetic lineage tracing we demonstrated that Bmi1 marks a slow-cycled population of CSCs that are responsible for HNSCC initiation, development and metastasis. We showed that Bmi1+ CSCs mediate invasive growth and thus provide the experimental proof for the hypothesis of CSC-mediated metastasis. Bmi1+ CSCs have increased AP-1 activities which provide a molecular explanation for Bmi1+ mediated invasion and metastasis. Cisplatin could efficiently kill proliferating cells, but not Bmi1+ CSCs, which might be responsible for the relapse of HNSCC. Importantly, we compared different therapeutic strategies for HNSCC, and found that targeting both the tumor bulk and CSCs yielded better therapeutic outcomes compared to monotherapy. Our results might also have important implications for developing new approaches for treating other solid tumors.
The invasive growth plays a critical role in the progression of dysplasia and papilloma into HNSCC (Ding et al., 2013; Hedberg et al., 2015). We found that Bmi1+ cells were increased in dysplasia. It could be that accumulating genetic and epigenetic events might promote Bmi1+ cells in dysplasia and papilloma to become tumorigenic Bmi1+ CSCs in HNSCC. Importantly, we observed that most of Bmi1+ CSCs were located at the invasive front of HNSCC, suggesting that Bmi1+ CSCs mediate invasive growth of HNSCC. BMI1 has been found to repress E-cadherin which is frequently lost or downregulated in human HNSCC. The elevated levels of BMI1 are associated with HNSCC metastasis and poor prognosis of patients (Yang et al., 2010). In contrast, it was also reported that loss of BMI1 in human HNSCC contributed to a poor prognosis (Hayry et al., 2010). The reasons for the conflicting findings are unclear. To further confirm our results, we examined BMI1 expression in human HNSCC. We found that BMI1 was positively associated with human HNSCC lymph node metastasis. Mechanistically, we found that AP-1 activities were increased in Bmi1+ CSCs, thereby providing a driving force for Bmi1+ CSC-mediated invasive growth and metastasis. AP-1 directly regulates the expression of multiple invasive genes, including MMPs and cytokines (Ding et al., 2013; Tam et al., 2013). FOSL1 were found to be highly expressed in CSCs from both mouse and human HNSCC. Consistent with our studies, FOLS1 was also identified as a key mediator of CSCs in breast cancer (Tam et al., 2013). Additionally, we found that FOSL1 expression was strongly enriched in BMI1+ cells of human HNSCC specimens. Taken together, our results suggest that the abnormal activation of AP-1 plays a critical role in Bmi1+ CSC-mediated HNSCC invasive growth.
Based on the CSC hypothesis, CSCs may be associated with tumor metastasis due to their self-renewing capacity. Although this assumption has been supported by xenograft models in immunodeficient mice (Hermann et al., 2007; Liu et al., 2010; Oskarsson et al., 2014), until now, it has not been experimentally tested by genetic lineage tracing in a spontaneously-formed tumor model. For example, Sox2+ CSCs have been identified in the skin SCC and the ablation of Sox2+ CSCs inhibited initiation and development of the skin SCC (Boumahdi et al., 2014). However, it was unknown whether targeting Sox2+ CSCs affected metastasis of the skin SCC. Although the skin SCC and HNSCC have a similar pathology, the tumor microenvironment of two SCCs is different and the molecular and epigenetic mechanisms which control their initiation and progression might be distinct. In our mouse model, we were able to consistently detect cervical lymph node metastasis to which HNSCC most often metastasize. Based on the following evidence, we believe that Bmi1+ CSCs are responsible for cervical lymph node metastasis: 1) Lineage tracing revealed that Bmi1+ CSCs were present in cervical lymph nodes; 2) In the combination of lineage tracing and transplantation assays, we confirmed that Bmi1+ CSCs, but not Bmi1− tumor cells, could metastasize to cervical lymph nodes; 3) Ablation of Bmi1+ CSCs inhibited lymph node metastasis, and 4) Bmi1+ CSCs had increased AP-1 activities and targeting AP-1 inhibited invasive growth and metastasis of HNSCC.
Recurrent tumor growth due to cisplatin resistance is a major obstacle in HNSCC treatment (Nor et al., 2014; Polverini and Nor, 1999). Using genetic lineage tracing, we provided evidence that cisplatin treatment mainly killed proliferating cells and subsequently enriched Bmi1+ CSCs. The surviving Bmi1+ CSCs were able to repopulate and form the tumor bulk after the cisplatin treatment, thereby indicating heterogeneity of drug sensitivity between different tumor cell types. Our results suggest that Bmi1+ cells are a major cause for cancer relapse. Recently, using xenograft models in nude mice, PTC-209, the Bmi1 inhibitor, was shown to inhibit tumor growth by targeting the self-renewal of CSCs isolated human colorectal cancer (Kreso et al., 2014). However, it was unknown whether the inhibition of Bmi1 affected tumor metastasis and enhanced the efficacy of chemotherapy. Using lineage tracing in a spontaneously-formed mouse model, we compared three different therapeutic options and found that targeting both the tumor bulk and Bmi1+ was more effective in reducing tumor burdens and eliminating cervical lymph node metastasis. Although ablating Bmi1+ CSCs or use of the Bmi1 inhibitor impaired HNSCC growth and metastasis, it was not as effective as the combination therapy. There are several potential reasons. Ablating Bmi1+ CSCs or the Bmi1 inhibitor might be unable to completely abolish Bmi1 functions, and Bmi1− tumor cells were able to proliferate and sustain the tumor bulk until they were worn out. It also was possible that Bmi1− tumor cells might have evolved and dedifferentiated into CSCs in the natural tumor microenvironment. Finally, inhibiting Bmi1+ CSCs might promote tumor cells to reprogram into other different CSCs such as Sox2+ CSCs. In fact, the stroma of HNSCC contains infiltrated inflammatory cells such as lymphocytes and macrophages which can secrete a variety of cytokines and growth factor (Ding et al., 2013). These cytokines and growth factors could activate oncogenic signaling pathways that might be able to reprogram or dedifferentiate tumor cells into CSCs. In colon cancer, it has been shown that the activation of NF-κB and β-catenin can dedifferentiate or reprogram differentiated tumor cells into CSCs (Kreso and Dick, 2014). In the future, it will be interesting to experimentally test this possibility. However, the most favorable explanation is that the Bmi1 inhibitor could also reduce the apoptotic threshold of CSCs in addition to targeting Bmi1+ self-renewal, thereby sensitizing Bmi1+ CSCs to cisplatin-induced apoptosis. In fact, lineage tracing showed that with the combination therapy, the number of Bmi1+ CSCs was most potently reduced. Moreover, the combination therapy not only dramatically reduced tumor sizes, but also decreased the incidence of tumors and cervical lymph node metastasis in vivo. It should be pointed out that we did observe some recurrent HNSCC in mice after the initial combination therapy. These recurrent HNSCC still responded to the second round of combination therapy, suggesting that targeting CSCs might help to prevent the development of chemoresistance (Kreso, et al., 2014). However, we could not rule out that a subpopulation of Bmi1+ CSCs might accumulate molecular and epigenetic changes under certain selective pressures, thereby resulting in resistance. Altogether, our studies experimentally tackle an important question which could be applied to other solid tumors such as breast cancer and colon cancer that also frequently metastasize to lymph nodes or distant organs. To effectively inhibit tumor growth and prevent metastasis or tumor recurrence, targeting both the proliferative tumor bulk and relatively quiescent CSCs through a combination therapy might yield better outcomes.
STAR METHODS
Contact for Reagent and Resource Sharing
Further information and requests for reagents may be directed to, and will be fulfilled by the corresponding author Dr. Cun-Yu Wang (cwang@dentistry.ucla.edu).
EXPERIMENTAL MODELS AND SUBJECT DETAILS
Mice
C57BL/6, NOD/SCID and nude mice were housed under standard conditions in the animal facility of UCLA. All procedures were performed based on the UCLA Animal Research Committee-approved protocols. For induction of HNSCC, six-week-old mice were treated with drinking water containing 50 μg/ml 4NQO for 16 weeks and then given with normal drinking water for another 8–10 weeks. For lineage tracing and Bmi1+ cells ablation studies, Cre was activated by intraperitoneal injection of tamoxifen at a dose of 9 mg per 40 g body weight. For therapeutic treatment, mice were randomly divided into 4 groups and given the vehicle 1) control, 2) cisplatin (1 mg/kg body weight for five successive days), 3) PTC-209 (60 mg/kg body weight for 4 weeks) or 3-PA (120 mg/kg body weight), and 4) cisplatin plus PTC-209 or cisplatin plus 3-PA. The animals were randomly assigned to procedure groups. The experiments were not conducted in a completely blinded fashion. We used a sample size of at least 6 mice per group to reach statistical significance based on our previous experiences. The experiments were repeated at least once.
Human HNSCC Tumor Samples
The use of human HNSCC samples for this study was approved by the UCLA Institutional Review Board. Human HNSCC primary tissues were obtained from Ronald Reagan UCLA Medical Center and subcutaneously inoculated into flank of 6-week-old NOD/SCID mice (The Jackson Laboratory). HNSCC The paraffin-embedded blocks of the human HNSCC were obtained from the UCLA Translational Pathological Core Laboratory and sectioned for immunohistochemistry. Sample-size was determined based on our published studies (Ding et al., 2013) and past experiences. No subjects were excluded from our studies.
Cell Lines
Human HNSCC cell lines SCC1, SCC9, SCC22B, SCC23 were obtained from University of Michigan and HN13 was from NIDCR, and they were maintained in DMEM containing 10% FBS and antibiotics (streptomycin and penicillin) at 37°C in a 5% CO2 atmosphere. Cisplatin-resistant SCC1R and SCC23R cell lines were established by chronic culture in the low concentration of cisplatin and maintained in 2–5 μM of cisplatin.
METHODS DETAILS
4NQO model, Lineage Tracing and Chemotherapy
Bmi1CreER (JAX:010531), R26tdTomato (JAX:007908), R26DTA (JAX:009669) mouse strains were purchased from The Jackson Laboratory. Nude mice (NCRNU-F) were from Taconic and NOD/SCID mice (JAX:001303) were from Jackson Laboratory. For induction of HNSCC, four-week-old mice were treated with drinking water containing 50 μg/ml 4NQO (Sigma-Aldrich Cat#N8141) for 16 weeks and then given normal drinking water for another 8–10 weeks. For lineage tracing and Bmi1+ cells ablation study, Cre was activated by the intraperitoneal injection of tamoxifen (Sigma-Aldrich Cat#T5648) at a dose of 9 mg per 40 g body weight.
Cisplatin (Sigma-Aldrich Cat#479306) was dissolved in saline. PTC-209 (MedChem Express, Cat# HY-15888) was dissolved in 14% DMSO, 36% polyethylene glycol 400 (Sigma-Aldrich Cat#202304) and 50% polypropylene glycol (Sigma-Aldrich Cat#4347). 3-PA (MedChem Express, Cat#HY-12270) was dissolved in polyvinylpyrrolidone (PVP). For therapeutic treatment, mice were randomly divided into 4 groups and given the 1) vehicle control, 2) cisplatin (1 mg/kg body weight for five successive days), 3) PTC-209 (60 mg/kg body weight for 4 weeks) or 3-PA (120 mg/kg body weight), or 4) cisplatin plus PTC-209 or cisplatin plus 3-PA, respectively.
For tumor measurement, mice were sacrificed, and tongues and cervical lymph nodes were dissected immediately. The number of gross tongue lesions was counted, and the surface areas of tumors were measured as described previously (Squarize et al., 2013). Longitudinally cut tongues (dorsal/ventral) and intact lymph nodes were fixed overnight in 10% buffered formalin and embedded in paraffin and sectioned into 5 μm sections. The depth of the tumor invasion of the tongue was determined in the H&E stained sections according to the following criteria: showing signs of normal appearance (grade 0); epithelial dysplasia confined to tongue epidermis (grade 1); distinct invasion, unclearness of basement membrane, drop and diffuse infiltration into the superficial portion of the muscle layer (grade 2); loss of the basement membrane, extensive invasion into deep muscle layer (grade 3). The sections of cervical lymph nodes were immunostained with anti-pan cytokeratin antibodies (Santa Cruz Cat#sc-8018). The percentage of lymph nodes with metastasis was calculated.
Cell Proliferation Assays
To determine cell proliferation in vivo, EdU or BrdU (100 mg/mice) was injected intraperitoneally 2 h before the lethal administration of CO2 to mice. EdU incorporation was detected using a Click-iT EdU Alexa Fluor 488 Imaging Kit (Thermo Fisher Scientific Cat#C10337) according to the manufacturer’s protocol. BrdU incorporation was detected using the immunohistochemistry approach as described above.
Immunostaining and in situ Hybridization
Mouse HNSCC tumors and cervical lymph nodes were dissected and fixed with 4% paraformaldehyde in PBS overnight. Samples were then rinsed with cold PBS, equilibrated in 30% sucrose in PBS overnight and embedded in OCT (Tissue Tek Cat#25608-930). Cytosections at a thickness of 8 μm were cut by using a Leica cryostat and collected with Superfrost Slides (Fisher Scientific Cat#12-550-15). Primary antibodies were used: anti-cytokeratin 5 (Santa Cruz Cat#905501; 1:500), anti-integrin 6 (Santa Cruz Cat#ab105669; 1:1000), anti-pan-cytokeratin (1:500), anti-E-cadherin (Abcam Cat#ab15148; 1:500), anti-Sox2 (Abcam Cat#ab97959; 1:200), anti-CD44 (Abcam Cat#ab51037; 1:500), anti-Ki67 (Abcam Cat#ab15580; 1:400), anti-active-capsase3 (Abcam Cat#ab2302; 1:250), anti-BrdU (Sigma-Aldrich Cat#B8434; 1:100) and anti-FOSL1 (Santa Cruz Cat#sc-605; 1:100). The antigens were visualized using appropriate secondary antibodies conjugated with Cy2 or Cy3 (Jackson ImmunoResearch Laboratories). Sections were counterstained with 4′6′-diamidino-2-phenilindole (DAPI; Sigma-Aldrich Cat#D9542) and mounted with SlowFade Antifade Reagents (Thermo Fisher Scientific Cat#S36937). EdU incorporation was detected using a Kit following the manufacturer’s protocol (Thermo Fisher Scientific Cat#C10337). In situ hybridization for Bmi1 transcripts was performed following the manufacturer’s instructions using RNAscope probes (Advanced Cell Diagnostics Cat#407631) and 2.0 HD brown kits (Advanced Cell Diagnostics Cat#320497). Images were acquired with a microscopy running CellSens software (Olympus http://www.olympus-lifescience.com/en/software/cellsens/).
For Immunohistochemistry of human HNSCC, Paraffin-embedded sections provided by the UCLA Translational Pathological Core were deparaffinized with xylene and then rehydrated with distilled water through an ethanol series. Tissue antigens were retrieved as described previously (Ding et al., 2013). The slides were stained with polyclonal anti-FOSL1 antibodies (1:100; Santa Cruz, sc-605), anti-BMI1 antibodies (1:100, Santa Cruz Cat#sc-10745) or control IgG at 4°C overnight, respectively. The slides were then incubated with horseradish perioxidase-labeled polymer for 60 min. The immunocomplexes were detected with AEC+ chromogen (Dako EnVision System Cat#MP-6401-15) and counterstained with hematoxylin. The intensity of immunostaining was scored as follows: 0, no staining; 1, weak staining; 2, moderate staining; 3, strong staining; 4, very strong staining. The Wilcoxon rank sum test was applied to test the significant differences in IHC staining intensity between different groups. The Pearson correlation coefficient of liner regression was used to determine the correlation between different proteins.
Cell Isolation and Flow Cytometry
Mouse or primary HNSCC tumor tissues were dissected and minced well with scalpels in petri dishes on ice and then enzymatically dissociated into single cell suspensions by incubation with Collagenase/Dispase (Sigma-Aldrich Cat# 10269638001) for 90 min at 37°C. The suspension was then homogenized by pipetting and the enzymes were inactivated with full serum media. Subsequently, tumor cells were washed with media for excess enzyme removal. Primary mouse SCC cells were stained with anti-EpCAM-PE antibodies (1: 10; eBioscience Cat#12-5791-83) at room temperature for 30 minutes. Bmi1+ cells were isolated based on the expression of EpCAM and tdTomato. To isolate putative CSCs from human primary HNSCC, tumor cells were stained with the ALDHEFLUOR assay kit (STEMCELL Technologies Cat#01700) following the manufacturer’s guidelines to label the ALDHhi populations. Tumor cells were then isolated and incubated with anti-EpCAM-PE and anti-CD44-APC (1:100; BD Pharmingen Cat#559942) for 30 minutes at room temperature. ALDHhiCD44+EpCAM+ CSCs were sorted by a FACSVantage SE (Beckton Dickson). To isolate CSCs from HNSCC cell lines, cells were stained with ALDHEFLUOR assay kit, followed by incubation of anti-CD44-APC. Sorting results were analyzed with FlowJo software (http://www.flowjo.com/).
Limiting-dilution assay and orthotopic HNSCC
For limit-dilution transplantation in nude mice, different numbers of FACS-sorted cells (EpCAM+/Tomato+ or EpCAM+/Tomato−) from mouse primary tumors were mixed with Matrigel and subcutaneously injected into nude mice. For orthotopic nude mouse model of HNSCC, EpCAM+/Tomato+ and EpCAM+/Tomato− cells from mouse primary tumors were injected submucosally into tongues of nude mice. For orthotopic xenograft model of human HNSCC, sorted human CSCs (1 × 10⁴ cells in 50 μl PBS) from human HNSCC cell lines or primary tumors were submucosally inoculated into the tongues of nude mice (8 mice per group). Human HNSCC primary tissues were obtained from the UCLA Ronald Reagan Medical Center. Tissues were digested into single cell suspension for sorting.
Tumorsphere formation assays
For tumorsphere formation assays, FACS-sorted cells were cultured in ultra-low attachment plates at a density of 100–500 cells/well. Cells were cultured in serum-free DMEM/F12 (Thermo Fisher Scientific Cat#11330-032) supplemented with 1% B27 supplement (Thermo Fisher Scientific Cat#17504044), 1% N2 supplement (Thermo Fisher Scientific Cat#17502048), penicillin-streptomycin (100 μg/ml; Thermo Fisher Scientific Cat#15140122), human recombinant epidermal growth factor (EGF; 20 ng/ml; R&D Systems Cat#236-EG-01M), and human recombinant basic fibroblast growth factor (bFGF; 10 ng/ml; R&D Systems Cat#233-FB-025/CF), in a humidified 5% CO2 incubator at 37°C. Fresh aliquots of EGF and bFGF were added every 2 days, and the serum-free media were changed every other day until the spheres formed. For passaging, tumorspheres were collected by centrifugation and dissociated with trypsin-EDTA (Thermo Fisher Scientific Cat#R001100) to obtain single cells. Cells were then re-suspended in sphere culture media after removing serum. Spheres with a diameter over 40 μm were counted 1–2 weeks after plating.
siRNA knockdown and retroviral transduction
Human HNSCC cell lines were maintained in DMEM containing 10% FBS. For transient knockdown of BMI1 or FOSL1, 10 nM siRNA or control siRNA (Sigma-Aldrich) was transfected using Lipofectamine RNAiMAX Transfection Reagent (Thermo Fisher Scientific Cat#13778150) following the manufacturer’s instructions. Two siRNA targeting sequences for BMI1 are: 5′-CAAGCAGAAATGCATCGAA-3′ and 5′-CCAGACCACTACTGAATAT-3′. Two siRNA targeting sequences for FOSL1 are: 5′-CACCATGAGTGGCAGTCAG-3′ and 5′-GCATCAACACCATGAGTGG-3′. The control siRNA sequence is: 5′-TTCTCCGAACGTGTCACGT-3′.
For viral transduction, retroviruses were generated by co-transfection of pQCXIH-HA-FOSL1 with packaging plasmids into HEK293T cells as described previously (Ding et al., 2013). To stably express FOSL1 in SCC cells, we transduced SCC cells with retroviruses expressing HA-FOSL1 or the control empty vector and subsequently selected cells with antibiotics.
Western Blotting
Cells were lysed using the radioimmunoprecipitation assay (RIPA) buffer (Sigma-Aldrich Cat#R0278). Protein extracts were run on a 10% or 15%SDS polyacrylamide gel before being transferred to a polyvinylidene difluoride membrane. Membranes were blocked with 5% milk for 1 hour and incubated with primary antibodies overnight, followed by incubation with the secondary antibodies for 2 hours at room temperature. Primary antibodies used in this study were: anti-Bmi-1 (1:1,000; Abcam Cat#sc-10745), anti-caspase-3 (1: 1,000; Cell Signaling Cat#ab2302), anti-caspase-9 (1:1,000; Cell Signaling Cat#9502), anti-uH2A (1:2000, Millipore Cat#05-678), and anti-α-tubulin (1:10,000; Sigma-Aldrich Cat#T9026). The immunocomplexes were detected using the Clarity Western ECL kit (Bio-Rad Cat#1705060).
RNAseq and Real-time RT-PCR
Quality of the RNA for sequencing was determined using an Agilent 2100 Bioanalyzer. Library preparation using the KAPA RNA-Seq Library Preparation Kits (KAPA Biosystems Cat#07960140001) was performed at UCLA sequencing core facilities, and RNAs were single-end sequenced on Illumina HiSeq 3000 machines. Alignment of reads was done using Tophat with the mm10 build of the mouse genome (https://ccb.jhu.edu/software/tophat/index.shtml). Transcript assembly and differential expression was determined using Cufflinks with Refseq mRNAs to guide assembly (Trapnell et al., 2010). Analysis of RNA-seq data was done using the cummeRbund package in R (Trapnell et al., 2012) (http://cole-trapnell-lab.github.io/cufflinks/). The heatmap was generated with Heatmap Builder (King et al., 2005) (http://ashleylab.stanford.edu/tools/tools-scripts.html). Transcripts regulated both greater than and less than 2-fold were used in GO term and KEGG pathway analysis to find enriched functional annotations.
For Real-time RT-PCR, total RNA was extracted using TRIzol reagent (Thermo Fisher Scientific Cat#15596026), and 1 μg of RNA was used for the RT reaction with random primer (Thermo Fisher Scientific Cat#48190011), dNTP mix (Thermo Fisher Scientific Cat#18427013), and M-MuLV Reverse Transcriptase (New England Biolabs Cat#M0253L). Quantification of mRNA was determined using a SYBRGreen supermix (Bio-Rad Cat#1708880). Relative expression levels of the indicated genes were compared with GAPDH expression using the 2ΔΔct method.
Statistical analyses
Numerical data and histograms were expressed as the mean ± SD. Statistical parameters of the analyses are reported in the Figure Legends. All in vitro experiments were repeated at least twice, and in vivo experiments were repeated at least once. Data shown are either a single representative or combined from independent experiments. Two-tailed Student’s t-test was performed between two groups and a difference was considered statistically significant with p < 0.05 (n = 12, Figure 2). For comparison of dysplasia and SCC number in two different mouse groups, the differences were assessed using two-way ANOVA (n = 9 to 14; Figure 3). For comparison of cisplatin, PTC-209, or 3-PA treatment, the differences were determined by one-way ANOVA followed by the Tukey’s HSD post-hoc tests to minimize type I errors (n = 8, Figure 7D). For both one-way and two-way ANOVA analyses, Shapiro-Wilk test was used to confirm normal distribution of data and that all data met the assumptions of no significant outliers. For HNSCC invasion grades, the Cochran-Armitage test was performed (n = 9 to 14, Figure 3G). For percentage of mice with positive lymph node metastasis, Fisher’s exact test was performed (n = 8, Figure 7F). Limiting dilutions were calculated using the Extreme Limiting Dilution Analysis software (http://bioinf.wehi.edu.au/software/elda/). p < 0.05 was considered significant. A total of 100 human HNSCC samples, including HNSCC without metastasis (n = 31), HNSCC with lymph node metastasis (n = 33), lymph node metastases (n = 33), were used in this study, and the parameters for scores was reported in Figure legends (Figure S6B). The Wilcoxon rank sum test was applied to test the significant differences in IHC staining intensity between different groups (Figure S6B). The Pearson correlation coefficient of liner regression was used to determine the correlation between different proteins (Table S2). All statistical analyses were performed with SPSS software.
Data Resources
The accession number for the RNA-seq data reported in this paper is NCBI GEO89549.
Supplementary Material
HIGHLIGHTS.
Bmi1+ CSCs mediate SCC initiation, invasive growth and lymph node metastasis
Bmi+1 CSCs display increased AP-1 that drives SCC invasion and metastasis
Combinatorial targeting Bmi1+ CSCs and tumor bulk overcome chemoresistance in SCC
Eliminating Bmi1+ CSCs in SCC prevents metastasis
Acknowledgments
We thank Christine Hong for reading the manuscript and illustration. This work was supported by NIH/NIDCR grants R01DE15964 and R01DE043110.
Footnotes
AUTHOR CONTRIBUTIONS
D.C. and C.Y.W. conceived of this study. D.C. performed most experiments and analyzed data. M.W., Y.L. Y.Q., M.S., P.D. B.Y., J.D., S.R. J.M.S and J.L. assisted D.C for animal studies and histology. I.C. performed apoptosis assays. Y.Y performed bioinformatics, B.Y. and J.M.S. helped D.C analyze the data and performed statistics. D.C. and C.Y.W wrote the paper.
Publisher's Disclaimer: This is a PDF file of an unedited manuscript that has been accepted for publication. As a service to our customers we are providing this early version of the manuscript. The manuscript will undergo copyediting, typesetting, and review of the resulting proof before it is published in its final citable form. Please note that during the production process errors may be discovered which could affect the content, and all legal disclaimers that apply to the journal pertain.
References
- Al-Hajj M, Wicha MS, Benito-Hernandez A, Morrison SJ, Clarke MF. Prospective identification of tumorigenic breast cancer cells. Proc Natl Acad Sci U S A. 2003;100:3983–3988. doi: 10.1073/pnas.0530291100. [DOI] [PMC free article] [PubMed] [Google Scholar]
- Belguise K, Kersual N, Galtier F, Chalbos D. FRA-1 expression level regulates proliferation and invasiveness of breast cancer cells. Oncogene. 2005;24:1434–1444. doi: 10.1038/sj.onc.1208312. [DOI] [PubMed] [Google Scholar]
- Boumahdi S, Driessens G, Lapouge G, Rorive S, Nassar D, Le Mercier M, Delatte B, Caauwe A, Lenglez S, Nkusi E, et al. SOX2 controls tumour initiation and cancer stem-cell functions in squamous-cell carcinoma. Nature. 2014;511:246–250. doi: 10.1038/nature13305. [DOI] [PubMed] [Google Scholar]
- Brooks MD, Burness ML, Wicha MS. Therapeutic Implications of Cellular Heterogeneity and Plasticity in Breast Cancer. Cell Stem Cell. 2015;17:260–271. doi: 10.1016/j.stem.2015.08.014. [DOI] [PMC free article] [PubMed] [Google Scholar]
- Chakrabarti R, Wei Y, Hwang J, Hang X, Andres Blanco M, Choudhury A, Tiede B, Romano RA, DeCoste C, Mercatali L, et al. DeltaNp63 promotes stem cell activity in mammary gland development and basal-like breast cancer by enhancing Fzd7 expression and Wnt signalling. Nat Cell Biol. 2014;16:1004–1015. 1001–1013. doi: 10.1038/ncb3040. [DOI] [PMC free article] [PubMed] [Google Scholar]
- Chinn SB, Myers JN. Oral Cavity Carcinoma: Current Management, Controversies, and Future Directions. J Clin Oncol. 2015;33:3269–3276. doi: 10.1200/JCO.2015.61.2929. [DOI] [PMC free article] [PubMed] [Google Scholar]
- Clay MR, Tabor M, Owen JH, Carey TE, Bradford CR, Wolf GT, Wicha MS, Prince ME. Single-marker identification of head and neck squamous cell carcinoma cancer stem cells with aldehyde dehydrogenase. Head Neck. 2010;32:1195–1201. doi: 10.1002/hed.21315. [DOI] [PMC free article] [PubMed] [Google Scholar]
- de Mello RA, Geros S, Alves MP, Moreira F, Avezedo I, Dinis J. Cetuximab plus platinum-based chemotherapy in head and neck squamous cell carcinoma: a retrospective study in a single comprehensive European cancer institution. PLoS One. 2014;9:e86697. doi: 10.1371/journal.pone.0086697. [DOI] [PMC free article] [PubMed] [Google Scholar]
- Desmet CJ, Gallenne T, Prieur A, Reyal F, Visser NL, Wittner BS, Smit MA, Geiger TR, Laoukili J, Iskit S, et al. Identification of a pharmacologically tractable Fra-1/ADORA2B axis promoting breast cancer metastasis. Proc Natl Acad Sci U S A. 2013;110:5139–5144. doi: 10.1073/pnas.1222085110. [DOI] [PMC free article] [PubMed] [Google Scholar]
- Ding X, Pan H, Li J, Zhong Q, Chen X, Dry SM, Wang CY. Epigenetic activation of AP1 promotes squamous cell carcinoma metastasis. Sci Signal. 2013;6:ra28 21–13. S20–15. doi: 10.1126/scisignal.2003884. [DOI] [PMC free article] [PubMed] [Google Scholar]
- Driessens G, Beck B, Caauwe A, Simons BD, Blanpain C. Defining the mode of tumour growth by clonal analysis. Nature. 2012;488:527–530. doi: 10.1038/nature11344. [DOI] [PMC free article] [PubMed] [Google Scholar]
- Haddad RI, Shin DM. Recent advances in head and neck cancer. N Engl J Med. 2008;359:1143–1154. doi: 10.1056/NEJMra0707975. [DOI] [PubMed] [Google Scholar]
- Häyry V, Mäkinen LK, Atula T, Sariola H, Mäkitie A, Leivo I, Keski-Säntti H, Lundin J, Haglund C, Hagström J. Bmi-1 expression predicts prognosis in squamous cell carcinoma of the tongue. Br J Cancer 2. 2010;102:892–897. doi: 10.1038/sj.bjc.6605544. [DOI] [PMC free article] [PubMed] [Google Scholar]
- Hedberg ML, Goh G, Chiosea SI, Bauman JE, Freilino ML, Zeng Y, Wang L, Diergaarde BB, Gooding WE, Lui VW, et al. Genetic landscape of metastatic and recurrent head and neck squamous cell carcinoma. J Clin Invest. 2015 doi: 10.1172/JCI86862. [DOI] [PMC free article] [PubMed] [Google Scholar]
- Hermann PC, Huber SL, Herrler T, Aicher A, Ellwart JW, Guba M, Bruns CJ, Heeschen C. Distinct populations of cancer stem cells determine tumor growth and metastatic activity in human pancreatic cancer. Cell Stem Cell. 2007;1:313–323. doi: 10.1016/j.stem.2007.06.002. [DOI] [PubMed] [Google Scholar]
- Kamide D, Yamashita T, Araki K, Tomifuji M, Tanaka Y, Tanaka S, Shiozawa S, Shiotani A. Selective activator protein-1 inhibitor T-5224 prevents lymph node metastasis in an oral cancer model. Cancer Sci. 2016;107:666–673. doi: 10.1111/cas.12914. [DOI] [PMC free article] [PubMed] [Google Scholar]
- Kreso A, Dick JE. Evolution of the cancer stem cell model. Cell Stem Cell. 2014;14:275–291. doi: 10.1016/j.stem.2014.02.006. [DOI] [PubMed] [Google Scholar]
- Kreso A, van Galen P, Pedley NM, Lima-Fernandes E, Frelin C, Davis T, Cao L, Baiazitov R, Du W, Sydorenko N, et al. Self-renewal as a therapeutic target in human colorectal cancer. Nat Med. 2014;20:29–36. doi: 10.1038/nm.3418. [DOI] [PubMed] [Google Scholar]
- Krishnamurthy S, Dong Z, Vodopyanov D, Imai A, Helman JI, Prince ME, Wicha MS, Nor JE. Endothelial cell-initiated signaling promotes the survival and self-renewal of cancer stem cells. Cancer Res. 2010;70:9969–9978. doi: 10.1158/0008-5472.CAN-10-1712. [DOI] [PMC free article] [PubMed] [Google Scholar]
- Lathia JD, Mack SC, Mulkearns-Hubert EE, Valentim CL, Rich JN. Cancer stem cells in glioblastoma. Genes Dev. 2015;29:1203–1217. doi: 10.1101/gad.261982.115. [DOI] [PMC free article] [PubMed] [Google Scholar]
- Lim YC, Kang HJ, Moon JH. C-Met pathway promotes self-renewal and tumorigenecity of head and neck squamous cell carcinoma stem-like cell. Oral Oncol. 2014;50:633–639. doi: 10.1016/j.oraloncology.2014.04.004. [DOI] [PubMed] [Google Scholar]
- Liu H, Patel MR, Prescher JA, Patsialou A, Qian D, Lin J, Wen S, Chang YF, Bachmann MH, Shimono Y, et al. Cancer stem cells from human breast tumors are involved in spontaneous metastases in orthotopic mouse models. Proc Natl Acad Sci U S A. 2010;107:18115–18120. doi: 10.1073/pnas.1006732107. [DOI] [PMC free article] [PubMed] [Google Scholar]
- Nakanishi Y, Seno H, Fukuoka A, Ueo T, Yamaga Y, Maruno T, Nakanishi N, Kanda K, Komekado H, Kawada M, et al. Dclk1 distinguishes between tumor and normal stem cells in the intestine. Nat Genet. 2013;45:98–103. doi: 10.1038/ng.2481. [DOI] [PubMed] [Google Scholar]
- Nor C, Zhang Z, Warner KA, Bernardi L, Visioli F, Helman JI, Roesler R, Nor JE. Cisplatin induces Bmi-1 and enhances the stem cell fraction in head and neck cancer. Neoplasia. 2014;16:137–146. doi: 10.1593/neo.131744. [DOI] [PMC free article] [PubMed] [Google Scholar]
- Oshimori N, Oristian D, Fuchs E. TGF-beta promotes heterogeneity and drug resistance in squamous cell carcinoma. Cell. 2015;160:963–976. doi: 10.1016/j.cell.2015.01.043. [DOI] [PMC free article] [PubMed] [Google Scholar]
- Oskarsson T, Batlle E, Massague J. Metastatic stem cells: sources, niches, and vital pathways. Cell Stem Cell. 2014;14:306–321. doi: 10.1016/j.stem.2014.02.002. [DOI] [PMC free article] [PubMed] [Google Scholar]
- Park IK, Qian D, Kiel M, Becker MW, Pihalja M, Weissman IL, Morrison SJ, Clarke MF. Bmi-1 is required for maintenance of adult self-renewing haematopoietic stem cells. Nature. 2003;423:302–305. doi: 10.1038/nature01587. [DOI] [PubMed] [Google Scholar]
- Polverini PJ, Nor JE. Apoptosis and predisposition to oral cancer. Crit Rev Oral Biol Med. 1999;10:139–152. doi: 10.1177/10454411990100020201. [DOI] [PubMed] [Google Scholar]
- Prince ME, Sivanandan R, Kaczorowski A, Wolf GT, Kaplan MJ, Dalerba P, Weissman IL, Clarke MF, Ailles LE. Identification of a subpopulation of cells with cancer stem cell properties in head and neck squamous cell carcinoma. Proc Natl Acad Sci U S A. 2007;104:973–978. doi: 10.1073/pnas.0610117104. [DOI] [PMC free article] [PubMed] [Google Scholar]
- Schepers AG, Snippert HJ, Stange DE, van den Born M, van Es JH, van de Wetering M, Clevers H. Lineage tracing reveals Lgr5+ stem cell activity in mouse intestinal adenomas. Science. 2012;337:730–735. doi: 10.1126/science.1224676. [DOI] [PubMed] [Google Scholar]
- Siddique HR, Saleem M. Role of BMI1, a stem cell factor, in cancer recurrence and chemoresistance: preclinical and clinical evidences. Stem Cells. 2012;30:372–378. doi: 10.1002/stem.1035. [DOI] [PubMed] [Google Scholar]
- Song J, Chang I, Chen Z, Kang M, Wang CY. Characterization of side populations in HNSCC: highly invasive, chemoresistant and abnormal Wnt signaling. PLoS One. 2010;5:e11456. doi: 10.1371/journal.pone.0011456. [DOI] [PMC free article] [PubMed] [Google Scholar]
- Squarize CH, Castilho RM, Abrahao AC, Molinolo A, Lingen MW, Gutkind JS. PTEN deficiency contributes to the development and progression of head and neck cancer. Neoplasia. 2013;15:461–471. doi: 10.1593/neo.121024. [DOI] [PMC free article] [PubMed] [Google Scholar]
- Sun S, Liu S, Duan SZ, Zhang L, Zhou H, Hu Y, Zhou X, Shi C, Zhou R, Zhang Z. Targeting the c-Met/FZD8 signaling axis eliminates patient-derived cancer stem-like cells in head and neck squamous carcinomas. Cancer Res. 2014;74:7546–7559. doi: 10.1158/0008-5472.CAN-14-0826. [DOI] [PubMed] [Google Scholar]
- Tam WL, Lu H, Buikhuisen J, Soh BS, Lim E, Reinhardt F, Wu ZJ, Krall JA, Bierie B, Guo W, et al. Protein kinase C alpha is a central signaling node and therapeutic target for breast cancer stem cells. Cancer Cell. 2013;24:347–364. doi: 10.1016/j.ccr.2013.08.005. [DOI] [PMC free article] [PubMed] [Google Scholar]
- Tam WL, Weinberg RA. The epigenetics of epithelial-mesenchymal plasticity in cancer. Nat Med. 2013;19:1438–1449. doi: 10.1038/nm.3336. [DOI] [PMC free article] [PubMed] [Google Scholar]
- Vitale-Cross L, Molinolo AA, Martin D, Younis RH, Maruyama T, Patel V, Chen W, Schneider A, Gutkind JS. Metformin prevents the development of oral squamous cell carcinomas from carcinogen-induced premalignant lesions. Cancer Prev Res (Phila) 2012;5:562–573. doi: 10.1158/1940-6207.CAPR-11-0502. [DOI] [PMC free article] [PubMed] [Google Scholar]
- Wang H, Wang L, Erdjument-Bromage H, Vidal M, Tempst P, Jones RS, Zhang Y. Role of histone H2A ubiquitination in Polycomb silencing. Nature. 2004;431:873–878. doi: 10.1038/nature02985. [DOI] [PubMed] [Google Scholar]
- Wang Y, Ow TJ, Myers JN. Pathways for cervical metastasis in malignant neoplasms of the head and neck region. Clin Anat. 2012;25:54–71. doi: 10.1002/ca.21249. [DOI] [PubMed] [Google Scholar]
- White RA, Neiman JM, Reddi A, Han G, Birlea S, Mitra D, Dionne L, Fernandez P, Murao K, Bian L, et al. Epithelial stem cell mutations that promote squamous cell carcinoma metastasis. J Clin Invest. 2013;123:4390–4404. doi: 10.1172/JCI65856. [DOI] [PMC free article] [PubMed] [Google Scholar]
- Yang MH, Hsu DS, Wang HW, Wang HJ, Lan HY, Yang WH, Huang CH, Kao SY, Tzeng CH, Tai SK, et al. Bmi1 is essential in Twist1-induced epithelial-mesenchymal transition. Nat Cell Biol. 2010;12:982–992. doi: 10.1038/ncb2099. [DOI] [PubMed] [Google Scholar]
- Ye N, Ding Y, Wild C, Shen Q, Zhou J. Small molecule inhibitor targeting activator protein 1 (AP-1) J Med Chem. 2014;57:6930–6948. doi: 10.1021/jm5004733. [DOI] [PMC free article] [PubMed] [Google Scholar]
- Zeng Q, Chen S, You Z, Yang F, Carey TE, Saims D, Wang CY. Hepatocyte growth factor inhibits anoikis in head and neck squamous cell carcinoma cells by activation of ERK and Akt signaling independent of NFkappa B. J Biol Chem. 2002a;277:25203–25208. doi: 10.1074/jbc.M201598200. [DOI] [PubMed] [Google Scholar]
- Zeng Q, McCauley LK, Wang CY. Hepatocyte growth factor inhibits anoikis by induction of activator protein 1-dependent cyclooxygenase-2. Implication in head and neck squamous cell carcinoma progression. J Biol Chem. 2002b;277:50137–50142. doi: 10.1074/jbc.M208952200. [DOI] [PubMed] [Google Scholar]
- Zhu Z, Khan MA, Weiler M, Blaes J, Jestaedt L, Geibert M, Zou P, Gronych J, Bernhardt O, Korshunov A, et al. Targeting self-renewal in high-grade brain tumors leads to loss of brain tumor stem cells and prolonged survival. Cell Stem Cell. 2014;15:185–198. doi: 10.1016/j.stem.2014.04.007. [DOI] [PubMed] [Google Scholar]
Associated Data
This section collects any data citations, data availability statements, or supplementary materials included in this article.