Abstract
Nine neurodegenerative diseases are caused by expanded polyglutamine (polyQ) tracts in different proteins, like huntingtin in Huntington’s disease (HD) and ataxin-3 in spinocerebellar ataxia type 3 (SCA3)1, 2. Age-at-onset decreases with increasing polyglutamine length in these proteins and the normal length is also polymorphic3. PolyQ expansions drive pathogenesis in these diseases, as isolated polyQ tracts are toxic, and an N-terminal huntingtin fragment comprising exon 1, which occurs in vivo due to alternative splicing4, causes toxicity. While such mutant proteins are aggregate-prone5, toxicity is also associated with soluble forms of the proteins6. The function of the polyQ tracts in many normal/wild-type cytoplasmic proteins is unclear. One such protein is the deubiquitinating enzyme ataxin 37, 8, which is widely expressed in the brain9, 10. Here we show that the polyQ domain in wild-type ataxin-3 enables its interaction with beclin 1, a key autophagy initiator11. This interaction allows the deubiquitinase activity of ataxin-3 to protect beclin 1 from proteasome-mediated degradation and thus enables autophagy. Starvation-induced autophagy, which is regulated by beclin 1, was particularly inhibited in ataxin-3-depleted human cell-lines, primary neurons and in-vivo. This activity of ataxin-3 and its interaction with beclin 1 mediated by its polyQ domain was competed by other soluble proteins with polyQ tracts in a length-dependent fashion. This resulted in impaired starvation-induced autophagy in cells expressing mutant huntingtin exon 1, which was also recapitulated in the brain of HD mouse model and in patient cells. A similar phenomenon was also seen with other polyQ disease proteins, including mutant ataxin-3 itself. Our data thus describe a specific function for a wild-type polyQ tract which is abrogated by a competing longer polyQ mutation in a disease protein. This also reveals a deleterious function of such mutations distinct from their aggregation propensity.
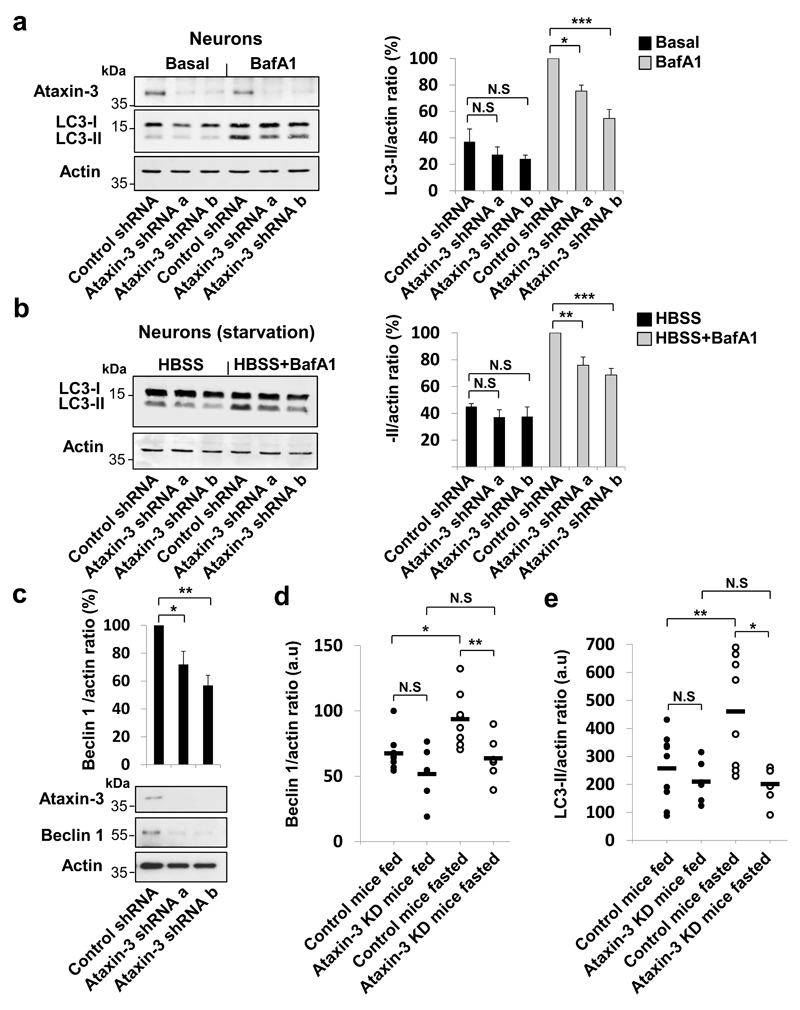
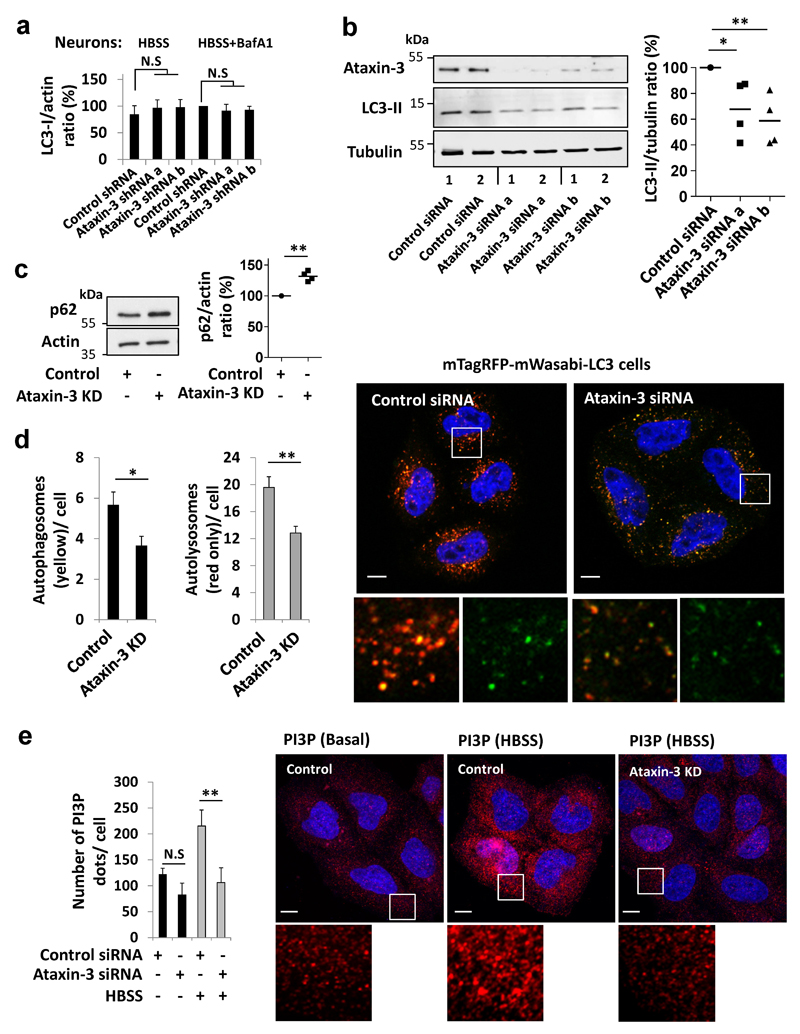
Autophagy induction enhances the clearance of polyQ-expanded proteins, like mutant huntingtin and ataxin 3, thereby attenuating their toxicities5, 12, 13. To understand the interplay between polyQ-containing proteins and autophagy, we investigated if wild-type ataxin-3 affects this process. Conjugation of the autophagy protein (Atg) Atg8/LC3-I to phosphatidylethanolamine on autophagosomal membranes forms LC3-II. Hence, LC3-II levels (relative to loading controls like actin) correlate with autophagosome load14–16. Ataxin-3 knockdown in primary neurons (Fig. 1a) lowered LC3-II levels in the presence of bafilomycin A1 (BafA1). As BafA1 inhibits LC3-II degradation, this suggests that ataxin-3 knockdown impaired autophagosome synthesis. Decreased LC3-II levels (but not LC3-I) were also observed in ataxin-3-depleted, BafA1-treated, neurons in starvation media (Fig. 1b, Extended Data Fig. 1a). Moreover, ataxin-3 knockdown in HeLa cells lowered LC3-II levels and increased the levels of the autophagy substrate, p62 (Extended Data Fig. 1 b,c). Ataxin-3 knockdown decreased the number of autophagosomes and autolysosomes scored with mTagRFP-mWasabi-LC3, consistent with impaired autophagosome formation (Extended Data Fig. 1d).
Figure 1. Ataxin-3 contributes to autophagosome formation by regulating the levels of beclin 1.
Mouse cortical neurons were transduced with control or ataxin-3 lentiviral shRNAs and analysed for: a, LC3-II levels with/without BafA1. b, LC3-II levels in starvation (HBSS) with/without BafA1. c, Beclin 1 levels in the starved cells. Results are mean ± s.e.m. n=5 replicates from two independent cultures. d-e, Control mice and mice depleted of liver ataxin-3 were fasted (24 h). Liver samples were analysed for beclin 1 (d) and LC3-II (e). Control fed n=9, ataxin-3 knockdown fed n=6, control fasted n=8, ataxin-3 knockdown fasted n=6, a.u arbitrary units. Extended statistical analysis in Supplementary Table 1. Two-way ANOVA with Bonferroni’s post-test (a, b, d, e). One-way ANOVA with post-hoc Tukey’s test (c). For representative blots and in-vivo ataxin-3 knockdown efficiency, see Extended Data Fig. 2d. Gel source data in Supplementary Fig. 1.
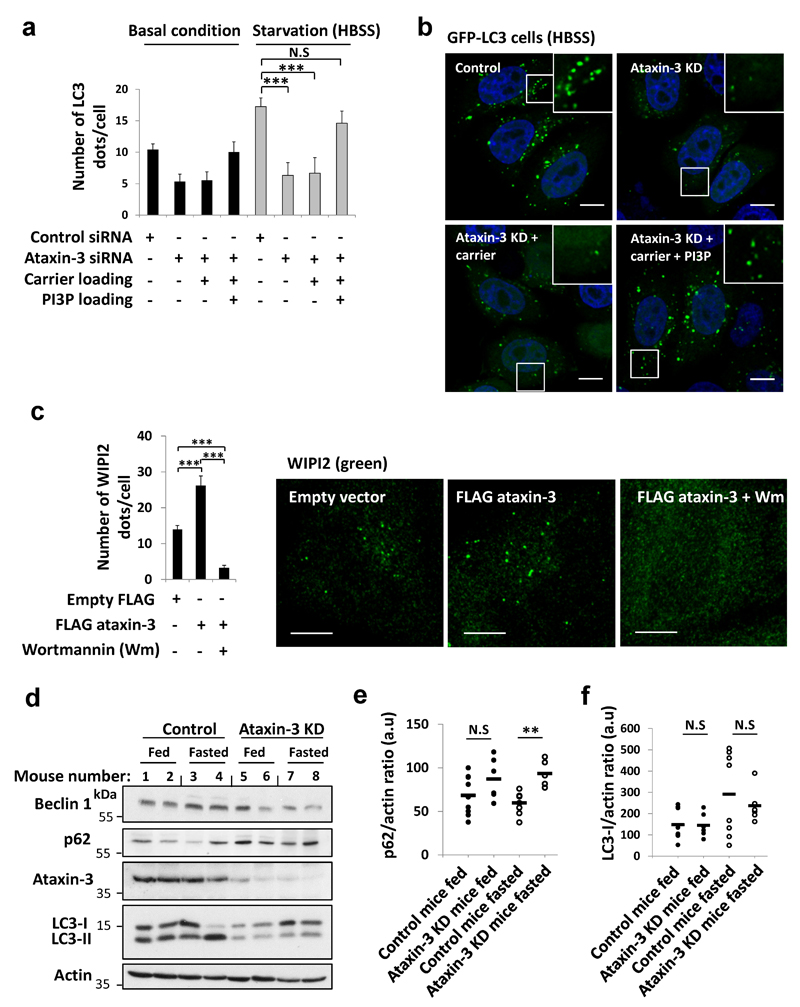
The decreased autophagosome biogenesis following ataxin-3 knockdown was associated with lower beclin 1 levels (Fig. 1c). The phosphatidylinositol 3-phosphate (PI3P) formed by the beclin 1/VPS34 complex is particularly important for autophagy induction (LC3-II formation in BafA1) after nutrient depletion and such defects are seen in cells with monoallelic beclin 1 deletion11, 17, 18. Decreased PI3P-positive structures in starvation, characteristic of beclin 1-depletion18 were seen in ataxin-3-depleted cells (Extended Data Fig. 1e). In both fed and starved conditions, loading back exogenous PI3P to ataxin-3-depleted cells increased LC3 vesicle numbers to levels comparable to control cells (Extended Data Fig. 2 a,b). Ataxin-3 overexpression increased the numbers of puncta positive for the PI3P-binding autophagy effector, WIPI2, which binds to PI3P at autophagy initiation membranes19, 20. This effect was reversed when ataxin-3 overexpressing cells were treated with the PI3 kinase inhibitor, wortmannin (Extended Data Fig. 2c). After fasting mice, livers depleted of ataxin-3 failed to upregulate beclin 1 and LC3-II levels (Fig. 1 d,e, Extended Data Fig. 2d) and had increased p62 levels (Extended Data Fig. 2 e,f), compared to wild-types. Therefore, ataxin-3 knockdown decreases beclin 1 levels, which can explain reduced PI3P levels and consequent impaired autophagosome biogenesis.
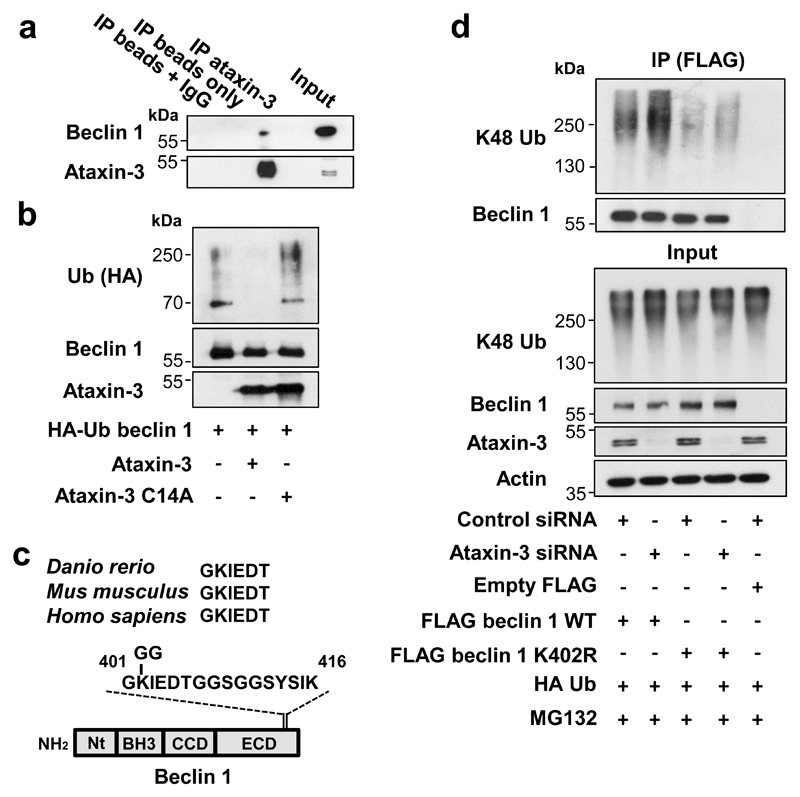
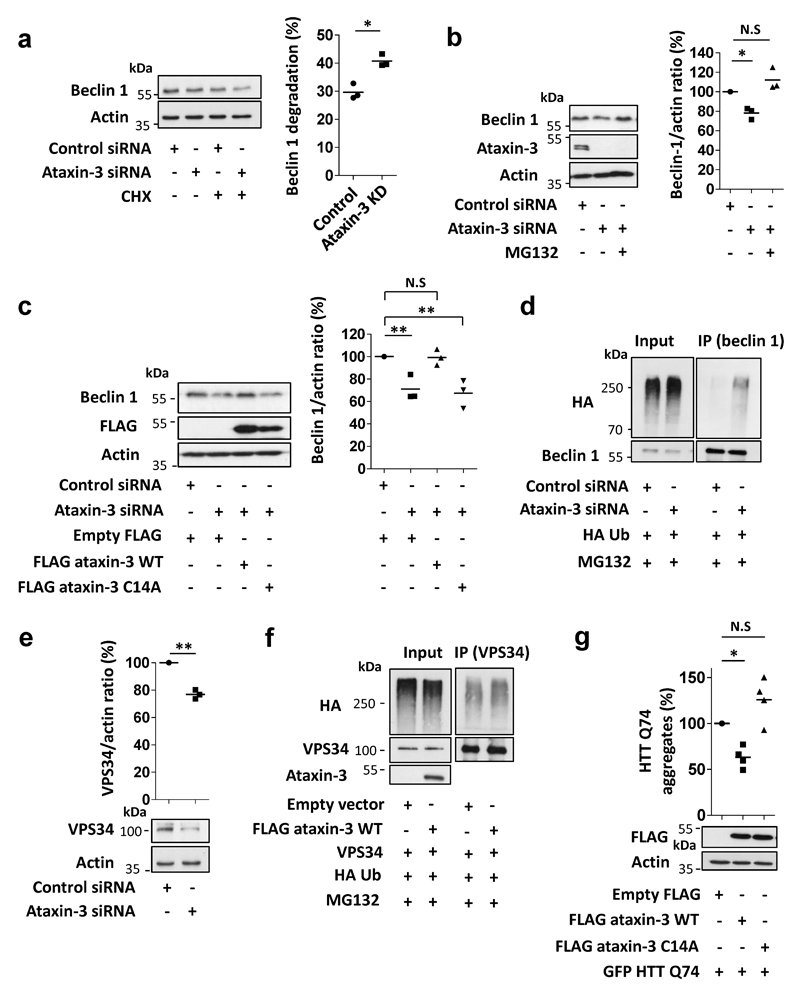
As ataxin-3 interacted with beclin 1 (Fig. 2a), we tested if ataxin-3 deubiquitinase activity protected beclin 1 from proteasomal degradation. Beclin 1 levels declined more in ataxin-3-depleted cells, compared to controls, after inhibition of protein synthesis, suggesting accelerated beclin 1 turnover (Extended Data Fig. 3a). Beclin 1 levels were restored in ataxin-3 knockdown cells treated with a proteasome inhibitor (Extended Data Fig. 3b) and when ataxin-3-depleted cells were transfected with wild-type ataxin-3 but not with ubiquitin protease dead mutant (C14A) (Extended Data Fig. 3c). Under proteasome inhibition, endogenous beclin 1 ubiquitination was increased when ataxin-3 was knocked down (Extended Data Fig. 3d), and recombinant ataxin-3 but not the protease dead mutant (C14A) deubiquitinated beclin 1 in vitro (Fig. 2b, Extended Data Fig 3 e,f showing beclin 1 selectivity). The percentage of cells with mutant huntingtin exon 1 aggregates correlates with levels of this protein and decreases when autophagy is induced12. Consistent with autophagy induction, overexpression of wild-type (but not C14A) ataxin-3 decreased the percentage of such mutant huntingtin-expressing cells with aggregates (Extended Data Fig. 3g).
Figure 2. Beclin 1 deubiquitination by ataxin-3.
a, Endogenous ataxin-3 was immunoprecipitated from HeLa cell lysates and blots probed for endogenous beclin 1. b, Ubiquitinated beclin 1 was incubated in-vitro with recombinant ataxin-3 or ataxin-3 C14A for 2 h and analysed for beclin 1 ubiquitination using anti-HA antibodies. c, Evolutionary conservation of region around beclin 1 K402. d, Control and ataxin-3 depleted HeLa cells were transfected as indicated (24 h), incubated for last 6 h with proteasome inhibitor (MG132, 10 µM). Wild-type (WT) FLAG beclin 1 and mutant FLAG beclin 1 K402R were immunoprecipitated with anti-FLAG antibody for ubiquitination analysis. Gel source data in Supplementary Fig. 1.
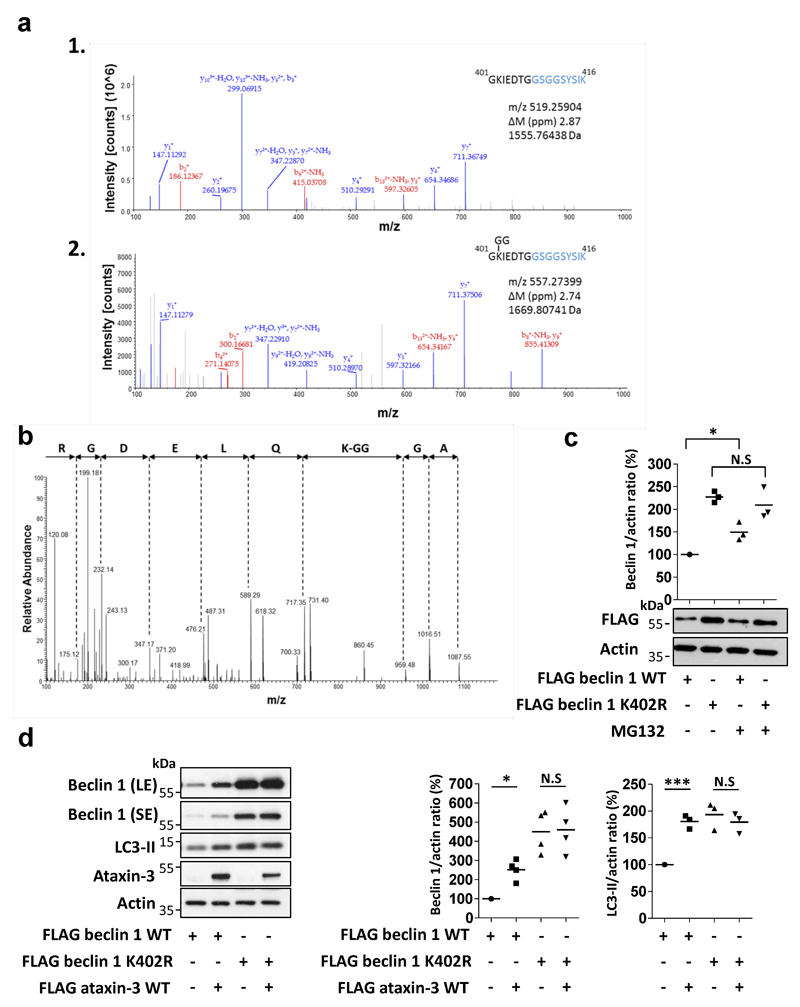
Our mass spectrometry analysis and others21 suggested beclin 1 lysine 402 was modified with a lysine 48 (K48) ubiquitin chain, a signal for proteasomal degradation (Fig. 2c, Extended Data Fig. 4 a,b). Lysine 402 in the evolutionary conserved domain (ECD) is conserved in fish, mouse and humans (Fig. 2c). K48-linked beclin 1 polyubiquitination was increased by ataxin-3 depletion and mutation of lysine 402 to arginine (K402R) decreased K48-linked beclin 1 polyubiquitination, confirming K402 as a site for K48 ubiquitination (Fig. 2d). Consequently, the levels of K402R beclin 1 were already more abundant than wild-type beclin 1 in cells and did not further increase after treatment with proteasome inhibitors (Extended Data Fig 4c). Ataxin-3 expression in HeLa cells increased wild-type beclin 1 levels and did not increase levels of beclin 1 K402R (Extended Data Fig. 4d). This correlated with more autophagy with beclin 1 K402R compared to wild-type overexpression (Extended Data Fig. 4d).
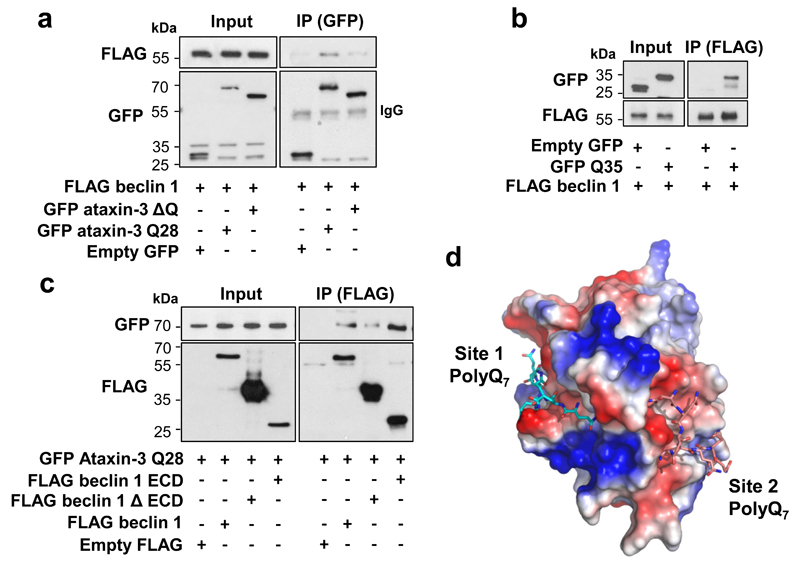
Deletion of the polyQ domain from ataxin-3 dramatically reduced its binding to beclin 1 (Fig. 3a) and an isolated polyQ stretch was sufficient to bind beclin 1 (Fig. 3b). Thus, the polyQ domain is important for the ataxin-3-beclin 1 interaction, but is not the only binding domain. The beclin l ECD interacted with ataxin-3 (Fig. 3c) and also bound the polyQ tract alone (Extended Data Fig. 5a), suggesting that beclin 1 ECD contained polyQ-binding domains, consistent with structural docking models revealing two highly scored polyQ-binding pockets in the beclin 1 ECD (Fig. 3d, Extended Data Fig. 5 b-e). As some binding was observed with beclin 1 lacking the ECD, other domains of beclin 1 may also interact with ataxin-3.
Figure 3. Ataxin-3 polyQ domain contributes to ataxin-3 interaction with beclin 1.
a,b,c, Constructs were transfected in HeLa cells for 24 h. a, Cell lysates were immunoprecipitated with anti-GFP antibody and immunocomplexes analysed with anti-FLAG antibody. b,c, Cell lysates were immunoprecipitated with anti-FLAG antibody and immunocomplexes analysed with anti-GFP antibody. Gel source data in Supplementary Fig. 1. d, Structural docking modelling reveals two interactions sites between beclin 1 ECD and PolyQ7. Surface charge illustration of human beclin 1 ECD showing high scored docking pose of polyQ7 stretch (docking scores for site 1 and site 2 are -10.394 and -10.721, respectively). Full structural analysis in Extended Data Fig. 5.
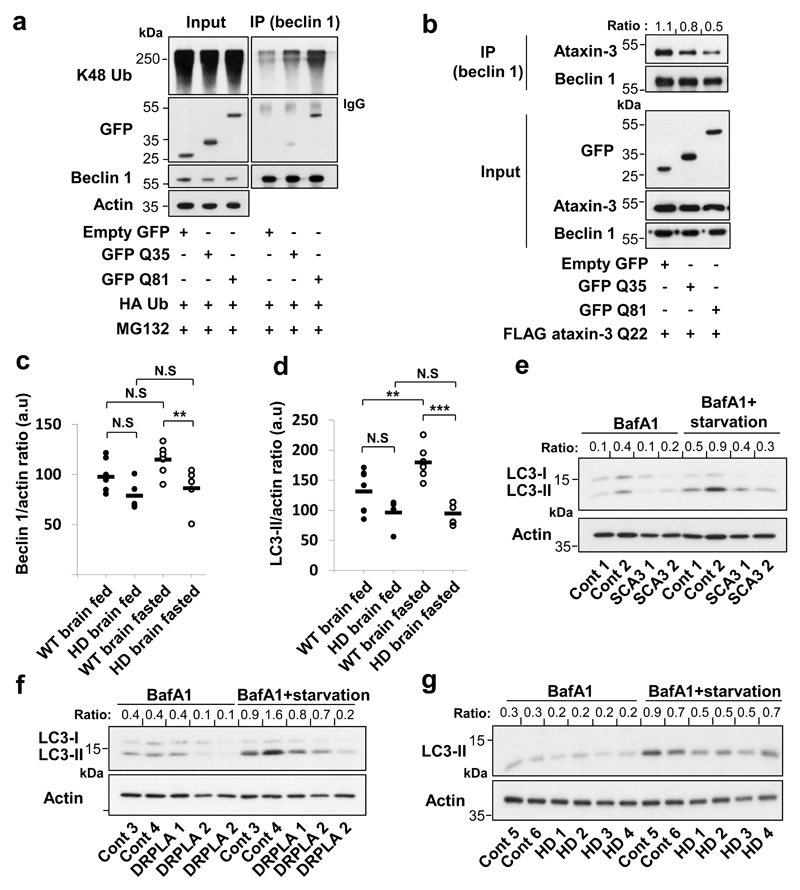
GFP-tagged isolated polyQ tracts could bind to beclin 1, while longer stretches (Q81) bound beclin 1 more strongly than shorter tracts (Q35) (Fig. 4a). Remarkably, beclin 1 K48-polyubiquitination was increased in cells overexpressing GFP Q35 versus empty GFP, and was increased even further with GFP Q81 overexpression (Fig. 4a), consistent with a model where these constructs compete with the ataxin-3 polyQ stretch for binding and deubiquitination of beclin 1. Indeed, overexpression of GFP-polyQ constructs decreased ataxin-3-beclin 1 binding (Fig. 4b). GFP Q35 (which does not aggregate in our conditions) decreased beclin 1 levels (Extended Data Fig. 6a), impaired starvation-induced autophagy (Extended Data Fig. 6a, d, e) and increased p62 levels in starved cells (Extended Data Fig. 6b). No change in the number of LC3-II vesicles was observed when the Q35 tract was expressed in beclin 1-depleted cells (Extended Data Fig. 6 c-e) and the inhibitory effect of Q35 on beclin 1 levels and autophagy in beclin 1-expressing cells was rescued by ataxin-3 overexpression (Extended Data Fig. 6a), compatible with the model that the Q35 acts by impairing ataxin-3 control of beclin 1 levels.
Figure 4. Expanded polyQ tracts inhibit ataxin-3-beclin 1 interaction, decrease beclin 1 levels and impair starvation-induced autophagy.
a,b HeLa cells were transfected with indicated constructs for 24 h and immunoprecipitated for endogenous beclin 1. a, Cells treated for last 6 h with proteasome inhibitor (MG132 10 µM) were analysed for beclin 1 ubiquitination and for beclin 1-bound polyQ using anti-GFP antibody. b, Immunocomplexes were analysed for beclin 1-bound ataxin-3 using anti-FLAG antibody. Bound ataxin-3/beclin 1 ratio is presented. c-d, Brain samples from wild-type (WT) mice and Huntington’s disease (HD) transgenic mice were analysed for beclin 1 (c) and LC3-II (d). WT fed n=7, HD fed n=5, WT fasted n=7, HD fasted n=6, a.u arbitrary units. Extended statistical analysis in Supplementary Table 1. Two-way ANOVA with Bonferroni’s post-test. Representative blots in Extended Data Fig. 8e. e-g, Primary fibroblasts from healthy controls or patients with different polyQ diseases treated with bafA1, in full media or starved/HBSS analysed for LC3-II/actin ratio. Gel source data in Supplementary Fig. 1.
A wild-type (Q17) huntingtin fragment (N-terminal 350 residues) bound to beclin 1 and this interaction was largely lost when the polyQ stretch was deleted (Extended Data Fig. 7a). Furthermore, mutant polyQ-expanded, full-length huntingtin competed with wild-type ataxin-3 for beclin 1 binding (Extended Data Fig. 7b). To test the general principle on autophagy, we used an N-terminal exon 1 fragment to exclude any confounding effects of the huntingtin C-terminus on autophagy22. In stable-inducible HEK293 cells expressing wild-type (Q23) and mutant (Q74) huntingtin exon 1 at similar levels (where there is no overt toxicity or aggregation (<1%) during the experiment), we observed lower beclin 1 levels and impaired starvation-induced autophagy, after switching on the huntingtin transgene (Extended Data Fig. 7 c-e). These effects were more pronounced in mutant cells. As these phenomena occur in both wild-type Q23-huntingtin cells and Q35-expressing cells, they cannot simply be explained by beclin 1 sequestration into aggregates23.
Next, we studied cell lines derived from the striatum, the brain region most sensitive to the HD mutation, from heterozygous mutant huntingtin (Q7/Q111) and matched wild-type huntingtin knock-in mice (Q7/Q7) both humanised for huntingtin exon 124. Mutant huntingtin striatal-derived cells (Q7/Q111) had lower beclin 1 levels and defects in starvation-induction of WIPI2 dots and LC3-II levels, compared to wild-type cells (Q7/Q7) (Extended Data Fig. 8 a-c). Likewise, brains from young mutant huntingtin exon 1 transgenic mice, when there is minimal overt aggregation (Extended Data Fig. 8d), had decreased beclin 1 levels in fasting conditions, failed to upregulate LC3-II with fasting, and had increased p62 levels, compared to wild-type littermate brains (Fig. 4 c,d, Extended Data Fig. 8 e-g).
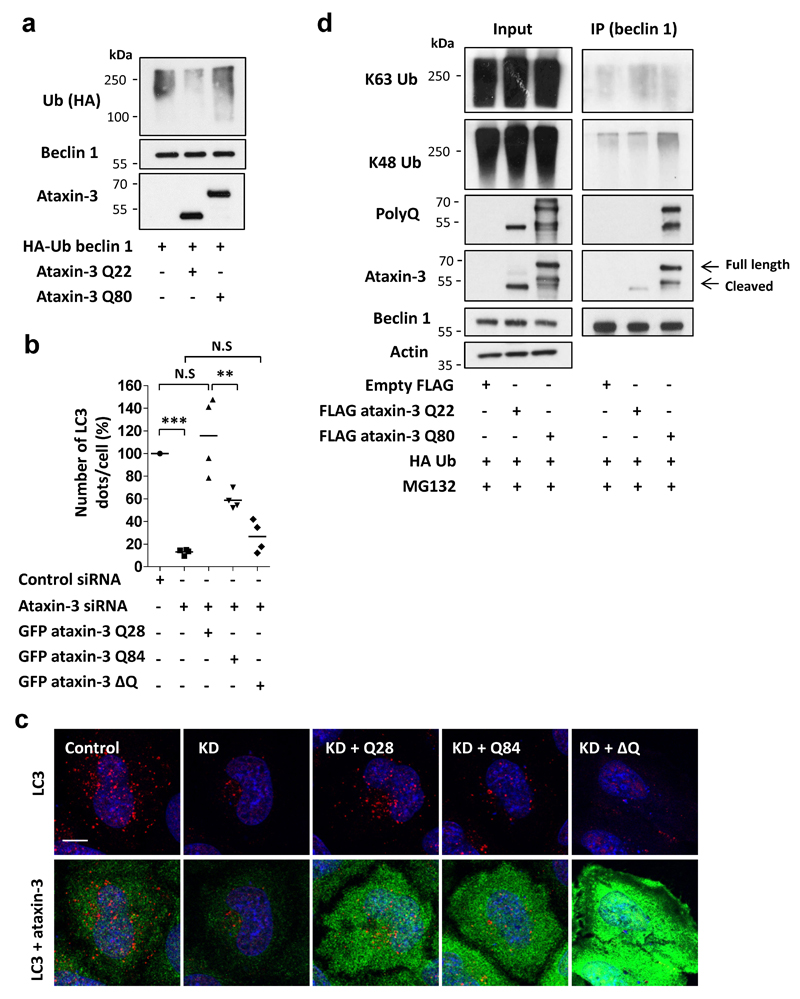
We then tested if this mechanism applied to mutant ataxin-3, as decreased beclin 1 levels are seen in SCA3 rodent models25. Expansion of the polyQ domain in ataxin-3 decreased its deubiquitinase activity towards beclin 1 (Extended Data Fig. 9a). Transfecting expanded ataxin-3 Q84 into ataxin-3 knockdown cells partially rescued LC3 dot numbers but was not as effective as wild-type ataxin-3 Q28 (Extended Data Fig. 9 b-c), consistent with decreased deubiquitinase activity of the mutant protein. However, the ΔpolyQ ataxin-3 did not rescue the number of LC3 dots (Extended Data Fig. 9 b-c). When overexpressed in cells, mutant ataxin-3 had a stronger interaction with beclin 1, associated with increased beclin 1 K48 polyubiquitination, while no obvious change was observed in beclin 1 K63 polyubiquitination (Extended Data Fig. 9d). Thus, the longer polyQ stretches in mutant ataxin-3 bind beclin 1 more strongly than wild-type ataxin-3 but the mutant protein also has decreased deubiquitinase activity. This likely results in a partial dominant-negative effect of mutant ataxin-3 towards beclin 1 levels, with similar consequences on this autophagy pathway as observed with mutant huntingtin fragments.
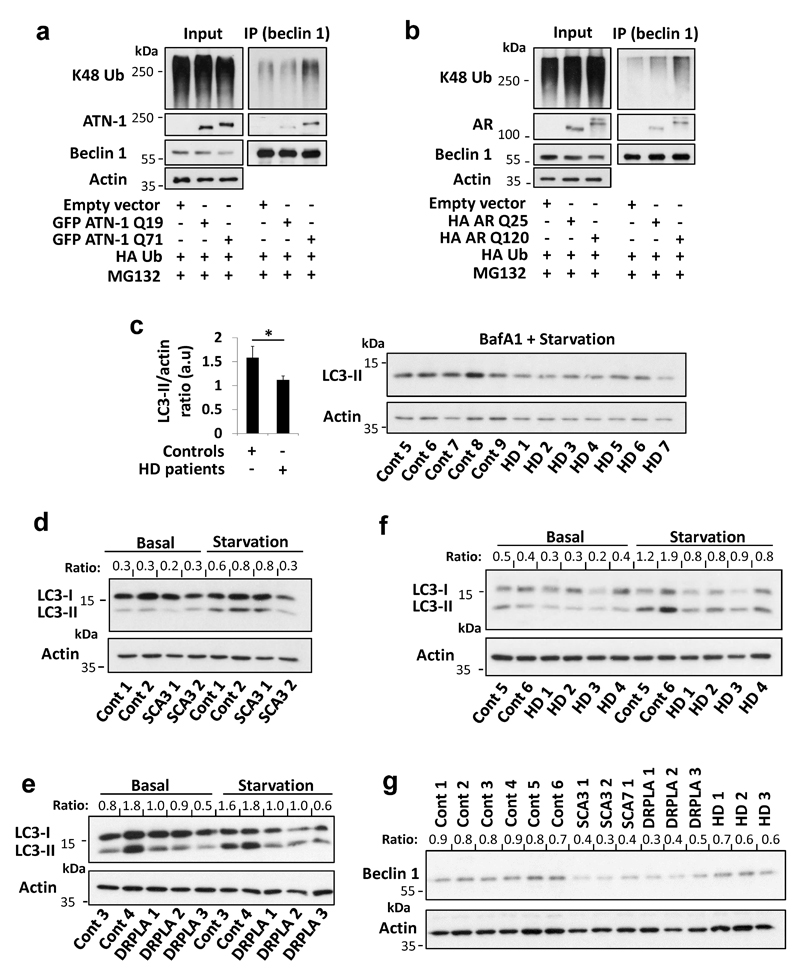
Apart from mutant huntingtin and ataxin-3, beclin 1 also interacted with atrophin-1 and the androgen receptor (Extended Data Fig. 10 a,b) that are mutated in the polyQ diseases dentatorubral-pallidoluysian atrophy (DRPLA) and spinal and bulbar muscular atrophy, respectively. PolyQ-expanded atrophin-1 and androgen receptor showed increased interactions with beclin 1 that elevated beclin 1 K48-polyubiquitination (Extended Data Fig. 10 a,b). Finally, we observed decreased beclin 1 levels and impaired starvation-induced autophagy in fibroblasts derived from DRPLA, SCA3 and HD patients, compared to controls (Fig. 4 e-g, Extended Data Fig. 10 c-g).
Our data reveal novel roles for polyQ tracts in health and disease. The wild-type ataxin-3 polyQ stretch is required for binding to beclin 1 that enables deubiquitination of this key autophagy inducer26 and protects it from proteasome-mediated degradation. Importantly, this wild-type polyQ-mediated interaction was competed for by diverse disease proteins with polyQ expansion mutations. The observed defect in starvation-induced autophagy caused by mutant polyQ proteins may reflect a less obvious impairment of basal autophagy, which is magnified under starvation conditions. This may contribute to late-onset polyQ diseases, where a relatively subtle defect is tolerated for decades prior to disease onset, and where the toxic mutant protein itself is an autophagy substrate.
Methods
Reagents
The primary antibodies used in the study include rabbit anti-Actin (#A2066), mouse anti-FLAG M2 (#F3165) and mouse anti-Tubulin (#T9026) from Sigma, rabbit anti-LC3 (#NB 100-2220) and rabbit anti-Atrophin-1 (#NB100-2336) from Novus Biologicals, mouse anti-HA.11 (#MMS-101P) from Covance, mouse anti-p62 (#610833) from BD Bioscience, rabbit anti-Beclin 1 (#3738), rabbit anti-VPS34 (#4263), rabbit anti-K48 polyUb (#8081) and rabbit anti-K63 polyUb (#5621) from Cell Signalling, rabbit anti-GFP (ab6556) from Abcam, mouse anti-Ataxin-3 (#MAB5360) and mouse anti-polyglutamine (#MAB1574) from Millipore, mouse anti-GFP (#632375) from Clontech, mouse anti-Androgen Receptor (#sc-7305) from Santa Cruz. Anti-mouse (#NA931V) and anti-rabbit (#NA934V) horseradish peroxidise (HRP)-conjugated secondary antibodies (GE Healthcare). Goat anti rabbit 800CW secondary antibody (#926-32211) from LI-COR. Alexa Fluor 555- (#A21428) conjugated goat anti-rabbit secondary antibody (Invitrogen/Life Technologies). The constructs that were used in this work consisted of: empty pEFGP, HA-Ub. pEGFP-Q35 and pEGFP-Q81 were described in ref 27. The following were a gift from Henry Paulson28: pEFGP-Ataxin-3Q28 (Addgene #22122), pEFGP-Ataxin-3Q84 (#22123), pFLAG-6a-Ataxin-3Q22 (Addgene #22126), pFLAG-6a-Ataxin-3Q22-C14A (Addgene #22127) and pFLAG-6a-Ataxin3Q80 (Addgene #22129). The pcDNA4-FLAG-Beclin 1(1-242) (Addgene #24391) and pcDNA4-FLAG-Beclin 1(243-450) (Addgene #24392) were gifts from Qing Zhong29. The following constructs were generated in our lab: pcDNA-FLAG-Beclin 1 and pcDNA- Beclin 1 were described in ref30, pcDNA-FLAG-Beclin 1(K402R), pEFGP-Ataxin-3 ΔQ (1-290), FLAG-HTT 350 (1-350) was described in 31, pEGFP-HTT exon 1 Q74 and pEGFP-HTT exon 1 Q23 were described in ref 32 and FLAG-full length HTT Q138. The following constructs were kindly provided by Janghoo Lim (HA-tagged Androgen Receptor with 25Q or 120Q) and Zoya Ignatova (EGFP-tagged Atrophin-1 with 19Q or 71Q).
Cell lines
Human cervical carcinoma (HeLa) cells and striatal neuronal cell lines derived from “wild-type” HTT Q7/Q7 and heterozygous HTT Q7/Q111 knock-in mice (Coriell Institute #CH00097 and #CH00096, respectively) were grown at 37°C (for HeLa) and at 33°C (for striatal cells) in DMEM medium (Sigma) supplemented with 10% FBS, 100 U ml–1 penicillin/streptomycin, 2 mM l-glutamine and 1 mM sodium pyruvate (basal media), under 5% CO2. HeLa cells stably expressing GFP-LC3 and HeLa cells stably expressing mTagRFP-mWasabi-LC3 reporter were cultured in basal media supplemented with 500 μg/ml G418 (Sigma). For creation of mTagRFP-mWasabi-LC3 stable cell lines, mTagRFP-mWasabi-LC3 (construct from Jian Lin33) was cloned into pIRESneo using EcoR1 and SacII sites. The construct was transfected into HeLa cells, and transfected cells were selected using G418. Single cell clones were generated be FACS sorting and cell lines showing moderate expression levels were selected. mTagRFP-mWasabi-LC3 monitors autophagic flux, since mWasabi (green) fluorescence is quenched when autophagosomes are acidified following fusion with lysosomes. Stable-inducible HEK293 cells expressing wild-type (Q23) or mutant (Q74) huntingtin (HTT) exon 1 were generated by cloning GFP-HTT (mutant or wild-type) from eGFP-C1 into pCDNA5/TO using Xba1 and ApaI restriction sites. These constructs were linearised with MfeI and transfected into T-Rex-293 cells (Thermo Fisher) which stably express the tetracycline repressor protein. Transfected cells were selected by addition of hygromycin. Single cells clones were generated which showed expression of GFP-HTT only in the presence of doxycycline, and to enable comparison, with similar levels of HTT expression. HeLa cells (source ATCC) and HEK293 cells (source ECACC) were authenticated by STR profiling and were routinely tested for mycoplasma contamination. In some experiments, cells were starved in Hanks balanced salt solution (HBSS) media (Invitrogen) for 4 hr with or without 400 nM of bafilomycin A1 (BafA1) (Sigma). BafA1 treatment alone was carried out sometimes for 16 h with 200 nM, as indicated in the legend. Cell transfection was performed with TransIT 2020 Mirus (for DNA) or LipofectAMINE 2000 reagents (for siRNA) (Invitrogen), using the manufacturer’s protocol. Final siRNA concentrations of 20 nM to 100nM were used for silencing with two rounds of knockdown for 5 days. The following oligonucleotides (ON-TARGETplus SMARTpool, Dharmacon) were used for ataxin-3 depletion: oligo 05 (ACAGGAAGGUUAUUCUAUA), oligo 06 (a) (GGACAGAGUUCACAUCCAU), oligo 07 (b) (GCACUAAGUCGCCAAGAAA), oligo 08 (GCAGGGCUAUUCAGCUAAG); for beclin 1 depletion: oligo 05 (GAUACCGACUUGUUCCUUA), oligo 06 (GGAACUCACAGCUCCAUUA), oligo 07 (CUAAGGAGCUGCCGUUAUA), oligo 08 (GAGAGGAGCCAUUUAUUGA).
Ataxin-3 depletion in mice
All studies and procedures were performed with project licences granted by the UK Home Office and with the approval of the University of Cambridge committee for animal studies. C57BL/6J mice (Jackson Laboratories) were depleted of ataxin-3 in the liver using the ThermoFisher Invivofectamine 3.0 system. The siRNA duplex solution was prepared and diluted to 2.4 mg/ml according to the manufacturer’s instructions. Preparation of the final injection solution was also in accordance with the Thermofisher protocol. Briefly, siRNA (Control/scrambled siRNA #4457289; ataxin-3 siRNA #4457308) was mixed with the complexation buffer and then the Invivfectamine 3.0 reagent (#IVF3005, ThermoFisher). The ataxin-3 siRNA was an Ambion pre-designed sequence: Sense (5-3): GCAUCGACCAAAACUUAUUtt; Antisense (5-3): AAUAAGUUUUGGUCGAUGCat. The solution was vortexed, incubated at 50°C for 30 minutes and then diluted in PBS. The solution was stored at 4°C and later up to 200 µl was injected in the lateral caudal vein at a final concentration of 1 mg/kg. Mice were monitored for any adverse side effects briefly after injection with none observed. Mice used were female, weighing approximately 20 grams at the age of 6 weeks. Mice were randomly selected for injection with control or targeting siRNA and were matched by weight. The knockdown was left for 5 days. In the 4th day, the mice fasted and were deprived of food for a total period of 24 hr with free access to water throughout the procedure. Livers from these mice were dissected, homogenised and resuspended in tissue lysis buffer on ice (50mM Tris pH 7.4, 0.5% Triton X-100 and protease inhibitor cocktail) and the supernatant was centrifuged twice. Proteins were resolved in SDS-page for further analysis. The same control was loaded on each gel and the samples were normalised to that same control on the same gel allowing the comparison between multiple samples. The animal experiments did not involve behavioural testing but focussed on biochemistry, thus the samples were not blinded at this stage as we wanted to be able to load the gels in a suitable order.
Food deprivation in HD mice
We used HD-N171-82Q mice (B6C3F1/J-Tg(HD82Gln)81 Dbo/J, Jackson Laboratory, Bar Harbour, ME, USA). These mice carry an N-terminal fragment expressing the first 171 amino acids of human huntingtin with 82 glutamine repeats under the mouse prion promotor 34. The HD transgenic mice and non-transgenic littermates were males and females at the age of 6 weeks in the study. The mice fasted and were deprived of food for a total period of 48 hr with free access to water throughout the procedure. After 22.5 hr starvation, mice were given free access to food 1.5 hr followed by a second round of starvation for another 22.5 hr. At the end of this period, the mice were sacrificed by a schedule 1 method. The brain was collected and frozen for western blot analysis. The mice were weighed at every stage of this experiment in order to monitor weight loss. Half brain samples from starved and fed mice were dissected, homogenised and resuspended in tissue lysis buffer on ice (50mM Tris pH 7.4, 0.5% Triton X-100 and protease inhibitor cocktail) and the supernatant was centrifuged twice. Proteins were resolved in SDS-page for further analysis.
Immunohistochemistry
Thirty micrometer sections of brains derived from HD transgenic young and adult mice (6 and 12 weeks old, respectively) were analysed for neuronal aggregates according to the protocol in ref 35. Sections were labelled with anti-huntingtin antibody (clone mEM48, Chemicon, # MAB5374) by free-floating immunohistochemistry. Staining was performed by peroxidase labelling using Vectastain Avidin:Biotinylated enzyme complex (ABC) kit and visualized with DAB reagent (Vector Laboratories). Aggregates were counted in the motor cortex in three fields on at least three sections per animal at a magnification of ×100 (Zeiss Axioskop2, field diameter 0.2 mm) and analysed for the average of aggregates in brains from young and adult HD transgenic mice. The observer was blinded to the identity of the samples.
Analysis of patient cells
Primary fibroblasts from 9 controls and 13 mutant polyQ patients were grown at 37°C in DMEM medium supplemented with 10% FBS, 100 U ml–1 penicillin/streptomycin, GlutaMAX™ 1:100 (#35050061, ThermoFisher) and 1 mM sodium pyruvate (basal media), under 5% CO2. In some experiments, cells were starved in Hanks balanced salt solution (HBSS) media for 4 hr or treated for 4 h with 400 nM BafA1. The following patient fibroblasts were obtained from Coriell Biorepository, Coriell Institute for Medical Research: Huntington’s disease (HD) (GM04285, GM04287, GM04476, GM04867), Dentatorubral-pallidoluysian atrophy (DRPLA) (GM13716, GM13717), Spinocerebellar ataxia type 3 (SCA3) (GM06151, GM06153), Spinocerebellar ataxia type 7 (SCA7) (GM03561). The following patient fibroblasts were kindly provided by Ferdinando Squitieri. A program to collect biological specimen at Mendel Institute of Human Genetics for research purposes, including skin biopsies to derive fibroblast cell lines, was approved by the Ethical Committee from Casa Sollievo della Sofferenza Foundation, section of Istituto Tumori Giovanni Paolo II in Bari. Informed consents were obtained from healthy control subjects and from a DRPLA patient (AT2140102), HD patients (HD 940-01, HD960-01) as well as from the legal representative of the other HD patient (HD305-01). See Supplementary Table 2 for a list of patient fibroblasts, their catalogue numbers and the matching reference numbers in the paper.
Isolation and culture of primary cortical neurons
Primary cortical neurons were isolated from C57BL/6 mice (Jackson Laboratories) embryos at E16.5 as previously described32. Briefly, embryo brains were harvested and placed in PBS/glucose where the meninges were removed and the cerebral cortices were dissected. After mechanical dissociation using sterile micropipette tips, dissociated neurons were resuspended in PBS/glucose and collected by centrifugation. Viable cells were seeded on poly-ornithine-coated 12-multiwell plates. Cells were cultured in Neurobasal medium supplemented with 2 mM glutamine, 200 mM B27 supplement and 1% Penicillin-Streptomycin at 37°C in a humidified incubator with 5% CO2. One half of the culture medium was changed every two days until treatment/infection. After 5 days of ex vivo culturing, differentiated neurons were infected with lentiviral particles.
Lentivirus production and infection
shRNA lentiviral particles were produced and transduced following The RNAi Consortium (TRC) protocols. shRNA containing pLKO.1 vectors targeting mouse ataxin-3 were obtained from The RNAi Consortium (TRCN0000123959 and TRCN0000123961). Scramble shRNA was a gift from David Sabatini (Addgene plasmid # 1864) 36. Briefly, HEK-293T packaging cells growing in 10 cm dishes were transfected with a mix of 2.5 µg packaging vector (psPAX2), 270 ng envelope vector (pMD2.G) and 2.7 µg hairpin-pLKO.1 vector. TransIT-LT1 (Mirus) was used as transfection reagent. After transfection, cells were cultured in high-serum medium. Cell culture medium was harvested 40 hours later and replaced by high-serum medium; this step was repeated 2-3 times for intervals of 24 hours. Virus preps were then concentrated by centrifugation at 30,000 RPM for 90 minutes. Viral particles were added to primary cultured neurons and incubated overnight. 24 hours later, medium was replaced by full medium and cells were further incubated for 5 more days. For autophagy flux experiments, neurons were treated with 200 nM BafA1 in full media for 16 hr or starved in HBSS with 400 nM of BafA1 for 4 hr.
Western blot analysis
Cells were lysed in lysis buffer (20 mM Tris-HCl, pH 6.8, 137 mM NaCl, 1 mM EGTA, 1% Triton x100, 10% Glycerol and protease inhibitors cocktail) and protein samples were boiled in Laemmli buffer for 5–7 min at 100°C, separated by SDS-PAGE, transferred onto PVDF membranes, subjected to western blot analysis, and visualized using an ECL enhanced chemiluminescence detection kit (GE Healthcare), or with direct infrared fluorescence detection on an Odyssey Infrared Imaging System.
Immunoprecipitation and ubiquitination assays
Cells were lysed with IP buffer (20mM Tris-HCl, pH 7.2, 150mM NaCl, 2 mM MgCl2, 0.5% NP-40 and protease inhibitors cocktail). For ubiquitination experiments, cells were treated with a proteasome inhibitor MG132 (10 µM) in the last 6 hr before lysis with the IP buffer supplemented with 1mM PMSF and 10 mM iodoacetamide. Whole cell lysates obtained by centrifugation were incubated with 2-5 µg of antibody overnight at 4°C followed by 2 h incubation with protein A sepharose beads (GE Healthcare). The immunocomplexes were then washed with IP buffer for three times and separated by SDS–PAGE for further western blotting assay.
In-vitro deubiquitination assay
Ubiquitinated beclin 1 was purified from HeLa cells transfected with expression vectors for HA-Ub and FLAG beclin 1 for 24 hr as previously described37. In the last 6 hr the cells were treated with a proteasome inhibitor MG132 (10 µM) and a 10 µM cell-permeable, non-selective DUB inhibitor PR616 (#ab144641, Abcam). Ubiquitinated beclin 1 was purified from cell lysates with anti-FLAG-affinity beads (Sigma, #A2220) in FLAG lysis buffer (20 mM Tris-HCl, pH 6.8, 137 mM NaCl, 1 mM EGTA, 1% Triton x100, 1mM DTT, 10% Glycerol and protease inhibitors cocktail). After washing with the FLAG-lysis buffer, the proteins were eluted with 3X FLAG Peptides (#F4799, Sigma). Recombinant ataxin-3 Q22 and FLAG ataxin-3 Q22 C14A were expressed in HeLa cells and purified using FLAG affinity beads and eluted with 3X FLAG Peptides. In the in-vitro deubiquitination assay, ubiquitinated beclin 1 was incubated with recombinant ataxin-3 in the deubiquitination buffer (50 mM Tris-HCl (pH 8.8), 50mM NaCl, 5% glycerol, 10mM DTT, 1mM EDTA) at 37°C.
Fluorescence microscopy
The cells were grown on coverslips and were fixed in 4% paraformaldehyde (for LC3-GFP) or methanol (for endogenous LC3, 1:150 Novus Biologicals) for 5 min and then permeabilized with 0.1% Triton. For blocking and primary and secondary antibodies 1% BSA in PBS was used. The staining of PI3P was performed as described in ref 38. Briefly, cells were fixed in 2% paraformaldehyde and permeabilized with 20 μM digitonin in buffer A (20 mM Pipes pH 6.8, 137 mM NaCl, 2.7 mM KCl). Then cells were blocked with buffer A supplemented with 5% (v/v) FBS and 50 mM NH4Cl. Anti-PI3P antibodies from Echelon (for 1 h, 1:300) and secondary antibodies were applied in buffer A with 5% FBS. Cells underwent post-fixation for 5 min in 2% paraformaldehyde, washed with PBS containing 50 mM NH4Cl, washed once with water and then mounted with Mowiol. For WIPI2 staining, cells were grown on coverslips at 60% confluency and were incubated in EBSS for 1h. Then cells in 1ml EBSS were fixed by the addition of 1 ml 4% paraformaldehyde to a final concentration of 2% and incubated for 10 min at room temperature and then cells were permeabilized with 0.1% Triton. 1% BSA PBS solution was used for blocking before adding primary antibody (mouse anti-WIPI2, 1:100 Abcam #ab105459). A Zeiss LSM880 confocal microscope was utilised for fluorescent confocal analysis. All confocal images were taken with a 63X oil-immersion lens. Microscopy assays (e.g. dot quantification) were performed by selecting fields based on nuclear and GFP staining (with the channel for the dots turned off) - thus the operator was blinded to the outcome of the experiment when selecting suitably similar fields to image for subsequent computerised analysis. ImageJ was used for the analysis (number of vesicles/dots). For the analysis of WIPI2 dots that involved different cell lines in different conditions, we used a custom-designed image-processing pipeline in ImageJ. First, an estimation of the cytoplasmic area was made by simultaneously expanding an area from each nuclear centroid, until a neighbouring expansion is detected. The resulting mask represents individual cells and was subsequently used to identify WIPI2 dots. Identification of the dots started by reducing cytoplasmic background signal through application of a Gaussian convolution filter. The resulting image is then binarized according to the Chow and Kaneko adaptive thresholding method. Subsequently, connected or clustered dots are separated using a classic watershed segmentation algorithm. Consecutive quantification and feature extraction is then performed on all dots that meet set size parameters. Automated microscope counting of autolysosomes labelled with a pH-sensitive mTagRFP-mWasabi-LC3 was carried out using a Thermo Scientific Cellomics ArrayScan VTI HCS reader and the Spot Detector Bioapplication protocol, as described20. About 800 cells per condition were analysed.
Addition of exogenous PI3P to cells
PI3P di-C16 and carrier (Echelon) were reconstituted in H2O:tert-BuOH (9:1) solution. After 1 min bath sonication, carrier and PI3P di-C16 were combined at a 1:1 ratio for 10 min at room temperature. The mixture of PI3P di-C16 and carrier was diluted in media and used for 1-2 hr incubations on cells. The final concentration used was 1 μM. For the negative control, DMEM was combined with carrier only and added to the cells.
Mass Spectrometry
HeLa cells were transfected with FLAG beclin 1 and HA-Ub for 24 hr, treated in the last 6 hr with proteasome inhibitor (MG132 10 µM) and FLAG beclin 1 was immunoprecipitated for identification of putative sites of ubiquitination using mass spectrometry. Samples were resolved into a pre-cast 4-12% Bis-Tris polyacrylamide gel (Novex, Thermo Fisher Scientific). The lanes were excised and cut in 3 approximately equal chunks and the proteins reduced, alkylated and digested in-gel. The resulting tryptic peptides analysed by LC-MSMS using a Q Exactive coupled to an RSLCnano3000 (Thermo Scientific). Raw files were processed in Proteome Discoverer 1.4 using Sequest to search a human Uniprot database (downloaded 03/06/14, 20176 entries). GlyGly (K) was set as a variable modification and carbamidomethyl (C) as a fixed modification. Peptides were filtered to high confidence (0.01 FDR) using Percolator.
Structural analysis of polyQ binding to beclin 1
Glide software (Schrödinger, LLC) was used for studying potential ligand (polyQ7 stretch)-receptor (human beclin 1 ECD; pdb 4DDP, ref 39) interactions. Protein and ligand preparation were firstly performed, followed by generation of possible ligand binding sites using site-map. A receptor grid was then generated for each of the putative binding sites and standard precision peptide (SP-peptide) docking was performed. Although several potential binding sites were found, docking scores for two of the sites were substantially higher than for the others. It should be noted that that binding-sites surrounding the N-terminal helix of beclin 1 ECD (pdb 4DDP) were not considered, as yeast Vps30-BARA domain structure (pdb 5DFZ, ref 40) shows this helix is likely to be out of place, being part of the coiled-coil domain (CCD) of beclin 1. Docking poses from the best sites were used to generate figures. Visualization and generation of graphic illustrations of the molecular models was performed using PyMOL (http://www.pymol.org).
Statistics
Statistical analysis was done using Microsoft Excel and GraphPad Prism v5. For ANOVA analysis involving multiple sample comparisons, post testing was performed to discriminate significance relationships. For t-test analysis, one-tailed test were performed for independent samples, as indicated in the figure legends. Errors bars shown in the figures are standard deviation (s.d) or standard error (s.e.m). Sample sizes were chosen based on extensive experience with the assays we have performed. The experiments were appropriately randomized.
Data availability
Gel source data are provided in Supplementary Fig. 1. Other source data and reagents can be provided by the authors upon reasonable request. Beclin 1 structures were from Protein Data Bank (pdb 4DDP, pdb 5DFZ). Beclin 1 protein sequences were from UniProt (human Q14457, mouse O88597, Zebrafish A2A135).
Extended Data
Extended Data Figure 1. Ataxin-3 contributes to autophagosome formation.
a, Primary cultures of mouse cortical neurons were transduced with control or ataxin-3 lentiviral shRNAs and analysed for the levels of LC3-I under starvation condition (HBSS, 4 hr) or together with BafA1 (400 nM, 4 hr). Results are normalised to control cells (HBSS+BafA1). Mean ± s.e.m, n=5 replicates from two independent cultures. Two-way ANOVA (N.S not significant). b, HeLa cells were transfected with different ataxin-3 siRNA and scrambled siRNA used as a control. Ataxin-3 knockdown (KD) efficiency is presented as well as basal LC3-II levels. LC3-II levels in ataxin-3-depleted HeLa cells were normalised to control cells, n=4 independent experiments. One-way ANOVA (** P<0.01) with post-hoc Tukey’s test (* P<0.05, ** P<0.01). c, p62 levels in HeLa cells depleted of ataxin-3 by siRNA. p62 levels were normalised to control cells (n=4 independent experiments, ** P<0.01 one-tailed paired t-test). d, HeLa cells stably expressing mTagRFP-mWasabi-LC3 reporter were transfected with either scrambled or ataxin-3 siRNA and were analysed by the ThermoFisher cellomics system for assessing the number of autophagosomes and autolysosomes in the cells. Results are mean number of autophagosomes or autolysosomes per cell ± s.e.m in eight fields from a representative experiment out of three independent experiments (* P<0.05, ** P<0.01 one-tailed unpaired t-test). Representative images of the cells were taken by confocal microscopy (total 800 cells). Scale bar is 10 µm. e, Control and ataxin-3 KD HeLa cells were starved (HBSS, 4 hr) or kept in full media. The number of PI3P phospholipid dots were analysed by staining with anti-PI3P antibody. Results are mean dots per cell ± s.d from a representative experiment out of three independent experiments as well as representative confocal images of PI3P dots (red) for each condition (n=20 cells). Scale bar is 10 µm. Two-way ANOVA (column factor siRNA *** P<0.001, row factor starvation ** P<0.01, interaction P value * P<0.05) with Bonferroni’s post-test (** P<0.01, N.S, not significant).
Extended Data Figure 2. Ataxin-3 regulates starvation-induced autophagy.
a-b, HeLa cells stably expressing GFP-LC3 were treated with control siRNA or ataxin-3 siRNA and incubated for 1 hr with carrier alone or carrier with 1 µM of PI3P phospholipid. Then, the control cells and the ataxin-3 KD cells with the different treatments were shifted to starvation condition (HBSS, 4 hr) or kept in full-media. a, The number of LC3 dots was analysed for each of the conditions and presented as mean LC3 dots per cell ± s.e.m. S.e.m. was determined from n=5 fields from a single representative experiment out of three independent experiments. Two-way ANOVA (column factor siRNA *** P<0.001, row factor starvation * P<0.05, interaction P value N.S) with Bonferroni’s post-test: for basal condition: N.S, for starvation: *** P<0.001. b, Representative confocal images of LC3 dots (green) from the different treatments are presented for the starvation condition. For a and b, the total number of cells analysed in basal control n=25; basal KD, basal KD carrier, basal KD carrier PI3P, n=30; HBSS control n=34; HBSS KD, HBSS KD carrier PI3P n=37; HBSS KD carrier n=32. Scale bar is 10 µm. c, Number of endogenous PI3P effector, WIPI2 dots in HeLa cells that were transfected with FLAG ataxin-3 or empty vector and starved (EBSS, 1hr) with or without the PI3P inhibitor Wortmannin (Wm, 20 nM). Data are presented as means ± s.e.m. of the number of WIPI2 dots per cell. S.e.m. was determined based on the total number of cells analysed using software described in methods from a representative experiment out of two independent experiments. Confocal images of WIPI2 dots (green) from the different treatments are shown. Number of cells analysed and used for the s.e.m. in Empty FLAG n=47; FLAG ataxin-3 n=45; FLAG ataxin-3/Wm n=37. Scale bar is 10 µm. One-way ANOVA (*** P<0.001) with post-hoc Tukey’s test (*** P<0.001). d-f, Mice were depleted of ataxin-3 in the liver by injection of ataxin-3 siRNA or control/scrambled siRNA formulations in the lateral caudal vein. The knockdown was left for 5 days with fasting on the 4th day. Livers from these mice were dissected, homogenised and proteins were resolved by SDS-page. d, Representative blots are shown, as well as in-vivo ataxin-3 knockdown efficiency. For the quantification of beclin 1 and LC3-II, see Fig. 1d,e. e, Quantification of p62 levels and f, Quantification of LC3-I levels in each group of mice (control fed n=9, ataxin-3 KD fed n=6, control fasted n=8, ataxin-3 KD fasted n=6, a.u arbitrary units). For e, two-way ANOVA (column factor siRNA * P<0.05, row factor fasting * P<0.05, interaction ** P<0.05) with Bonferroni’s post-test (** P<0.01, N.S). For f, two-way ANOVA (column factor siRNA P value N.S, row factor starvation * P<0.05, interaction P value N.S) with Bonferroni’s post-test (N.S). This suggests no obvious difference in LC3-I levels between the control and ataxin-3 KD groups.
Extended Data Figure 3. Ataxin-3 regulates beclin 1 stability and ubiquitination.
a, Beclin 1 levels in control siRNA-treated HeLa cells and ataxin-3 KD cells (t=0) and after cycloheximide (CHX, 50 µg/ml) treatment (t=8 hr). The percentage of beclin 1 degradation in control or ataxin-3 KD cells was compared and normalised to cells without CHX treatment (n=3 independent experiments, * P<0.05 one-tailed paired t-test). b, Beclin 1 levels in control siRNA-treated HeLa cells and ataxin-3 KD cells that were treated in the last 6 hr with proteasome inhibitor (MG132, 5 µM). n=3 independent experiments, one-way ANOVA (** P<0.01) with post-hoc Tukey’s test (*P<0.05, N.S, not significant). c, Beclin 1 levels in ataxin-3-depleted HeLa cells that were transfected with FLAG ataxin-3 wild-type (WT) or protease dead mutant, FLAG ataxin-3 C14A for 48hr. Results are normalised to control siRNA, n=3 independent experiments, one-way ANOVA (** P<0.01) with post-hoc Tukey’s test (** P<0.01). d, Control siRNA-treated and ataxin-3 siRNA-treated HeLa cells were transfected with the indicated vectors for 24 hr, treated in the last 6 hr with proteasome inhibitor (MG132, 10 µM) and endogenous beclin 1 was immunoprecipitated to detect beclin 1 ubiquitination. e, VPS34 levels in ataxin-3-depleted HeLa cells normalised to control siRNA, n=3 independent experiments, ** P<0.01 one-tailed paired t-test. f, HeLa cells were transfected with the indicated vectors for 24 hr, treated in the last 6 hr with proteasome inhibitor (MG132, 10 µM) and VPS34 was immunoprecipitated to detect VPS34 ubiquitination. The levels of the VPS34 components are co-ordinately regulated, and indeed decreased beclin 1 levels in ataxin-3-depleted cells were accompanied by decreased levels of VPS34. Still, no obvious change in VPS34 ubiquitination was observed in ataxin-3 over-expressing cells supporting a selective effect towards beclin 1. g, FLAG ataxin-3 WT and FLAG ataxin-3 C14A were co-expressed with GFP HTT exon 1 Q74 in HeLa cells for 48 hr. The number of aggregates was analysed by monitoring GFP fluorescence in 400 cells.. n=4 independent experiments. Results are normalised to control (empty vector). One-way ANOVA (** P<0.01) with post-hoc Tukey’s test (* P<0.05, N.S, not significant).
Extended Data Figure 4. Analysis of the beclin 1 lysine 402 modification.
a-b, HeLa cells were transfected with FLAG beclin 1 and HA-Ub for 24 hr, treated in the last 6 hr with proteasome inhibitor (MG132, 10 µM) and FLAG beclin 1 was immunoprecipitated for mass spectrometry analysis. Tryptic digests of ubiquitin-conjugated beclin 1 resulted in peptides that contain a ubiquitin remnant derived from the ubiquitin C-terminus (‘GG’ motif). a, Identification of a putative site of ubiquitination in beclin 1. Panel 1 shows the MSMS spectrum of the unmodified beclin 1 peptide spanning residues 401 to 416. Amino acids with corresponding y ions are shown in blue. Panel 2 shows the MSMS spectrum of an ion with a mass 114 Da greater than the unmodified peptide. The matching y ions and presence of a modified b2 ion indicate –GG modification of lysine 402. b, MSMS spectra filtered to high confidence covered 100% of the ubiquitin sequence. Tryptic peptide spanning residue 43 to 54 including lysine 48 was identified as the sole high confidence peptide with a modification corresponding to a –GG motif and the MSMS spectra of the peptide demonstrates fragments corresponding to a –GG modified lysine 48. c, Levels of FLAG beclin 1 and FLAG beclin 1 K402R in HeLa cells that were treated in the last 6 hr with proteasome inhibitor (MG132, 10 µM). Results are normalised to control (FLAG beclin 1 WT). n=3 replicates from two independent experiments. Two-way ANOVA (column factor K402R N.S, row factor MG132 *** P<0.001, interaction * P<0.05) with Bonferroni’s post-test (* P<0.05, N.S). d, HeLa cells were transfected with the indicated vectors for 24 hr and shifted in the last 4 hr to starvation media (HBSS). Beclin 1 and LC3-II levels were analysed and results are normalised to control (FLAG beclin 1 WT). For LC3-II levels, n=3 independent experiments, two-way ANOVA (column factor ataxin-3 * P<0.05, row factor K402R mutation ** P<0.01, interaction ** P<0.01) with Bonferroni’s post-test (*** P<0.001, N.S). For beclin 1 levels, n=4 independent experiments, two-way ANOVA (column factor ataxin-3 * P<0.05, row factor K402R mutation *** P<0.001, interaction P value N.S) with Bonferroni’s post-test (* P<0.05, N.S).
Extended Data Figure 5. Analysis of the interaction of the polyQ domain with beclin 1.
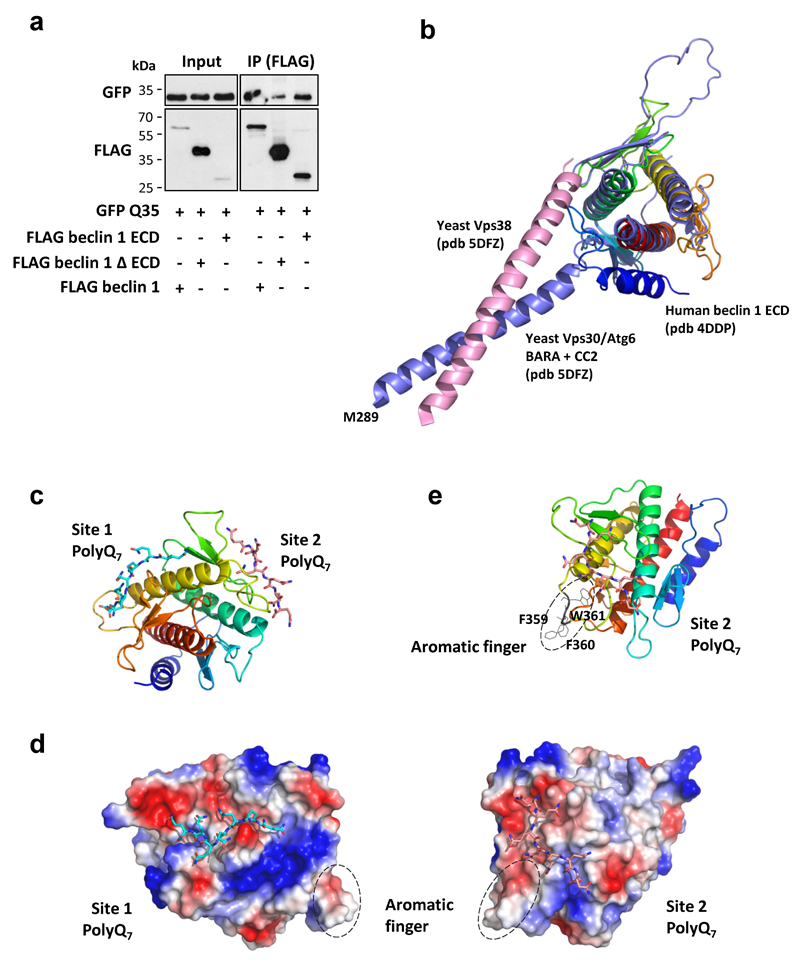
a, Empty FLAG, FLAG beclin 1 evolutionary conserved domain (ECD) alone, FLAG beclin 1 ΔECD, FLAG beclin 1 full length and GFP Q35 were transfected in HeLa cells for 24 hr and the cell lysates were immunoprecipitated with anti-FLAG antibody. Immunocomplexes were analysed using anti-GFP antibody. b, Superimposition of human beclin 1 ECD (pdb 4DDP) and Vps30 (pdb 5DFZ), the yeast orthologue of beclin 1. Structures reveal that the N-terminal helix (dark blue helix) of the human structure is displaced, most likely due to protein truncation for crystallographic purposes. The yeast structure suggests that this helix is part of the coiled-coil CC2 of beclin 1 instead of the ECD. c, Two binding-sites in human beclin 1 ECD reveal high docking scores for polyQ7 (the docking scores for site 1 and site 2 are -10.394 and -10.721, respectively). Sites comprising the region adjacent to the N-terminal helix (dark blue) were not considered for the docking. d-e, Surface charge illustrations of human beclin 1 ECD with the two sites of polyQ interaction. Site 2 is in close proximity to a protruding hydrophobic loop (aromatic finger) composed by Phe359, Phe360 and Trp361 (top right e - cartoon view), which are thought to be implicated in beclin 1 anchorage to lipid membranes.
Extended Data Figure 6. Expression of polyQ tracts impairs beclin 1-dependent starvation-induced autophagy.
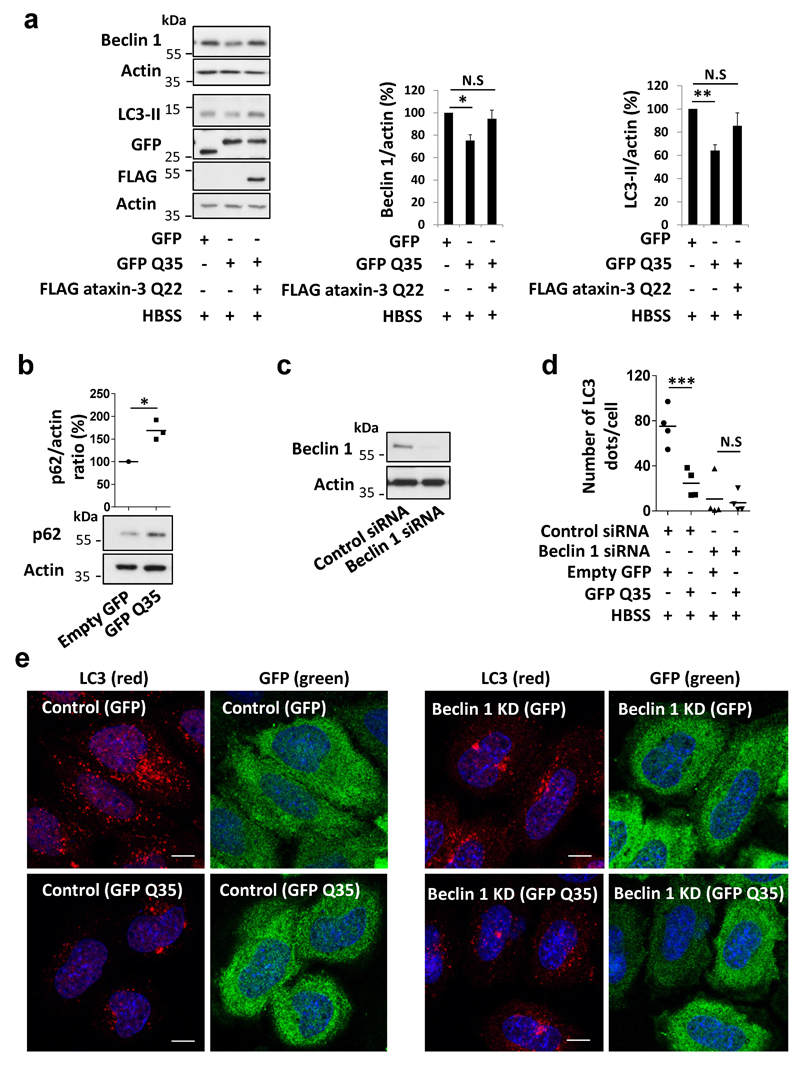
a, HeLa cells were transfected with empty GFP or GFP Q35 with or without FLAG ataxin-3 Q22 for 24 hr and were shifted to starvation condition (HBSS) in the last 4 hr. LC3-II and beclin 1 levels were analysed from the cell lysates. Results are mean ± s.e.m normalised to control (empty GFP), n=5 independent experiments, One-way ANOVA (for LC3-II ** P<0.01, for beclin 1 * P<0.05) with post-hoc Tukey’s test (* P<0.05, ** P<0.01, N.S, not significant). b, HeLa cells were transfected with empty GFP or GFP Q35 for 24 hr and were shifted to starvation condition (HBSS) in the last 4 hr. p62 levels were than analysed from the lysates. Results are normalised to control (empty GFP), n=3 independent experiments, * P<0.05 one-tailed paired t-test. c, HeLa cells were treated with 20 nM beclin 1 siRNA or scrambled siRNA (control) for 3 days. Beclin 1 KD efficiency is presented. d-e, Control and beclin 1 KD HeLa cells were transfected with empty GFP or GFP Q35 for 24 hr and were shifted to starvation condition (HBSS) in the last 4 hr. The number of endogenous LC3 dots (red) was analysed in the GFP-expressing cells (green). Results are mean number of LC3 dots per cell in four fields from a representative experiment out of three independent experiments, as well as confocal images for each condition (number of cells analysed in control GFP n=32, control GFP Q35 n=27, beclin 1 KD GFP n=25, beclin 1 KD GFP Q35 n=23). Scale bar is 10 µm. Two-way ANOVA (column factor GFP Q35 ** P<0.01, row factor beclin 1 KD *** P<0.001, interaction ** P<0.01) with Bonferroni’s post-test (*** P<0.001, N.S).
Extended Data Figure 7. Impaired starvation-induced autophagy and reduced beclin 1 levels in cells expressing expanded polyQ forms of huntingtin.
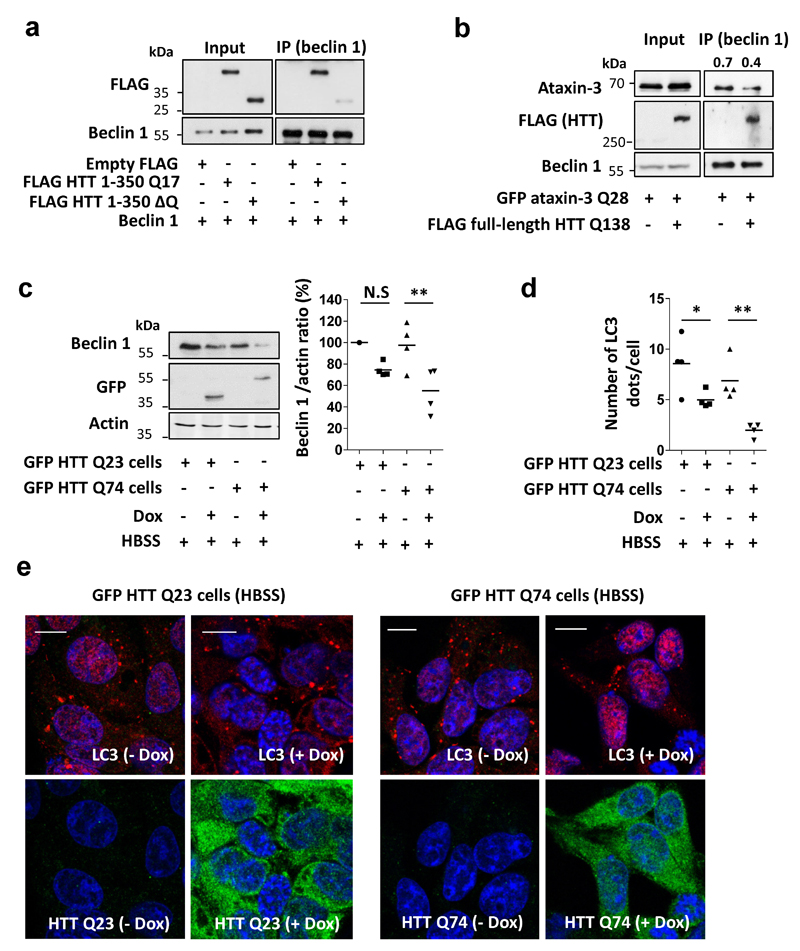
a, Empty FLAG, FLAG huntingtin (HTT) N-terminal fragment (1-350) Q17, FLAG HTT (1-350) ΔQ and beclin 1 were transfected in HeLa cells for 24 hr and cell lysates were immunoprecipitated with anti-beclin 1 antibody. Immunocomplexes were analysed using anti-FLAG antibody. b, GFP ataxin-3 Q28 and FLAG full-length HTT Q138 were transfected in HeLa cells for 24 hr and endogenous beclin 1 was immunoprecipitated. Immunocomplexes were analysed using anti-ataxin-3 antibody (detect GFP-ataxin-3) and anti-FLAG antibody (detect HTT). The ratio of the bound ataxin-3 to beclin 1 is presented. c, stable-inducible HEK293 cells were switched on for 48 hr with doxycycline (Dox) to express GFP-HTT wild-type exon 1 (GFP-HTT Q23) or mutant GFP HTT exon 1 (GFP-HTT Q74). In the last 4 hr cells were starved (HBSS) and beclin 1 levels were analysed in each cell type. Results are normalised to control HTT Q23 cells no Dox (n=4 independent experiments). Two-way ANOVA (column factor Dox ** P<0.01, row factor HEK cells N.S, interaction P value N.S) with Bonferroni’s post-test (** P<0.01, N.S). d-e, Quantification of the number of LC3 dots in the starved cells. Results are mean dots per cell in four fields of a representative experiment out of three independent experiments. Representative confocal images of endogenous LC3 dots (red) and GFP-HTT (green) in each of the conditions (number of cells analysed in GFP-HTT Q23 no Dox n=41; GFP-HTT Q23 with Dox n=34; GFP-HTT Q74 no Dox n=39; GFP-HTT Q74 with Dox n=43). Scale bar is 10 µm.. Two-way ANOVA (column factor Dox *** P<0.001, row factor HEK cells * P<0.05, interaction P value N.S) with Bonferroni’s post-test (*P<0.05, ** P<0.01).
Extended Data Figure 8. Impaired starvation-induced autophagy in striatal cell lines and in brain derived from mouse models of Huntington’s disease.
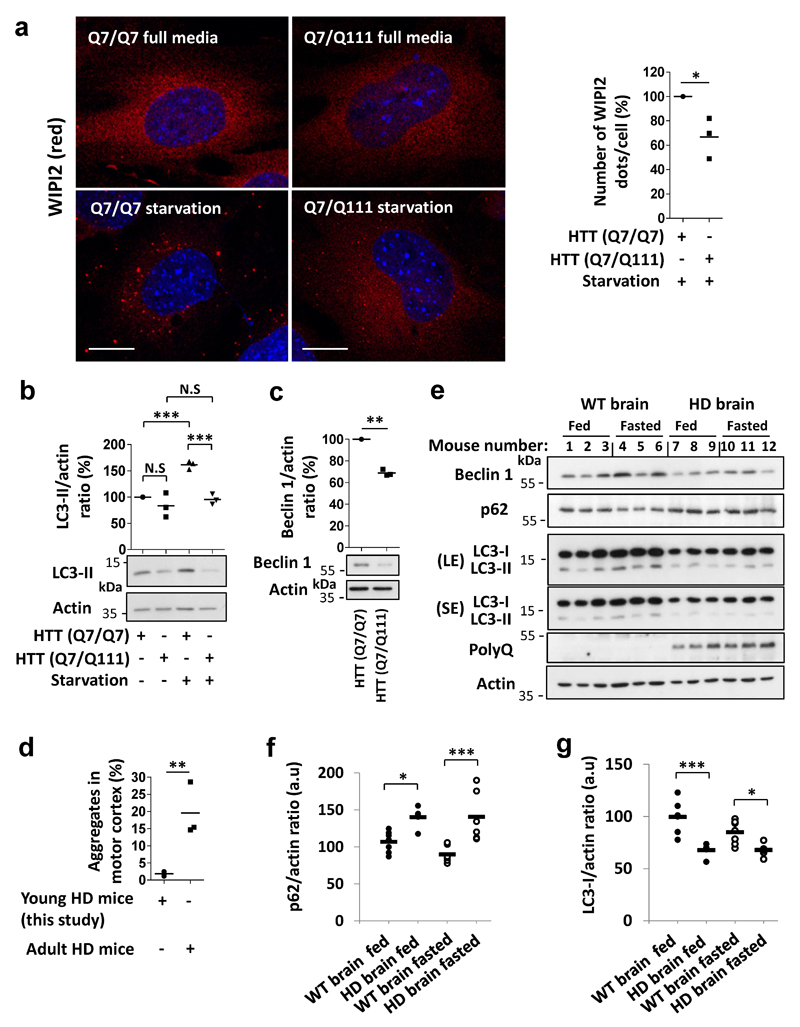
a, Striatal cell lines derived from HTT (Q7/Q111) heterozygous knock-in mouse and HTT (Q7/Q7) “wild-type” knock-in mouse were kept in full media or starved (EBSS, 1hr). In each experiment, cells were analysed for WIPI2 dots in different condition. We could not detect WIPI2 dots in full media in these cells as dots became apparent after starvation-induced autophagy. The number of WIPI2 dots per cell is presented normalised to control HTT (Q7/Q7) cells. n=3 independent experiments, * P<0.05 one-tailed paired t-test. Representative confocal images of WIPI2 (red) in each of the conditions are presented (n=80 cells analysed). Scale bar is 10 µm. b, HTT (Q7/Q111) and HTT (Q7/Q7) striatal cells were treated with bafA1 (400 nM) in full media or starved with HBSS together with bafA1 (400 nM) for 4 hr and analysed for LC3-II levels. Results are normalised to control (HTT (Q7/Q7) in full media). n=3 independent experiments, two-way ANOVA (column factor mut HTT *** P<0.001, row factor starvation ** P<0.01, interaction ** P<0.01) with Bonferroni’s post-test (*** P<0.001, N.S, not significant). c, beclin 1 levels in the starved HTT (Q7/Q111) and HTT (Q7/Q7) striatal cells. Results are normalised to control HTT (Q7/Q7) cells. n=3 independent experiments. ** P<0.01 one-tailed paired t-test. d, Sections of brains from Huntington’s disease (HD) HD-N171-N82Q transgenic young and adult mice (6 and 12 weeks old, respectively) were analysed for neuronal aggregates in the motor cortex. For each brain, 400 cells were counted in at least three sections. Results are mean percentage of cells with aggregates from three brains, ** P<0.01 one-tailed unpaired t-test. e, Young wild-type (WT) mice and HD transgenic mice were fed or fasted. Brains from these mice were dissected, homogenised and proteins were resolved by SDS-page for analysing the levels of endogenous beclin 1, LC3-I, LC3-II and p62 in each group. PolyQ levels were analysed using anti-polyQ antibody showing the expression level of the polyQ HTT exon 1. Representative blots are shown that were used to generate the data in Fig 4 c,d. f-g, Quantification of p62 and LC3-I levels in each group (WT fed n=7, HD fed n=5, WT fasted n=7, HD fasted n=6, a.u arbitrary units). For LC3-I levels, two-way ANOVA (column factor HD *** P<0.001, row factor fasting N.S, interaction P value N.S) with Bonferroni’s post-test (* P<0.05, *** P<0.001). For p62 levels, two-way ANOVA (column factor HD *** P<0.001, row factor fasting N.S, interaction P value N.S) with Bonferroni’s post-test (* P<0.05, *** P<0.001).
Extended Data Figure 9. Expansion of the polyQ domain in ataxin-3 decreased deubiquitinase activity and increased its interaction with beclin 1.
a, Beclin 1 was purified from proteasome inhibitor-treated cells that co-expressed HA-Ub and was incubated in-vitro with recombinant ataxin-3 Q22 or ataxin-3 Q80 for 30 min in deubiquitination buffer and samples were analysed for beclin 1 ubiquitination using anti-HA antibodies. b, Number of LC3 dots in ataxin-3 KD HeLa cells that were transfected with GFP ataxin-3 Q28, GFP ataxin-3 Q84 and GFP ataxin-3 ΔQ and starved with HBSS in the last 4 hr. Results are normalised to control siRNA-treated cells from n=4 independent experiments. One-way ANOVA (*** P<0.001) with post-hoc Tukey’s test (** P<0.01, *** P<0.001, N.S, not significant). c, Representative confocal images are presented for each of the conditions from b (LC3 dots in red and ataxin-3 staining in green, n=20 cells analysed).Scale bar is 10 µm. d, HeLa cells were transfected with empty vector, FLAG ataxin-3 Q22, FLAG ataxin-3 Q80 and HA Ub for 24 hr, treated in the last 6 hr with proteasome inhibitor (MG132 10 µM). Endogenous beclin 1 was immunoprecipitated from the lysates for analysis of different polyUb linkage using K48 polyUb or K63 polyUb antibodies, and for detection of bound ataxin-3 using anti-ataxin-3 and anti-polyQ antibodies.
Extended Data Figure 10. Effect of different disease proteins with polyQ expansion on beclin 1 ubiquitination, beclin 1 levels and starvation-induced autophagy.
a, HeLa cells were transfected with empty vector, GFP atrophin-1 (ATN-1) Q19, GFP ATN-1 Q71 and HA Ub for 24 hr, treated in the last 6 hr with proteasome inhibitor (MG132 10 µM). Endogenous beclin 1 was immunoprecipitated from the lysates for ubiquitination analysis and for detection of bound ATN-1 using anti-ATN-1 antibody. b, HeLa cells were transfected with empty vector, HA androgen receptor (AR) Q25, HA AR Q120 and HA Ub for 24 hr, treated in the last 6 hr with proteasome inhibitor (MG132 10 µM). Endogenous beclin 1 was immunoprecipitated from the lysates for ubiquitination analysis and for detection of bound AR using anti-AR antibody. c, Primary fibroblasts derived from healthy controls (n=5) and from HD patients (n=7) were starved with HBSS together with bafA1 (400 nM) for 4 hr and analysed for LC3-II levels. Results are mean ± s.e.m. * P<0.05 one-tailed Mann Whitney test. d-f, Primary fibroblasts derived from healthy controls and from patients with different polyQ diseases were kept in full media or starved with HBSS for 4 hr and analysed for LC3-II levels (LC3-II/actin ratio is presented). d, Spinocerebellar ataxia type 3 (SCA3) samples. e, Dentatorubral-pallidoluysian atrophy (DRPLA) samples. f, HD samples. The BafA1 experiments for these sets of patients are presented in Fig. 4. g, Beclin 1 levels (beclin 1/actin ratio is presented) in the starved control cells vs. SCA3, SCA7, DRPLA and HD patient cells. We only had one SCA7 patient sample and thus we have not analysed it further.
Supplementary Material
Supplementary Information is available in the online version of the paper
Acknowledgements
We are grateful to Wellcome Trust (Principal Research Fellowship to D.C.R. (095317/Z/11/Z), Wellcome Trust Strategic Grant to Cambridge Institute for Medical Research (100140/Z/12/Z)), National Institute for Health Research Biomedical Research Centre at Addenbrooke’s Hospital, Addenbrooke’s Charitable Trust and Federation of European Biochemical Societies (FEBS Long-Term Fellowship to A.A.) for funding. We thank Robin Antrobus for the mass spectrometry analysis, Shouqing Luo for truncated HTT constructs, Maria Jimenez-Sanchez and Cansu Karabiyik for assistance with the primary mouse cell cultures, Janghoo Lim and Zoya Ignatova for reagents.
Footnotes
Author Contributions A.A., C.F.B. and D.C.R. developed the study rationale. A.A. and D.C.R. wrote the manuscript, which was commented on by all authors. A.A. designed and performed most of the experiments. C.F.B. analysed some patient cell lines and structural models. T.R. and Farah Siddiqi performed mouse experiments. M.V. and M.C.H. performed and analysed confocal experiments. M.P. assisted with data analysis. S.I. contributed preliminary data. Ferdinando Squitieri provided some control and patient samples. F.M.M. generated stable cell lines and constructs. D.C.R. supervised the study.
Author Information Reprints and permissions information is available at www.nature.com/reprints.
Potential competing financial interests: F.M.M. is currently an employee of Eli Lilly & Co. Ltd.
References
- 1.DiFiglia M, et al. Aggregation of huntingtin in neuronal intranuclear inclusions and dystrophic neurites in brain. Science. 1997;277:1990–1993. doi: 10.1126/science.277.5334.1990. [DOI] [PubMed] [Google Scholar]
- 2.Riess O, Rub U, Pastore A, Bauer P, Schols L. SCA3: neurological features, pathogenesis and animal models. Cerebellum. 2008;7:125–137. doi: 10.1007/s12311-008-0013-4. [DOI] [PubMed] [Google Scholar]
- 3.Imarisio S, et al. Huntington's disease: from pathology and genetics to potential therapies. The Biochemical journal. 2008;412:191–209. doi: 10.1042/BJ20071619. [DOI] [PubMed] [Google Scholar]
- 4.Sathasivam K, et al. Aberrant splicing of HTT generates the pathogenic exon 1 protein in Huntington disease. Proceedings of the National Academy of Sciences of the United States of America. 2013;110:2366–2370. doi: 10.1073/pnas.1221891110. [DOI] [PMC free article] [PubMed] [Google Scholar]
- 5.Rubinsztein DC. The roles of intracellular protein-degradation pathways in neurodegeneration. Nature. 2006;443:780–786. doi: 10.1038/nature05291. [DOI] [PubMed] [Google Scholar]
- 6.Arrasate M, Mitra S, Schweitzer ES, Segal MR, Finkbeiner S. Inclusion body formation reduces levels of mutant huntingtin and the risk of neuronal death. Nature. 2004;431:805–810. doi: 10.1038/nature02998. [DOI] [PubMed] [Google Scholar]
- 7.Chai Y, Berke SS, Cohen RE, Paulson HL. Poly-ubiquitin binding by the polyglutamine disease protein ataxin-3 links its normal function to protein surveillance pathways. The Journal of biological chemistry. 2004;279:3605–3611. doi: 10.1074/jbc.M310939200. [DOI] [PubMed] [Google Scholar]
- 8.Burnett B, Li F, Pittman RN. The polyglutamine neurodegenerative protein ataxin-3 binds polyubiquitylated proteins and has ubiquitin protease activity. Human molecular genetics. 2003;12:3195–3205. doi: 10.1093/hmg/ddg344. [DOI] [PubMed] [Google Scholar]
- 9.Paulson HL, et al. Machado-Joseph disease gene product is a cytoplasmic protein widely expressed in brain. Annals of neurology. 1997;41:453–462. doi: 10.1002/ana.410410408. [DOI] [PubMed] [Google Scholar]
- 10.Trottier Y, et al. Heterogeneous intracellular localization and expression of ataxin-3. Neurobiology of disease. 1998;5:335–347. doi: 10.1006/nbdi.1998.0208. [DOI] [PubMed] [Google Scholar]
- 11.Liang XH, et al. Induction of autophagy and inhibition of tumorigenesis by beclin 1. Nature. 1999;402:672–676. doi: 10.1038/45257. [DOI] [PubMed] [Google Scholar]
- 12.Ravikumar B, et al. Inhibition of mTOR induces autophagy and reduces toxicity of polyglutamine expansions in fly and mouse models of Huntington disease. Nature genetics. 2004;36:585–595. doi: 10.1038/ng1362. [DOI] [PubMed] [Google Scholar]
- 13.Menzies FM, et al. Autophagy induction reduces mutant ataxin-3 levels and toxicity in a mouse model of spinocerebellar ataxia type 3. Brain : a journal of neurology. 2010;133:93–104. doi: 10.1093/brain/awp292. [DOI] [PMC free article] [PubMed] [Google Scholar]
- 14.Kabeya Y, et al. LC3, a mammalian homologue of yeast Apg8p, is localized in autophagosome membranes after processing. The EMBO journal. 2000;19:5720–5728. doi: 10.1093/emboj/19.21.5720. [DOI] [PMC free article] [PubMed] [Google Scholar]
- 15.Xie Z, Klionsky DJ. Autophagosome formation: core machinery and adaptations. Nature cell biology. 2007;9:1102–1109. doi: 10.1038/ncb1007-1102. [DOI] [PubMed] [Google Scholar]
- 16.Weidberg H, Shvets E, Elazar Z. Biogenesis and cargo selectivity of autophagosomes. Annual review of biochemistry. 2011;80:125–156. doi: 10.1146/annurev-biochem-052709-094552. [DOI] [PubMed] [Google Scholar]
- 17.Tassa A, Roux MP, Attaix D, Bechet DM. Class III phosphoinositide 3-kinase--Beclin1 complex mediates the amino acid-dependent regulation of autophagy in C2C12 myotubes. The Biochemical journal. 2003;376:577–586. doi: 10.1042/BJ20030826. [DOI] [PMC free article] [PubMed] [Google Scholar]
- 18.He R, Peng J, Yuan P, Xu F, Wei W. Divergent roles of BECN1 in LC3 lipidation and autophagosomal function. Autophagy. 2015;11:740–747. doi: 10.1080/15548627.2015.1034404. [DOI] [PMC free article] [PubMed] [Google Scholar]
- 19.Dooley HC, et al. WIPI2 links LC3 conjugation with PI3P, autophagosome formation, and pathogen clearance by recruiting Atg12-5-16L1. Molecular cell. 2014;55:238–252. doi: 10.1016/j.molcel.2014.05.021. [DOI] [PMC free article] [PubMed] [Google Scholar]
- 20.Vicinanza M, et al. PI(5)P regulates autophagosome biogenesis. Molecular cell. 2015;57:219–234. doi: 10.1016/j.molcel.2014.12.007. [DOI] [PMC free article] [PubMed] [Google Scholar]
- 21.Kim W, et al. Systematic and quantitative assessment of the ubiquitin-modified proteome. Molecular cell. 2011;44:325–340. doi: 10.1016/j.molcel.2011.08.025. [DOI] [PMC free article] [PubMed] [Google Scholar]
- 22.Rui YN, et al. Huntingtin functions as a scaffold for selective macroautophagy. Nature cell biology. 2015;17:262–275. doi: 10.1038/ncb3101. [DOI] [PMC free article] [PubMed] [Google Scholar]
- 23.Shibata M, et al. Regulation of intracellular accumulation of mutant Huntingtin by Beclin 1. The Journal of biological chemistry. 2006;281:14474–14485. doi: 10.1074/jbc.M600364200. [DOI] [PubMed] [Google Scholar]
- 24.Trettel F, et al. Dominant phenotypes produced by the HD mutation in STHdh(Q111) striatal cells. Human molecular genetics. 2000;9:2799–2809. doi: 10.1093/hmg/9.19.2799. [DOI] [PubMed] [Google Scholar]
- 25.Nascimento-Ferreira I, et al. Overexpression of the autophagic beclin-1 protein clears mutant ataxin-3 and alleviates Machado-Joseph disease. Brain : a journal of neurology. 2011;134:1400–1415. doi: 10.1093/brain/awr047. [DOI] [PubMed] [Google Scholar]
- 26.Levine B, Liu R, Dong X, Zhong Q. Beclin orthologs: integrative hubs of cell signaling, membrane trafficking, and physiology. Trends in cell biology. 2015;25:533–544. doi: 10.1016/j.tcb.2015.05.004. [DOI] [PMC free article] [PubMed] [Google Scholar]
- 27.Onodera O, et al. Oligomerization of expanded-polyglutamine domain fluorescent fusion proteins in cultured mammalian cells. Biochemical and biophysical research communications. 1997;238:599–605. doi: 10.1006/bbrc.1997.7337. [DOI] [PubMed] [Google Scholar]
- 28.Chai Y, Shao J, Miller VM, Williams A, Paulson HL. Live-cell imaging reveals divergent intracellular dynamics of polyglutamine disease proteins and supports a sequestration model of pathogenesis. Proceedings of the National Academy of Sciences of the United States of America. 2002;99:9310–9315. doi: 10.1073/pnas.152101299. [DOI] [PMC free article] [PubMed] [Google Scholar]
- 29.Sun Q, et al. Identification of Barkor as a mammalian autophagy-specific factor for Beclin 1 and class III phosphatidylinositol 3-kinase. Proceedings of the National Academy of Sciences of the United States of America. 2008;105:19211–19216. doi: 10.1073/pnas.0810452105. [DOI] [PMC free article] [PubMed] [Google Scholar]
- 30.Luo S, et al. Bim inhibits autophagy by recruiting Beclin 1 to microtubules. Molecular cell. 2012;47:359–370. doi: 10.1016/j.molcel.2012.05.040. [DOI] [PMC free article] [PubMed] [Google Scholar]
- 31.Eriguchi M, et al. alpha Pix enhances mutant huntingtin aggregation. Journal of the neurological sciences. 2010;290:80–85. doi: 10.1016/j.jns.2009.11.003. [DOI] [PubMed] [Google Scholar]
- 32.Jimenez-Sanchez M, et al. siRNA screen identifies QPCT as a druggable target for Huntington's disease. Nature chemical biology. 2015;11:347–354. doi: 10.1038/nchembio.1790. [DOI] [PMC free article] [PubMed] [Google Scholar]
- 33.Zhou C, et al. Monitoring autophagic flux by an improved tandem fluorescent-tagged LC3 (mTagRFP-mWasabi-LC3) reveals that high-dose rapamycin impairs autophagic flux in cancer cells. Autophagy. 2012;8:1215–1226. doi: 10.4161/auto.20284. [DOI] [PubMed] [Google Scholar]
- 34.Schilling G, et al. Intranuclear inclusions and neuritic aggregates in transgenic mice expressing a mutant N-terminal fragment of huntingtin. Human molecular genetics. 1999;8:397–407. doi: 10.1093/hmg/8.3.397. [DOI] [PubMed] [Google Scholar]
- 35.Davies SW, et al. Detection of polyglutamine aggregation in mouse models. Methods in enzymology. 1999;309:687–701. doi: 10.1016/s0076-6879(99)09045-x. [DOI] [PubMed] [Google Scholar]
- 36.Sarbassov DD, Guertin DA, Ali SM, Sabatini DM. Phosphorylation and regulation of Akt/PKB by the rictor-mTOR complex. Science. 2005;307:1098–1101. doi: 10.1126/science.1106148. [DOI] [PubMed] [Google Scholar]
- 37.Liu J, et al. Beclin1 controls the levels of p53 by regulating the deubiquitination activity of USP10 and USP13. Cell. 2011;147:223–234. doi: 10.1016/j.cell.2011.08.037. [DOI] [PMC free article] [PubMed] [Google Scholar]
- 38.Hammond GR, Schiavo G, Irvine RF. Immunocytochemical techniques reveal multiple, distinct cellular pools of PtdIns4P and PtdIns(4,5)P(2) The Biochemical journal. 2009;422:23–35. doi: 10.1042/BJ20090428. [DOI] [PMC free article] [PubMed] [Google Scholar]
- 39.Huang W, et al. Crystal structure and biochemical analyses reveal Beclin 1 as a novel membrane binding protein. Cell research. 2012;22:473–489. doi: 10.1038/cr.2012.24. [DOI] [PMC free article] [PubMed] [Google Scholar]
- 40.Rostislavleva K, et al. Structure and flexibility of the endosomal Vps34 complex reveals the basis of its function on membranes. Science. 2015;350:aac7365. doi: 10.1126/science.aac7365. [DOI] [PMC free article] [PubMed] [Google Scholar]
Associated Data
This section collects any data citations, data availability statements, or supplementary materials included in this article.
Supplementary Materials
Data Availability Statement
Gel source data are provided in Supplementary Fig. 1. Other source data and reagents can be provided by the authors upon reasonable request. Beclin 1 structures were from Protein Data Bank (pdb 4DDP, pdb 5DFZ). Beclin 1 protein sequences were from UniProt (human Q14457, mouse O88597, Zebrafish A2A135).


