

Abstract
Transcriptional regulation by the estrogen receptor-α (ER) has been investigated mainly in breast cancer cell lines, but estrogens such as 17β-estradiol (E2) exert numerous extrareproductive effects, particularly in the liver, where E2 exhibits both protective metabolic and deleterious thrombotic actions. To analyze the direct and early transcriptional effects of estrogens in the liver, we determined the E2-sensitive transcriptome and ER cistrome in mice after acute administration of E2 or placebo. These analyses revealed the early induction of genes involved in lipid metabolism, which fits with the crucial role of ER in the prevention of liver steatosis. Characterization of the chromatin state of ER binding sites (BSs) in mice expressing or not ER demonstrated that ER is not required per se for the establishment and/or maintenance of chromatin modifications at the majority of its BSs. This is presumably a consequence of a strong overlap between ER and hepatocyte nuclear factor 4α BSs. In contrast, 40% of the BSs of the pioneer factor forkhead box protein a (Foxa2) were dependent upon ER expression, and ER expression also affected the distribution of nucleosomes harboring dimethylated lysine 4 of Histone H3 around Foxa2 BSs. We finally show that, in addition to a network of liver-specific transcription factors including CCAAT/enhancer-binding protein and hepatocyte nuclear factor 4α, ER might be required for proper Foxa2 function in this tissue.
Estrogen receptor-α (ER) (Esr1 gene) and estrogen receptor-β (Esr2) are ligand-dependent transcription factors (TFs) that mediate the effects of estrogens such as 17β-estradiol (E2) (1, 2). Estrogens control the development, differentiation, and function of tissues involved in reproduction but are also pleiotropic hormones controlling the metabolism and homeostasis of many other tissues. They can be harmful or beneficial according to the target tissue, with deleterious effects in the development of cancers of uterus and breast but protective effects on the bones, arteries, and metabolism, because they reduce the incidence of osteoporosis, atheroma, and type 2 diabetes (3).
The molecular actions of ER have been extensively studied in vitro in human cell lines, using mostly the prototypical breast cancer cell line, MCF-7. Over the last decade, genome-wide analyses obtained from such in vitro models have greatly challenged the historical view of proximal ER-directed gene regulation (4–6), and it is now accepted that, in breast cancer cells, ER can dynamically engage between 15 000 and 30 000 binding sites (ER binding sites [BSs]) across the genome. Once tethered to chromatin at these sequences, ER regulates transcription of its target genes through the dynamic recruitment of multiple partners, including cofactors of diverse families of proteins and components of the transcriptional machinery (7–10). Importantly, most of the ER BSs that have been determined, so far, are thought to be enhancers located away from the transcriptional start site (TSS) of annotated E2-sensitive genes (11, 12), although transcription of so-called enhancer RNAs could occur at these places (13, 14). The actions of pioneer TFs have also been demonstrated genome-wide as essential for the accuracy and frequency of ER binding. FOXA1 is one of the most studied of these proteins (6, 11, 15). It can bind to condensed chromatin to prepare it for the subsequent recruitment of other TFs, presumably by acting as a recruitment platform for histone modification and/or nucleosome remodeling complexes (16–18).
Whether these mechanisms actually apply in vivo remains uncertain and requires careful attention. Genome-wide analysis of the ER cistrome in tissue explants from normal human mammary glands has demonstrated that ER binding events in these differentiated primary cells are much more restricted than those in cancer cell lines (19). In addition, although ERs and FOXA have been shown to cooperate in establishing the estrogen-dependent protection of the liver against hepatocellular carcinoma (20, 21), the nucleosome positions and chromatin structure around Foxa sites were also found to be independent of Foxa1 and Foxa2 expression in differentiated adult mouse liver (22). This leads one to wonder whether Foxa proteins do indeed exert a pioneering influence on ER activity and whether they use similar mechanisms in the liver as those in human mammary gland.
As well as establishing these mechanistic aspects of ER function in vivo, studying the actions of E2 in the liver in vivo is also of utmost physiological interest, because estrogens play important protective and deleterious roles. For example, E2 directly contributes to liver protection from the deleterious consequences of metabolic stresses such as a high-fat diet (HFD), because it prevents HFD-induced liver steatosis through the activation of hepatocyte ER (23, 24). On the other hand, exogenous estrogens administrated for oral contraception or hormone replacement therapy at menopause stimulate the production of angiotensinogen, sex hormone-binding globulin, and circulating hepatic coagulation factors (25). These changes are greatly enhanced by the oral route due to hepatic first pass and appear to contribute, at least in part, to an increased risk of venous thrombosis and its life-threatening complication, the pulmonary embolism (26). It is thus of major interest to describe and understand the mechanisms of action of estrogen in the liver, because this organ represents an important target for these hormones and can mediate both the desired (protection against liver steatosis) and deleterious (contribution to increased risk of venous thrombosis) actions of estrogens. However, so far, the estrogen-sensitive liver transcriptome and the ER cistrome have been characterized only under chronic hormonal treatment (20, 27–29).
Given this, we aimed to decipher the early steps of the mechanisms engaged by ER at the chromatin level that control liver gene expression after acute administration of E2 in vivo. To differentiate between ER-dependent and ER-independent processes, and to understand chromatin events induced by an ER deficiency, we gathered data from wild-type (WT) or ER knockout (ERKO) mouse livers. Here, we demonstrate that although the liver transcriptional response to E2 is fully dependent upon ER expression, an ER deficiency has no drastic consequences on enhancer chromatin signatures. However, we provide evidence that ER is required for Foxa2 binding at a subset of sites and that a network of other TFs may protect Foxa2 sites from loss of chromatin functionality.
Materials and Methods
Ethics statement
All procedures involving experimental animals were performed in accordance with the principles and guidelines established by the Inserm and were approved by the local Animal Care and Use Committee.
Mice
ER-null mice (ERKO) from a C57BL/6 genetic background were generated as previously described (30) and were kindly provided by Professor P. Chambon (Strasbourg, France). Female ERWT and ERKO mice littermates were obtained from the same parents. Mice were housed in groups of 5 per cage and kept in a temperature-controlled facility on an artificial 12-hour light, 12-hour dark cycle. Genotyping was systematically performed on DNA prepared from tail biopsies using a mix of specific primers P4 (intron 1), 5′-GCTTTCCTGAAGACCTTTCATATGGTG-3′; P3 (antisense in intron 2), 5′-GGCATTACCACTTCTCCTGGGAGTCT-3′; and mESR1ex2, 5′-CAATCGACGCCAGAATGGCCGAG-3′. Mice were ovariectomized at 4 weeks of age and then treated by oral gavage with placebo (P) (castor oil, 5% ethanol) or E2 (1 mg/kg) at 10 weeks of age. After anesthesia by ip injection of ketamine (100 mg/kg) and xylazine (10 mg/kg), mice were sacrificed 1 or 4 hours after gavage. Blood was collected by retroorbital puncture and livers were used immediately or snap frozen in liquid nitrogen and stored at −80°C.
RNA preparation
Ovariectomized ERWT or ERKO mice were treated or not with E2 for 4 hours. After the extraction of livers and tissue homogenization using a Precellys tissue homogenizer (Bertin Technology), total RNAs were prepared using GenElute Mammalian Total RNA Miniprep kit (Sigma-Aldrich). For RT-qPCR experiments, 1-μg total RNA was reverse transcribed using a High Capacity cDNA Reverse Transcription kit (Applied Biosystems) and subjected to qPCR.
Gene expression arrays
We used the One-Color Quick Amp Labeling kit (Agilent) to synthesize and label cRNAs using 200-μg RNA, according to the manufacturer's instructions. 600-ng Cyanine3-labeled cRNA were hybridized to a SurePrint G3 Mouse GE microarray (8X60K) at the GeT-TRIX Genopole Toulouse facility. Slides were scanned immediately and data were analyzed with Feature Extraction Software 10.10.1.1 (Agilent) using the default parameters. All subsequent analyses were done under R (www.r-project.org) using packages of Bioconductor (www.bioconductor.org). We used the limma package for data normalization, selecting spots with a weight of one in at least 3 arrays from at least 1 experimental group, and carried out normalization using the quantile method. Experimental groups were compared by analysis of variances (t test), and P values were adjusted by the Benjamini and Hochberg method. Genes were considered as differentially expressed between 2 experimental conditions when their adjusted P value was lower than 0.05 and their fold change greater than 1.5. The lists of all significantly regulated genes are given in Supplemental File 1. Functional annotations were performed under the web-platform webgestalt (http://bioinfo.vanderbilt.edu/webgestalt/) (31). Enrichments were calculated over the genome reference, using a Benjamini and Hochberg-corrected P < .0001 and considering only categories including at least 3 genes. Comparative analysis with publicly available datasets at the NCBI's Gene Expression Omnibus website (http://www.ncbi.nlm.nih.gov/geo/) (32) used the generated lists of genes from GSE57804 (33), GSE13265 (27), GSE45346 (28), GSE36514 (29), and GSE23850 for human MCF-7 (34).
Methylated DNA immunoprecipitation (MeDIP) and hydroxymethylated DNA IP (hMeDIP) assays
MeDIP are hMeDIP were performed as described previously (35) on liver genomic DNA prepared using the DNeasy Blood Tissue kit (QIAGEN). We used 5-μg gDNA and 2-μg anti-5mC antibody or 15-μg DNA and 5-μg anti-5hmC antibody for MeDIP or hMeDIP, respectively. Immunoprecipitated DNA was purified via standard phenol-chloroform and ethanol precipitation procedures and resuspended in 100-μL TE. Two microliters of these samples were used for qPCRs.
ChIP experiments
Livers were extracted from animals 1 hour after oral administration of P or E2, then sliced into small pieces and disrupted in 5-mL PBS by pressure through a 21-G syringe needle. Cells from one half of a liver were fixed in 10-mL PBS containing 1% formaldehyde for 10 minutes at room temperature. Cross-linking was then stopped by incubation with 0.125M glycine at room temperature. Cells were washed twice with PBS and then lysed in 1-mL buffer (10mM Tris-HCl [pH 8.0], 10mM NaCl, 3mM MgCl2, and 0.5% Igepal) containing 1× protease inhibitors (Complete Inhibitors; Roche). Extraction of nuclei was then performed by applying 50 strokes of potter on the suspension in an ice-cold Dounce followed by further incubation for 5 minutes at 4°C. Nuclei suspensions were then centrifuged at 13 000 rpm at 4°C. After 2 washes in PBS, nuclei were lysed by incubation in 4-mL lysis buffer (10mM EDTA, 50mM Tris-HCl [pH 8.0], 1% SDS, and 0.5% Empigen BB [Sigma]) on ice for 10 minutes and sonification using a Branson 250 apparatus (3 pulses of 20 s at 50% power, with at least 1 min on ice between each pulse). SDS was then neutralized by addition of 400-μL 10% Triton X-100, and chromatin was further sonicated by 2 additional 14-minute sonications of the lysed nuclei in a BioRuptor apparatus (Diagenode) operating at high intensity with 30-second on/off duty cycles. Chromatin was then cleared by a 10-minute centrifugation at 10 000g, and the supernatants were pooled for further use. ChIP experiments were performed using 300 μL of these chromatin preparations and 2-μg antibodies (Supplemental Table 1), as previously described (34, 35). DNA was purified on NucleoSpin columns (Macherey-Nagel) using NTB buffer. Subsequent qPCR analysis used 2 μL of 5-fold diluted input material and 2 μL of ChIP samples.
ChIP-HTS
All ChIP-seq were performed on livers from the same 5 individuals per genotype and treatment groups. We pooled DNA originating from 20 different ChIP experiments performed as described above, ie, 4 ChIP experiments per mouse. Construction of libraries and sequencing using an Illumina HiSeq apparatus were conducted at the Institut de Génétique et de Biologie Moléculaire et Cellulaire sequencing facility (Strasbourg, France). Reads were aligned onto the indexed chromosomes of the mm9 genome using bowtie 0.12.7 (36) with parameters allowing at most 2 mismatches, and selected for unique mapping onto the genome. Sequencing statistics are given in Supplemental Table 2. Due to the small amounts of recovered DNA in the ER ChIP experiments performed on livers from P- and E2-treated ovariectomized animals, we combined reads obtained in 2 runs of sequencing to reach a representative sequencing depth. Extracted reads were converted to .wig signal files using samtools 0.1.12a (37) and MACS 1.4.1 (38) with default parameters. To minimize the bias of diverging sequencing depths between different samples immunoprecipitated with the same antibody, the signal intensities of a given .wig were normalized so as to be comparable with the .wig file with the highest sequencing depth. Peak callings were then performed as described in (35) with different P values and peaks defined as being constituted of at least 4 adjacent signals within 65 bp above the threshold values. Peak callings for histone marks ChIP-seq were done with a stringent P = 1e−12. All repetitive sequences were eliminated from the identified genomic regions using lists obtained from the UCSC (blacklist; http://genome.ucsc.edu/cgi-bin). Bed files corresponding to the genomic coordinates of identified ER BSs and Foxa2 BSs are given in Supplemental File 2. Motif analysis was performed using the CentDist algorithm (http://biogpu.ddns.comp.nus.edu.sg/∼chipseq/webseqtools2) and SeqPos tool on the cistrome web-platform (http://cistrome.org/ap/) (39), and illustrated within Wordles (http://www.wordle.net/). For SeqPos analyses, we restricted the analyses to the top 5000 sites when required, as defined by their maximum mean intensity in a 1-kb window centered on each region. Sequences were declared enriched with a P < .05 and Z-score > 2.5. All integrative analyses of the ChIP-seq data were performed using home-made scripts and algorithms from the cistrome web-platform. Analysis of publicly available fastq ER ChIP-seq data at the GEO (32) or Array Express (http://www.ebi.ac.uk/arrayexpress/) (40) websites were performed under the same conditions. ER datasets analyzed were the GSE52351 (33), GSE36455 (41), E-MTAB-805 (20), and GSE25021 (42) for MCF-7 cells. Genomic regions identified by ChIP-chip assays (43) were extracted from the supplemental material of the manuscript and converted from mm5 to mm9 genome annotation. The .bed files corresponding to the cistromes of other transcription factors were all obtained from the cistrome finder system (http://cistrome.org/finder/) (44, 45): Foxa1 (GSM427090; 46), Cebpα (GSM548908) (47), Cebpβ (GSM427088) (46), Pparα (GSM864671) (48), Rxrα (GSM864674) (48), GR (common peaks from replicates GSM1122512 and GSM1122515) (49), Esrrα (GSM1067408) (50), NR1D1 (GSM647029) (51), NR1D2 (GSM840529) (52), HDAC3 (common peaks from replicates GSM647022, GSM647023, and GSM647024) (51), and NCor1 (GSM647027) (51), CTCF (GSM722759) (53) excepting hepatocyte nuclear factor 4α (Hnf4α) (GSE57807) (54) and Nkx3-1 (common peaks from duplicate GSM878195 and GSM878196) (55) data, which were reanalyzed with our scripts.
Real-time PCR (qPCR) and statistics
Sequences of all oligonucleotides used in this study are given in Supplemental Table 3 (RNAs) and Supplemental Table 4 (ChIPs). Oligonucleotides for RT-qPCR were designed using NCBI/Primer-Blast (http://www.ncbi.nlm.nih.gov/tools/primer-blast/). All other primers were designed using the Primer3 program (http://frodo.wi.mit.edu/primer3/) (56). All ChIP-qPCR experiments were carried out using a Bio-Rad MyiQ apparatus with 1μM oligonucleotide and a Bio-Rad iQ SYBR Green supermix with 50 rounds of amplification followed by determination of melting curves. RT-qPCRs were performed on 96.96 Dynamic Arrays for the microfluidic BioMark system (Fluidigm Corp) or using an ABI ViiA 7 apparatus. All statistical analyses of qPCR data were performed using GraphPad Prism software. Mann-Whitney nonparametric t tests were used to determine significant variations from controls. Heatmaps of expression values and qPCR data were all generated using MeV (57). To normalize the data obtained from microarray experiments into a similar dynamic range, expression values shown within the heatmaps were normalized per mRNA as normalized value = [(value) − mean (row)]/[SD (row)].
Data deposition
The microarray and ChIP-seq data generated in this study have been submitted to the NCBI Gene Expression Omnibus website (http://www.ncbi.nlm.nih.gov/geo/) (32) under accession number GSE70350.
Results
Establishment of E2- and ER-dependent transcriptomes in liver
Estrous cycle-dependent (58) or estrogen-sensitive transcriptomes in harvested livers (33) or in native animals treated by chronic administration of hormones (27, 28) have already been documented. Here, we aimed to characterize the ER-dependent mechanisms of transcription regulation in the liver in vivo and to correlate these data with data on ER binding to chromatin at shorter times of treatment. Therefore, we chose to treat ovariectomized female ER+/+ (ERWT) and their ER−/− (ERKO) littermate mice through gavage with E2 or P for 4 hours, in castor oil solution. These conditions were deliberately chosen in order to engage the hepatic first pass, which is likely to have a role in E2-induced venous thrombosis (26), as opposed to transcutaneous hormone injections. Liver mRNAs from ERWT or ERKO mice treated or not with E2 in these experimental conditions were then isolated and microarray analysis was performed. Differentially expressed genes between 2 conditions were considered significant when their fold change in expression were more than 1.5 with an adjusted P < .05. The list of all significantly regulated genes is given within Supplemental File 1. Despite a relatively elevated interindividual variation in gene expression levels (Figure 1A), these analyses were able to identify 124 E2-regulated mRNAs in ERWT, which corresponded to 110 unambiguously annotated unique genes (Figure 1B). Importantly, in ERKO animals, the E2 treatment did not significantly affect the transcriptional regulation of any genes (Supplemental Figure 1). This result confirms that ER is required for the response of all of the identified genes to an acute treatment with E2. Approximately 80% of the identified genes in ERWT mice were up-regulated by E2 (Figure 1A) and were grouped into functional annotations relevant for lipid and alcohol metabolisms, growth factor signaling and other functional pathways specific of the liver (Table 1). Interestingly, although performed in different experimental settings, 48 (44%) of the identified E2-sensitive genes here were similar to those determined previously after 3 days of treatment with the ER agonist 4,4′,4″-(4-propyl-[1H]-pyrazole-1,3,5-triyl)trisphenol (28) (Supplemental Figure 2). Our data also identified 194 mRNAs (129 genes) whose expressions were significantly different in ERKO compared with ERWT mice in the absence of E2 treatment (Figure 1, A and B). The ER coding gene Esr1 was included in these 129 genes, thereby validating our analyses. These ER-dependent genes were identified as involved in cell growth/differentiation but also in lipid metabolic processes and mammary gland development (Table 1). Independent RT-qPCR experiments confirmed the observed changes in regulation for 91% of the 45 tested E2-regulated genes and 41.7% of the 12 tested ER-dependent genes (Supplemental Figure 3). As illustrated within the Venn diagram depicted in Figure 1B, only 10 of the ER-dependent and E2-sensitive genes also exhibited an ER-dependent basal expression. This may indicate that the remaining 119 genes with an ER-dependent basal expression are regulated by E2 (or other endogenous estrogens/signals) under different conditions of time or diet than those used in our analyses. The differential expression of these 119 genes in livers from ERKO vs ERWT mice could also be an indirect consequence of ER gene inactivation in liver, whereby dysregulation of 1 or more of these genes may provoke the observed effects. However, only a small proportion of the ER-dependent genes found here are similar to those reported by another study performed in mice with liver-specific ablation of Esr1 expression (29). So it is possible that some changes in gene expression that we observed here between ERWT and ERKO livers are due to alterations of the function of (an)other tissue(s).
Figure 1. Characterization of the E2-dependent genes in livers from ERWT and ERKO mice.
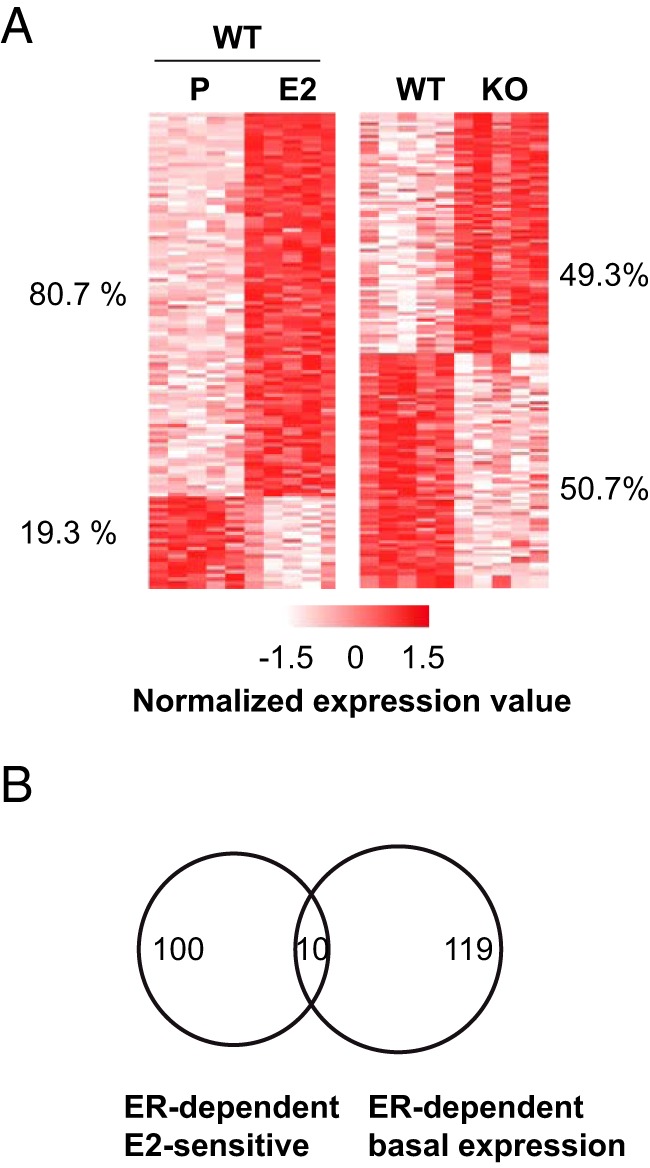
A, Heatmap illustrating the mean expression values determined for E2-sensitive genes (left side) in P- and E2-treated ERWT animals or for genes whose expression was different between P-treated ERWT and ERKO mice (right side). Each column corresponds to data obtained for 1 animal. For the sake of clarity, expression values for each gene were normalized by the mean and SD. The percentages of up- and down-regulated genes are indicated on the sides of each heatmap. B, Venn diagram depicting the overlap between genes regulated by E2 in ERWT livers and genes whose expression differed between ERWT and ERKO mice.
Table 1.
E2- and ER-Dependent Liver Transcriptomes-Associated Functions
| Description | adjP | |||
|---|---|---|---|---|
| GO biological processes | E2 sensitive | Lipid metabolic process | .063 | |
| Regulation of fibroblast growth factor receptor signaling pathway | .063 | |||
| Fibroblast growth factor receptor signaling pathway | .063 | |||
| Negative regulation of cellular response to growth factor stimulus | .063 | |||
| Negative regulation of fibroblast growth factor receptor signaling pathway | .063 | |||
| Alcohol metabolic process | .063 | |||
| Intracellular signal transduction | .063 | |||
| Enzyme-linked receptor protein signaling pathway | .063 | |||
| Small molecule metabolic process | .078 | |||
| Organic substance metabolic process | .078 | |||
| Cellular response to fibroblast growth factor stimulus | .078 | |||
| Polyol metabolic process | .078 | |||
| Response to fibroblast growth factor stimulus | .078 | |||
| ER dependent (-E2) | Negative regulation of biological process | .0008 | ||
| Growth | .0008 | |||
| Oxidation-reduction process | .0008 | |||
| Negative regulation of cellular process | .0014 | |||
| Mammary gland development | ||||
| Regulation of growth | .0020 | |||
| Mammary gland alveolus development | .0052 | |||
| Mammary gland lobule development | .0052 | |||
| Developmental process | ||||
| Positive regulation of cell differentiation | .0052 | |||
| Metabolic process | .0052 | |||
| Multicellular organismal development | .0081 | |||
| Reactive oxygen species metabolic process | ||||
| Negative regulation of growth | .0081 | |||
| Lipid metabolic process | .0090 | |||
| Positive regulation of reactive oxygen species metabolic process | .0090 | |||
| Single-organism metabolic process | ||||
| Positive regulation of developmental process | .0090 | |||
| Positive regulation of glucose import | .0090 | |||
| Organ development | .0091 | |||
| Regulation of body fluid levels | ||||
| System development | .0091 | |||
| Anatomical structure development | .0091 | |||
| Regulation of glucose metabolic process | .0091 | |||
| Gastrulation with mouth forming second | ||||
| Pathways | E2 sensitive | Adipogenesis | (Wiki) | .0021 |
| Metabolic pathways | (Kegg) | .0024 | ||
| Cytokine-cytokine receptor interaction | (Kegg) | .0036 | ||
| ER dependent (-E2) | Adipogenesis | (Wiki) | 6.53e-06 | |
| IL-3 signaling | (Wiki) | 2.97e-05 | ||
| Leptin insulin overlap | (Wiki) | 5.94e-05 | ||
| ErbB signaling | (Wiki) | .0008 | ||
| PPAR signaling | (Wiki) | .0022 | ||
| IL-6 signaling | (Wiki) | .0032 | ||
| Amino acid metabolism | (Wiki) | .0032 | ||
| Androgen receptor signaling | (Wiki) | .0035 | ||
| Metabolic pathways | (Kegg) | 2.43e-08 | ||
| Adipocytokine signaling | (Kegg) | .0001 | ||
| Glycine, serine, and threonine metabolism | (Kegg) | .0003 | ||
| Fatty acid metabolism | (Kegg) | .0005 | ||
| Type 2 diabetes mellitus | (Kegg) | .0005 | ||
| Jak-STAT signaling pathway | (Kegg) | .0009 | ||
| Bile secretion | (Kegg) | .0011 | ||
| Retinol metabolism | (Kegg) | .0012 | ||
| PPAR signaling pathway | (Kegg) | .0012 | ||
| Arachidonic acid metabolism | (Kegg) | .0014 | ||
| Hepatitis C | (Kegg) | .0042 | ||
| Insulin signaling pathway | (Kegg) | .0042 | ||
Functional annotations are shown for GO biological processes and for a compilation of Wiki and Kegg pathways. Adjusted Bonferroni P values are indicated (adjP).
Identification of ER BSs in liver
To determine whether ER is a direct transcriptional regulator of the E2- and/or ER-sensitive transcriptomes identified above, and to obtain mechanistic insights into these regulations, we next established the cistrome of ER in P- and E2-treated livers. In particular, we aimed to determine whether ER is bound to chromatin in the absence of E2, as has been reported in cultured cancer cells (59–62). Indeed, ER cistromes have already been determined for mouse liver by ChIP-chip (43, 58) or ChIP-seq methods in intact (20) or harvested liver cells (33); however, these have not been carried out in the absence of E2. Hence, we conducted ChIP-seq experiments to establish the cistrome of ER in livers from ovariectomized E2- or P-treated WT mice. We used chromatin prepared from livers of ovariectomized E2-treated ERKO individuals as a control. To reduce any cistrome variation due to individual animal specificities, we pooled and sequenced the DNA fragments purified from ChIP experiments performed on chromatin prepared from 5 different animals. Sequenced reads were aligned onto the genome and enriched regions were identified at different P values (Figure 2A). To determine the appropriate threshold enabling a comparison between the different cistromes, we calculated their overlap with decreasing significance (Figure 2B). As expected, the overlap between 2 sets of genomic regions paralleled the threshold stringency. For instance, at P = 10−15, 80% of the 87 ER BSs identified in P-treated ERWT animals were common with the 948 identified in E2-treated ERWT mice. In all subsequent analyses, we used ER cistromes determined with a 10−5 P value threshold, which constituted the inflection point for all overlapping ER BSs determined under the different conditions. At this threshold value, 3857 ER BSs were identified in livers from E2-treated ERWT animals, 857 under control conditions, and 54 in ERKO (Figure 2C). Using a similar approach we also confirmed that the ER cistromes from the liver overlap poorly with those reported for the aorta and uterus (Supplemental Figure 4) (33, 41). Interestingly, 476 ER BSs detected in P-treated ERWT mice were not identified in E2-treated samples. Surprisingly, 14 additional regions were declared as specific to ERKO livers (Figure 2C). Heatmaps of ChIP-seq binding values (Figure 2D) as well as mean binding values (Figure 2E) confirmed the presence of an ERKO-specific signal at these genomic regions (Figure 2D, subpanel 2), indicating that these 14 BSs were likely not generated by a peak-calling approximation. These graphs also confirmed the specific binding of ER in ERWT livers either treated with E2 or P on corresponding ER BSs. This demonstrates that the P-specific ER BSs are not indicative of a residual binding of ER on the strongest sites observed in E2-treated livers. Finally, we observed that ER binding to the 345 ER BSs identified in P- and E2-treated livers from ERWT animals was enhanced in hormone-stimulated conditions (Figure 2E).
Figure 2. Characterization of the ER cistrome in mouse liver.
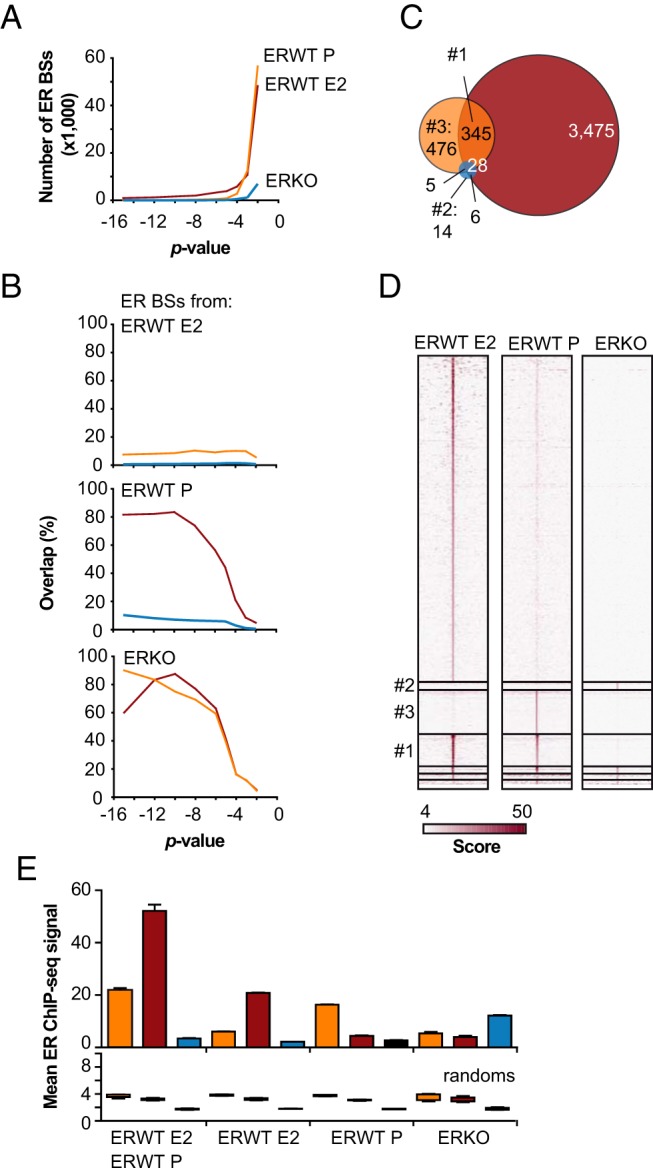
A, ER ChIP-seq experiments were performed on chromatin prepared from P- or E2-treated ERWT and ERKO livers. We systematically used different P values at the peak-calling step to determine the ER cistrome under the different conditions. This panel represents the number of identified ER BSs as a function of the P values used. The color code used in A is the same for the next ones. B, Overlap of the different ER cistromes obtained at diverse P values. C, Venn diagram illustrating the common and specific ER BSs using ER cistromes determined at P = 10−5. D, Heatmap representation of the ChIP-seq signal aligned to the center of ER BSs clustered depending on their overlap determined in C. E, Mean ER ChIP-seq signals obtained in ERWT or ERKO mouse livers at the 150 center base pairs of the BSs categories indicated beneath the graph. The upper histogram shows mean values ± SD measured on the sites of interest, whereas the bottom graph shows mean values ± SD of 10 trials carried out on 10 different sets of a corresponding number of random sites.
Examination of ERKO- and P-specific ER BSs
To validate the conclusions that could be made from our ChIP-seq data, we used qPCR to analyze ER binding to genomic regions presumed to either 1) bind ER in ERWT animals in both presence or absence of E2 (series #1); 2) specifically recruit ER P-treated ERWT mice (series #3); or 3) bind an ER-like protein in ERKO mice (series #2). We also took 5 randomly chosen sequences that did not recruit ER (#0 regions). The heatmaps in Figure 3 summarize the results of these experiments (mean data and statistics are shown in Supplemental Figure 5), which were performed on ChIP samples prepared from 4 mouse livers (numbers on the top of the panel) that differed from those processed for ChIP-seq to generate independent data. A fraction of the pool of DNA that was subjected to high-throughput sequencing (HTS) served as a control. The promoter of the Rplp0 gene was used as a normalizing ER-negative region, and 2 genomic regions located at the vicinity of the E2-regulated Gdf15 gene were used as controls: one mobilized ER (Gdf15.3) and one did not (Gdf15.2). The results of these experiments confirmed the expected binding of ER to ER BSs from the #1 series of genomic regions, and not to those from the #0 series (Figure 3A, left side of the panel). Moreover, these data showed an elevated level of variation concerning the binding of ER to the #2 and #3 regions detected in the different samples. For instance, in only 2 of the samples (one being the HTS sample), a protein recognized by the antibody used in these assays was specifically recruited (enrichment > 2) to 4 of the 5 tested #2 regions supposedly specific for ERKO livers. These observations led us to hypothesize that the antibodies targeting the C-terminal region of ER used for the ChIP-seq may purify a small number of nonspecific genomic targets. High variations in enrichment levels were also evidenced between the 5 samples in the case of the ERWT P-specific ER BSs. Hence, we performed ChIP-qPCR assays with a specific antibody directed against the N-terminal region of ER on the same preparations of chromatin. As shown within the heatmap on the right side of the Figure 3A (mean data and statistics are provided in Supplemental Figure 5), whereas we were able to validate the binding of ER to the #1 series of genomic regions using this different antibody, this was not the case on the ERKO-specific ER BSs (#2 sites). These data indicated that the ER BSs detected in ERKO mice may have represented a false-positive background of the ChIP-seq experiments, due either to the antibody or the pipeline used for processing the sequencing tags. Furthermore, as shown in Table 2, no specific motif related to an ER binding could be detected in ERKO sites, contrasting with the classical sequences found in the ER BSs identified in ERWT mice, such as FOX, HNF4, SP1, and AP1/AP2 motifs (full motif analysis is provided within the Supplemental Figure 6 and Supplemental File 3). ERKO sites were therefore excluded from the subsequent analyses described in this manuscript. Likewise, the results obtained from these ChIP-qPCR experiments performed with the N-terminal antibody did not validate any of the 5 tested ER BSs specific for P-treated ERWT livers (compare the results obtained for the #3 series of genomic regions on left and right sides of Figure 3A). This indicated that either none of the ER BSs falling in this P-specific category constitute actual sites of ER binding or that these sites may be subjected to extreme interindividual variation. Hence, we conducted ChIP-qPCR on 14 more genomic regions of this #3 category using liver chromatin prepared from additional animals (5 treated with P and 3 with E2). Results of these experiments, illustrated within Figure 3B, showed that 2 of these 14 sites (#3.18 and #3.19) were not detected in these independent experiments using the anti-C-terminal antibody and that 5 (#3.7, #3.11, #3.17, #3.20, and #3.21) of the remaining 12 ER BSs were enriched in the DNA fractions enriched with the anti-N-terminal antibody.
Figure 3. Validation of ER BSs.

A and B, ER ChIP-qPCR experiments were performed on livers from independent animals (numbers on the top of the panel) to validate ChIP-seq data. A, A fraction of the pool of DNA that was subjected to HTS was used as a control. We used 2 panels of antibody: one directed against the C-terminal region of ER (A and B, left side) and the other targeting the N-terminal domain of the protein (A and B, right side). The mobilization of ER was evaluated on a series of genomic regions representing clusters of ER BSs engaged by ER in the presence of E2 or not (#1) or BSs specific for ERKO (#2) or ERWT P (#3) conditions. The results of these experiments are illustrated as a heatmap of values normalized to those of the promoter of the Rplp0 gene, which is an ER-negative region. We also used additional negative and positive controls, located nearby the E2-sensitive Gdf15 gene: Gdf15.2 and Gdf15.3, respectively. B, Results of the experiments were hierarchically clustered to improve the clarity of the heatmap. The distance metric expressed as Pearson correlation is indicated on the right side of the panel. N.D, not determined.
Table 2.
Enriched DNA Motifs in Identified ER BSs
| ERWT E2 |
ERWT P |
ERKO |
|||||||||
|---|---|---|---|---|---|---|---|---|---|---|---|
| CentDist |
SeqPos |
CentDist |
SeqPos |
CentDist |
SeqPos |
||||||
| Motif Family | Score | Factor | Z-Score | Motif Family | Score | Factor | Z-Score | Motif Family | Score | Factor | Z-Score |
| ERE | 63.3457 | ESR1 | −54.177 | ERE | 19.8389 | ESR1 | −16.769 | No motif identified | SREBF1 | −2823 | |
| AR | 27.5415 | ESR2 | −48.709 | AR | 9.2016 | ESR2 | −15.407 | E2F6 | −2.55 | ||
| CEBP | 19.9196 | NR1H4 | −41.196 | SP1 | 7.07288 | PPARG | −10.533 | ||||
| CREB | 17.3222 | NR2F1 | −38.985 | CREB | 6.725 | Nr1d2 | −9025 | ||||
| NF1 | 14.969 | Nr1d2 | −35.506 | AP2 | 6.55 955 | PPARG::RXRA | −7921 | ||||
| FOX | 14.6542 | Rxra | −34.347 | NRF | 6.27122 | Rxra | −7705 | ||||
| LRH1 | 14.6223 | PPARG | −30.851 | E2F | 6.00375 | NR1H4 | −7519 | ||||
| SP1 | 13.5031 | PPARA | −30.684 | MINI | 5.66217 | NR2F1 | −7021 | ||||
| PAX | 13.3069 | Esrrb | −28.943 | HIC1 | 5.1859 | RORB | −6933 | ||||
| E2F | 13.2217 | Nr1d1 | −27.169 | CEBP | 5.1783 | Nr1d1 | −6739 | ||||
| FXR | 12.0634 | Nr2f2 | −25.821 | ETS | 5.10736 | PPARA | −6595 | ||||
| AP4 | 12.014 | RORB | −25.117 | EGR | 5.08289 | AR | −4809 | ||||
| AP2 | 11.8928 | RARA | −25.044 | SP3 | 5.00439 | Zscan10 | −4476 | ||||
| HIC1 | 11.8863 | PPARG::RXRA | −24.754 | ZF5 | 4.87866 | Zfp161 | −4295 | ||||
| HEN | 11.097 | ESRRA | −23.913 | P53 | 4.82231 | EGR3 | −4147 | ||||
| AP1 | 10.8325 | Hnf4α | −23 697 | LMAF | 4.81312 | HMGN1 | −4.1 | ||||
| ARP1 | 10.6548 | NR0B1 | −22.347 | NF1 | 4.71645 | ZSCAN4 | −4014 | ||||
| ZF5 | 10.6078 | RXRB | −21.033 | EBOX | 4.64247 | NR3C1 | −3894 | ||||
| MEF3 | 10.5625 | NR4A1 | −20.62 | GGG | 4.44056 | Rarg | −3742 | ||||
| MINI | 10.5463 | NR2C2 | −20.308 | FOX | 4.33386 | NR0B1 | −3544 | ||||
| EBOX | 10.5284 | Rxrg | −20.177 | CP2 | 4.1856 | GMEB2 | −3438 | ||||
| MIF1 | 10.3304 | RORA | −20.112 | SMAD | 4.04632 | NR2C2 | −3433 | ||||
| GGG | 10.2881 | Rarg | −19.838 | EBF | 3.95207 | EGR4 | −3.42 | ||||
| SMAD | 10.1529 | Nr5a2 | −19.729 | DEAF1 | 3.93445 | Esrrb | −3401 | ||||
| LEF | 9.80931 | Cebpb | −18.033 | PAX | 3.88007 | E2F3 | −3353 | ||||
| HNF1 | 9.73785 | Cebpa | −17.783 | CAAT | 3.86651 | MTF1 | −3329 | ||||
| HNF6 | 9.55107 | CEBPE | −17.524 | HEN | 3.86643 | NR3C2 | −3179 | ||||
| ATCGAT | 9.48478 | SF1 | −16.74 | STAT | 3.81298 | RXRB | −3161 | ||||
| BACH | 9.09395 | AR | −16.689 | AP4 | 3.76367 | PAX2 | −3.14 | ||||
| CACCC | 9.07574 | NR6A1 | −16.346 | DBP | 3.75713 | Mafb | −3116 | ||||
| DBP | 8.80169 | CEBPD | −16.334 | SRF | 3.58963 | E2F2 | −3069 | ||||
| NRF | 8.75417 | THRB | −15.294 | KAISO | 3.5676 | TP63 | −2723 | ||||
| VMAF | 8.74793 | CEBPG | −15.105 | CACCC | 3.55511 | PGR | −2622 | ||||
| P53 | 8.57691 | NR3C1 | −14.897 | MEIS1 | 3.54119 | NANOG | −2603 | ||||
| LMAF | 8.54137 | VDR | −14.558 | IK | 3.32866 | VDR | −2529 | ||||
| CAAT | 8.30663 | NR3C2 | −14.523 | LRH1 | 3.1906 | Egr2 | −2509 | ||||
| CP2 | 8.17824 | NR2F6 | −14.179 | WT1 | 3.17195 | ||||||
| NR4A2 | −14.073 | ZNF219 | 3.14613 | ||||||||
| ESRRG | −13.415 | RFX | 3.0712 | ||||||||
| ATF2 | −13.373 | STAF | 2.9954 | ||||||||
| ATF2::JUN | −13.185 | ||||||||||
| ATF6 | −12.984 | ||||||||||
| THRA | −12.737 | ||||||||||
| Jdp2 | −12.54 | ||||||||||
| THRB | −12.515 | ||||||||||
| CREB3 | −11.811 | ||||||||||
| RARB | −11.735 | ||||||||||
| NFIX | −11.73 | ||||||||||
| NFIB | −11.623 | ||||||||||
| ATF4 | −10.996 | ||||||||||
| NR2E3 | −10.893 | ||||||||||
| Creb5 | −10.694 | ||||||||||
| PAX2 | −10.551 | ||||||||||
| ATF1 | −10.415 | ||||||||||
| NFIC | −10.269 | ||||||||||
| BATF3 | −10.214 | ||||||||||
| ATF7 | −10.207 | ||||||||||
| Foxa2 | −9851 | ||||||||||
| PGR | −9837 | ||||||||||
| FOXA1 | −9831 | ||||||||||
| Creb3l2 | −9414 | ||||||||||
| NR1I2 | −9322 | ||||||||||
| NFIL3 | −9241 | ||||||||||
| Pax3 | −9197 | ||||||||||
Motif analysis was performed using CentDist (http://biogpu.ddns.comp.nus.edu.sg/∼chipseq/webseqtools2) and SePos (http://cistrome.org/ap/) algorithms. Sequences were declared enriched when P < .05 and Z-score > 2.5. Only the 65 best sequences characterized by SeqPos are shown for ER BSs identified in E2-treated ERWT animals. Full analyses are depicted in the Supplemental File 3.
In conclusion, as in human cancer cells, a mobilization of ER on chromatin can be detected in the absence of ligand in livers from ovariectomized mice. The existence of genuine P-only sites was also confirmed in our ChIP-qPCR experiments. However, their number, as determined from our ChIP-seq data, may be biased or even overestimated 1) because of the use of a C-terminal antibody that can generate false-positive regions with low-level of enrichments (such as the 54 ERKO sites); and/or 2) because the N-terminal epitope targeted by the antibody used in our confirmation ChIP-qPCR experiments is not accessible for chromatin-bound ER in P conditions.
ER BSs are “enriched” in the proximity of liver-specific genes
Interestingly, in E2- and P-treated animals, 14.5% and 12.9% of the identified ER BSs, respectively, were found at a short distance (<3 kb) from the promoters of annotated genes (Figure 4A). When compared with the ER cistromes determined for human breast cancer cells, such an enrichment was clearly different from those identified for ER in the liver, uterus, and, albeit to a lower extent, the aorta (Figure 4B and Supplemental Figure 7). Indeed, in E2-treated MCF-7 breast cancer cells, only 2 to 4% of the ER BSs identified were located near gene promoters (<3 kb) (Figure 4B). Note that an additional hour of treatment of mouse with E2 (2 h in total) did not affect the distribution of ER BSs across the genome (data not shown). Importantly, GREAT (genomic regions enrichment of annotations tool) (63) functional annotation of the ER cistrome in the liver also indicated that genes located proximal to and/or in relation to the identified ER BSs were clearly associated with liver-specific expression, function, and diseases, such as lipid homeostasis and responses to insulin (Table 3). These data showed that the E2-mediated regulation of the rate of gene transcription in mouse liver may involve more proximal mechanisms than in human cancer cell lines, ie, through binding of ER and its coregulators near the TSS. This hypothesis was confirmed by the observation that 28% of liver E2-regulated genes exhibited at least 1 ER BS within a 0- to 5-kb window around their TSS, compared with 13% in MCF-7 cells (Figure 4C). Interestingly, 75% of the genes characterized by an ER-dependent basal expression were located at distances more than 25 kb from any ER BS (Figure 4C). Again, this may reflect either an indirect effect of ER loss on the transcriptional rate of these particular genes, or their preferential long-range regulation. Finally, apart from a slight increase for genes within a 1- to 5-kb window, the strength of gene regulation by E2 could not be correlated with the distance between their TSS and the ER BSs neither in mouse liver nor MCF-7 cell lines (Figure 4D).
Figure 4. Specific features of the ER cistrome in mouse liver.
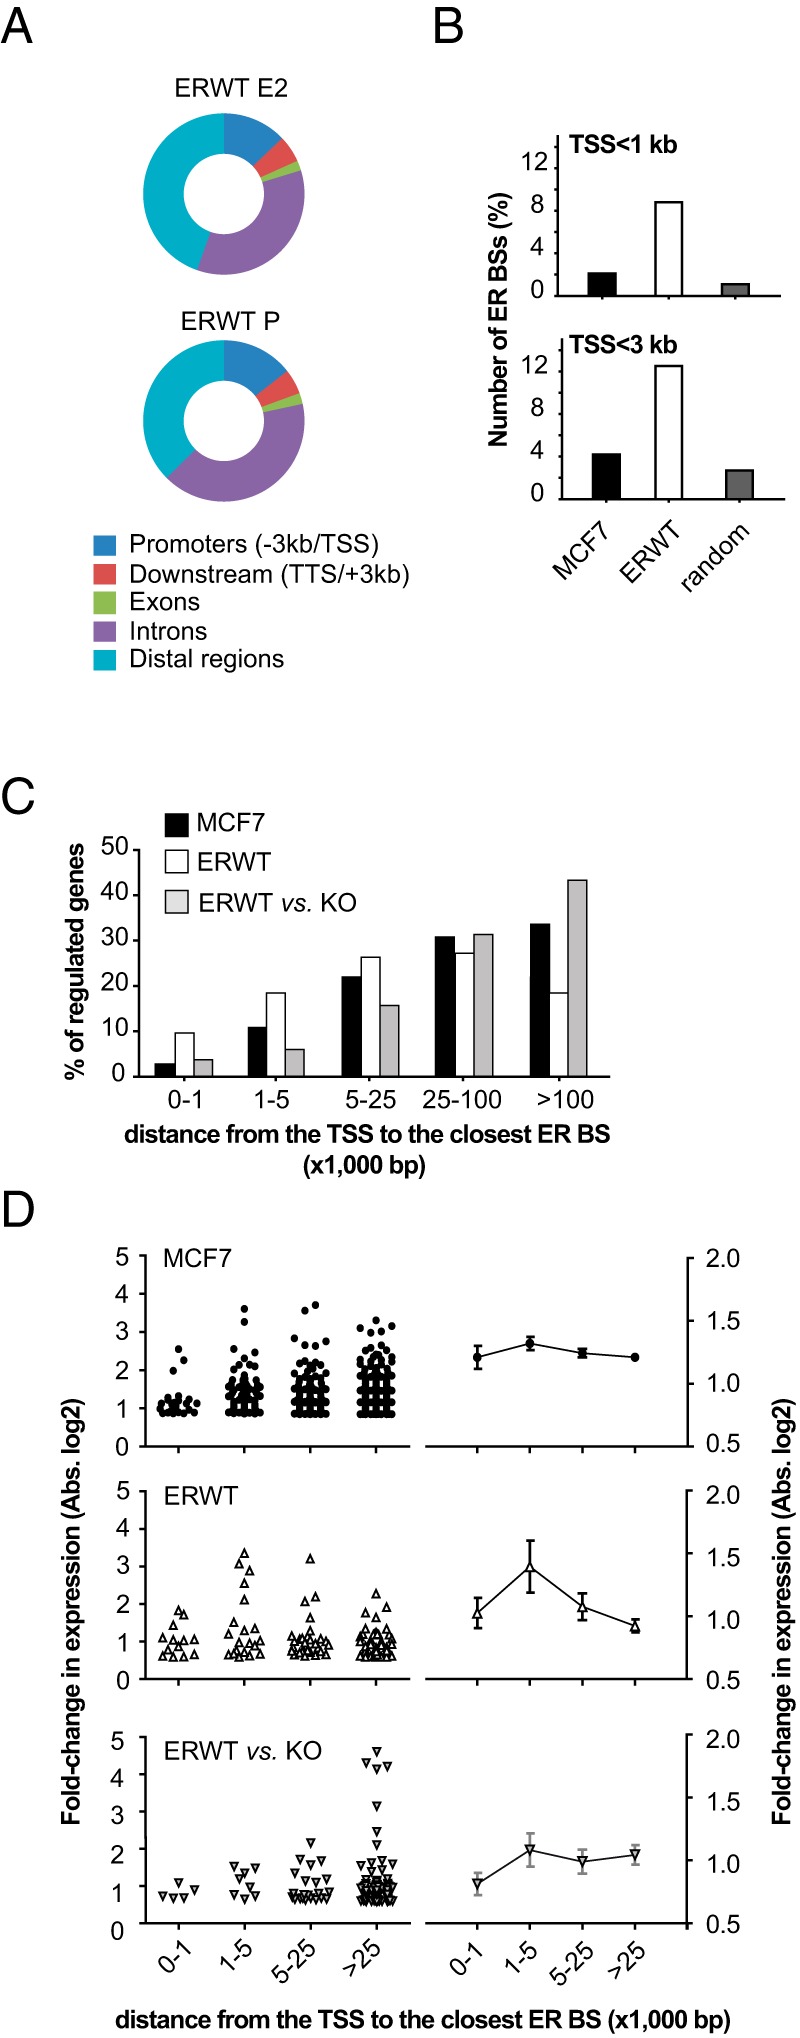
A, Distribution of ER BSs determined in E2- or P-treated ERWT mouse liver towards annotated gene promoters and TTSs, exons and introns, and intergenic (distal) regions. B, Number of ER BSs located within a 1- or 3-kb window around the TSS of annotated genes in ERWT (P+E2) mouse liver when compared with ER binding data obtained in human breast cancer MCF-7 cells. Calculations were also made using an equivalent number of random regions with similar characteristics than the test ER cistrome determined in ERWT livers. C, Bar chart summarizing the distribution of distances separating E2-regulated genes in breast cancer cell lines or in ERWT mice liver or ER-dependent genes from their closest ER BS. Results are expressed as the percentage of the total population of genes considered. D, Fold changes in gene expression by E2 in MCF-7 and ERWT mouse liver and in ERKO vs ERWT liver are expressed as a function of their proximity to an ER BS. Distribution of values are depicted within the left part of the panel, whereas means ± SD are plotted on the right side of the panel.
Table 3.
Functional Annotations of Genes Proximal to ER BSs From ERWT Livers
| Term | P Value | |
|---|---|---|
| MGI expression | TS23_liver; lobe | 4.22e-40 |
| TS26_liver | 6.67e-32 | |
| TS26_liver and biliary system | 1.03e-31 | |
| TS24_liver | 1.56e-27 | |
| TS24_liver and biliary system | 2.66e-24 | |
| TS15_septum transversum; hepatic component | 1.11e-15 | |
| TS23_adrenal gland; medulla | 3.13e-13 | |
| GO biological process | Organic acid metabolic process | 3.69e-49 |
| Carboxylic acid metabolic process | 2.74e-48 | |
| Cellular ketone metabolic process | 6.43e-48 | |
| Lipid metabolic process | 7.95e-48 | |
| Cellular response to hormone stimulus | 1.87e-43 | |
| Cellular response to peptide hormone stimulus | 1.25e-40 | |
| Monocarboxylic acid metabolic process | 7.54e-38 | |
| Cellular response to insulin stimulus | 4.52e-37 | |
| Response to peptide hormone stimulus | 7.26e-36 | |
| Response to insulin stimulus | 2.78e-35 | |
| GO molecular function | Lyase activity | 7.09e-15 |
| Monocarboxylic acid binding | 4.91e-14 | |
| Heme binding | 2.99e-13 | |
| Apolipoprotein binding | 6.24e-13 | |
| Transferring acyl groups | 5.44e-11 | |
| Carboxylic acid binding | 1.85e-12 | |
| Steroid binding | 5.63e-12 | |
| Vitamin binding | 2.74e-11 | |
| Steroid hydroxylase activity | 1.69e-10 | |
| Ligand-regulated transcription factor activity | 1.02e-09 | |
| Mouse phenotype | Abnormal lipid homeostasis | 9.28e-75 |
| Abnormal lipid level | 1.01e-71 | |
| Abnormal circulating lipid level | 8.51e-70 | |
| Abnormal liver physiology | 8.41e-63 | |
| Abnormal hepatobiliary system physiology | 8.27e-62 | |
| Abnormal triglyceride level | 4.24e-61 | |
| Decreased cholesterol level | 1.01e-52 | |
| Abnormal circulating cholesterol level | 5.19e-52 | |
| Abnormal cholesterol level | 1.09e-51 | |
| Abnormal cholesterol homeostasis | 4.65e-50 |
Functional annotations were determined by GREAT (http://bejerano.stanford.edu/great/public/html/index.php) (63) using basic parameters (basal criteria for associating genomic regions with genes).
ER loss impacts the chromatin status of the promoters of its target genes
A loss of ER binding at some genomic regions could be either the source or a consequence of drastic changes in chromatin structure at these sites, including posttranslational modifications of histones and DNA modifications. The nucleosomes located in active regulatory elements like enhancers exhibit histone marks such as H3K4me1, H3K4me2, and H3K27ac (64–66), and their DNA is globally characterized by low levels of CpG methylation that is inversely correlated to their hydroxymethylation status (35, 67, 68). Thus, we performed ChIP-seq experiments that aimed to determine the genome-wide location of nucleosomes marked with the H3K27ac or H3K4me2 modifications. As shown within Figure 5A, the mean enrichment of these 2 marks around ER BSs (as defined by the sum of ER BSs detected in P- and E2-treated animals) exhibited biphasic curves around the center of the ER BSs, reflecting the existence of modified nucleosomes surrounding poised/activated genomic regions (69–72). Importantly, the relative enrichment of ER BSs in H3K4me2 and H3K27ac were relatively similar in ERWT and ERKO mice (Figure 5B). Furthermore, less than 3% of the ER BSs were overlapping with either the 4084 or 2137 genomic regions losing their H3K4me2 or H3K27ac marks in ERKO livers (Supplemental Figure 8). This suggested that the binding of ER to its sites is not required for the establishment and/or maintenance of these chromatin modifications. Note that the presence of the 2 chromatin marks H3K4me2/H3K27ac slightly but significantly decreased at the promoter regions of genes transcriptionally down-regulated in ERKO livers (Figure 5C), and conversely increased in the promoters of up-regulated ones. Interestingly, variations in H3K4me2 and H3K27ac contents were more coordinated in the promoters of up-regulated genes than in those of down-regulated genes (Figure 5D). This indicates that the promoter regions of genes undergoing a “gain of function” in ERKO livers may be subjected to stronger chromatin remodeling than genes with a reduced transcriptional activity in ERKO.
Figure 5. Coordinated changes in H3K4me2 and H3K27ac levels at promoters of ER-dependent genes.

A, Alignment of H3K4me2 and H3K27ac ChIP-seq signals generated from chromatin prepared from E2-treated livers of ERWT (red line) or ERKO (blue line) mice on a −5-kb/+5-kb window around the center of the ER BSs. B and C, Mean H3K4me2 and H3K27ac ChIP-seq signals at a −500/+500-bp window around the center of ER BSs (B) or within a 4-kb window centered around the TSS of genes with lower or higher expression in ERKO livers (down- or up-regulated, respectively). D, The fold change of mean H3K27 values calculated for each of the promoters of down- or up-regulated genes in ERKO livers are plotted against variations of mean H3K4me2 signals. Values shown are expressed as the log2 of the fold changes.
Hnf4α may protect ER BSs from losing their chromatin functional state in ERKO liver
In order to examine the possibility that some variations of chromatin functionality could occur in a specific subpopulation of ER BSs, we clustered the profiles of H3K4me2 and H3K27ac modifications around these genomic regions (heatmaps of ChIP-seq signals in Figure 6A). With the exception of the ER BSs classified within clusters 7, 9, and possibly 4 (mean signals are shown in Figure 6B), no variations in H3K4me2 signals were apparent in ERKO compared with ERWT mice. Interestingly, in these 2/3 cases the enrichment levels of ER BSs in H3K4me2 did not significantly differ but the shape of the curves shifted from biphasic to monophasic shapes (see enlarged view in the corresponding panels). A similar shift was also observed in the case of the cluster 4, but to a slighter extent. This suggests that the ER BSs included within clusters 7, 9, and possibly 4 were changing their functionality/poised state. However, we did not observe any variations in H3K27ac levels in these clusters (Supplemental Figure 9), indicating that this loss in functionality may only affect the stability and/or the presence of an H3K4me2-marked nucleosome at the center of the ER BS.
Figure 6. Affected profile of H3K4me2 enrichment of a fraction of ER BSs in ERKO livers.

A, Heatmap representation of a k-mean clusterization of H3K4me2 and H3K27ac ChIP-seq signals obtained in ERWT and ERKO mice livers on ERWT ER BSs. The distribution of clustered ER BSs towards annotated genes' transcriptional start and termination sites (TSS and TTS, respectively), intragenic and intergenic (distal) regions, is indicated on the right side of each clusters, as well as the numbers of genomic sites within each cluster. B, Alignments of H3K4me2 and H3K27ac ChIP-seq mean signals within a −5k-bp/+5-kb window centered on ER BSs of each clusters as defined from the k-mean analysis. Signals obtained in E2-treated livers of ERWT or ERKO mice are illustrated as a red or blue line, respectively. Insets represent magnified views of the center of the graphs and illustrate the observed shift from biphasic to monophasic curves of enrichment in H3K4me2.
To validate these genome-wide observations and give further details on the exact loss of functionality of ER BSs in ERKO mice, we next evaluated the enrichment of ten ER BSs with H3K4me1, H3K4me2, and H3K27ac by ChIP-qPCRs using chromatin prepared from the same E2-treated ERWT and ERKO animals as previously described. The results of these experiments (data and statistics in Supplemental Figure 10) are illustrated as heatmaps of enrichment in Figure 7A. These data indicate that the presence of mono- or di-methylated H3K4 around the 10 tested ER BSs was not drastically affected in ERKO livers when compared with ERWT ones. The same results were observed for their K27 acetylation status. However, interestingly, in ERKO mice a small but significant increase in both H3K4me1 and me2 content was observed at the #1.3 ER BS, and an increase in H3K4me2 was seen at the #3.1 ER BS. These small increases in H3 modifications may be in accordance with the fact that, on some ER BSs, the shift from biphasic to monophasic shapes of enrichment observed by ChIP-seq actually reflects a more stable central H3K4me2-marked nucleosome. Finally, we envisioned that increased amounts of 5mC or a decreased presence of 5hmC on enhancer DNA may have accounted for the observed loss of functionality of ER BSs in ERKO mice. To test this hypothesis, we performed MeDIP and hMeDIP and evaluated the enrichment of sites of interest of these 2 modified bases using qPCR. The results of these assays (Supplemental Figure 10, summarized in Figure 7B) indicated that the 10 tested enhancers were poorly enriched in 5mC, and that the loss of ER had no general impact on these levels, apart from a slight but not significant increase in the #1.2 ER BS in ERKO mice. In most cases, the amount of the active 5hmC mark was also similar between ERWT and ERKO mice, except for a slight decrease in the #1.2 and an increase in the #1.3 ER BSs that paralleled their levels of H3K4me2. It could therefore be proposed that the #1.3 enhancer is in fact a counterexample gaining some chromatin functionality.
Figure 7. Chromatin status of ER BSs in ERWT and ERKO mouse livers.
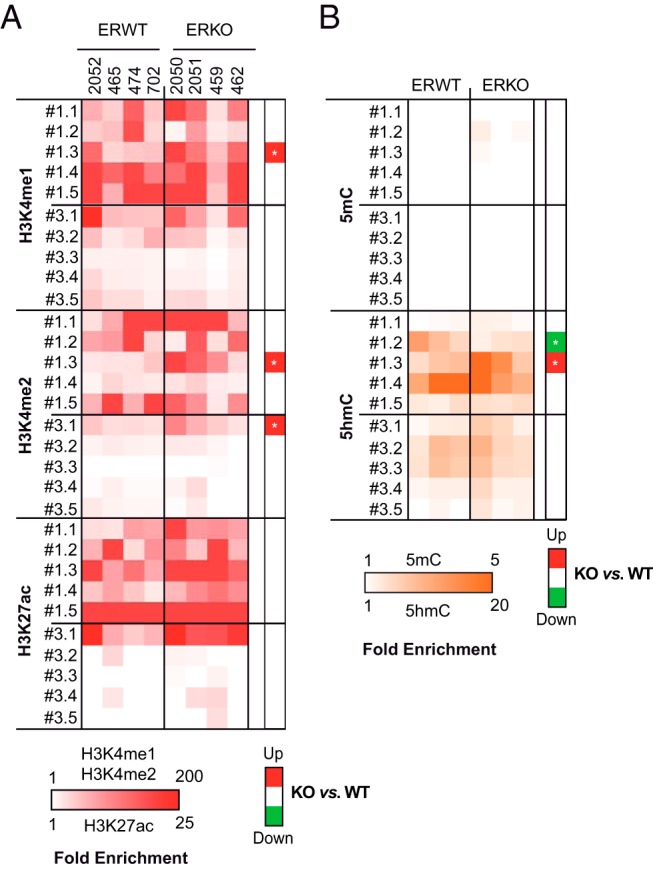
A, Independent anti-H3K4me1, H3K4me2, and H3K27ac ChIP-qPCR experiments were performed to validate ChIP-seq data. The presence of these marks on ER BSs from series #1 and #3, as defined in Figure 3, is depicted within the illustrated heatmaps. Numbers on the top refer to the animals from which the chromatin preparations originated. Experiments were done twice per individual. Mean enrichment values calculated per individual are shown as normalized to a control negative ChIP experiment using the same chromatin samples. B, Heatmap illustrating the mean enrichment of indicated ER BSs in 5mC and 5hmC as tested by MeDIP- and hMeDIP-qPCR experiments, respectively. The values included within these graphs were obtained from 3 independent experiments performed on 2 different DNA samples originating from 2 different ERWT or ERKO animals. Data were normalized to values obtained using an internal negative control devoid of CpGs. Significant reduced (green) or gained (red) enrichment in histone marks or DNA modifications ERKO livers are indicated in the heatmaps on the right side of each panels. Calculated P values from Mann-Whitney t tests are indicated within the heatmap as follows: *, P < .05; **, P < .01.
Interestingly, clusters 4, 8 and 9 include ER BSs located away from TSSs and could thus be defined as putative enhancers (Figure 6A). However, we did not find evidence of any motif for a transcription factor specific to cluster 8 or 9 that could explain why changes in H3K4me2 enrichment occur in the latter and not the former (motif analysis provided within Supplemental File 4). We previously observed that ER BSs were highly enriched in HNF4 motifs (see Table 2 and Supplemental Figure 6), another nuclear receptor, crucial for liver functions (73). This led us to determine whether its presence may protect ER BSs from losing their chromatin functionality in ERKO livers. As previously performed for ER, we determined Hnf4α cistrome with different P values to allow comparison between the different conditions, using data from another study (54). As shown within Figure 8A and illustrated within the heatmap in Figure 8B, we found that up to almost 77% of ER BSs were actually overlapping with Hnf4α BSs. Importantly, this overlap was lower for ER BSs belonging to clusters 7 and 9 (Figure 8C), which are changing their functionality/poised state in ERKO livers. Therefore, this tie in with our hypothesis of a protective role of Hnf4α against the loss of H3K4me2 mark on lost ER BSs.
Figure 8. Overlap of ER and Hnf4α cistromes.
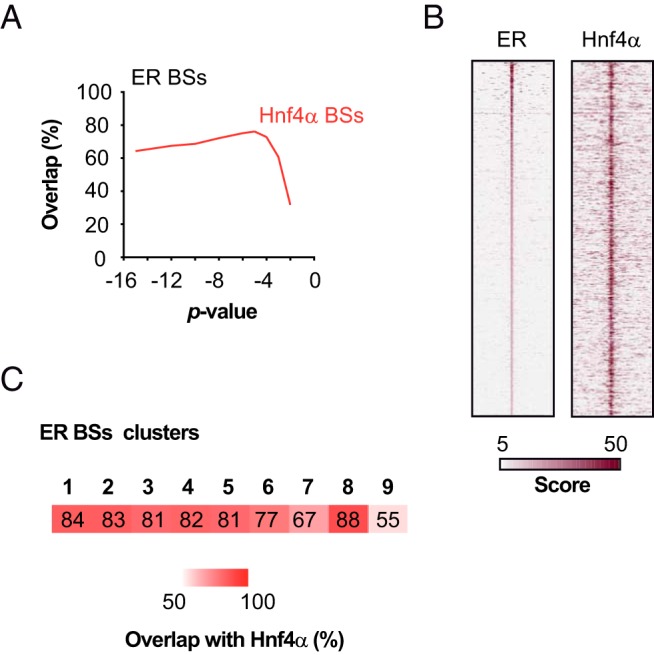
A, Overlap of the ER BSs determined in E2-treated ERWT livers with those of Hnf4α obtained at diverse P values. B, Heatmap representation of ER and Hnf4α ChIP-seq signals within a −5-kb/+5-kb window centered on ER BSs. Regions are sorted by their rank in ER ChIP-seq signal. C, Heatmap representing the overlap between the clusters of ER BSs as determined in Figure 6 with Hnf4α BSs determined at P = 10−5. The numbers indicated represent the calculated overlaps.
In summary, together, these observations indicate that a loss of ER in the liver does not strongly impact the chromatin status of its BSs: only those with a reduced overlap with Hnf4α binding seem to present a less stable H3K4me2-marked nucleosome at their center.
A proportion of the mouse liver Foxa2 cistrome is ER dependent
Our genomic data are in favor of ER acting on chromatin regions whose activation is independent of ER-binding. This could reflect the possible actions of an ortholog of a pioneering factor such as human FOXA1 (15, 19). Foxa proteins are expressed in mouse liver, including the related Foxa1 and Foxa2 (74, 75), and these proteins have been found to serve as a scaffold for ER to regulate gene transcription in the liver and prevent hepatocarcinogenesis (20, 21). Hnf4α binding in mouse liver is also conditioned (at least on part of its sites) during development by Foxa2 (76, 77). We therefore sought to investigate the role of these proteins in the creation of an ER cistrome and mapped their BSs by ChIP-seq using liver chromatin preparations from the same animals as those used for the ER ChIP-seq experiments. We first observed that the Foxa1 and Foxa2 cistromes were very similar, due to a cross-reaction of Foxa1 antibodies against the Foxa2 protein (data not shown). The Foxa1 cistrome was therefore not analyzed in the subsequent step. As previously, we determined the Foxa2 cistromes with different P values. Whatever the significance level used, we observed that the Foxa2 cistrome was reduced in ERKO mice compared with ERWT mice (Figure 9A), with 5991 Foxa2 BSs determined at a 10−4 P value for ERKO compared with 11 767 for ERWT mice. As depicted within Figure 9B, depending upon the P value, 12%–30% of ER BSs were found to recruit Foxa2, corresponding to 6%–12% of the entire Foxa2 cistrome. Up to almost 90% of the Foxa2 sites identified in ERKO mice were also determined as Foxa2-positive in WT animals. At a fixed P = 10−4, we identified 7746 lost Foxa2 BSs (Figure 9C). Importantly, only a sixth of these lost sites (688 + 491 = 1179) were ER-positive (Figure 9C). These data indicate that the loss of Foxa2 binding could be, at least in part, an indirect effect of ER depletion. The Foxa2 ChIP-seq signal was apparently lower in ERKO mice than in ERWT mice at conserved sites (see heatmap in Figure 9D and mean values in Figure 9E), indicating that Foxa2 binding events might also be less frequent in livers not expressing ER. However, although independent ChIP-qPCR experiments mostly recapitulated the expected results on gained and lost Foxa2 sites (Supplemental Figure 11 and Figure 9F), a significantly reduced mobilization of this factor was observed for only 1 (#4.7) out of 10 tested conserved Foxa2 BSs (Figure 9F). We hypothesize that the highly heterogeneous enrichments obtained for the different samples may have hindered the detection of possible differences. Importantly, although our microarray data indicated that Foxa2 mRNA expression was 10% lower in ERKO livers, this regulation was neither systematic nor significant as assessed by independent RT-qPCR and Western blotting experiments (Supplemental Figure 3 and Supplemental Figure 12).
Figure 9. The Foxa2 cistrome is partially ER dependent.

A, Foxa2 ChIP-seq experiments were performed on chromatin prepared from E2-treated ERWT and ERKO livers. As carried out previously, we systematically used different thresholds to determine the number of Foxa2 BSs in each of the experimental conditions (orange and gray lines for ERWT and ERKO animals, respectively). The number of ER BSs in ERWT (red curve) is given as reference. The color code used in A is the same for the next ones. B, Overlap of the different Foxa2 cistromes at diverse P values with ER BSs or Foxa2 BSs determined in E2-treated ERWT livers (left and middle graphs), or Foxa2 BSs in E2-treated ERKO livers (right). C, Venn diagram illustrating the overlap of ER BSs with Foxa2 BSs in ERWT or ERKO mice at the chosen P = 10−4. D, Heatmap of Foxa2 normalized ChIP-seq signals obtained from ERWT or ERKO chromatin on conserved, lost, or gained Foxa2 BSs. E, Mean Foxa2 ChIP-seq signals obtained in ERWT or ERKO mouse livers (orange or gray bars, respectively) at the 150 center base pairs of Foxa2 BSs. The upper histogram shows mean values ± SD measured for conserved, gained, or lost sites. Calculations were also carried out for 10 different sets of a corresponding number of random sites. Means ± SD of these 10 random trials are illustrated within the bottom histogram. F, Anti-Foxa2 ChIP-qPCR experiments were performed on 4 liver chromatin samples originating from independent E2-treated ERWT or ERKO mice. A fraction of the pooled DNA sample that was subjected to HTS was also evaluated in parallel. The upper heatmap shows the values obtained on indicated tested genomic regions normalized to those obtained from a nonspecific control (promoter of the Rplp0 gene) and to the control ChIP sample. Significant reduced (green) or gained (red) mobilization of Foxa2 in ERKO livers is indicated in the lower heatmap. Calculated P values from Mann-Whitney t tests are indicated as follows: *, P < .05; **, P < .01.
Variations in the H3K4me2 content of nucleosomes included in lost Foxa2 BSs
To better comprehend the possible events occurring at Foxa2 BSs in ERKO vs ERWT livers, we used our ERWT and ERKO H3K27ac and H3K4me2 ChIP-seq data to determine the relative genome-wide enrichment of Foxa2 BSs in these chromatin modifications that indicate active/poised enhancers. As described previously for lost ER BSs, changes were observed only at Foxa2 BSs located within putative enhancers (data not shown). We therefore focused our analysis on BSs situated more than 5 kb from any annotated gene promoter and aligned the mean H3K4me2 and H3K27ac ChIP-seq signals to these sites (Figure 10A). Data obtained indicate that there was a loss of the biphasic shape of enrichment in H3K4me2 in ERKO compared with ERWT mice at these lost Foxa2 BSs (seen enlarged view in Figure 10A). In contrast, both the shape and level of enrichment of these sites in H3K27ac were unaffected (Figure 10A). To evaluate a possible direct link between ER expression and these changes in chromatin modifications at Foxa2 BSs, we subdivided lost Foxa2 BSs into those which concomitantly recruited ER or those which did not (Figure 10B). In contrast to their unchanged H3K27ac levels, we observed that the enrichment of both categories of sites in H3K4me2 was lower in ERKO livers compared with ERWT. Importantly, this was also associated with the disappearance of the biphasic shape of H3K4me2 enrichment (Figure 10B), a biphasic-to-monophasic change that was observed neither at conserved Foxa2 BSs nor at novel ones (Figure 10A). This demonstrated that the observed changes were not generated due to a bias of the normalization of the ChIP-seq signals but rather reflected a significant change in the enrichment of nucleosomes surrounding or centered on lost Foxa2 BSs in H3K4me2. Furthermore, such a change in shape was not observed at the BSs determined in mouse liver for other transcription factors such as Ctcf, Pparα, Rxrα, GR, and Esrrα (data not shown).
Figure 10. Chromatin status of Foxa2 BSs in ERWT and ERKO mouse livers.

A and B, Alignment of mean H3K4me2 (left side of the panel) or H3K27ac signals on categorized Foxa2 BSs. Insets represent magnified views of the center of the graphs and illustrate the observed shift from biphasic to monophasic curves of enrichment in H3K4me2. C, Heatmap representation of results obtained in independent anti-H3K4me1, H3K4me2, and H3K27ac ChIP-qPCR experiments. The presence of these marks was followed in livers from ERWT and ERKO animals (numbers on the right refer to individuals) at the indicated conserved or lost Foxa2 BSs. Experiments were done twice per individual. Mean fold enrichment values shown are expressed as relative to a control negative ChIP experiment using the same chromatin samples. D, Summary of MeDIP- and hMeDIP-qPCR assays, illustrated as in B. The values included within these graphs were obtained in 3 independent experiments performed on 2 different DNA samples originating from 2 different ERWT or ERKO animals. Significant reduced (green) or gained (red) enrichment in histone marks or DNA modifications in ERKO livers are indicated in the lower heatmaps. Calculated P values from Mann-Whitney t tests are indicated as follows: *, P < .05; **, P < .01.
Independent ChIP-qPCR experiments (data and statistics provided in Supplemental Figure 10) after the enrichment of some Foxa2 BSs in H3K4me1 and H3K4me2 mostly recapitulated the conclusions obtained from genome-wide studies, ie, that there is a reduction in the amount of methylated H3K4 in nucleosomes surrounding lost Foxa2 BSs in livers from ERKO mice (Figure 10C). These effects were small, which may reflect the slight reduction observed in the amplitude of the mean profiles of the whole-genome data. Furthermore, due to the limited resolution of ChIP-qPCR experiments, the transition from a biphasic to monophasic distribution over a 1.5- to 2-kb window may have little or even no impact on the qPCR-mediated amplification of a DNA fragment located within a Foxa2 BS. Interestingly, we also observed a reduction in the acetylation of H3K27 on 4 of these sites, which was not expected from the whole-genome ChIP-seq data. MeDIP evaluation of the 5mC amounts present within lost Foxa2 BSs also showed no variations between ERWT and ERKO livers (Supplemental Figure 10 and Figure 10D). Altogether, these data indicate that the Foxa2-positive enhancers that were lost in ERKO livers did not undergo complete chromatin closure. This conclusion is reinforced by the fact that only 2 of the 15 tested Foxa2 BSs (#4.6 and #1.2) had reduced amounts of 5hmC in ERKO livers (Figure 10D).
Liver-specific transcription factor networks may secure Foxa2 cistrome
In order to gain further insights into the mechanisms responsible for the loss of Foxa2 BSs in ERKO liver, we next examined whether particular transcription factors could either protect the conserved Foxa2 BSs from loss, or be responsible for the loss. Reassuringly, the most enriched motifs in each group were those recognized by Foxa2 and other members of the forkhead family of TFs (Table 4; example Wordle picture is given in Figure 11A for lost Foxa2 BSs; full analysis is provided within Supplemental File 3). Besides forkhead motifs, the sequences of the 3 Foxa2 BSs' category included similar sets of motifs for TF binding. The most frequently identified sequences were those recruiting CEBP, HNF4α, and other NRs such as RXR, RAR, NR1D1/D2, or the tumor suppressor NKX3-1. Importantly, CEBPA/B and HNF4α are known “liver-enriched” transcription factors (78–80). When examined more precisely, 38 or 68 motifs were specifically identified within lost or conserved Foxa2BSs, respectively (Supplemental Figure 13). However, the different sets of TFs binding to these specific motifs do not create networks that can be associated with specific functions, as evaluated by their annotations through STRING (81; see Supplemental Figure 13). Furthermore, the expression levels of the transcription factors associated with these DNA sequences were not significantly affected by the inactivation of the Esr1 gene (Supplemental Figure 13).
Table 4.
Enriched DNA Motifs in Categorized Foxa2 BSs
| Conserved |
Gained |
Lost |
|||
|---|---|---|---|---|---|
| Factor | Z-Score | Factor | Z-Score | Factor | Z-Score |
| Foxa2 | −91.617 | Foxa2 | −23.414 | Foxa2 | −59.79 |
| FOXA1 | −90.958 | FOXA1 | −23.058 | FOXA1 | −59.536 |
| FOXI1 | −81.908 | FOXI1 | −22.795 | FOXI1 | −56.216 |
| Foxg1 | −80.449 | FOXB1 | −21.524 | Foxg1 | −54.751 |
| FOXB1 | −78.905 | FOXP1 | −21.512 | FOXP1 | −52.788 |
| FOXP1 | −78.788 | Foxg1 | −21.297 | Nkx3-1 | −52.633 |
| FOXD2 | −75.482 | Foxk1 | −20.161 | FOXB1 | −50.984 |
| FOXD3 | −74.081 | FOXL1 | −19.777 | FOXL1 | −50.971 |
| FOXL1 | −73.89 | FOXD2 | −19.095 | FOXD2 | −48.341 |
| Nkx3-1 | −72.907 | Nkx3-1 | −18.785 | FOXD3 | −47.994 |
| Foxk1 | −72.123 | FOXD3 | −18.614 | Foxk1 | −47.988 |
| FOXD1 | −70.968 | FOXD1 | −17.878 | FOXD1 | −46.354 |
| FOXC2 | −67.3 | FOXP3 | −17.007 | FOXP3 | −44.639 |
| FOXC1 | −66.927 | FOXO3 | −16.517 | FOXO3 | −43.621 |
| FOXO3 | −66.241 | FOXC2 | −15.411 | FOXC2 | −39.98 |
| FOXP3 | −64.662 | FOXC1 | −14.102 | FOXC1 | −35.118 |
| FOXF2 | −51.748 | FOXF2 | −13.535 | FOXF2 | −34.484 |
| Foxj1 | −51.576 | CEBPD | −12.481 | Foxj1 | −33.619 |
| FOXJ3 | −45.412 | Cebpb | −12.292 | Foxf1a | −29.292 |
| Foxf1a | −40.616 | CEBPE | −12.152 | FOXJ3 | −26.531 |
| FOXH1 | −32.447 | Cebpa | −11.812 | FOXH1 | −22.446 |
| CEBPE | −27.482 | Foxj1 | −11.6 | Hnf4α | −15.71 |
| Cebpb | −27.19 | CEBPG | −11.278 | Cebpb | −15.134 |
| CEBPA | −26.856 | FOXJ3 | −9067 | CEBPA | −14.552 |
| CEBPD | −26.765 | Foxf1a | −8978 | CEBPE | −14.418 |
| HNF4A | −26.219 | Hnf4α | −8801 | CEBPD | −14.338 |
| Foxq1 | −24.216 | FOXH1 | −8068 | CEBPG | −13.844 |
| CEBPG | −22.81 | RXRB | −7845 | NR2C2 | −13.376 |
| FOXG1 | −19.912 | RXRA | −7.44 | Rxrb | −12.575 |
| NR2C2 | −19.459 | NR2F6 | −7128 | NR2F1 | −11.973 |
| FOXJ2 | −19.292 | PPARA | −7113 | Ppara | −11.972 |
| RXRB | −19.023 | HLF | −7.05 | NR2F6 | −11.776 |
| NR2F6 | −18.985 | NFIL3 | −6.95 | NR1H4 | −11.079 |
| RARA | −17.842 | RARA | −6798 | Nr1d2 | −10.656 |
| NR2F1 | −17.813 | NR2C2 | −6428 | RARA | −10.297 |
| Nr2f2 | −16.99 | DBP | −6041 | Foxq1 | −10.091 |
| NR1H4 | −16.511 | Nr1d2 | −5836 | FOXJ2 | −9851 |
| NR2E3 | −16.142 | ATF4 | −5821 | Rxra | −9762 |
| NR4A1 | −16.003 | NR1H4 | −5659 | NFIX | −9739 |
| Nr1d2 | −15.912 | NR2F1 | −5438 | Nr2f2 | −9385 |
| Ppara | −15.867 | ZSCAN4 | −5432 | ZSCAN4 | −9131 |
| SRY | −15.493 | Pparg | −4988 | NFIC | −8927 |
| ZNF435 | −15.351 | Nr2f2 | −4944 | FOXO6 | −8.69 |
| NFIL3 | −15.241 | Creb5 | −4864 | Zscan10 | −8445 |
| ESRRA | −15.067 | NFIB | −4757 | NR4A1 | −8393 |
| ATF4 | −14.596 | ATF7 | −4756 | ESRRA | −8372 |
| FOXO4 | −14.388 | TEF | −4756 | NFIB | −8199 |
| FOXO6 | −13.684 | NR2E1 | −4534 | HEY1 | −8186 |
| NFIC | −13.639 | Foxq1 | −4379 | NR2E3 | −8143 |
| Rxra | −13.167 | NFIX | −4329 | Esrrb | −8116 |
Motif analysis was performed using SeqPos algorithm (http://cistrome.org/ap/). Sequences were declared enriched by when P < .05 and Z-score > 2.5. Only the best 50 sequences characterized are shown. Full analyses are depicted in the Supplemental File 3.
Figure 11. Multiple TFs may protect Foxa2 BSs from loss of function in ERKO livers.

A, Wordle graphics (http://www.wordle.net/website) of enriched motifs for transcription factors binding within lost Foxa2 BSs; as determined by the SeqPos algorithm (http://cistrome.org/ap/). B, Overlap of categorized Foxa2 BSs with the cistromes of different transcription factors, all determined in mouse liver except Nkx3-1 BSs, which were identified in mouse prostate.
Finally, we compared our different categories of Foxa2 BSs with the available cistromes of other TF determined by others in mouse livers. Those included Cebpα and Cebpβ, Hnf4α, other nuclear receptors, repressive coregulators (Hdac and Ncor1) and Ctcf. We also included Nkx3-1 in our analyses, because its motif was the most enriched in all Foxa2 BSs categories following forkhead (FKH) motifs. Furthermore, NKX3-1 was demonstrated to act as an inhibitor of ER activity in human cancer cells (82). Note, however, that the only available cistrome of this factor in mouse was determined in prostate. We also integrated a Foxa1 cistrome, although it may not be totally specific and include Foxa2 BSs. Strikingly, we observed that the overlaps of the conserved Foxa2 BSs with the cistromes of Foxa1, ER, Hnf4α, Nkx3-1, Cebpα, Cebpβ, and Rxrα were significantly higher as compared with what was observed for lost or gained Foxa2 BSs (Figure 11B). This indicates that the binding of (at least) 1 of these other TFs, excluding ER of course, to genomic regions may help to preserve Foxa2 binding at these sequences. Interestingly, Hnf4α, Cebpα, and Cebpβ were also found to be more often recruited on sites conserving their H3K4me2 or H3K27ac levels rather than on genomic regions with reduced or gained enrichment in these chromatin marks in ERKO livers (Supplemental Figure 14). This suggests that this combination of factors may generally prevent changes of chromatin functionality to occur on the sites they engage in ERKO livers.
Discussion
The objectives of this study were dual: 1) to identify mechanisms of actions of hepatic ER in vivo and in particular to test whether it can exert some influence in the absence of its ligand; and 2) to characterize short-term changes in liver response to estrogens after acute E2 administration that could explain how E2 could have opposite influences in liver.
Indeed, a number of studies have demonstrated in rodents that E2 has protective roles against metabolic abnormalities: ovariectomy, whole-body ERKO, and aromatase KO, are all associated with increased body weight, impaired glucose tolerance, insulin resistance, and liver steatosis (23, 24, 83). In contrast, the administration of estrogens by the oral route prescribed for contraception or for hormonal replacement therapy at menopause is associated with an increased risk of venous thrombosis and pulmonary embolism, presumably due to the impact of E2 on liver coagulation factor expression or activity. Here, we characterized in mouse liver sets of E2- and ER-dependent genes which were associated with lipogenesis but none with coagulation. Accordingly, the genes predicted to be controlled by enhancer regions losing or gaining the active chromatin marks H3K4me2 and H3K27ac in ERKO livers were associated with liver-specific functions (Supplemental Figure 8). These observations tied in with the crucial role of ER in E2-mediated prevention of liver steatosis in mice fed with HFD. They also highlight species differences in the regulation of coagulation factors by E2 between human and mouse (84). We observed that 48 of the 110 E2-regulated genes identified here were also regulated after chronic estrogen treatment for 3 days (36). This number drastically decreased to only 2 common genes after a 2-week treatment (37) or even 1 when comparing our list with a dataset generated from isolated liver cells (33). This latter observation could be explained by the adaptation of the liver cell transcriptome after cell culture, a transcriptome that also depends on the culture conditions (85, 86). These differences between the estrogen-sensitive transcriptomes after chronic or acute treatment of hormones indicate that each mode of administration or time of treatment has a differential physiological impact.
Using conditions of short-term E2 administration and freshly dissected liver, we detected ER binding to less than 4000 genomic regions by ChIP-seq. This contrasts with the much larger ER cistromes determined in cultured human mammary cell lines such as MCF-7 cells (11, 12). Interestingly, although we used chromatin prepared from livers treated for different times, our data are in agreement with some other studies that have also found limited ER cistromes in liver (43, 58). Furthermore, it is tempting to speculate that this limited number of ER BSs could be the cause of the lower number of E2-regulated genes identified here in liver as compared with classical in vitro model such as cultured MCF-7 cells (up to 1500 regulated genes; see 34, 87). A large set of ER BSs was also determined in isolated mouse liver cells (33), which presented 3-fold more E2-sensitive genes than determined here after acute E2 treatment of liver. Importantly, although approximately 2-fold less numerous, 60% of the E2-bound ER BSs determined here were in common with those determined in (33). As discussed above, the discrepancy in the number of ER BSs could also be a direct consequence of the conditions of E2-treatment or liver cell differentiation. These conditions might, for instance, influence the expression of chaperone proteins such as p23, whose overexpression in MCF-7 breast cancer cells is reported to enhance the number of ER BSs (88). However, we determined that 72% of the 5526 ER BSs identified by our pipeline using a ChIP-seq dataset generated from the liver of nonovariectomized females (20) were in common with the different ER cistromes determined in E2-treated livers from ovariectomized females (Supplemental Figure 4). This suggests that the ER cistrome may present some robustness in liver, contrasting with an intrinsically more versatile hepatic transcriptome generated by 1) a cellular heterogeneity; and 2) a high number of individual-specific regulatory influences (metabolic/detoxification…). Importantly, as is the case for all other reported ER cistromes in liver, a significant fraction of the ER BSs identified here were found to be located in relatively close proximity to E2 regulated genes (7%–12%), compared with MCF-7 data (2%). A general consequence of the organization of the genome within the nucleus is the existence of chromatin loops (89) that link distant regulatory elements such as ER BSs to their target genes (90) within large (1 Mb) topologically associating chromatin domains (91). Although long-range interactions between enhancers and gene promoters do of course exist in mouse liver (92, 93), our data point to the hypothesis that their multiplicity and possible functional redundancy (34, 94) might be curtailed in vivo for E2-transcriptional responses within this tissue. This could also be true in the uterus, in which almost 16% of the ER BSs were located < 3 kb from gene TSSs (Supplemental Figure 7) (41). Additionally, enhanced stability of the loops between enhancers and TSSs may also increase the number of detected binding events at promoters, which would have to be considered as phantom imprints of this stable chromatin organization. However, the observed enrichment of these proximal ER BSs in motifs that are able to directly recruit ER (EREs, AP1, or Sp1) partly excludes this hypothesis.
We have also determined that ER could be detected at approximately 850 ER BSs in untreated livers from ovariectomized female mice, 40% of them also being engaged by ER in the presence of E2. However, the existence and functionality of the remaining 476 P-specific ER BSs remains unclear. These P-specific sites were not found enriched at the proximity of genes whose expression was repressed by E2, and less than 2% of them were located closer than 10 kb from the TSS of any annotated gene (data not shown). Furthermore, independent ChIP assays performed with an antibody directed against the N-terminal region of ER were able to confirm an ER commitment at only 5 of the 19 randomly chosen regions falling into the P-specific condition. This could reflect a problem of specificity of the antibody directed against the C-terminal region of the protein, because it was able to purify 40 genomic regions supposedly binding to ER in ERKO livers. Alternatively, the epitopes targeted by the anti-N-terminal antibody may be less accessible than those recognized by the C-terminal antibody, although the recent structure of a DNA-bound ER complexed with cofactors would suggest the opposite (95). Finally, we can also postulate that the P-specific ER BSs may specifically recruit the ERα 46 or ERα 36 isoforms of ER which are devoid of its N-terminal region and are known to be expressed in mouse liver (96–98). Investigating this hypothesis will require the whole-genome cartography of the binding events of these isoforms to be established using specific antibodies combined with the generation of corresponding mouse models expressing only 1 of the 3 ER isoforms.
Comparing the transcriptomes and the distribution of H3K4me2 and H3K27ac chromatin marks within the genome of ERWT and ERKO livers raised several novel insights into the roles of ER in mouse liver. First, from a chromatin point of view, we observed that the enrichment of genes promoters in active marks globally paralleled their differential expression in ERKO as compared with ERWT livers. This correlation was slightly more important for up-regulated than down-regulated genes, suggesting that chromatin changes accompanying genes with higher transcriptional activity are more drastic than those observed for genes with reduced activity. Second, among the 129 genes differently expressed in the livers of ERKO vs ERWT mice, only 10 were also regulated by E2 in ERWT. On the one hand, this observation could reflect the fact that the remaining 119 genes are indirectly regulated by ER, ie, that 1 or more proteins or RNAs regulated by ER and/or E2 is required for the correct expression of these genes. Note that this faulty regulatory component could be expressed in the liver itself, but because we used whole-body ERKO mice, it could also be expressed in other organs and indirectly influence the signaling cascades in the liver. This hypothesis is supported by the fact that these genes do not have any ER BSs in their vicinity. On the other hand, this observation also indicates that ER is not absolutely required for the basal expression of most the E2-sensitive genes in the liver. This demonstrates in vivo that ER has to be considered as a regulator of transcription rather than a required factor for the transcription of these genes. Such a conclusion can also be drawn from our MeDIP-qPCR and H3K4me2/H3K27ac ChIP-seq data, which demonstrated that ER is not required per se for the establishment and/or maintenance of chromatin modifications at most its BSs. Moreover, we found that ER BSs with reduced chromatin functionality in ERKO are less frequently associated with the liver master regulator Hnf4α (76–80).
These observations pointing at a secondary role of ER for the functionality of liver chromatin are also perfectly compatible with the notion that ER and other TFs act subsequent to the required preliminary actions of pioneering factors such as FOXA proteins, or other partners such as GATA factors, C/EBP, etc (15, 99, 100), which determine the functionalization and accessibility of chromatin. However, contrasting with this pioneering view, we found that Foxa2 mobilization was affected in ERKO livers, even at ER-negative Foxa2 BSs identified in ERWT mice. Importantly, independent RT-qPCR or Western blotting experiments did not consistently reproduce the 10% drop in Foxa2 expression in ERKO livers detected by our microarray data. It is possible that the heterogeneity of the liver transcriptome and its dependence on the mouse diet may have hindered the detection of variations in Foxa2 expression. To get further information on a putative ER-mediated regulation of Foxa2, we hypothesized that if ER was controlling the expression of Foxa2 there might be genes regulated in the same way in ERKO and Foxa2 KO mice. Comparison of our dataset with those available for a liver-specific double Foxa1/Foxa2 KO (22) revealed that 21 of the 721 Foxa-dependent mRNAs also had reduced expression in ERKO mice (data not shown). These genes exhibited no annotation towards a specific pathway or biological process. Although we cannot formerly exclude the possibility that Foxa2 expression may be influenced by the loss of ER expression, so far, there is no clear evidence of a particular functional consequence of this putative direct relationship.
However, a 10% drop in Foxa2 expression may not be sufficient to explain a 50% loss in Foxa2 BSs. An in depth motif analysis associated with a comparison of Foxa2 BSs with the available cistromes of other TFs allowed us to provide an hypothetical model in which the binding of a network of other TFs on shared BSs may protect these sites from totally losing Foxa2 engagement and chromatin functionality. These factors are Hnf4α, Nkx3-1, Cebpα, Cebpβ, and Rxrα and possibly Foxa1. Although we cannot ascertain the perfect specificity of our Foxa1 cistrome because of antibodies cross-reactivity with Foxa2, it may be interesting to note that 188 putative “ERKO-specific” Foxa1 sites were determined as lost Foxa2 BSs (data not shown). Interestingly, we also determined that regions that totally lost their central H3K4me2-enriched nucleosome were including DNA recognition motifs for Tead and Tfap2a factors (Supplemental Figure 14 and Supplemental File S5). AP2 is a pioneer factor, and may exert here a direct function in controlling chromatin opening. Tead factors, and in particular Tead2 are involved in Foxa2/Hnf4α enhancer selection during hepatocyte differentiation (76). These 2 factors may therefore be integrated into the network of TFs that protect against chromatin changes in ERKO livers. However, whether these factors direct the mobilization of chromatin modifiers that specifically prevent Foxa2 disengagement remains to be directly evaluated. Candidate modifiers could be proposed from our H3K4me2 ChIP-seq data showing a shift from a biphasic to a perfectly centered monophasic shape on some ER BSs and lost Foxa2 BSs. Two mechanisms could explain these observations: either the central nucleosome is preferentially modified by an H3K4 methylase in ERKO livers (or the adjacent ones are not modified at all), or the absence of ER or Foxa2 directly or indirectly affects nucleosome positioning. In MCF-7 cells, ER genomic activity was shown to depend on the H3K methylases SET and MYND domain containing 3 (SMYD3), SET domain containing 1a (SETD1A), myeloid/lymphoid or mixed-lineage leukemia protein 1 (MLL1), or MLL2 (10, 101–104), and even on its direct methylation by SMYD2 (105, 106). However, mRNA encoding the orthologs of these proteins did not exhibit significant changes in ERKO relative to ERWT livers (data not shown). The same was also true concerning the expression of histone chaperones involved in nucleosome positioning and dynamics, such as Supt16 and Ssrp1, components of FACT (107), or Supt6 and nucleolin (108).
In conclusion, we have demonstrated here that the actions of ER and the acute administration of E2 in mouse liver in vivo have particular characteristics. Another important outcome of this study is the fact that ER is not absolutely required for the basal expression of most the E2-sensitive genes in the liver and that it appears to be dispensable for the establishment and/or maintenance of chromatin modifications at most its BSs, where other TFs such as Hn4α may preserve functional competence. In contrast, ER was found required for the binding of the Foxa2 factor. Taken together, together, our results indicate that the loss of ER expression in livers from ERKO mice affects the distribution of H3K4me2-enriched nucleosomes around both ER BSs and Foxa2 BSs. The underlying mechanisms still remain to be understood, although they are likely independent of the transcriptional regulation of chromatin actors. Importantly, besides its genomic influences, ER exerts membrane- and/or cytoplasmic-based actions on intracellular kinase transduction pathways (109). Hence, it would be interesting to test whether ER could regulate the activity of Foxa2 or H3K4 methylases at the posttranslational level in liver using specific mouse models expressing ER forms devoid of either nuclear-based (110, 111) or membrane-based (112, 113) regulatory abilities.
Acknowledgments
We thank the staff of the animal facilities of the “Plateforme d'experimentation fonctionnelle” (A. Desquesnes) in Toulouse, M. Buscato, and F. Boudou for skillful technical assistance; S. Vicaire, S. Le Gras, M. Philipps, and B. Jost for their indispensable help and work on generating the HTS data at the IGBMC Microarray and Sequencing platform at Illkirch; and Y. Lippi and P. Martin for the excellent contribution to microarray analysis carried out at the GeT-TRIX Genopole Toulouse facility.
Work performed at the UMR Centre National de la Recherche Scientifique 6290 was supported by the Centre National de la Recherche Scientifique, the University of Rennes I, and by grants from the Association pour la Recherche Contre le Cancer, the Ligue Contre le Cancer (Equipe Labelisée Ligue 2009), the Région Bretagne (CREATE 4793), and the Agence Nationale pour la Recherche (ANR-09-BLAN-0268-01). Support for the work carried out at Inserm U1085 was obtained from the Inserm, the University of Rennes I, and the Ligue Contre le Cancer. The work at the Inserm U1048 was supported by the Inserm, University of Toulouse III, Faculty of Medecine Toulouse-Rangueil, Fondation de France, Conseil Régional Midi-Pyrénées, and Fondation pour la Recherche Médicale. Sequencing performed by the IGBMC Microarray and Sequencing platform was supported by the French Government National Infrastructure, funded as part of the Investissements d'Avenir program managed by the Agence Nationale pour la Recherche (ANR-10-INBS-0009).
Disclosure Summary: The authors have nothing to disclose.
Funding Statement
Work performed at the UMR Centre National de la Recherche Scientifique 6290 was supported by the Centre National de la Recherche Scientifique, the University of Rennes I, and by grants from the Association pour la Recherche Contre le Cancer, the Ligue Contre le Cancer (Equipe Labelisée Ligue 2009), the Région Bretagne (CREATE 4793), and the Agence Nationale pour la Recherche (ANR-09-BLAN-0268-01). Support for the work carried out at Inserm U1085 was obtained from the Inserm, the University of Rennes I, and the Ligue Contre le Cancer. The work at the Inserm U1048 was supported by the Inserm, University of Toulouse III, Faculty of Medecine Toulouse-Rangueil, Fondation de France, Conseil Régional Midi-Pyrénées, and Fondation pour la Recherche Médicale. Sequencing performed by the IGBMC Microarray and Sequencing platform was supported by the French Government National Infrastructure, funded as part of the Investissements d'Avenir program managed by the Agence Nationale pour la Recherche (ANR-10-INBS-0009).
Footnotes
- AP
- activating protein
- BS
- binding site
- Cebp
- CCAAT/enhancer-binding protein
- ChIP
- Chromatin Immunoprecipitation
- CTCF
- CCCTC-binding factor
- E2
- 17β-estradiol
- ER
- estrogen receptor-α
- ERE
- Estrogen responsive element
- ERKO
- ER knockout
- Esrr
- Estrogen-related receptor
- GR
- glucocorticoid receptor
- HDAC3
- histone deacetylase 3
- HFD
- high-fat diet
- hMeDIP
- hydroxy-MeDIP
- Hnf4α
- hepatocyte nuclear factor 4α
- HTS
- high-throughput sequencing
- MeDIP
- methylated DNA immunoprecipitation
- NCor1
- nuclear corepressor 1
- NKx3–1
- NK3 Homeobox 1
- P
- placebo
- Ppar
- peroxisome proliferator-activated receptor
- qPCR
- real-time PCR (polymerase chain reaction)
- RAR
- retinoic acid receptor
- Rxr
- retinoid X receptor
- SP1
- specificity protein 1
- Tead
- TEA domain family member 1
- TSS
- transcriptional start site
- WT
- wild type.
References
- 1. Couse JF, Korach KS. Estrogen receptor null mice: what have we learned and where will they lead us? Endocr Rev. 1999;20:358–417. [DOI] [PubMed] [Google Scholar]
- 2. McEwan IJ. Nuclear receptors: one big family. Methods Mol Biol. 2009;505:3–18. [DOI] [PubMed] [Google Scholar]
- 3. Lenfant F, Trémollières F, Gourdy P, Arnal JF. Timing of the vascular actions of estrogens in experimental and human studies: why protective early, and not when delayed? Maturitas. 2011;68:165–173. [DOI] [PubMed] [Google Scholar]
- 4. Carroll JS, Brown M. Estrogen receptor target gene: an evolving concept. Mol Endocrinol. 2006;20:1707–1714. [DOI] [PubMed] [Google Scholar]
- 5. Eeckhoute J, Métivier R, Salbert G. Defining specificity of transcription factor regulatory activities. J Cell Sci. 2009;122:4027–4034. [DOI] [PubMed] [Google Scholar]
- 6. Magnani L, Eeckhoute J, Lupien M. Pioneer factors: directing transcriptional regulators within the chromatin environment. Trends Genet. 2011;27:465–474. [DOI] [PubMed] [Google Scholar]
- 7. Shang Y, Hu X, DiRenzo J, Lazar MA, Brown M. Cofactor dynamics and sufficiency in estrogen receptor-regulated transcription. Cell. 2000;103:843–852. [DOI] [PubMed] [Google Scholar]
- 8. Métivier R, Penot G, Hübner MR, et al. Estrogen receptor-α directs ordered, cyclical, and combinatorial recruitment of cofactors on a natural target promoter. Cell. 2003;115:751–763. [DOI] [PubMed] [Google Scholar]
- 9. Zwart W, Theodorou V, Kok M, Canisius S, Linn S, Carroll JS. Oestrogen receptor-co-factor-chromatin specificity in the transcriptional regulation of breast cancer. EMBO J. 2011;30:4764–4776. [DOI] [PMC free article] [PubMed] [Google Scholar]
- 10. Won Jeong K, Chodankar R, Purcell DJ, Bittencourt D, Stallcup MR. Gene-specific patterns of coregulator requirements by estrogen receptor-α in breast cancer cells. Mol Endocrinol. 2012;26:955–966. [DOI] [PMC free article] [PubMed] [Google Scholar]
- 11. Carroll JS, Meyer CA, Song J, et al. Genome-wide analysis of estrogen receptor binding sites. Nat Genet. 2006;38:1289–1297. [DOI] [PubMed] [Google Scholar]
- 12. Welboren WJ, Sweep FC, Span PN, Stunnenberg HG. Genomic actions of estrogen receptor α: what are the targets and how are they regulated? Endocr Relat Cancer. 2009;16:1073–1089. [DOI] [PubMed] [Google Scholar]
- 13. Hah N, Murakami S, Nagari A, Danko CG, Kraus WL. Enhancer transcripts mark active estrogen receptor binding sites. Genome Res. 2013;23:1210–1223. [DOI] [PMC free article] [PubMed] [Google Scholar]
- 14. Li W, Notani D, Ma Q, et al. Functional roles of enhancer RNAs for oestrogen-dependent transcriptional activation. Nature. 2013;498:516–520. [DOI] [PMC free article] [PubMed] [Google Scholar]
- 15. Zaret KS, Carroll JS. Pioneer transcription factors: establishing competence for gene expression. Genes Dev. 2011;25:2227–2241. [DOI] [PMC free article] [PubMed] [Google Scholar]
- 16. Cirillo LA, Zaret KS. An early developmental transcription factor complex that is more stable on nucleosome core particles than on free DNA. Mol Cell. 1999;4:961–969. [DOI] [PubMed] [Google Scholar]
- 17. Cirillo LA, Lin FR, Cuesta I, Friedman D, Jarnik M, Zaret KS. Opening of compacted chromatin by early developmental transcription factors HNF3 (FoxA) and GATA-4. Mol Cell. 2002;9:279–289. [DOI] [PubMed] [Google Scholar]
- 18. Soufi A, Garcia MF, Jaroszewicz A, Osman N, Pellegrini M, Zaret KS. Pioneer transcription factors target partial DNA motifs on nucleosomes to initiate reprogramming. Cell. 2015;161:555–568. [DOI] [PMC free article] [PubMed] [Google Scholar]
- 19. Hurtado A, Holmes KA, Ross-Innes CS, Schmidt D, Carroll JS. FOXA1 is a key determinant of estrogen receptor function and endocrine response. Nat Genet. 2011;43:27–33. [DOI] [PMC free article] [PubMed] [Google Scholar]
- 20. Li Z, Tuteja G, Schug J, Kaestner KH. Foxa1 and Foxa2 are essential for sexual dimorphism in liver cancer. Cell. 2012;148:72–83. [DOI] [PMC free article] [PubMed] [Google Scholar]
- 21. Zhao Y, Li Z. Interplay of estrogen receptors and FOXA factors in the liver cancer. Mol Cell Endocrinol. 2015;418(pt 3):334–339. [DOI] [PMC free article] [PubMed] [Google Scholar]
- 22. Li Z, Schug J, Tuteja G, White P, Kaestner KH. The nucleosome map of the mammalian liver. Nat Struct Mol Biol. 2011;18:742–746. [DOI] [PMC free article] [PubMed] [Google Scholar]
- 23. Zhu L, Brown WC, Cai Q, et al. Estrogen treatment after ovariectomy protects against fatty liver and may improve pathway-selective insulin resistance. Diabetes. 2013;62:424–434. [DOI] [PMC free article] [PubMed] [Google Scholar]
- 24. Han SI, Komatsu Y, Murayama A, et al. Estrogen receptor ligands ameliorate fatty liver through a nonclassical estrogen receptor/Liver X receptor pathway in mice. Hepatology. 2014;59:1791–1802. [DOI] [PubMed] [Google Scholar]
- 25. Tchaikovski SN, Rosing J. Mechanisms of estrogen-induced venous thromboembolism. Thromb Res. 2010;126:5–11. [DOI] [PubMed] [Google Scholar]
- 26. Canonico M, Oger E, Plu-Bureau G, et al. Hormone therapy and venous thromboembolism among postmenopausal women: impact of the route of estrogen administration and progestogens: the ESTHER study. Circulation. 2007;115:840–845. [DOI] [PubMed] [Google Scholar]
- 27. van Nas A, Guhathakurta D, Wang SS, et al. Elucidating the role of gonadal hormones in sexually dimorphic gene coexpression networks. Endocrinology. 2009;150:1235–1249. [DOI] [PMC free article] [PubMed] [Google Scholar]
- 28. Pedram A, Razandi M, O'Mahony F, Harvey H, Harvey BJ, Levin ER. Estrogen reduces lipid content in the liver exclusively from membrane receptor signaling. Sci Signal. 2013;6:ra36. [DOI] [PubMed] [Google Scholar]
- 29. Matic M, Bryzgalova G, Gao H, et al. Estrogen signalling and the metabolic syndrome: targeting the hepatic estrogen receptor α action. PLoS One. 2013;8:e57458. [DOI] [PMC free article] [PubMed] [Google Scholar]
- 30. Dupont S, Krust A, Gansmuller A, Dierich A, Chambon P, Mark M. Effect of single and compound knockouts of estrogen receptors α (ERα) and β (ERβ) on mouse reproductive phenotypes. Development. 2000;127:4277–4291. [DOI] [PubMed] [Google Scholar]
- 31. Zhang B, Kirov S, Snoddy J. WebGestalt: an integrated system for exploring gene sets in various biological contexts. Nucleic Acids Res. 2005;33:W741–W748. [DOI] [PMC free article] [PubMed] [Google Scholar]
- 32. Barrett T, Troup DB, Wilhite SE, et al. NCBI GEO: archive for high-throughput functional genomic data. Nucleic Acids Res. 2009;37:D885–D890. [DOI] [PMC free article] [PubMed] [Google Scholar]
- 33. Gordon FK, Vallaster CS, Westerling T, Iyer LK, Brown M, Schnitzler GR. Research resource: aorta- and liver-specific ERα-binding patterns and gene regulation by estrogen. Mol Endocrinol. 2014;28:1337–1351. [DOI] [PMC free article] [PubMed] [Google Scholar]
- 34. Quintin J, Le Péron C, Palierne G, et al. Dynamic estrogen receptor interactomes control estrogen-responsive trefoil factor (TFF) locus cell-specific activities. Mol Cell Biol. 2014;34:2418–2436. [DOI] [PMC free article] [PubMed] [Google Scholar]
- 35. Sérandour AA, Avner S, Oger F, et al. Dynamic hydroxymethylation of deoxyribonucleic acid marks differentiation-associated enhancers. Nucleic Acids Res. 2012;40:8255–8265. [DOI] [PMC free article] [PubMed] [Google Scholar]
- 36. Langmead B, Trapnell C, Pop M, Salzberg SL. Ultrafast and memory-efficient alignment of short DNA sequences to the human genome. Genome Biol. 2009;10:R25. [DOI] [PMC free article] [PubMed] [Google Scholar]
- 37. Li H, Handsaker B, Wysoker A, et al. The sequence alignment/map format and SAM tools. Bioinformatics. 2009;25:2078–2079. [DOI] [PMC free article] [PubMed] [Google Scholar]
- 38. Zhang Y, Liu T, Meyer CA, et al. Model-based analysis of ChIP-Seq (MACS). Genome Biol. 2008;9:R137. [DOI] [PMC free article] [PubMed] [Google Scholar]
- 39. Liu T, Ortiz A, Taing L, et al. Cistrome: an integrative platform for transcriptional regulation studies. Genome Biol. 2011;12:R83. [DOI] [PMC free article] [PubMed] [Google Scholar]
- 40. Kolesnikov N, Hastings E, Keays M, et al. ArrayExpress update–simplifying data submissions. Nucleic Acids Res. 2015;43:D1113–D1116. [DOI] [PMC free article] [PubMed] [Google Scholar]
- 41. Hewitt SC, Li L, Grimm SA, et al. Research resource: whole-genome estrogen receptor α binding in mouse uterine tissue revealed by ChIP-seq. Mol Endocrinol. 2012;26:887–898. [DOI] [PMC free article] [PubMed] [Google Scholar]
- 42. Schmidt D, Schwalie PC, Ross-Innes CS, et al. A CTCF-independent role for cohesin in tissue-specific transcription. Genome Res. 2010;20:578–588. [DOI] [PMC free article] [PubMed] [Google Scholar]
- 43. Gao H, Fält S, Sandelin A, Gustafsson JA, Dahlman-Wright K. Genome-wide identification of estrogen receptor α-binding sites in mouse liver. Mol Endocrinol. 2008;22:10–22. [DOI] [PMC free article] [PubMed] [Google Scholar]
- 44. Qin B, Zhou M, Ge Y, et al. CistromeMap: a knowledgebase and web server for ChIP-Seq and DNase-Seq studies in mouse and human. Bioinformatics. 2012;28:1411–1412. [DOI] [PMC free article] [PubMed] [Google Scholar]
- 45. Sun H, Qin B, Liu T, et al. CistromeFinder for ChIP-seq and DNase-seq data reuse. Bioinformatics. 2013;29:1352–1354. [DOI] [PMC free article] [PubMed] [Google Scholar]
- 46. MacIsaac KD, Lo KA, Gordon W, Motola S, Mazor T, Fraenkel E. A quantitative model of transcriptional regulation reveals the influence of binding location on expression. PLoS Comput Biol. 2010;6:e1000773. [DOI] [PMC free article] [PubMed] [Google Scholar]
- 47. Schmidt D, Wilson MD, Ballester B, et al. Five-vertebrate ChIP-seq reveals the evolutionary dynamics of transcription factor binding. Science. 2010;328:1036–1040. [DOI] [PMC free article] [PubMed] [Google Scholar]
- 48. Boergesen M, Pedersen TÅ, Gross B, et al. Genome-wide profiling of liver X receptor, retinoid X receptor, and peroxisome proliferator-activated receptor α in mouse liver reveals extensive sharing of binding sites. Mol Cell Biol. 2012;32:852–867. [DOI] [PMC free article] [PubMed] [Google Scholar]
- 49. Grøntved L, John S, Baek S, et al. C/EBP maintains chromatin accessibility in liver and facilitates glucocorticoid receptor recruitment to steroid response elements. EMBO J. 2013;32:1568–1583. [DOI] [PMC free article] [PubMed] [Google Scholar]
- 50. Chaveroux C, Eichner LJ, Dufour CR, et al. Molecular and genetic crosstalks between mTOR and ERRα are key determinants of rapamycin-induced nonalcoholic fatty liver. Cell Metab. 2013;17:586–598. [DOI] [PubMed] [Google Scholar]
- 51. Bugge A, Feng D, Everett LJ, et al. Rev-erbα and Rev-erbβ coordinately protect the circadian clock and normal metabolic function. Genes Dev. 2012;26:657–667. [DOI] [PMC free article] [PubMed] [Google Scholar]
- 52. Cho H, Zhao X, Hatori M, et al. Regulation of circadian behaviour and metabolism by REV-ERB-α and REV-ERB-β. Nature. 2012;485:123–127. [DOI] [PMC free article] [PubMed] [Google Scholar]
- 53. Shen Y, Yue F, McCleary DF, et al. A map of the cis-regulatory sequences in the mouse genome. Nature. 2012;488:116–120. [DOI] [PMC free article] [PubMed] [Google Scholar]
- 54. Alpern D, Langer D, Ballester B, et al. TAF4, a subunit of transcription factor II D, directs promoter occupancy of nuclear receptor HNF4A during post-natal hepatocyte differentiation. Elife. 2014;3:e03613. [DOI] [PMC free article] [PubMed] [Google Scholar]
- 55. Anderson PD, McKissic SA, Logan M, et al. Nkx3.1 and Myc crossregulate shared target genes in mouse and human prostate tumorigenesis. J Clin Invest. 2012;122:1907–1919. [DOI] [PMC free article] [PubMed] [Google Scholar]
- 56. Untergasser A, Cutcutache I, Koressaar T, et al. Primer3–new capabilities and interfaces. Nucleic Acids Res. 2012;40:e115. [DOI] [PMC free article] [PubMed] [Google Scholar]
- 57. Saeed AI, Bhagabati NK, Braisted JC, et al. TM4 microarray software suite. Methods Enzymol. 2006;411:134–193. [DOI] [PubMed] [Google Scholar]
- 58. Villa A, Della Torre S, Stell A, Cook J, Brown M, Maggi A. Tetradian oscillation of estrogen receptor α is necessary to prevent liver lipid deposition. Proc Natl Acad Sci USA. 2012;109:11806–11811. [DOI] [PMC free article] [PubMed] [Google Scholar]
- 59. Joseph R, Orlov YL, Huss M, et al. Integrative model of genomic factors for determining binding site selection by estrogen receptor-α. Mol Syst Biol. 2010;6:456. [DOI] [PMC free article] [PubMed] [Google Scholar]
- 60. Ross-Innes CS, Stark R, Teschendorff AE, et al. Differential oestrogen receptor binding is associated with clinical outcome in breast cancer. Nature. 2012;481:389–393. [DOI] [PMC free article] [PubMed] [Google Scholar]
- 61. Tang B, Hsu HK, Hsu PY, et al. Hierarchical modularity in ERα transcriptional network is associated with distinct functions and implicates clinical outcomes. Sci Rep. 2012;2:875. [DOI] [PMC free article] [PubMed] [Google Scholar]
- 62. Ovaska K, Matarese F, Grote K, et al. Integrative analysis of deep sequencing data identifies estrogen receptor early response genes and links ATAD3B to poor survival in breast cancer. PLoS Comput Biol. 2013;9:e1003100. [DOI] [PMC free article] [PubMed] [Google Scholar]
- 63. McLean CY, Bristor D, Hiller M, et al. GREAT improves functional interpretation of cis-regulatory regions. Nat Biotechnol. 2010;28:495–501. [DOI] [PMC free article] [PubMed] [Google Scholar]
- 64. Creyghton MP, Cheng AW, Welstead GG, et al. Histone H3K27ac separates active from poised enhancers and predicts developmental state. Proc Natl Acad Sci USA. 2010;107:21931–21936. [DOI] [PMC free article] [PubMed] [Google Scholar]
- 65. Calo E, Wysocka J. Modification of enhancer chromatin: what, how, and why? Mol Cell. 2013;49:825–837. [DOI] [PMC free article] [PubMed] [Google Scholar]
- 66. Wang Y, Li X, Hu H. H3K4me2 reliably defines transcription factor binding regions in different cells. Genomics. 2014;103:222–228. [DOI] [PubMed] [Google Scholar]
- 67. Lister R, Pelizzola M, Dowen RH, et al. Human DNA methylomes at base resolution show widespread epigenomic differences. Nature. 2009;462:315–322. [DOI] [PMC free article] [PubMed] [Google Scholar]
- 68. Song CX, Szulwach KE, Fu Y, et al. Selective chemical labeling reveals the genome-wide distribution of 5-hydroxymethylcytosine. Nat Biotechnol. 2011;29:68–72. [DOI] [PMC free article] [PubMed] [Google Scholar]
- 69. Hoffman BG, Robertson G, Zavaglia B, et al. Locus co-occupancy, nucleosome positioning, and H3K4me1 regulate the functionality of FOXA2-, HNF4A-, and PDX1-bound loci in islets and liver. Genome Res. 2010;20:1037–1051. [DOI] [PMC free article] [PubMed] [Google Scholar]
- 70. He HH, Meyer CA, Chen MW, Jordan VC, Brown M, Liu XS. Differential DNase I hypersensitivity reveals factor-dependent chromatin dynamics. Genome Res. 2012;22:1015–1025. [DOI] [PMC free article] [PubMed] [Google Scholar]
- 71. Spicuglia S, Vanhille L. Chromatin signatures of active enhancers. Nucleus. 2012;3:126–131. [DOI] [PMC free article] [PubMed] [Google Scholar]
- 72. Cheng J, Blum R, Bowman C, et al. A role for H3K4 monomethylation in gene repression and partitioning of chromatin readers. Mol Cell. 2014;53:979–992. [DOI] [PMC free article] [PubMed] [Google Scholar]
- 73. Chen WS, Manova K, Weinstein DC, Duncan SA, et al. Disruption of the HNF-4 gene, expressed in visceral endoderm, leads to cell death in embryonic ectoderm and impaired gastrulation of mouse embryos. Genes Dev. 1994;8:2466–2477. [DOI] [PubMed] [Google Scholar]
- 74. Lee CS, Friedman JR, Fulmer JT, Kaestner KH. The initiation of liver development is dependent on Foxa transcription factors. Nature. 2005;435:944–947. [DOI] [PubMed] [Google Scholar]
- 75. Bochkis IM, Schug J, Ye DZ, et al. Genome-wide location analysis reveals distinct transcriptional circuitry by paralogous regulators Foxa1 and Foxa2. PLoS Genet. 2012;8:e1002770. [DOI] [PMC free article] [PubMed] [Google Scholar]
- 76. Alder O, Cullum R, Lee S, et al. Hippo signaling influences HNF4A and FOXA2 enhancer switching during hepatocyte differentiation. Cell Rep. 2014;9:261–271. [DOI] [PMC free article] [PubMed] [Google Scholar]
- 77. Gordillo M, Evans T, Gouon-Evans V. Orchestrating liver development. Development. 2015;142:2094–2108. [DOI] [PMC free article] [PubMed] [Google Scholar]
- 78. Sladek FM, Darnell JE. Mechanisms of liver-specific gene expression. Curr Opin Genet Dev. 1992;2:256–259. [DOI] [PubMed] [Google Scholar]
- 79. Zaret KS. Regulatory phases of early liver development: paradigms of organogenesis. Nat Rev Genet. 2002;3:499–512. [DOI] [PubMed] [Google Scholar]
- 80. Shin D, Monga SP. Cellular and molecular basis of liver development. Compr Physiol. 2013;3:799–815. [DOI] [PMC free article] [PubMed] [Google Scholar]
- 81. Szklarczyk D, Franceschini A, Wyder S, et al. STRING v10: protein-protein interaction networks, integrated over the tree of life. Nucleic Acids Res. 2015;43:D447–D452. [DOI] [PMC free article] [PubMed] [Google Scholar]
- 82. Holmes KA, Song JS, Liu XS, Brown M, Carroll JS. Nkx3-1 and LEF-1 function as transcriptional inhibitors of estrogen receptor activity. Cancer Res. 2008;68:7380–7385. [DOI] [PubMed] [Google Scholar]
- 83. Jones ME, Boon WC, Proietto J, Simpson ER. Of mice and men: the evolving phenotype of aromatase deficiency. Trends Endocrinol Metab. 2006;17:55–64. [DOI] [PubMed] [Google Scholar]
- 84. Valéra MC, Gratacap MP, Gourdy P, et al. Chronic estradiol treatment reduces platelet responses and protects mice from thromboembolism through the hematopoietic estrogen receptor α. Blood. 2012;120:1703–1712. [DOI] [PubMed] [Google Scholar]
- 85. Mizuguchi T, Mitaka T, Hirata K, Oda H, Mochizuki Y. Alteration of expression of liver-enriched transcription factors in the transition between growth and differentiation of primary cultured rat hepatocytes. J Cell Physiol. 1998;174:273–284. [DOI] [PubMed] [Google Scholar]
- 86. Chang TT, Hughes-Fulford M. Molecular mechanisms underlying the enhanced functions of three-dimensional hepatocyte aggregates. Biomaterials. 2014;35:2162–2171. [DOI] [PMC free article] [PubMed] [Google Scholar]
- 87. Jagannathan V, Robinson-Rechavi M. Meta-analysis of estrogen response in MCF-7 distinguishes early target genes involved in signaling and cell proliferation from later target genes involved in cell cycle and DNA repair. BMC Syst Biol. 2011;5:138. [DOI] [PMC free article] [PubMed] [Google Scholar]
- 88. Simpson NE, Gertz J, Imberg K, Myers RM, Garabedian MJ. Research resource: enhanced genome-wide occupancy of estrogen receptor α by the cochaperone p23 in breast cancer cells. Mol Endocrinol. 2012;26:194–202. [DOI] [PMC free article] [PubMed] [Google Scholar]
- 89. Cavalli G, Misteli T. Functional implications of genome topology. Nat Struct Mol Biol. 2013;20:290–299. [DOI] [PMC free article] [PubMed] [Google Scholar]
- 90. Fullwood MJ, Liu MH, Pan YF, et al. An oestrogen-receptor-α-bound human chromatin interactome. Nature. 2009;462:58–64. [DOI] [PMC free article] [PubMed] [Google Scholar]
- 91. Ciabrelli F, Cavalli G. Chromatin-driven behavior of topologically associating domains. J Mol Biol. 2015;427:608–625. [DOI] [PubMed] [Google Scholar]
- 92. Zhang Y, Wong CH, Birnbaum RY, et al. Chromatin connectivity maps reveal dynamic promoter-enhancer long-range associations. Nature. 2013;504:306–310. [DOI] [PMC free article] [PubMed] [Google Scholar]
- 93. Schoenfelder S, Furlan-Magaril M, Mifsud B, et al. The pluripotent regulatory circuitry connecting promoters to their long-range interacting elements. Genome Res. 2015;25:582–597. [DOI] [PMC free article] [PubMed] [Google Scholar]
- 94. de Laat W, Duboule D. Topology of mammalian developmental enhancers and their regulatory landscapes. Nature. 2013;502:499–506. [DOI] [PubMed] [Google Scholar]
- 95. Yi P, Wang Z, Feng Q, et al. Structure of a biologically active estrogen receptor-coactivator complex on DNA. Mol Cell. 2015;57:1047–1058. [DOI] [PMC free article] [PubMed] [Google Scholar]
- 96. Flouriot G, Brand H, Denger S, et al. Identification of a new isoform of the human estrogen receptor-α (hER-α) that is encoded by distinct transcripts and that is able to repress hER-α activation function 1. EMBO J. 2000;19:4688–4700. [DOI] [PMC free article] [PubMed] [Google Scholar]
- 97. Wang Z, Zhang X, Shen P, Loggie BW, Chang Y, Deuel TF. Identification, cloning, and expression of human estrogen receptor-α36, a novel variant of human estrogen receptor-α66. Biochem Biophys Res Commun. 2005;336:1023–1027. [DOI] [PubMed] [Google Scholar]
- 98. Irsik DL, Carmines PK, Lane PH. Classical estrogen receptors and ERα splice variants in the mouse. PLoS One. 2013;8:e70926. [DOI] [PMC free article] [PubMed] [Google Scholar]
- 99. John S, Sabo PJ, Thurman RE, et al. Chromatin accessibility pre-determines glucocorticoid receptor binding patterns. Nat Genet. 2011;43:264–268. [DOI] [PMC free article] [PubMed] [Google Scholar]
- 100. Theodorou V, Stark R, Menon S, Carroll JS. GATA3 acts upstream of FOXA1 in mediating ESR1 binding by shaping enhancer accessibility. Genome Res. 2013;23:12–22. [DOI] [PMC free article] [PubMed] [Google Scholar]
- 101. Mo R, Rao SM, Zhu YJ. Identification of the MLL2 complex as a coactivator for estrogen receptor α. J Biol Chem. 2006;281:15714–15720. [DOI] [PubMed] [Google Scholar]
- 102. Kim H, Heo K, Kim JH, Kim K, Choi J, An W. Requirement of histone methyltransferase SMYD3 for estrogen receptor-mediated transcription. J Biol Chem. 2009;284:19867–19877. [DOI] [PMC free article] [PubMed] [Google Scholar]
- 103. Shi L, Sun L, Li Q, et al. Histone demethylase JMJD2B coordinates H3K4/H3K9 methylation and promotes hormonally responsive breast carcinogenesis. Proc Natl Acad Sci USA. 2011;108:7541–7546. [DOI] [PMC free article] [PubMed] [Google Scholar]
- 104. Jeong KW, Andreu-Vieyra C, You JS, Jones PA, Stallcup MR. Establishment of active chromatin structure at enhancer elements by mixed-lineage leukemia 1 to initiate estrogen-dependent gene expression. Nucleic Acids Res. 2014;42:2245–2256. [DOI] [PMC free article] [PubMed] [Google Scholar]
- 105. Zhang X, Tanaka K, Yan J, et al. Regulation of estrogen receptor α by histone methyltransferase SMYD2-mediated protein methylation. Proc Natl Acad Sci USA. 2013;110:17284–17289. [DOI] [PMC free article] [PubMed] [Google Scholar]
- 106. Jiang Y, Trescott L, Holcomb J, et al. Structural insights into estrogen receptor α methylation by histone methyltransferase SMYD2, a cellular event implicated in estrogen signaling regulation. J Mol Biol. 2014;426:3413–3425. [DOI] [PubMed] [Google Scholar]
- 107. Formosa T. The role of FACT in making and breaking nucleosomes. Biochim Biophys Acta. 2013;1819:247–255. [PubMed] [Google Scholar]
- 108. Gurard-Levin ZA, Quivy JP, Almouzni G. Histone chaperones: assisting histone traffic and nucleosome dynamics. Annu Rev Biochem. 2014;83:487–517. [DOI] [PubMed] [Google Scholar]
- 109. Edwards DP. Regulation of signal transduction pathways by estrogen and progesterone. Annu Rev Physiol. 2005;67:335–376. [DOI] [PubMed] [Google Scholar]
- 110. Arao Y, Hamilton KJ, Ray MK, Scott G, Mishina Y, Korach KS. Estrogen receptor α AF-2 mutation results in antagonist reversal and reveals tissue selective function of estrogen receptor modulators. Proc Natl Acad Sci USA. 2011;108:14986–14991. [DOI] [PMC free article] [PubMed] [Google Scholar]
- 111. Billon-Galés A, Krust A, Fontaine C, et al. Activation function 2 (AF2) of estrogen receptor-α is required for the atheroprotective action of estradiol but not to accelerate endothelial healing. Proc Natl Acad Sci USA. 2011;108:13311–13316. [DOI] [PMC free article] [PubMed] [Google Scholar]
- 112. Adlanmerini M, Solinhac R, Abot A, et al. Mutation of the palmitoylation site of estrogen receptor α in vivo reveals tissue-specific roles for membrane versus nuclear actions. Proc Natl Acad Sci USA. 2014;111:E283–E290. [DOI] [PMC free article] [PubMed] [Google Scholar]
- 113. Pedram A, Razandi M, Lewis M, Hammes S, Levin ER. Membrane-localized estrogen receptor α is required for normal organ development and function. Dev Cell. 2014;29:482–490. [DOI] [PMC free article] [PubMed] [Google Scholar]