Abstract
Introduction
Previously, we showed that carbohydrate restriction with calorie restriction slowed tumor growth in xenograft mouse prostate cancer models. Herein, we examined the impact of carbohydrate restriction without calorie restriction on tumor development within the context of diet-induced obesity in the Hi-Myc transgenic mouse model of prostate cancer.
Methods
Mice were randomized at 5 weeks of age to ad libitum Western diet (WD; 40% fat, 42% carbohydrate; n=39) or ad libitum no carbohydrate ketogenic diet (NCKD; 82% fat, 1% carbohydrate; n=44). At age 3 or 6 months, mice were sacrificed, prostates weighed and prostate histology, proliferation, apoptosis, and macrophage infiltration evaluated by H&E, Ki67, TUNEL and F4/80 staining, respectively. Body composition was assessed by DEXA, serum cytokines measured using multiplex, and Akt/mTOR signaling assessed by Western.
Results
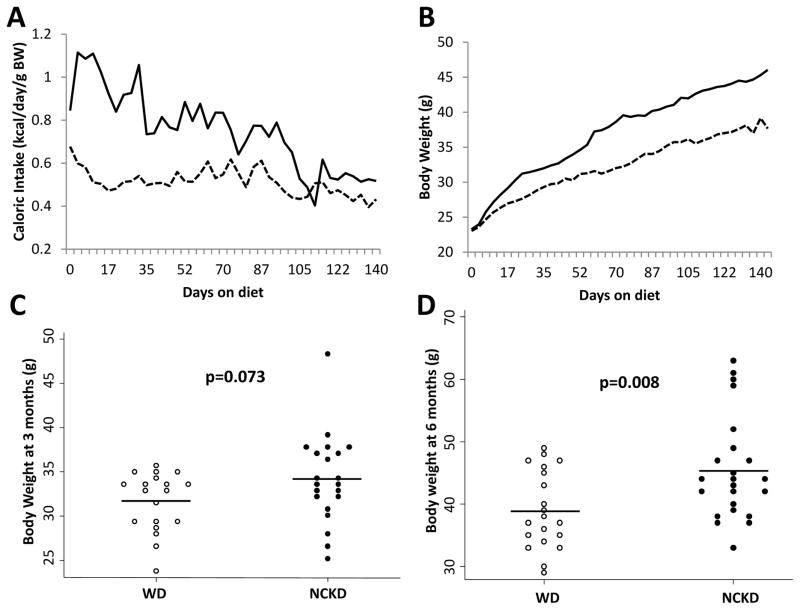
Caloric intake was higher in the NCKD group, resulting in elevated body weights at 6 months of age, relative to the WD group (45g vs. 38g; p=0.008). Despite elevated body weights, serum MCP-1 and IL-1α levels were lower in NCKD versus WD mice (p=0.046 and p=0.118, respectively), and macrophage infiltration was reduced in prostates of NCKD versus WD mice (p=0.028). Relative Akt phosphorylation and phospho-S6 ribosomal protein levels were reduced in prostates of NCKD versus WD mice. However, while mice randomized to NCKD had smaller prostates after adjustment for body weight at 3 and 6 months (p=0.004 and p=0.002, respectively), NCKD mice had higher rates of adenocarcinoma at 6 months compared to WD mice (100% vs. 80%, p=0.04).
Conclusions
Despite higher caloric intake and elevated body weights, carbohydrate restriction lowered serum MCP-1 levels, reduced prostate macrophage infiltration, reduced prostate weight, but failed to slow adenocarcinoma development. Together, these data suggest that although carbohydrate restriction within the context of obesity may reduce obesity-associated systemic inflammation, it is not sufficient to counteract obesity-associated tumor growth.
Keywords: carbohydrate restriction, diet-induced obesity, monocyte chemoattractant protein-1, prostate cancer, transgenic
Introduction
Obesity is associated with increased incidence of aggressive prostate cancer and elevated prostate cancer-specific mortality.1 Given the high prevalence of obesity in Western society2 and the large number of men affected by prostate cancer,3 understanding the relationship between the two is of great importance. Furthermore, elucidating the role of obesity in prostate cancer is of particular interest, given its potentially modifiable nature.
While weight loss is challenging to achieve and thus human data are lacking,1 preclinical evidence suggests that obesity reversal (i.e. weight loss) via chronic and intermittent calorie restriction slows tumor growth in mouse models of prostate cancer via reduction of serum insulin and insulin-like growth factor (IGF) -1 levels and suppression of inflammation.4,5 Previously, we demonstrated that dietary carbohydrate restriction slowed tumor growth relative to Western diet in xenograft mouse models of human prostate cancer via similar mechanisms as those demonstrated for calorie restriction.6,7 Of note, these tumor-suppressive effects of carbohydrate restriction were observed despite higher caloric intake in the carbohydrate-restricted mice which was required to maintain equal body weights.6,7
A limitation of xenograft models of human cancer for studying obesity and cancer is their required use of immunocompromised mice, which develop a less severe diet-induced obesity phenotype relative to other models.6,7 In this study, we examined the impact of carbohydrate restriction on prostate tumor growth within the context of diet-induced obesity using the Hi-Myc transgenic mouse model, a genetically-engineered prostate cancer model demonstrated to be sensitive to changes in energy balance.4 We hypothesized that ad libitum carbohydrate restriction would negate some of the tumor-promoting effects of obesity and slow prostate cancer growth.
Materials and Methods
Animal study design
Animal protocols were approved by the Duke University Institutional Animal Care and Use Committee. Hi-Myc breeding pairs were obtained from NIH MMRRC on an FVB/N genetic background and bred in-house. Diets were prepared by Research Diets Inc. (New Brunswick, NJ, USA), and sterilized by irradiation. At 35 days of age, 83 male Hi-Myc mice were randomized based on body weight to receive a) ad libitum Western diet (WD, n=39; 40 kcal% fat, 43 kcal% carbohydrate, 18% protein) or b) ad libitum no carbohydrate ketogenic diet (NCKD, n=44; 82 kcal% fat, 1 kcal% carbohydrate, 18% protein; Supplementary Table S1). Sample size was determined based upon prior studies of dietary interventions in mouse models.4,6,7 All mice were group-housed and body mass and average food consumption were measured biweekly for the study duration. Mice were euthanized using a lethal dose of ketamine/xylazine followed by bilateral thoracotomy at either 3 or 6 months of age. Blood was obtained via cardiac puncture immediately following euthanasia, allowed to clot at room temperature for 30 minutes, and centrifuged at 13,000 rpm for 90 seconds. Serum was collected and stored at −80°C. The entire genitourinary (GU) tract was removed intact and weighed. Seminal vesicles and bladder were removed, and the prostate was bisected and weighed. One half of the prostate was flash frozen in liquid nitrogen and stored at −80°C, while the other was fixed in 10% formalin for 48 hours and paraffin embedded. Percent body fat, lean mass, fat mass, and bone mineral content of each carcass were determined using dual energy X-ray absorptiometry (DXA; GE Lunar Piximus II, Madison, WI, USA), as described.8
Serum analyses
Serum parameters were assessed at 3 months (n=9 per dietary group) and 6 months of age (n=10 per dietary group) using Multiplex assays (Millipore Inc., Billerica, MA, USA) run on a BioRad 200 Bioplex multianalyte detection system (BioRad Inc., Hercules, CA, USA). These subgroups were selected to represent the mean body weight of each dietary group. Serum levels of interleukin (IL)-1α, IL-6, IL-12p70, granulocyte macrophage colony-stimulating factor (GM-CSF) and monocyte chemoattractant protein (MCP)-1 were measured using the mouse cytokine/chemokine magnetic bead panel. Resistin, plasminogen activator inhibitor (PAI)-1, leptin and insulin were measured using the mouse adipokine magnetic bead panel, and adiponectin was measured using a singleplex magnetic bead assay. Serum levels of total insulin-like growth factor (IGF)-1 and IGF-1 binding protein 3 (IGFBP3) levels were measured by ELISA (R&D systems, Minneapolis, MN, USA).
Histologic analysis
Formalin-fixed paraffin-embedded prostate tissue from each mouse was sectioned into three 4 μm sections, each separated by 50 μm, and stained with hematoxylin and eosin (H&E) for histopathologic diagnosis. Tumor tissue was graded as mouse PIN (mPIN) and adenocarcinoma according to current guidelines by a single reader blind to treatment arm, guided by a board-certified pathologist (GVT).9 Subsequent serial sections were stained with antibodies against Ki67 (Thermo Scientific, Rockford, IL), TUNEL (ApopTag® Plus Peroxidase In Situ Apoptosis Kit; Millipore Inc.) and F4/80 (Abcam, Cambridge, MA) to assess proliferation, apoptosis and macrophage infiltration, respectively. Ki67 and TUNEL staining was conducted in both 3 and 6 month timepoints, whereas F4/80 staining was only carried out in the 6 month timepoint. Stained slides were scanned using an Aperio ScanScope and automated quantification of Ki67 and TUNEL expression was conducted blinded to dietary group using Definiens Tissue Studio® nuclear algorithm at the Translational Pathology Core, University of North Carolina at Chapel Hill. Manual quantification of F4/80 expression was conducted by a board-certified pathologist blinded to dietary group at the Translational Pathology Core, Cedars-Sinai Medical Center. Scores ranging from 1 – 3 were assigned based on the number of cells staining positive for F4/80.
Western blot analyses
Frozen prostate tissue was homogenized in RIPA buffer (Pierce, Rockford, IL) containing HALT™ protease and phosphatase inhibitor cocktail (Thermo Scientific, Rockford, IL) and protein concentration was determined by bicinchoninic acid (BCA) protein assay (Thermo Scientific, Rockford, IL). Samples from 8 mice per group per time point were pooled and 50 mg of protein was electrophoretically separated on a 4–20% SDS-PAGE gel (BioRad Inc., Hercules, CA, USA) and transferred to a nitrocellulose membrane. These subgroups were selected to represent the mean body weight of each dietary group. Transfer was conducted at 22V overnight at 4°C. After blocking with 5% milk in TBS containing 1% Tween-20 (TBST), membranes were incubated with antibodies (all obtained from Cell Signaling Technology) as follows: Akt, phospho-Akt (Ser473), phospho-S6 ribosomal protein (Ser235/236), cyclin D1 (all at 1:2000 dilution), and mTOR, phospho-mTOR (Ser2448), 4E-BP1, phospho-4E-BP1 (Thr37/46), GSK-3β, phospho-GSK-3β (Ser9), β-actin (all at 1:1000 dilution). Protein bands were visualized by enhanced chemiluminescence (Thermo Scientific, Rockford, IL). Densitometric analysis was completed using ImageJ (Image J, NIH).
Statistical analysis
Our primary outcome was prostate weight per 25 g of body weight, selected a priori in order to examine the role of diet independent of body weight changes and to be consistent with prior studies examining the effect of diet on prostate cancer transgenic tumor growth.10 As a secondary outcome, we also examined differences in prostate weight unadjusted for body weight. Differences in body and organ weights, prostate weight, serum markers and prostate apoptotic and proliferative indexes were examined using student’s t tests, ensuring that variance was similar between groups being compared. Differences in macrophage infiltration and tumor histology were compared using a Fisher’s exact test.
Statistical analysis was carried out using GraphPad Prism version 5 (GraphPad Software, Inc., La Jolla, CA, USA) and STATA 13.0 (Stata, Corp., College Station, TX, USA). Statistical significance was two-sided with p < 0.05.
Results
Impact of carbohydrate restriction on body composition and bone density
Both dietary interventions produced a diet-induced obese phenotype, with average body weights increasing almost twofold over the course of the study (Figure 1). However, mice randomized to ad libitum NCKD consumed more calories per gram body weight, relative to mice randomized to ad libitum WD, resulting in higher mean body weights in the NCKD group at 3 and 6 months of age (Figure 1). After adjusting for body weight, there were no differences in liver or spleen weights between dietary groups at either 3 or 6 months (data not shown).
Figure 1.
Impact of carbohydrate restriction on caloric intake (A) and body weight over the course of the study (B) and at 3 months (C) and 6 months of age (D). WD=Western diet, dashed line and empty circles; NCKD=no carbohydrate ketogenic diet, solid line and solid circles. P values by student’s t test.
Body composition analysis at sacrifice showed a non-significant trend towards increased fat mass and percent body fat in the NCKD group at 3 months of age (Supplementary Table S2). However, at 6 months, mice in the NCKD group had significantly higher fat mass (15.5 g vs. 10.2 g, respectively; p=0.002) and percent body fat (41.8% vs. 32.2%, respectively; p=0.002), relative to mice in the WD group. There was no difference in lean body mass between dietary groups at either 3 or 6 months (Supplementary Table S2). While mice randomized to the NCKD group had significantly higher bone mineral content at 6 months of age (p=0.009), this association was attenuated following adjustment for body weight (linear regression, p=0.166).
Impact of carbohydrate restriction on prostate weight and histology
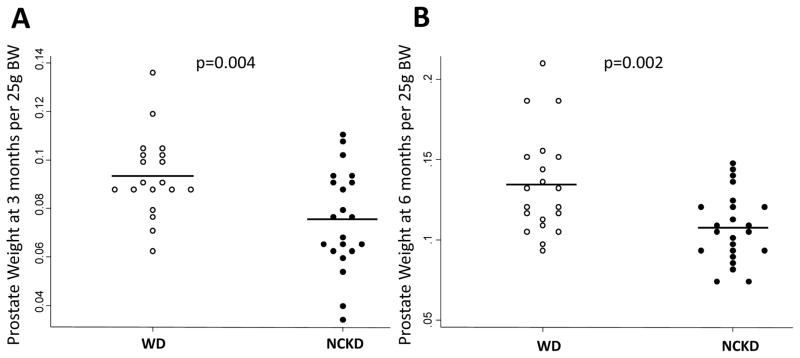
Mice consuming NCKD had significantly smaller GU tracts at both 3 months (0.30g vs. 0.33g per 25g body weight; p=0.015) and at 6 months of age (0.34g vs. 0.41g per 25g body weight; p=0.018). Similarly, prostate weights were significantly lower in NCKD mice at 3 months (0.075g vs. 0.093g per 25g body weight; p=0.004) and 6 months (0.107g vs. 0.135g per 25g body weight; p=0.002; Figure 2). When prostate weight was not adjusted for body weight, though prostate weights were smaller in NCKD mice at 3 months (0.10g vs. 0.12g, p=0.104) and 6 months (0.20g vs. 0.21g, p=0.501), differences were no longer statistically significant.
Figure 2.
Impact of carbohydrate restriction on prostate size at 3 months of age (A) and 6 months of age (B). WD=Western diet, empty circles; NCKD=no carbohydrate ketogenic diet, solid circles. P values by student’s t test.
Approximately the same proportion of each dietary group had mPIN by 3 months (Supplementary Table S3). At 3 months of age, there were no adenocarcinomas in either group. However, 100% (n=23/23) of mice in the NCKD group had adenocarcinoma at 6 months of age, compared with 80% (n=16/20) of mice in the WD group (p=0.04; Supplementary Table S3 and Figure S1). There were no significant differences in rates of proliferation or apoptosis between dietary groups at either 3 or 6 months (Supplementary Table S4 and Supplementary Figure S2). Results were similar when Ki67 and TUNEL quantification was restricted to regions of mPIN and tumor only (data not shown).
Impact of carbohydrate restriction on serum growth factors and cytokines, and prostate inflammation
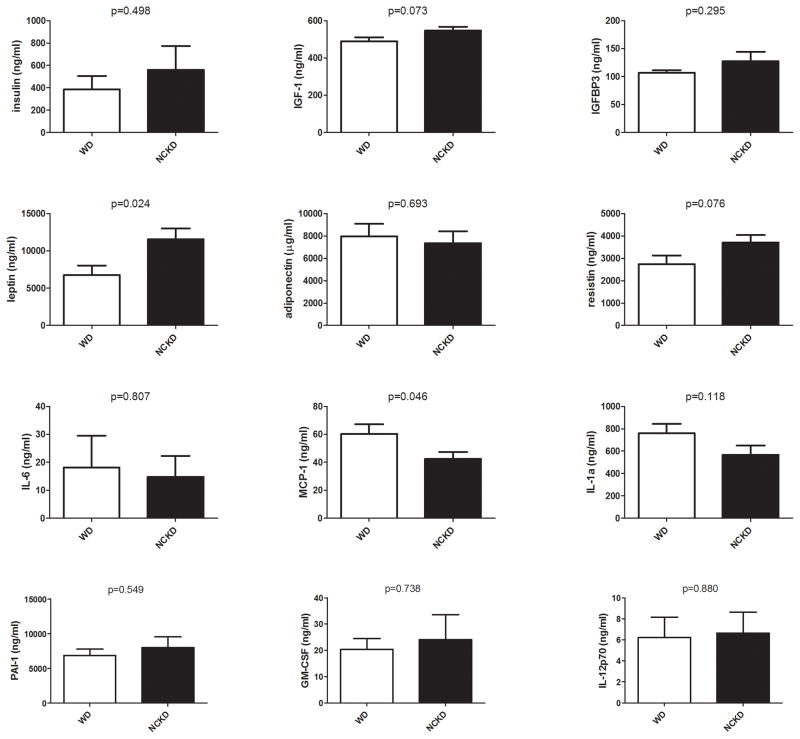
There were no significant differences in levels of serum growth factors, cytokines or chemokines between dietary groups at 3 months of age (Supplementary Figure S3). At 6 months of age, while there was a suggestion of higher IGF-1 levels in the NCKD relative to the WD group (p=0.073; Figure 3), there were no significant differences in serum insulin, IGF-1 or IGFBP3 levels between dietary groups, despite significantly larger body weights in the NCKD group. While adiponectin levels did not differ significantly between dietary groups, leptin levels were significantly elevated in the NCKD group at 6 months (p=0.024) and there was a non-significant trend towards increased resistin in the NCKD group (p=0.076). Conversely, MCP-1 levels were significantly lower in the NCKD group at 6 months (p=0.046) and there was a suggestion of reduced levels of IL-1α (p=0.118; Figure 3), relative to the WD group. There were no differences in levels of IL-6, PAI-1, GM-CSF or IL-12p70 between dietary groups (all p>0.5; Figure 3).
Figure 3.
Impact of carbohydrate restriction on serum growth factor and cytokine levels at 6 months of age. WD=Western diet, empty bars; NCKD=no carbohydrate ketogenic diet, solid bars. P values by student’s t test.
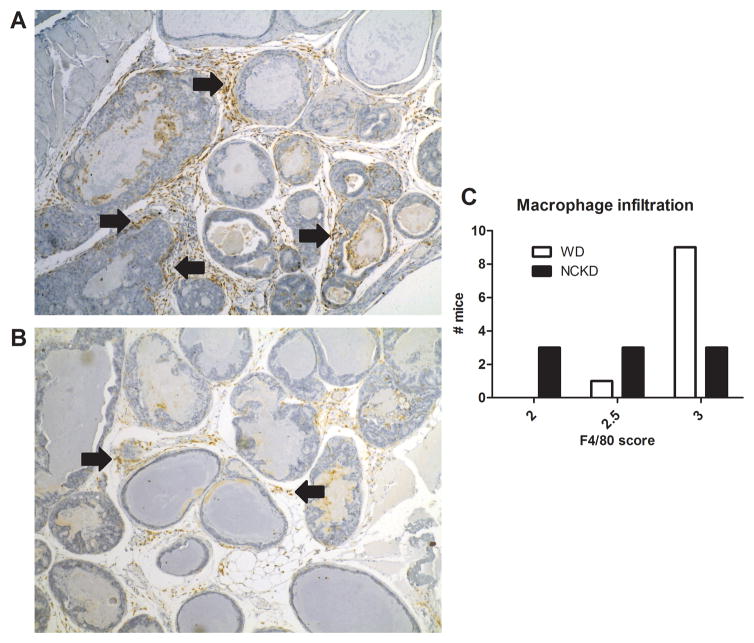
Given the role of MCP-1 in regulating monocyte recruitment and activation to produce macrophages,11 we used F4/80 staining to identify macrophages in prostate tissue. Macrophage infiltration was reduced in prostates of NCKD mice, relative to their WD counterparts (p=0.028; Figure 4).
Figure 4.
Representative images of macrophage infiltration in tumors of mice fed a Western diet (A) and a no-carbohydrate ketogenic diet (B). Macrophage infiltration was significantly reduced in the tumors of NCKD mice relative to WD mice, as assessed by Fischer’s exact test (p=0.028; C).
Impact of carbohydrate restriction on Akt/mTOR signaling
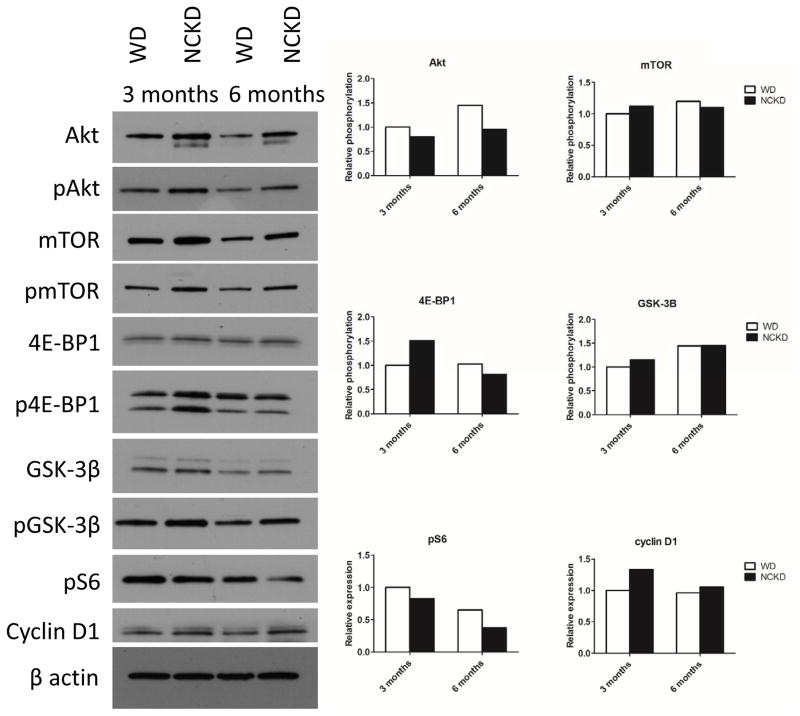
As anticipated, given their higher caloric intake, larger body weights and greater adiposity levels, mice randomized to NCKD had elevated prostate levels of total Akt and mTOR (Figure 5). However, there was a mixed picture of diet-dependent effects on Akt/mTOR pathway activation based on phosphorylation (p) levels (relative to total levels) of each of several markers, including no observed differences between the diets for pmTOR or pGSK-3β at 3 or 6 months of age. However, p-Akt was reduced in the NCKD group at both 3 and 6 months. Relative phosphorylation of 4E-BP1 was higher in the NCKD group at 3 months, but there were no differences between dietary groups at 6 months of age. Similarly, expression of cyclin D1 was elevated in the NCKD group at 3 months of age, but did not differ between dietary groups at 6 months of age. Finally, phosphorylated S6 ribosomal protein levels, a translational regulator downstream of mTOR, were reduced in the NCKD group at both 3 and 6 months.
Figure 5.
Impact of carbohydrate restriction on the Akt signaling pathway in the prostate. Densitometry shows relative phosphorylation levels of Akt, mTOR, 4E-BP1, GSK-3B and relative expression levels of pS6 and cyclin D1.
Discussion
The association between obesity and prostate cancer is of interest for prostate cancer prevention efforts due to the high prevalence and potentially modifiable nature of obesity. Herein, we report that dietary carbohydrate restriction may offset some of the pro-inflammatory effects of diet-induced obesity in a transgenic mouse model of prostate cancer. However, relative to WD, carbohydrate restriction was accompanied by higher calorie intake and greater weight gain and, despite lower prostate weights, carbohydrate-restricted mice had a higher frequency of adenocarcinoma. Together, our findings suggest that although carbohydrate restriction in the presence of caloric excess may offset some of the pro-inflammatory properties of obesity, it does not slow tumor development in this model.
A randomized controlled weight loss trial in obese, cancer-free humans reported that carbohydrate restriction in the absence of calorie restriction promoted the most weight loss and had the most favorable improvement in lipid profile, relative to low fat restricted calorie and Mediterranean restricted calorie diets.12 However, mean weight loss in the carbohydrate-restricted group was relatively modest at 4.7 kg (1.5 BMI units) over the trial period of two years.13 Moreover, almost 90% of weight lost was regained after the trial period ended, even though the majority of individuals reported continuing carbohydrate restriction at the five year follow up.12 Interestingly, despite this modest weight loss which was largely regained, the favorable effects on lipid profile persisted,12 suggesting a beneficial role for carbohydrate restriction even in the context of obesity. In keeping with this observation, we demonstrate that despite 15% larger mean body weight, only serum leptin levels were significantly elevated in carbohydrate-restricted mice, with no significant increases in other obesity-associated growth factors and adipokines. Indeed, serum levels of the pro-inflammatory chemokine, MCP-1, were significantly reduced in carbohydrate restricted mice, as was macrophage infiltration in the prostate, in spite of the significantly higher body weights in the carbohydrate restricted group. These findings suggests that carbohydrate restriction may counteract both systemic and prostate-specific pro-inflammatory effects of obesity.
MCP-1 is an obesity-associated chemokine with a role in recruiting and activating monocytes during the inflammatory response and has been demonstrated to promote prostate tumor survival via Akt signaling.11 Several studies have suggested that MCP-1 plays a role in development of bone metastases14 and castrate-resistant prostate cancer.15 Previous work has shown that MCP-1 is an important mediator of prostate cancer growth in vivo via regulation of macrophage infiltration16,17 and that levels of MCP-1 and p-Akt are elevated following a high fat, high carbohydrate dietary intervention in a xenograft mouse model of prostate cancer, relative to control diet.18 While a Phase 2 trial of a monoclonal antibody against MCP-1 in metastatic, castrate-resistant prostate cancer patients did not result in sustained reduction of serum MCP-1 levels,19 there is evidence to suggest that carbohydrate restriction lowers serum MCP-1 levels independent of weight loss in humans,20 suggesting that the impact of dietary carbohydrate restriction on MCP-1 and tumor progression should be explored in prostate cancer patients.
Diet-induced obesity drives prostate tumor growth by increasing IGF-1 levels, activating the Akt/mTOR pathway and promoting pro-inflammatory signaling, while calorie restriction opposes these effects to slow prostate tumor growth.4 Previously, we demonstrated that carbohydrate restriction in the absence of calorie restriction slowed tumor growth in xenograft mouse models of prostate cancer via reduction of serum insulin and IGF-1 levels and decreased tumor Akt signaling and inflammation.7 These findings suggested that carbohydrate restriction without calorie restriction may mimic the chemopreventive properties of calorie restriction. In this current study, Akt phosphorylation and phospho-S6 ribosomal protein levels were reduced in the tumors of carbohydrate-restricted mice, suggesting that carbohydrate restriction may counteract obesity-associated Akt/mTOR pathway signaling. However, although prostate size was reduced, carbohydrate restriction in the absence of calorie restriction promoted the development of prostate adenocarcinoma in this transgenic mouse model. Prior studies support obesity as a driver of tumor development in this model.4,21 Whether the failure of carbohydrate restriction to slow tumor development indicates that it alone is inadequate to completely counteract the tumor-promoting influence of obesity, or that it is unable to counteract the strong genetic driver of prostate tumor development in this transgenic model, is unknown. Thus, further studies are needed in additional transgenic mouse models of prostate cancer to better understand the interplay between genetics, obesity and diet with regard to prostate cancer progression.
In the current model, ad libitum carbohydrate restriction resulted in weight gain and diet-induced obesity. Importantly, this is in contrast to human studies, wherein carbohydrate restriction without calorie restriction causes modest weight loss. In regards to human prostate cancer, we hypothesize that the beneficial effects of weight loss and carbohydrate restriction may work in concert to slow prostate cancer progression. Given that carbohydrate restriction in humans is a well-tolerated dietary intervention with favorable effects on lipid profile,12 and given the potential of lipid levels to alter prostate cancer growth,22 future studies are required to determine whether this dietary intervention, alone or in combination with various prostate cancer treatments, may have a favorable impact on prostate cancer progression in patients.
In summary, we show that carbohydrate restriction, in the presence of caloric excess leading to marked obesity, opposed both systemic and prostate-specific pro-inflammatory effects of diet-induced obesity in the Hi-Myc transgenic mouse model of prostate cancer but was insufficient to counteract obesity-driven tumor development. Data from clinical trials suggest that carbohydrate restriction without calorie restriction may be a safe and feasible dietary regimen over the long-term period required for cancer prevention in humans. Given that carbohydrate restriction is accompanied by moderate weight loss in humans, future studies in prostate cancer mouse models should explore the effect of carbohydrate restriction in combination with weight loss on tumor growth.
Supplementary Material
Acknowledgments
Financial support: This work was supported by the National Cancer Institute [1-R01-CA131235-01A1 (S.J. Freedland), 1K24CA160653 (S.J. Freedland), 3R01CA125618 (E. Macias) and 5R25-CA126938-03 (E.H. Allott)], the American Institute for Cancer Research (E.H. Allott) and The Prostate Cancer Foundation (E. Macias).
We wish to acknowledge the following individuals for their help and important contributions to this study: Yulin Zhao, Traci Reddick, Julie Kent, Bentley Midkiff.
Conflict of interest: The authors have no conflicts of interest.
References
- 1.Allott EH, Masko EM, Freedland SJ. Obesity and prostate cancer: weighing the evidence. European urology. 2013;63(5):800–809. doi: 10.1016/j.eururo.2012.11.013. [DOI] [PMC free article] [PubMed] [Google Scholar]
- 2.Ogden CL, Carroll MD, Curtin LR, McDowell MA, Tabak CJ, Flegal KM. Prevalence of overweight and obesity in the United States, 1999–2004. JAMA. 2006;295(13):1549–1555. doi: 10.1001/jama.295.13.1549. [DOI] [PubMed] [Google Scholar]
- 3.Siegel R, Naishadham D, Jemal A. Cancer statistics, 2013. CA: a cancer journal for clinicians. 2013;63(1):11–30. doi: 10.3322/caac.21166. [DOI] [PubMed] [Google Scholar]
- 4.Blando J, Moore T, Hursting S, Jiang G, Saha A, Beltran L, et al. Dietary energy balance modulates prostate cancer progression in Hi-Myc mice. Cancer Prev Res (Phila) 2011;4(12):2002–2014. doi: 10.1158/1940-6207.CAPR-11-0182. [DOI] [PMC free article] [PubMed] [Google Scholar]
- 5.Bonorden MJ, Rogozina OP, Kluczny CM, Grossmann ME, Grambsch PL, Grande JP, et al. Intermittent calorie restriction delays prostate tumor detection and increases survival time in TRAMP mice. Nutrition and cancer. 2009;61(2):265–275. doi: 10.1080/01635580802419798. [DOI] [PubMed] [Google Scholar]
- 6.Freedland SJ, Mavropoulos J, Wang A, Darshan M, Demark-Wahnefried W, Aronson WJ, et al. Carbohydrate restriction, prostate cancer growth, and the insulin-like growth factor axis. The Prostate. 2008;68(1):11–19. doi: 10.1002/pros.20683. [DOI] [PMC free article] [PubMed] [Google Scholar]
- 7.Mavropoulos JC, Buschemeyer WC, 3rd, Tewari AK, Rokhfeld D, Pollak M, Zhao Y, et al. The effects of varying dietary carbohydrate and fat content on survival in a murine LNCaP prostate cancer xenograft model. Cancer Prev Res (Phila) 2009;2(6):557–565. doi: 10.1158/1940-6207.CAPR-08-0188. [DOI] [PMC free article] [PubMed] [Google Scholar]
- 8.Berrigan D, Lavigne JA, Perkins SN, Nagy TR, Barrett JC, Hursting SD. Phenotypic effects of calorie restriction and insulin-like growth factor-1 treatment on body composition and bone mineral density of C57BL/6 mice: implications for cancer prevention. In vivo. 2005;19(4):667–674. [PubMed] [Google Scholar]
- 9.Ittmann M, Huang J, Radaelli E, Martin P, Signoretti S, Sullivan R, et al. Animal models of human prostate cancer: the consensus report of the New York meeting of the Mouse Models of Human Cancers Consortium Prostate Pathology Committee. Cancer Res. 2013;73(9):2718–2736. doi: 10.1158/0008-5472.CAN-12-4213. [DOI] [PMC free article] [PubMed] [Google Scholar]
- 10.Berquin IM, Min Y, Wu R, Wu J, Perry D, Cline JM, et al. Modulation of prostate cancer genetic risk by omega-3 and omega-6 fatty acids. J Clin Invest. 2007;117(7):1866–1875. doi: 10.1172/JCI31494. [DOI] [PMC free article] [PubMed] [Google Scholar]
- 11.Zhang J, Lu Y, Pienta KJ. Multiple roles of chemokine (C-C motif) ligand 2 in promoting prostate cancer growth. Journal of the National Cancer Institute. 2010;102(8):522–528. doi: 10.1093/jnci/djq044. [DOI] [PMC free article] [PubMed] [Google Scholar]
- 12.Schwarzfuchs D, Golan R, Shai I. Four-year follow-up after two-year dietary interventions. N Engl J Med. 2012;367(14):1373–1374. doi: 10.1056/NEJMc1204792. [DOI] [PubMed] [Google Scholar]
- 13.Shai I, Schwarzfuchs D, Henkin Y, Shahar DR, Witkow S, Greenberg I, et al. Weight loss with a low-carbohydrate, Mediterranean, or low-fat diet. N Engl J Med. 2008;359(3):229–241. doi: 10.1056/NEJMoa0708681. [DOI] [PubMed] [Google Scholar]
- 14.Lu Y, Chen Q, Corey E, Xie W, Fan J, Mizokami A, et al. Activation of MCP-1/CCR2 axis promotes prostate cancer growth in bone. Clin Exp Metastasis. 2009;26(2):161–169. doi: 10.1007/s10585-008-9226-7. [DOI] [PubMed] [Google Scholar]
- 15.Sharma J, Gray KP, Harshman LC, Evan C, Nakabayashi M, Fichorova R, et al. Elevated IL-8, TNF-alpha, and MCP-1 in men with metastatic prostate cancer starting androgen-deprivation therapy (ADT) are associated with shorter time to castration-resistance and overall survival. The Prostate. 2014;74(8):820–828. doi: 10.1002/pros.22788. [DOI] [PubMed] [Google Scholar]
- 16.Loberg RD, Ying C, Craig M, Day LL, Sargent E, Neeley C, et al. Targeting CCL2 with systemic delivery of neutralizing antibodies induces prostate cancer tumor regression in vivo. Cancer Res. 2007;67(19):9417–9424. doi: 10.1158/0008-5472.CAN-07-1286. [DOI] [PubMed] [Google Scholar]
- 17.Loberg RD, Ying C, Craig M, Yan L, Snyder LA, Pienta KJ. CCL2 as an important mediator of prostate cancer growth in vivo through the regulation of macrophage infiltration. Neoplasia. 2007;9(7):556–562. doi: 10.1593/neo.07307. [DOI] [PMC free article] [PubMed] [Google Scholar]
- 18.Huang M, Narita S, Numakura K, Tsuruta H, Saito M, Inoue T, et al. A high-fat diet enhances proliferation of prostate cancer cells and activates MCP-1/CCR2 signaling. The Prostate. 2012;72(16):1779–1788. doi: 10.1002/pros.22531. [DOI] [PubMed] [Google Scholar]
- 19.Pienta KJ, Machiels JP, Schrijvers D, Alekseev B, Shkolnik M, Crabb SJ, et al. Phase 2 study of carlumab (CNTO 888), a human monoclonal antibody against CC-chemokine ligand 2 (CCL2), in metastatic castration-resistant prostate cancer. Investigational new drugs. 2013;31(3):760–768. doi: 10.1007/s10637-012-9869-8. [DOI] [PubMed] [Google Scholar]
- 20.Forsythe CE, Phinney SD, Fernandez ML, Quann EE, Wood RJ, Bibus DM, et al. Comparison of low fat and low carbohydrate diets on circulating fatty acid composition and markers of inflammation. Lipids. 2008;43(1):65–77. doi: 10.1007/s11745-007-3132-7. [DOI] [PubMed] [Google Scholar]
- 21.Kobayashi N, Barnard RJ, Said J, Hong-Gonzalez J, Corman DM, Ku M, et al. Effect of low-fat diet on development of prostate cancer and Akt phosphorylation in the Hi-Myc transgenic mouse model. Cancer Res. 2008;68(8):3066–3073. doi: 10.1158/0008-5472.CAN-07-5616. [DOI] [PMC free article] [PubMed] [Google Scholar]
- 22.Allott EH, Howard LE, Cooperberg MR, Kane CJ, Aronson WJ, Terris MK, et al. Serum Lipid Profile and Risk of Prostate Cancer Recurrence: Results from the SEARCH Database. Cancer Epidemiol Biomarkers Prev. 2014;23(11):2349–2356. doi: 10.1158/1055-9965.EPI-14-0458. [DOI] [PMC free article] [PubMed] [Google Scholar]
Associated Data
This section collects any data citations, data availability statements, or supplementary materials included in this article.


