

Abstract
Key points
Agonist‐dependent oscillations in the concentration of free cytosolic calcium are a vital mechanism for the control of airway smooth muscle contraction and thus are a critical factor in airway hyper‐responsiveness.
Using a mathematical model, closely tied to experimental work, we show that the oscillations in membrane potential accompanying the calcium oscillations have no significant effect on the properties of the calcium oscillations.
In addition, the model shows that calcium entry through store‐operated calcium channels is critical for calcium oscillations, but calcium entry through voltage‐gated channels has much less effect.
The model predicts that voltage‐gated channels are less important than store‐operated channels in the control of airway smooth muscle tone.
Abstract
Airway smooth muscle contraction is typically the key mechanism underlying airway hyper‐responsiveness, and the strength of muscle contraction is determined by the frequency of oscillations of intracellular calcium (Ca2+) concentration. In airway smooth muscle cells, these Ca2+ oscillations are caused by cyclic Ca2+ release from the sarcoplasmic reticulum, although Ca2+ influx via plasma membrane channels is also necessary to sustain the oscillations over longer times. To assess the relative contributions of store‐operated and voltage‐gated Ca2+ channels to this Ca2+ influx, we generated a comprehensive mathematical model, based on experimental Ca2+ measurements in mouse precision‐cut lung slices, to simulate Ca2+ oscillations and changes in membrane potential. Agonist‐induced Ca2+ oscillations are accompanied by oscillations in membrane potential, although the membrane potential oscillations are too small to generate large Ca2+ currents through voltage‐gated Ca2+ channels, and thus have little effect on the Ca2+ oscillations. Ca2+ entry through voltage‐gated channels only becomes important when the cell is depolarized (e.g. by a high external K+ concentration). As a result, agonist‐induced Ca2+ oscillations are critically dependent on Ca2+ entry through store‐operated channels but do not depend strongly on Ca2+ entry though voltage‐gated channels.
Keywords: airways, calcium dynamics, calcium influx, calcium signalling
Key points
Agonist‐dependent oscillations in the concentration of free cytosolic calcium are a vital mechanism for the control of airway smooth muscle contraction and thus are a critical factor in airway hyper‐responsiveness.
Using a mathematical model, closely tied to experimental work, we show that the oscillations in membrane potential accompanying the calcium oscillations have no significant effect on the properties of the calcium oscillations.
In addition, the model shows that calcium entry through store‐operated calcium channels is critical for calcium oscillations, but calcium entry through voltage‐gated channels has much less effect.
The model predicts that voltage‐gated channels are less important than store‐operated channels in the control of airway smooth muscle tone.
Abbreviations
- AHR
airway hyper‐responsiveness
- ASMC
airway smooth muscle cells
- bNa
basal Na+ channel
- bK
basal K+ channel
- ClCa
calcium‐activated Cl− channel
- InsP3
inositol (1,4,5)‐trisphosphate
- IPR
inositol (1,4,5)‐trisphosphate receptor
- KCa
calcium‐activated K+ channel
- Kdr
delayed‐rectifier K+ channel
- MCh
methacholine
- NaK
Na+‐K+ exchanger
- PCLS
precision‐cut lung slices
- ROCC
receptor‐operated Ca2+ channels
- RyR
ryanodine receptors
- SERCA
sarco/endoplasmic reticulum Ca2+‐ATPase
- SOCC
store‐operated Ca2+ channels
- SR
sarcoplasmic reticulum
- V
voltage across the plasma membrane
- VGCC
voltage‐gated Ca2+ channels
Introduction
Airway hyper‐responsiveness (AHR) (i.e. the excessive contraction of airway smooth muscle) is characteristic of asthma and is frequently the key mechanism responsible for difficulties in breathing. The contraction of airway smooth muscle cells (ASMC) reduces the airway diameter (Delmotte et al. 2010; Ressmeyer et al. 2010) and this dramatically increases airway resistance. Because airway smooth muscle contraction is primarily dependent on increases in intracellular Ca2+ concentration, it is essential to understand the dynamics of these Ca2+ signals in ASMC if we are to address the etiology of AHR and develop new therapeutic approaches. The major mechanism that initiates airway smooth muscle contraction is stimulation with agonists released from neurons or mast cells. These include ACh, 5‐hydroxytryptamine, histamine and leukotrienes, which bind to G‐protein‐coupled receptors in the plasma membrane (Delmotte et al. 2010). This leads to the activation of 1‐phosphatidylinositol‐4,5‐bisphosphate phosphodiesterase β, followed by the production of inositol (1,4,5)‐trisphosphate (InsP3), which diffuses into the cytosol and binds to InsP3 receptors (IPR) in the membrane between cytosol and sarcoplasmic reticulum (SR). Upon binding, InsP3 increases the open probability of the IPR to release Ca2+ from the SR into the cytosol.
This Ca2+ release occurs in the form of Ca2+ oscillations that propagate as Ca2+ waves along the ASMC. Each Ca2+ oscillation results from periodic Ca2+ release via the IPR followed by Ca2+ reuptake into the SR via Ca2+ ATPase pumps (SERCA). The frequency of these Ca2+ oscillations is proportional to the agonist concentration and ranges from 20 to 60 min−1 (Perez and Sanderson, 2005). These Ca2+ oscillations activate myosin light chain kinase which, in turn, phosphorylates regulatory myosin light chains to allow actin/myosin cross‐bridge cycling and the generation of force. Importantly, the frequency of the Ca2+ oscillations determines the extent of contraction (Perez and Sanderson, 2005; Bai and Sanderson, 2006; Marhl et al. 2006; Delmotte et al. 2010).
Although most of the Ca2+ released during each Ca2+ oscillation is returned to the SR, the cell loses some Ca2+ to the extracellular fluid as a result of Ca2+ ATPase activity in the plasma membrane. Thus, to sustain Ca2+ oscillations and the associated airway contraction, the ASMC requires a Ca2+ influx across the plasma membrane. A variety of major Ca2+ influx pathways have been identified in the ASMC, including (but not limited to) store‐operated, receptor‐operated and voltage‐gated Ca2+ channels (Marhl et al. 2006). Non‐specific Ca2+ channels, as well as Na+/Ca2+ exchangers, may also contribute to Ca2+ influx (Roux et al. 2006). However, it remains highly controversial as to which Ca2+ influx pathways are utilized by ASMC to maintain contraction. Because membrane depolarization is a significant regulator of contraction in vascular smooth muscle, and because membrane hyperpolarization, as mediated by localized Ca2+ signals and Ca2+‐dependent K+ channels, has been proposed as a mechanism mediating smooth muscle relaxation, voltage‐gated Ca2+ channels (VGCC) have been proposed as a major Ca2+ influx pathway in ASMC. By contrast, agonist‐induced Ca2+ oscillations in ASMC are based on Ca2+ release from the SR (Perez and Sanderson, 2005; Ressmeyer et al. 2010) which, more recently, was found to be strongly regulated by store‐operated Ca2+ channels (SOCC). The identification of this Ca2+ influx pathway is extremely important because it is a key mechanism contributing to AHR and therefore has the potential to serve as a novel therapeutic target.
Consequently, to evaluate the relative contributions of these two Ca2+ influx pathways, we have constructed a mathematical model of agonist‐induced Ca2+ dynamics in ASMC based on a wealth of experimental data obtained from responses of ASMC in mouse precision‐cut lung slices (PCLS), as described in full in the companion paper (Chen and Sanderson, 2017). Importantly, in addition to the SR ion channels and the Ca2+ ATPase pumps responsible for Ca2+ oscillations, this model incorporates the major plasma membrane ion channels that are assumed to contribute to establishment of membrane potential and that respond to changes in [Ca2+]. Thus, the model not only simulates the Ca2+ oscillation response to agonist stimulation, but also predicts the changes in membrane potential associated with these Ca2+ oscillations and the consequences that this has for Ca2+ influx either via SOCC or VGCC.
The outcome of our model simulations, many of which have been experimentally verified, is that, during agonist‐induced Ca2+ oscillations, the membrane potential oscillates as a result of Ca2+‐activated Cl− and K+ channels, although in a voltage range that has little effect on the opening of the VGCC. Thus, Ca2+ influx via VGCC is mainly the result of their baseline activity. By contrast, SOCC current increases with Ca2+ oscillations to mediate a Ca2+ influx that is similar in magnitude to that provided by the VGCC. Thus, ongoing agonist‐induced Ca2+ oscillations are maintained by similar, but small, Ca2+ influxes via SOCC and VGCC. Perhaps more importantly, our model simulations predict experimental outcomes when VGCC or SOCC are inhibited. Consistent with the experimental results, our model simulations predict that the inhibition of SOCC results in a complete cessation of the Ca2+ oscillations, whereas the inhibition of VGCC results only in a slowing of Ca2+ oscillations. This behaviour is explained by the the ability of ASMC to increase SOCC activity and compensate for the loss of the Ca2+ influx via VGCC, whereas VGCC cannot compensate for the loss of SOCC activity. Thus, in terms of limiting or reversing AHR, store‐operated Ca2+ entry via SOCC is the most important contributor and thereby a target for novel bronchodilators.
Methods
All experimental methods relevant to the use of PCLS and the measurement of Ca2+ changes in ASMC to test model predictions are described in detail in the companion paper (Chen and Sanderson, 2017).
Mathematical model
A diagrammatic representation of our mathematical model of the ASMC is shown in Fig. 1. Importantly, the model includes components that describe the Ca2+ signalling of the ASMC, as well as components to model ionic current flow across the cell membrane.
Figure 1. Schematic diagram of the model.
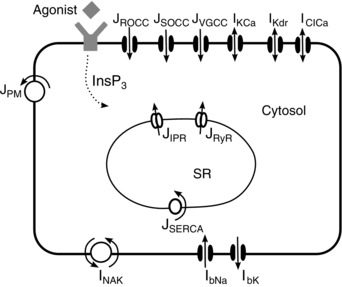
Agonist binding to G‐protein‐coupled receptors stimulates the production of InsP3, which diffuses into the cytosol. Calcium is released from the SR through IPR and RyR. Reuptake is via ATPase pumps (SERCA). Calcium effux is via the plasma membrane ATPase (PM) and influx is through ROCC, SOCC and L‐type VGCC Ca2+ channels. The model includes Ca2+‐activated K+ and Cl− channels (KCa) and (ClCa), the delayed rectifier K+ currents (Kdr), basal Na+ (bNa) and K+ currents (bK) and the Na+‐K+ exchanger (NaK). Calcium fluxes and currents are denoted by J, whereas currents of Na+ and K+ are denoted by I. [Colour figure can be viewed at wileyonlinelibrary.com]
The calcium signalling submodel
Our Ca2+ signalling submodel is an extension of the model of Cao et al. (2014) and is based on the following assumptions:
The IPR are modelled as in Cao et al. (2014), omitting any consideration of the stochastic opening of IPR. Our model is thus deterministic. Although localized Ca2+ increases (i.e. Ca2+ puffs) originating from IPR cluster activity are inherently random, Cao et al. (2014) showed that a deterministic model of the periodic Ca2+ oscillations resulting from the combined behaviour of multiple puffs will make the same predictions as a stochastic model, and thus has almost the same predictive power.
Ryanodine receptors (RyR) are modelled by an algebraic function of [Ca2+] (Friel, 1995), and extended with a store‐dependent term by Shannon et al. (2004) and Wang et al. (2010).
Stimulation by agonists causes an increased Ca2+ influx from outside that is neither voltage‐gated, nor dependent on the Ca2+ concentration in the SR. This current, often called a receptor‐operated Ca2+ current (ROCC) is modelled as previously (Sneyd et al. 2004; Wang et al. 2010). However, in ASMC, previous experimental/modelling work indicates that the ROCC current is considerably smaller than SOCC (Croisier et al. 2013).
Voltage‐gated Ca2+ entry through L‐type Ca2+ channels is modelled by an activation gating variable and a Goldman–Hodgkin–Katz driving force (LeBeau et al. 1997; Wang et al. 2010). The activation gating variable is assumed to be at instantaneous steady‐state because, outside of microdomains, the time scale of changes in Ca2+ concentration is typically orders of magnitude slower than the kinetics of ion channel gating variables, and this simplification does not affect the qualitative dynamics (Boie et al. 2016). Furthermore, the L‐type Ca2+ channel is not modelled as being dependent on the Ca2+ concentration, as it is, for example, in cardiac cells (Jafri et al. 1998; Greenstein et al. 2006; Hinch et al. 2006). This simplification is justified by the fact that L‐type channels in ASMC are not situated, as they are in cardiac cells, in diadic clefts, where the Ca2+ concentration becomes very high very quickly.
The plasma membrane Ca2+ ATPase pumps are modelled by a Hill equation (Wang et al. 2010).
Store‐operated Ca2+ entry is modelled by a steady‐state open probability (modelled by a Hill function) and a dynamic variable that results in a delay between depletion of the SR and opening of the SOCC (Croisier et al. 2013).
We do not model in detail the steps between agonist binding and InsP3 production. Instead, InsP3 is simply assumed to be an increasing function of agonist stimulation, and is usually treated as constant. Thus, as suggested by the experimental evidence (Sneyd et al. 2006), we ignore any possible effects of Ca2+ on InsP3 production or degradation.
The voltage submodel
The Ca2+ submodel is coupled to a model of ionic current flow across the cell membrane. In accordance with previous work by Roux et al. (2006), we have included Na+, K+ and Cl− channels. The large‐conductance Ca2+‐activated K+ channels (IKCa) are an important contributor to membrane hyperpolarization (Kume, 2014). The model for IKCa is adapted from Roux et al. (2006) and has been parametrized for canine tracheal cells. The delayed‐rectifier K+ channel (IKdr) further hyperpolarizes the cell. The model is taken from Roux et al. (2006) based on work perfomed in porcine and canine airway smooth muscle cells (Kotlikoff, 1990; Boyle et al. 1992). The Ca2+‐activated Cl− channel (IClCa) depolarizes the cell (Gallos and Emala, 2014). The model has been constructed using experimental data of rat tracheal myocytes (Roux et al. 2001). The Na+‐K+ ATPases (INaK) used in Roux et al. (2006) was inherited from OXSOFT cardiac models (Noble et al. 1999). Furthermore, contributions of background Na+ (IbNa) and K+ (IbK) channels are included.
Model validation
The model is validated by ensuring that it can reproduce the following experimental results from PCLS:
An agonist induces Ca2+ oscillations with a period of ∼1–5 s via the production of InsP3 (Computations not shown, but see figs 6 and 7 C in Perez and Sanderson, 2005).
Depolarizing the cell triggers slow Ca2+ oscillations (computations shown in Fig. 4A and B, which should be compared with fig. 6 in Perez and Sanderson, 2005).
Agonist‐induced Ca2+ oscillations followed by depolarization lead to oscillations very similar to agonist‐induced oscillations. Likewise, Ca2+ oscillations elicited by depolarization followed by application of agonist lead to oscillations similar to agonist‐induced oscillations (computations not shown, experimental data shown in fig. 4 C and F in Wang et al., 2010).
Treatment with caffeine and ryanodine leads to a plateau of Ca2+ and abolishes Ca2+ oscillations (computations not shown; experimental data in fig. 6 B in Ressmeyer et al. (2010).
Cyclopiazonic acid inhibits the SR pumps and stops oscillations (computations not shown, experimental results in fig. 6 A and 7 in Croisier et al., 2013).
In Ca2+‐free solutions, oscillations can be triggered by an agonist but cease after a short time (computations shown in Fig. 7 A, which should be compared with figs 8E and F in Perez and Sanderson, 2005).
Figure 7. Effect of voltage oscillations on agonist‐induced and depolarization‐induced Ca2+ oscillations.
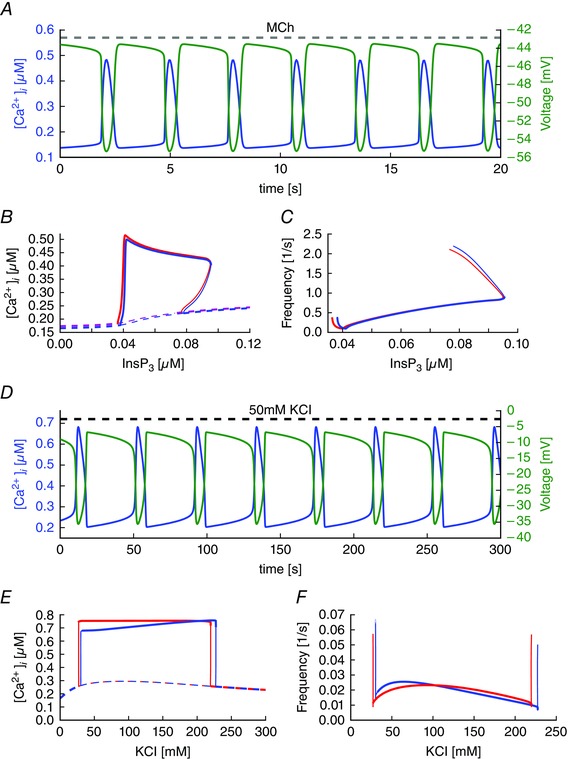
A, simulations of agonist‐induced ([InsP3] = 0.05 μM) oscillations in [Ca2+] and V. B and C, Comparison of models with oscillating voltage (blue curves) vs. fixed voltage near the maximum (V 0 = −43 mV; red curves). B, resting state (dashed lines) and the maximum of the Ca2+ concentration during oscillations (solid lines) for different values of InsP3 concentrations. Thick lines indicate stable solutions and thin lines indicate unstable solutions. C, frequency as a function of InsP3. D, simulations of KCl‐induced oscillations in [Ca2+] and V. Amplitude (E) and frequency (F) of KCl‐induced Ca2+ oscillations are shown in the presence of voltage oscillations (blue curves: dashed lines are steady‐state, solid lines denote the maximum [Ca2+] during an oscillation) and for a fixed voltage of the same average value (red curves). [Colour figure can be viewed at wileyonlinelibrary.com]
Figure 4. Depolarization‐induced Ca2+ oscillations and blocking of VGCC.
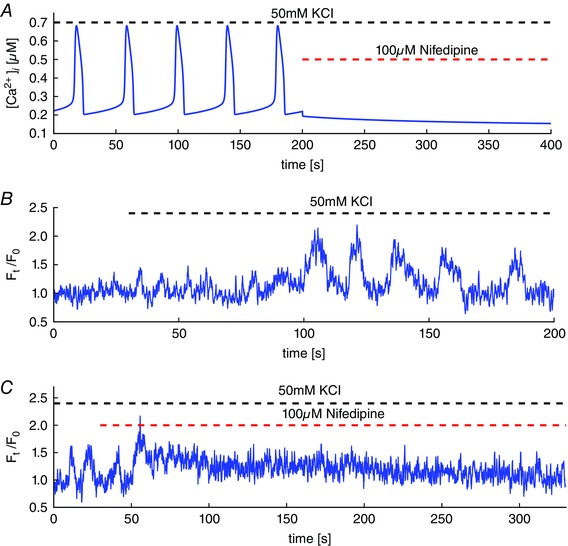
A, simulations of oscillations in the Ca2+ concentration by depolarization with 50 mM KCl. Blocking VGCC, in the model, leads to an abrupt stop of Ca2+ oscillations and the plateau of Ca2+ concentration decreases back to baseline. B, intracellular Ca2+ oscillations in mouse airway smooth muscle cells induced by depolarization with 50 mM KCl. Depolarization causes elevated Ca2+ entry through VGCC and leads to overfilling of internal stores. The result is periodic calcium‐induced Ca2+ release with periods of ∼30 s. C, subsequently blocking VGCC by 10 μM nifedipine causes the oscillations to stop abruptly. The elevated cytosolic Ca2+ is extruded and the Ca2+ concentration slowly returns to values close to the resting state before depolarization. [Colour figure can be viewed at wileyonlinelibrary.com]
Figure 6. Model simulations of currents through plasma membrane Ca2+ channels for different stimuli.
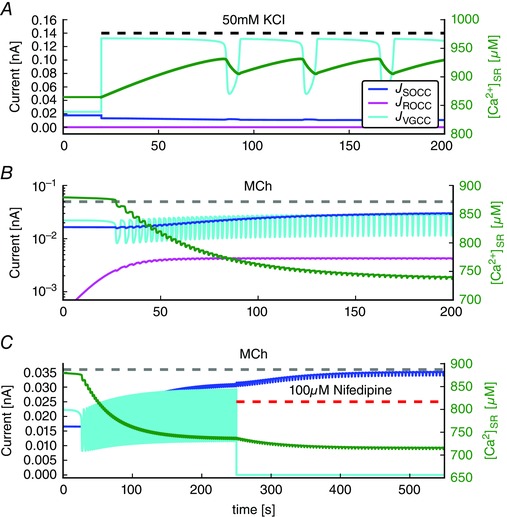
A, shows the currents of SOCC, ROCC, VGCC and the Ca2+ concentration in the SR ([Ca2+]SR) for depolarization‐induced oscillations (50 mM KCl). B, shows the same currents for agonist‐induced oscillations and [Ca2+]SR ([InsP3] = 0.05 μM). Note the log scale for the currents. C, shows the effect of blocking VGCC by nifedipine on the current through SOCC during agonist‐induced oscillations. Note the different time scale, and the small oscillations in J SOCC, which are caused almost entirely by the small oscillations in membrane potential (and thus in the driving force for Ca2+ current) that accompany the Ca2+ oscillations. [Colour figure can be viewed at wileyonlinelibrary.com]
Note that, in requiring our model to agree with these experimental data, we are implicitly requiring that our model is valid for Ca2+ oscillations in ASMC in PCLS. Other experimental data (e.g. from isolated airway smooth muscle cells) are not taken into account. This is because isolated ASMC can behave quite differently compared to those in PCLS. Because the reasons for this remain unclear, it would be unrealistic to try and construct a single model that can explain both isolated ASMC, as well as ASMC in PCLS. This set of experiments, all from PCLS, contains the major results that have been used previously to construct and validate models of Ca2+ signalling in ASMC from PCLS, and thus constitutes a set of results that must be satisfied for any new model to be at least as good as previous models. This is not to say that there are no other experiments from ASMC in PCLS that are not also important, nor to say that the model necessarily fits all these other possible data. However, to validate a model, it is necessary to choose which results are considered most important in determining the qualitative model structure. Here, we simply base our choice on previous work to ensure that, at the very least, our model can reproduce earlier theoretical results, and is thus not a step backwards.
Parameter values
Although it might appear that the model contains a very large number of parameters, which are thus relatively ill‐determined, allowing for great variability in model behaviour, this is not the case. Rather, the majority of the parameters have been well determined by previous studies.There are three principal groups of parameters.
-
1.
The parameters from Cao et al. (2014) control the detailed behaviour of the IPR and the calcium signalling, and determine such things as the period of the Ca2+ oscillations and the statistics of Ca2+ puffs. These parameters were determined by detailed modelling of ASMC Ca2+ oscillations, as well as from single‐channel data from IPR, and are regarded as known and fixed; with the exception of small changes required to combine the models of Wang et al. (2010), Croisier et al. (2013) and Cao et al. (2014). The work of Cao et al. (2014) was itself based on previous detailed models of the IPR (Siekmann et al., 2011, 2012) and on a detailed stochastic model of Ca2+ signalling in ASMC (Cao et al. 2013). In addition, some parameters of the RyR were taken from Wang et al. (2010) who constructed a detailed model of the interaction of IPR and RyR Ca2+ release in ASMC. All of these parameters are treated as known and fixed; they cannot be changed significantly without significant and unacceptable changes to the properties of the underlying Ca2+ signalling.
-
2.
The parameters from Roux et al. (2006) and Roux et al. (2001) control the electrical properties of the cell. The model of Roux et al. (2006) was designed specifically for ASMC and incorporated a wide array of previous experimental data, mostly collected from tracheal smooth muscle. Where data from airway smooth muscle was not available, data from gastric smooth muscle were used, or the parameters were determined by requiring physiological reasonable steady‐states. The model of Roux et al. (2006) is, by some way, the most detailed and reliable electrical model of an airway smooth muscle cell, and we take these parameters to be known and fixed, with the exception of the potassium concentrations, [Kint] and [Kext], and the maximum current through the plasma membrane pump.
-
3.
Finally, we treated a group of parameters as unknown, and adjusted them to obtain the correct behaviour as seen experimentally (Chen and Sanderson, 2017). The parameter modifications were performed manually (we did not fit parameters algorithmically by a Markov chain Monte Carlo procedure or similar method); after each modification, we ran simulations and checked whether the model satisfies all of the model validation criteria as outlined above.
These parameters were those controlling the relative magnitudes of the Ca2+ fluxes through SOCC, ROCC, VGCC and RyR. Finally, the ratio of Ca2+ transport across the plasma membrane to Ca2+ transport across the ER membrane was considered to be an adjustable parameter. Also, two parameters related to the maximal SERCA pump rate, as well as the plasma membrane pump rate, were modified. We were not able to find significantly different parameter sets that comply with experimental results.
The adjustable parameters are tightly constrained by the data. For example, the requirement that blockage of VGCC slows the oscillations by a small amount, whereas blockage of SOCC eliminates oscillations entirely, sets the ratio of the relative contributions of VGCC and SOCC. Similarly, the requirement that oscillations persist in the absence of external Ca2+, but persist for longer when SOCC is blocked, means that the ratio of currents through SOCC and ROCC can take only a narrow range of values. We hypothesize that, as long as the adjustable parameters are chosen so as to give more or less the same balance of Ca2+ fluxes, the model behaviour will remain qualitatively the same. In other words, a change in one parameter can be compensated for by a change in another parameter, although only as long as the ratios of the various Ca2+ fluxes remain unchanged. It is the ratio of the Ca2+ fluxes that matter, not the actual parameter values. Deviations of ∼10% in the relative Ca2+ fluxes through VGCC and SOCC, at the same time as keeping the total current through both channel types fixed (at rest), fails to reproduce critical experimental results (specifically the experimental results shown in fig. 4 C in Wang et al. (2010)). Thus, it is not the total inward Ca2+ current that matters, it is the ratio of the VGCC current to the SOCC current.
All computational code has been made available (https://github.com/sebboie/airway‐smooth‐muscle‐code).
Results
Store‐operated Ca2+ entry is critical for agonist‐induced oscillations
In ASMC, SOCC are activated when the SR Ca2+ concentration is low (Peel et al. 2006; Prakash et al. 2006; Billington et al. 2014). Furthermore, it has been argued that the Ca2+ influx during agonist‐induced oscillations is largely a result of SOCC (Sweeney et al. 2002; Billington et al. 2014).
In a Ca2+‐free medium, Ca2+ oscillations terminate as the cell becomes progressively depleted of Ca2+ (Fig. 2 A). The model predicts that blocking SOCC has a similar effect, although the Ca2+ oscillations persist for longer (Fig. 2 B). Furthermore, the model predicts that, in the absence of SOCC, it takes about three times as long for the oscillations to disappear compared to in the absence of extracellular Ca2+. This difference results from the fact that blocking SOCC does not block all Ca2+ influx. Ca2+ can still enter the cell via VGCC and ROCC, but removing Ca2+ from outside the cell prevents any Ca2+ influx. Thus, it is predicted that blockage of SOCC takes longer to eliminate oscillations than does removal of extracellular Ca2+.
Figure 2. Agonist‐induced Ca2+ oscillations and reduction of Ca2+ influx.
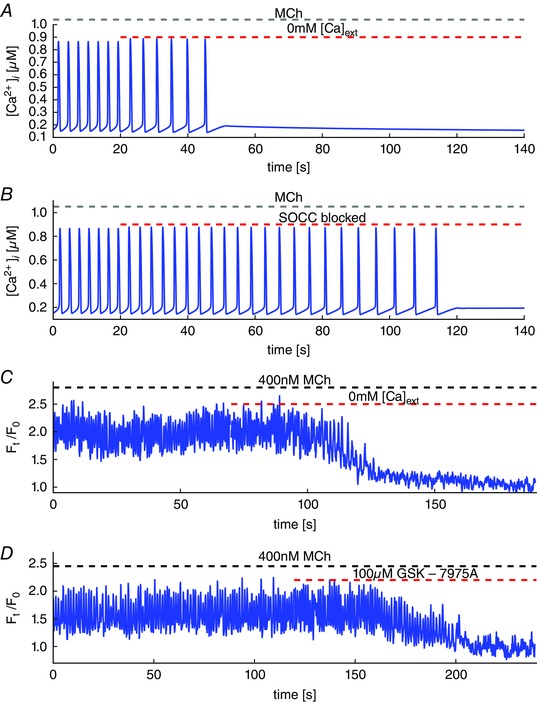
A, model simulation of Ca2+ oscillations stimulated by [InsP3] = 0.05 μM in the absence of extracellular Ca2+. During the oscillations, the cell loses Ca2+ and the oscillations cease after 30 s. B, the cell is subjected to the same stimulus and then the SOCC are blocked. Blocking SOCC stops the oscillations after ∼100 s. C, experimental results. Removal of extracellular Ca2+ results in disappearance of the oscillations after ∼40 s. D, blockage of SOCC by GSK‐7975A results in disappearance of the oscillations after ∼80 s. [Colour figure can be viewed at wileyonlinelibrary.com]
An experimental test of this prediction is shown in Fig. 2 C and D. Oscillations were stimulated with 400 nm methacholine (MCh) and then eliminated by exposing the lung slice to zero extracellular Ca2+ (Fig. 2 C) or by adding the SOCC blocker GSK‐7975A (Fig. 2 D). In the first case, removal of extracellular Ca2+ results in disappearance of the oscillations after ∼40 s, as predicted by the model, whereas blocking SOCC results in the disappearance of the oscillations after ∼80 s.
Voltage‐gated Ca2+ entry is less important than SOCC for agonist‐induced oscillations
By experimentally blocking VGCC and observing the effect on Ca2+ oscillations, we obtain an indirect measure of the relative contribution of VGCC and SOCC to total influx.
We stimulate ASMC by 400 nM MCh, which causes fast Ca2+ oscillations (period of ∼1.3 s) (Fig. 3 B and C). Then, we block VGCC using 100 μm nifedipine. The oscillations gradually slow down to a period of ∼2.3 s. Hence, the frequency has reduced by around one half after blocking VGCC. The corresponding model simulations are shown in Fig. 3 A. In both model and experiment, the nifedipine‐induced change in frequency is slow, taking over 100 s to change the frequency appreciably.
Figure 3. Agonist‐induced Ca2+ oscillations and blocking of VGCC.
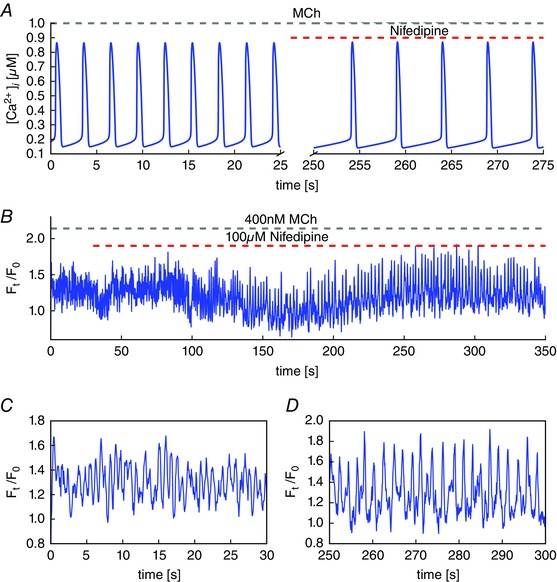
A, an agonist binding to the G‐coupled receptor leads to the production of InsP3. The simulations are performed with [InsP3] = 0.05 μM. The period is similiar to the experimental results (B and C). Blocking VGCC by nifedipine leads to slower oscillations with the period halved. B, oscillations triggered by 400 nM MCh followed by blocking voltage‐gated Ca2+ entry by 100 μM nifedipine. C, the first 30 s show fast oscillations with periods of ∼1 s. D, nifedipine slows down the oscillations to a period of ∼2 s. [Colour figure can be viewed at wileyonlinelibrary.com]
Depolarization‐induced Ca2+ oscillations entry are dependent on VGCC but not SOCC
Conversely, depolarization‐induced Ca2+ oscillations are critically dependent on Ca2+ entry through VGCC. We stimulate ASMC using 50 mM KCl, which causes depolarization of the plasma membrane. This depolarization increases the influx through VGCC. Sustained Ca2+ influx cause internal stores to overfill and release Ca2+ through RyR (Fig. 4 A). Reuptake of Ca2+ by SERCA pumps then leads to refilling of the SR, which overfills again (because the VGCC are still letting in Ca2+). Thus, oscillations arise from a cycle of SR overfilling followed by release of Ca2+.
Simulation of blocking VGCC abolishes the slow Ca2+ oscillations quickly (Fig. 4 A), in agreement with inhibition of the VGCC using 10 μm nifedipine (Fig. 4 C).
On the other hand, the model predicts that KCl‐induced oscillations remain mostly unaffected by blockage of SOCC (Fig. 5 A) and this prediction is also confirmed experimentally (Fig. 5 B). This is because the SR is overfilled with Ca2+ during KCl‐induced oscillations (thus activating Ca2+ release through RyR), in which case SOCC is minimized.
Figure 5. Depolarization‐induced Ca2+ oscillations and blocking of SOCC.
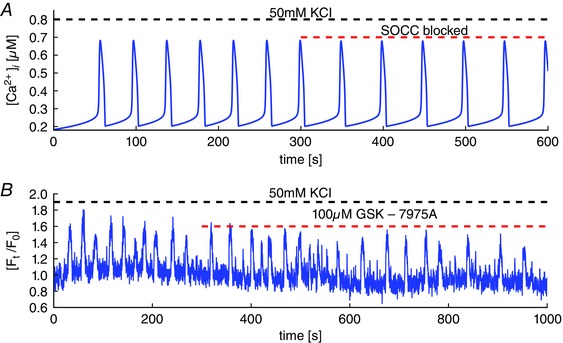
A, the model predicts that blockage of SOCC causes a slight decrease in the frequency of KCl‐induced oscillations, with no other significant effects. B, experimental test of the model prediction. Blockage of SOCC with GSK7975A has little effect on KCl‐induced oscillations, although there is no obvious decrease in oscillation frequency. [Colour figure can be viewed at wileyonlinelibrary.com]
SOCC current adapts to blockage of VGCC
During depolarization‐induced oscillations, the flux through the VGCC is the largest Ca2+ influx (Fig. 6 A) because the depolarization has increased the current through the VGCC nearly threefold compared to the current at rest. However, during agonist‐induced oscillations, the contributions as a result of VGCC and SOCC are of similar magnitude (Fig. 6 B), with the VGCC current being slightly smaller on average.
Initially, the fact that SOCC and VGCC currents are of similar magnitude during agonist‐induced oscillations would appear to be inconsistent with blockage of SOCC eliminating agonist‐induced oscillations, whereas blockage of VGCC does not. The explanation for this can be seen in Fig. 6 C.
Upon addition of nifedipine (in the presence of MCh), a slow depletion of the SR leads to a slow increase in SOCC, which partially counterbalances the decreased Ca2+ influx as a result of the blockage of VGCC. Conversely, upon blockage of SOCC, VGCC are unable to adapt in the same way because they are not dependent on the SR [Ca2+]. Thus, because SOCC adapt to blockage of VGCC, whereas VGCC do not adapt to blockage of SOCC, blocking the two different channels results in different qualitative effects.
Voltage oscillations have little effect on agonist‐induced or KCl‐induced Ca2+ oscillations
Agonist‐induced Ca2+ oscillations are accompanied by oscillations in the membrane voltage (Fig. 7 A). During Ca2+ release from the SR, the cell hyperpolarizes to almost −56 mV and, during the reuptake of Ca2+, the cell depolarizes to around −43 mV. The range over which the voltage oscillates is consistent with experimental recordings by ZhuGe et al. (2010).
However, these oscillations in membrane potential do not lead to large changes in the current through the VGCC (Fig. 6 B). Furthermore, the voltage oscillations have little effect on either the amplitude or the frequency of the Ca2+ oscillations. Figure 7 B and C compares the amplitude and frequency of a model with oscillating membrane voltage (blue curves) against a model with voltage fixed near the maximum of the voltage during agonist‐induced oscillations (V0 = −43.0 mV; red curves). Both the amplitude and frequency are almost unchanged, as indicated by the red and blue lines barely being distinguishable over a large range of the parameter values.
Of course, changes in voltage affect the driving force for ion transport across the plasma membrane. Consequently, changes in voltage change the currents through all ion channels. In particular, the current through SOCC is dependent on the voltage across the plasma membrane (Parekh and Putney, 2005; Vig et al. 2006). Although a significant, sustained change in voltage can have dramatic consequences on Ca2+ oscillations, our model demonstrates that the transient modulations of the ion fluxes that result from transient modulations of the voltage across the plasma membrane do not have a large effect on agonist‐induced Ca2+ oscillations.
During KCl‐induced oscillations, the membrane potential also oscillates, although now it is around a more depolarized average level (Fig. 7 D). However, just as with the agonist‐induced oscillations, forcing the membrane potential to remain constant at its average value results in little change in the amplitude (Fig. 7 E) or the frequency (Fig. 7 F) of the oscillations.
Discussion
We have constructed and studied a model of Ca2+ oscillations in ASMC, which includes a detailed treatment of electrical currents. Our model is thus able to determine how much the Ca2+ oscillations are affected by the voltage oscillations, and vice versa. The model itself is based on the previous models of Roux et al. (2006), Wang et al. (2010) and Croisier et al. (2013); electrical aspects of the model, particularly the models of the K+, Na+ and Cl− channels, are based on Roux et al. (2006), whereas the models of the Ca2+ dynamics, VGCC and ROCC, are adapted from Wang et al. (2010) and Roux et al. (2006). Croisier et al. (2013) did not model the Ca2+ oscillations directly but, instead, mimicked the release of Ca2+ from internal stores to focus on studying the voltage dynamics of ASMC. By contrast, we use a model for Ca2+ handling that allows Ca2+ oscillations based on Ca2+ release through InsP3 receptors (Cao et al. 2014) and RyR (Wang et al. 2010) and reuptake by the SR through pumps.
The major results from our model can be summarized as:
Although membrane potential (V) oscillates together with Ca2+ oscillations, oscillations in V have no significant effect on either agonist‐induced or depolarization‐induced Ca2+ oscillations.
During agonist‐induced oscillations (which occur through IPR), influx through VGCC is less important; blockage of VGCC does not stop agonist‐induced oscillations, it only causes a slow, small, decrease in oscillation frequency.
Agonist‐induced oscillations are critically dependent on Ca2+ influx through SOCC; blockage of SOCC stops agonist‐induced oscillations.
During agonist‐induced oscillations, both Ca2+ influx pathways, SOCC and VGCC, have similar magnitudes. Nevertheless, agonist‐induced Ca2+ oscillations are critically dependent on influx through SOCC but not on influx through VGCC. This is because blockage of VGCC leads to a decrease in SR [Ca2+], which leads to a compensating increase in SOCC. Thus, influx through SOCC adapts to changes in VGCC. However, VGCC do not adapt to changes in SOCC.
During depolarization‐induced Ca2+ oscillations (which occur through RyR and are dependent on periodic overfilling and emptying of the SR), the major Ca2+ influx pathway is via VGCC. Blockage of VGCC stops depolarization‐induced oscillations abruptly.
Influx through SOCC is less important for depolarization‐induced oscillations. In the model, blockage of SOCC causes only a small decrease in oscillation frequency, whereas, in the experiments, blockage of SOCC causes no significant change in oscillation frequency.
Our conclusions are consistent with those of Roux et al. (2006) who predict that cholinergic stimulation (e.g. stimulation by an agonist) does not lead to substantial Ca2+ influx through VGCC.
However, our results are in contrast to a conclusion made by Zhang et al. (2013), who measured the effect of L‐type VGCC blockers in isolated mouse ASMC, and found that VGCC blockers are able to reverse the MCh‐induced contraction of ASMC. From this finding, they deduce that VGCC are the major contributor to Ca2+ influx during agonist‐induced contraction.
There are two possible explanations for this discrepancy. First, Zhang et al. (2013) performed their experiments in isolated ASMC, which do not have the same properties as ASMC in PCLS, such as we used in our experiments. Second, Zhang et al. (2013) employed a protocol of depolarization (by 20 mM KCl) combined with MCh. Such a depolarization upregulates VGCC and shifts the balance to a stronger contribution of VGCC compared to SOCC. Under such conditions, where VGCC has been increased above its resting level, blockage of VGCC is predicted to have a greater effect on agonist‐induced Ca2+ oscillations.
Our results, both theoretical and experimental, have the corollary that modulation of VGCC is not, in general, an effective way to control ASMC tone. If the cell is initially depolarized, then blockage of VGCC will cause a significant reduction of Ca2+ influx and thus relax the cell. However, in cases where the cell is not depolarized (i.e. at rest, or during agonist‐induced oscillations) there is little Ca2+ coming in through VGCC, in which case blockage of VGCC has little effect on contraction.
In other muscle cells, such as striated muscle (Flucher and Franzini‐Armstrong, 1996), vascular smooth muscle (Janssen et al. 2001), gastrointestinal smooth muscle (Bolton et al. 1999) and heart muscle (Bers, 2002), depolarization and voltage‐gated Ca2+ entry leads to influx of Ca2+, followed by calcium‐induced Ca2+ release. Local Ca2+ release from the SR through the RyR can activate big‐conductance Ca2+‐activated K+ channels, resulting in a spontaneous transient outward current that hyperpolarizes the cell. This hyperpolarization reduces the conductivity of the VGCC and decreases the Ca2+ influx, which may then lead to relaxation (ZhuGe et al. 2010; Lifshitz et al. 2011; Janssen, 2012; Zhang et al. 2013; Kume, 2014). Lifshitz et al. (2011) demonstrated the spatial proximity of two subtypes of RyR to K+ channels and ZhuGe et al. (2010) report experimental evidence that local Ca2+ release (sparks) lead to biphasic responses in the membrane potential.
However, our results suggest that this potential mechanism does not have a significant effect on Ca2+ signalling in ASMC in PCLS; the contribution of VGCC to the overall Ca2+ influx during agonist‐induced oscillations is not sufficiently large for VGCC inhibition to affect Ca2+ signalling significantly. Furthermore, Ca2+ sparks are not observed experimentally in ASMC from PCLS. Although inhibition of VGCC has a significant effect on depolarization‐induced Ca2+ oscillations, these are unphysiological. Thus, any physiological effect that VGCC inhibition might have on relaxation probably occurs via other mechanisms that are independent of Ca2+.
Spatial inhomogeneities may affect depolarization and hyperpolarization during Ca2+ oscillations. The hyperpolarization is mainly established by the big‐conductance K+ and the delayed‐rectifier K+ channels. Depolarization is mainly induced by the activity of the Ca2+‐activated Cl−. In our case, these channels ‘see’ the cytosolic Ca2+ concentration, whereas, in reality, the Ca2+ at their respective channel mouths may be very different. Nevertheless, the time course of the membrane potential in our model is consistent with recordings by ZhuGe et al. (2010).
In ASMC, there is evidence that SOCC are activated when SR Ca2+ concentration is sufficiently depleted (Ay et al., 2004, 2006; Pabelick et al. 2004; Prakash et al. 2006). We predict that partially blocking SOCC leads to a reduced frequency of Ca2+ oscillations. Furthermore, blocking SOCC entirely leads to a complete stop of Ca2+ oscillations. Our model shows that fully blocking SOCC stops Ca2+ oscillations, although it takes around three times longer compared to oscillations with all Ca2+ influx prevented. This model prediction is confirmed experimentally, although the time courses do not agree exactly. Experimentally, blockage of SOCC eliminates Ca2+ oscillations after ∼80 s, whereas, in the model, the oscillations take ∼100 s to disappear after SOCC are blocked. This result is consistent with that of Sweeney et al. (2002), who show that SOCC contribute significantly to agonist‐induced contraction in rat and human ASMC.
There are multiple possible reasons why the model gives the correct qualitative prediction about the disappearance of oscillations but is quantitatively inaccurate. Most importantly, the model is a highly simplified model of an ASMC, taking into account neither the spatial inhomogeneities of the cell, nor the stochastic properties of the Ca2+ oscillations, particularly at low agonist or Ca2+ concentrations. At such low concentrations, the stochastic nature of InsP3 receptor kinetics becomes more important, leading to longer and more irregular interspike intervals in the tail when the ASMC is in a calcium‐free medium or when SOCC are blocked (Fig. 2). Our model is unable, a priori, to reproduce such stochastic variability. Similarly, spatial inhomogeneity in the distributions of IPR and RyR may affect the time it takes until oscillations cease.
It is also possible that our model is underestimating the relative size of the SOCC current, and that Ca2+ influx through VGCC is even less important than predicted by our model. If so, this would lead to faster disappearance of the model oscillations upon blockage of SOCC, and a lower decrease in oscillation frequency upon blockage of VGCC. However, this simply reinforces our overall conclusion that SOCC is the important influx pathway during agonist‐induced oscillations; our model certainly has quantitative inaccuracies, although they probably understate, rather than overstate, our point.
There are many other quantitative discrepancies between our model and the data. The model oscillations have shapes that are more or less correct but incorrect in detail, whereas the baseline Ca2+ concentrations, both for oscillations and for the steady concentrations (e.g. compare Fig. 2 A and 2 C or Fig. 4 A and 4 C) are not always in good agreement. Some of this is no doubt a result of inaccuracies caused by our neglect of detailed Ca2+ buffering, our neglect of the dynamics of the Ca2+ fluorescent dye, and the probable effects of Ca2+ microdomains and spatial heterogeneities. It is also possible that some of these quantitative discrepancies might be removed by different choices of parameter values (although, given the difficulty that Ca2+ models have had, for over two decades, regarding reproducing exact oscillation shapes and baselines, we consider this to be highly improbable).
The caution noted by Roux et al. (2006) applies to our mathematical model as well, which is constructed using data from different species. The models for the ion channels are constructed and parametrized for canine, porcine, rat and mice. Similarly, the model for RyR is based on bullfrog sympathetic neurons and the model for IPR is parametrized by IPR data obtained in DT40 cells (Wagner and Yule, 2012). There is no dataset available characterizing the main ion channels and Ca2+ handling pathways for a single species. Thus, quantitative predictions should be treated with caution.
However, the qualitative predictions of the mathematical model agree with all available experimental data (from PCLS) of Ca2+ measurements during agonist‐induced and depolarization‐induced oscillations, and yield testable predictions about the importance (or lack thereof) of voltage dynamics on the intracellular Ca2+ handling, the effect of (partially) blocking SOCC and the time it takes until oscillations stop in the absence of influx through SOCC. The qualitative predictions are not sensitive to parameter fine tuning, and have been confirmed experimentally, which gives us confidence in the predictive power of the model.
Additional information
Competing interests
The authors declare that they have no competing interests.
Author contributions
MJS and JS devised the study. SB wrote the first draft and constructed the mathematical model. JC and SB obtained and analysed the data. All authors interpreted the data and critically revised the manuscript. All persons designated as authors qualify for authorship, and all those who qualify for authorship are listed. All authors have approved the final version of the manuscript.
Funding
This work was supported by a grant from the Marsden Fund of the Royal Society of New Zealand, by NIH grant HL103405 and by UMMS overhead funds.
References
- Ay B, Iyanoye A, Sieck GC, Prakash YS & Pabelick CM (2006). Cyclic nucleotide regulation of store‐operated Ca2+ influx in airway smooth muscle. Am J Physiol Lung Cell Mol Physiol 290, L278–L283. [DOI] [PubMed] [Google Scholar]
- Ay B, Prakash YS, Pabelick CM & Sieck GC (2004). Store‐operated Ca2+ entry in porcine airway smooth muscle. Am J Physiol Lung Cell Mol Physiol 286, L909–L917. [DOI] [PubMed] [Google Scholar]
- Bai Y & Sanderson MJ (2006). Airway smooth muscle relaxation results from a reduction in the frequency of Ca2+ oscillations induced by a cAMP‐mediated inhibition of the IP3 receptor. Respir Res 7, 1–20. [DOI] [PMC free article] [PubMed] [Google Scholar]
- Bers DM (2002). Cardiac excitation–contraction coupling. Nature 415, 198–205. [DOI] [PubMed] [Google Scholar]
- Billington CK, Hall IP & Nelson CP (2014). Mechanisms underlying Ca2+ store refilling in airway smooth muscle In Calcium Signaling In Airway Smooth Muscle Cells, pp. 177–193. Springer, Cham, Switzerland. [Google Scholar]
- Boie S, Kirk V, Sneyd J & Wechselberger M (2016). Effects of quasi‐steady‐state reduction on biophysical models with oscillations. J Theor Biol 393, 16–31. [DOI] [PubMed] [Google Scholar]
- Bolton TB, Prestwich SA, Zholos AV & Gordienko DV (1999). Excitation–contraction coupling in gastrointestinal and other smooth muscles. Annu Rev Physiol 61, 85–115. [DOI] [PubMed] [Google Scholar]
- Boyle J, Tomasic M & Kotlikoff M (1992). Delayed rectifier potassium channels in canine and porcine airway smooth muscle cells. J Physiol (Lond) 447, 329–350. [DOI] [PMC free article] [PubMed] [Google Scholar]
- Cao P, Donovan G, Falcke M & Sneyd J (2013). A stochastic model of calcium puffs based on single‐channel data. Biophys J 105, 1133–1142. [DOI] [PMC free article] [PubMed] [Google Scholar]
- Cao P, Tan X, Donovan G, Sanderson MJ & Sneyd J (2014). A deterministic model predicts the properties of stochastic calcium oscillations in airway smooth muscle cells. PLoS Comput Biol 10, e1003783. [DOI] [PMC free article] [PubMed] [Google Scholar]
- Chen J & Sanderson MJ (2017). Store‐operated calcium entry is required for the sustained contraction and Ca2+ oscillations of airway smooth muscle. J Physiol 595, 3203–3218. [DOI] [PMC free article] [PubMed] [Google Scholar]
- Croisier H, Tan X, Perez‐Zoghbi JF, Sanderson MJ, Sneyd J & Brook BS (2013). Activation of store‐operated calcium entry in airway smooth muscle cells: Insight from a mathematical model. PLoS ONE 8, e69598. [DOI] [PMC free article] [PubMed] [Google Scholar]
- Delmotte P, Ressmeyer AR, Bai Y & Sanderson MJ (2010). Mechanisms of airway smooth muscle relaxation induced by Beta2‐adrenergic agonists. Front Biosci 15, 750–764. [DOI] [PubMed] [Google Scholar]
- Flucher BE & Franzini‐Armstrong C (1996). Formation of junctions involved in excitation–contraction coupling in skeletal and cardiac muscle. Proc Natl Acad Sci USA 93, 8101–8106. [DOI] [PMC free article] [PubMed] [Google Scholar]
- Friel D (1995). [Ca2+]i oscillations in sympathetic neurons: An experimental test of a theoretical model. Biophys J pp. 1752–1766. [DOI] [PMC free article] [PubMed] [Google Scholar]
- Gallos G & Emala CWS (2014). Calcium‐activated chloride channels In Calcium Signaling In Airway Smooth Muscle Cells, pp. 85–106. Springer, Cham, Switzerland. [Google Scholar]
- Greenstein JL, Hinch R & Winslow RL (2006). Mechanisms of excitation‐contraction coupling in an integrative model of the cardiac ventricular myocyte. Biophys J 90, 77–91. [DOI] [PMC free article] [PubMed] [Google Scholar]
- Hinch R, Greenstein J & Winslow R (2006). Multi‐scale models of local control of calcium induced calcium release. Prog Biophys Mol Biol 90, 136–50. [DOI] [PubMed] [Google Scholar]
- Jafri MS, Rice JJ & Winslow RL (1998). Cardiac Ca2+ dynamics: the roles of ryanodine receptor adaptation and sarcoplasmic reticulum load. Biophys J 74, 1149–68. [DOI] [PMC free article] [PubMed] [Google Scholar]
- Janssen LJ (2012). Airway smooth muscle electrophysiology in a state of flux? Am J Physiol Lung Cell Mol Physiol 302, L730–L732. [DOI] [PubMed] [Google Scholar]
- Janssen LJ, Lu‐Chao H & Netherton S (2001). Excitation–contraction coupling in pulmonary vascular smooth muscle involves tyrosine kinase and rho kinase. Am J Physiol Lung Cell Mol Physiol 280, L666–L674. [DOI] [PubMed] [Google Scholar]
- Kotlikoff MI (1990). Potassium currents in canine airway smooth muscle cells. Am J Physiol Lung Cell Mol Physiol 259, L384–L395. [DOI] [PubMed] [Google Scholar]
- Kume H (2014). Large‐conductance calcium‐activated potassium channels In Calcium Signaling In Airway Smooth Muscle Cells, pp. 49–83. Springer, Cham, Switzerland. [Google Scholar]
- LeBeau AP, Robson AB, McKinnon AE, Donald RA & Sneyd J (1997). Generation of action potentials in a mathematical model of corticotrophs. Biophys J 73, 1263–1275. [DOI] [PMC free article] [PubMed] [Google Scholar]
- Lifshitz LM, Carmichael JD, Lai FA, Sorrentino V, Bellve K, Fogarty KE & ZhuGe R (2011). Spatial organization of RyRs and bK channels underlying the activation of STOCs by Ca2+ sparks in airway myocytes. J Gen Physiol 138, 195–209. [DOI] [PMC free article] [PubMed] [Google Scholar]
- Marhl M, Noble D & Roux E (2006). Modelling of molecular and cellular mechanisms involved in Ca2+ signal encoding in airway myocytes. Cell Biochem Biophys 46, 64–87. [DOI] [PubMed] [Google Scholar]
- Noble D, DiFrancesco D, Noble S (1999). Oxsoft Heart Program Manual, Oxford, UK. [Google Scholar]
- Pabelick CM, Ay B, Prakash Y & Sieck GC (2004). Effects of volatile anesthetics on store‐operated Ca2+ influx in airway smooth muscle. Anesthesiology 101, 373–380. [DOI] [PubMed] [Google Scholar]
- Parekh AB & Putney JW (2005). Store‐operated calcium channels. Physiol Rev 85, 757–810. [DOI] [PubMed] [Google Scholar]
- Peel SE, Liu B & Hall IP (2006). A key role for STIM1 in store‐operated calcium channel activation in airway smooth muscle. Respir Res 7, 119–127. [DOI] [PMC free article] [PubMed] [Google Scholar]
- Perez JF & Sanderson MJ (2005). The frequency of calcium oscillations induced by 5‐HT, ACh, and KCl determine the contraction of smooth muscle cells of intrapulmonary bronchioles. J Gen Physiol 125, 535–553. [DOI] [PMC free article] [PubMed] [Google Scholar]
- Prakash Y, Iyanoye A, Ay B, Sieck GC & Pabelick CM (2006). Store‐operated Ca2+ influx in airway smooth muscle: Interactions between volatile anesthetic and cyclic nucleotide effects. Anesthesiology 105, 976–983. [DOI] [PubMed] [Google Scholar]
- Ressmeyer AR, Bai Y, Delmotte P, Uy KF, Thistlethwaite P, Fraire A, Sato O, Ikebe M & Sanderson MJ (2010). Human airway contraction and formoterol‐induced relaxation is determined by Ca2+ oscillations and Ca2+ sensitivity. Am J Respir Cell Mol Biol 43, 179–91. [DOI] [PMC free article] [PubMed] [Google Scholar]
- Roux E, Noble PJ, Hyvelin JM & Noble D (2001). Modelling of Ca2+‐activated chloride current in tracheal smooth muscle cells. Acta Biotheor 49, 291–300. [DOI] [PubMed] [Google Scholar]
- Roux E, Noble PJ, Noble D & Marhl M (2006). Modelling of calcium handling in airway myocytes. Prog Biophys Mol Biol 90, 64–87. [DOI] [PubMed] [Google Scholar]
- Shannon TR, Wang F, Puglisi J, Weber C & Bers DM (2004). A mathematical treatment of integrated Ca2+ dynamics within the ventricular myocyte. Biophys J 87, 3351–3371. [DOI] [PMC free article] [PubMed] [Google Scholar]
- Siekmann I, Wagner LE, Yule D, Crampin EJ & Sneyd J (2012). A kinetic model for type I and II IP3R accounting for mode changes. Biophys J 103, 658–668. [DOI] [PMC free article] [PubMed] [Google Scholar]
- Siekmann I, Wagner LE, Yule D, Fox C, Bryant D, Crampin EJ & Sneyd J (2011). MCMC estimation of Markov models for ion channels. Biophys J 100, 1919–1929. [DOI] [PMC free article] [PubMed] [Google Scholar]
- Sneyd J, Tsaneva‐Atanasova K, Reznikov V, Bai Y, Sanderson MJ & Yule DI (2006). A method for determining the dependence of calcium oscillations on inositol trisphosphate oscillations. Proc Natl Acad Sci USA 103, 1675–80. [DOI] [PMC free article] [PubMed] [Google Scholar]
- Sneyd J, Tsaneva‐Atanasova K, Yule D, Thompson J & Shuttleworth T (2004). Control of calcium oscillations by membrane fluxes. Proc Natl Acad Sci USA 101, 1392–1396. [DOI] [PMC free article] [PubMed] [Google Scholar]
- Sweeney M, McDaniel SS, Platoshyn O, Zhang S, Yu Y, Lapp BR, Zhao Y, Thistlethwaite PA & Yuan JXJ (2002). Role of capacitative Ca2+ entry in bronchial contraction and remodeling. J Appl Physiol 92, 1594–1602. [DOI] [PubMed] [Google Scholar]
- Vig M, Peinelt C, Beck A, Koomoa D, Rabah D, Koblan‐Huberson M, Kraft S, Turner H, Fleig A, Penner R et al. (2006). Cracm1 is a plasma membrane protein essential for store‐operated Ca2+ entry. Science 312, 1220–1223. [DOI] [PMC free article] [PubMed] [Google Scholar]
- Wagner LE & Yule DI (2012). Differential regulation of the InsP3 receptor type 1 and 2 single channel properties by InsP3, Ca2+ and ATP. J Physiol (Lond) 590, 3245–3259. [DOI] [PMC free article] [PubMed] [Google Scholar]
- Wang IY, Bai Y, Sanderson MJ & Sneyd J (2010). A mathematical analysis of agonist‐ and KCl‐induced Ca2+ oscillations in mouse airway smooth muscle cells. Biophys J 98, 1170–1181. [DOI] [PMC free article] [PubMed] [Google Scholar]
- Zhang CH, Lifshitz LM, Uy KF, Ikebe M, Fogarty KE & ZhuGe R (2013). The cellular and molecular basis of bitter tastant‐induced bronchodilation. PLoS Biol 11, e1001501. [DOI] [PMC free article] [PubMed] [Google Scholar]
- ZhuGe R, Bao R, Fogarty KE & Lifshitz LM (2010). Ca2+ sparks act as potent regulators of excitation‐contraction coupling in airway smooth muscle. J Biol Chem 285, 2203–2210. [DOI] [PMC free article] [PubMed] [Google Scholar]