

Abstract
Brain insulin sensitivity is an important link between metabolism and cognitive dysfunction. Intranasal insulin is a promising tool to investigate central insulin action in humans. We evaluated the acute effects of 160 U intranasal insulin on resting-state brain functional connectivity in healthy young adults. Twenty-five lean and twenty-two overweight and obese participants underwent functional magnetic resonance imaging, on two separate days, before and after intranasal insulin or placebo application. Insulin compared to placebo administration resulted in increased functional connectivity between the prefrontal regions of the default-mode network and the hippocampus as well as the hypothalamus. The change in hippocampal functional connectivity significantly correlated with visceral adipose tissue and the change in subjective feeling of hunger after intranasal insulin. Mediation analysis revealed that the intranasal insulin induced hippocampal functional connectivity increase served as a mediator, suppressing the relationship between visceral adipose tissue and hunger. The insulin-induced hypothalamic functional connectivity change showed a significant interaction with peripheral insulin sensitivity. Only participants with high peripheral insulin sensitivity showed a boost in hypothalamic functional connectivity. Hence, brain insulin action may regulate eating behavior and facilitate weight loss by modifying brain functional connectivity within and between cognitive and homeostatic brain regions.
Introduction
Interactions between the central and peripheral nervous system influence various metabolic and cognitive functions1, 2. In this process, numerous hormonal signals play an important role to exert their effects on eating behavior and body weight2. Insulin is a major peripheral hormone released after food intake and the reduced ability of insulin to act on its target tissue, i.e. insulin resistance (IR), is a hallmark of type 2 diabetes mellitus (T2D) and obesity. Moreover, there is growing evidence that IR is an important link between metabolic diseases and deteriorating cognitive function3–5. While there is considerable evidence on the pathomechanisms of peripheral IR, central or brain IR is much less characterized in humans. It is clear meanwhile that insulin action in the brain goes beyond the homeostatic center (i.e. the hypothalamus) extending to other brain regions. To unravel the role of brain insulin action in humans, the intranasal approach is an efficient tool to deliver the peptide directly to the CNS compartment, practically bypassing the body periphery6. Neuroimaging revealed that intranasal insulin administration modulates brain networks involved in homeostatic control, reward processing, and cognitive control functions, thus, influencing different aspects of human behavior (for review see refs 4, 7, 8). Furthermore, intranasal insulin produces multiple behavior and metabolic effects9. Acutely applied intranasal insulin decreases energy intake10 and wanting for sweet foods11. It intensifies satiety12, modulates olfactory and gustatory sensitivity13, 14 and even improves peripheral insulin sensitivity15. This is in line with animal studies confirming the central catabolic action of insulin (e.g. refs 16–18). Studies on cognitive effects indicate that hippocampal-dependent memory processes benefit particularly from intranasal insulin in humans19–24. Similarly, rodent studies have shown that insulin plays an important role in regulating synaptic plasticity in the hippocampus25, 26. More recently, evidence accumulates that it is possible to improve cognitive functions in patients with T2D and early Alzheimer’s disease by enhancing brain insulin action using intranasal insulin20–23, 27–31. Furthermore, the observed improvement in cognitive functions in T2D patients is related to an increase in functional connectivity within the default-mode network (DMN), which is linked to higher cognitive functions as decision-making and memory31. The DMN comprises a brain network exhibiting high functional connectivity between the frontal, lateral parietal cortices, precuneus and the temporal cortex including the hippocampus. Numerous studies have pointed to disruptions in functional connectivity within the DMN especially in neurological and neuropsychiatric disorders32. However, also T2D and obesity are related to altered functional connectivity of the DMN preceding brain atrophy and cognitive impairment33–36. Furthermore, evidence has accumulated that, in cognitively healthy young overweight and obese humans, insulin resistance affects regions of the DMN4. Besides the hypothalamus, obesity-associated brain IR affects predominantly higher cognitive brain regions especially the prefrontal regions included in the DMN11, 37–39. Furthermore, a recent study has shown that the central hubs of the DMN, the posterior cingulate cortex and medial prefrontal cortex, are functionally closely connected to the hypothalamus40, 41. However, it is currently not clear whether it is possible to boost functional connectivity of the DMN in young overweight and obese brain insulin resistant individuals to improve their eating behavior and metabolism.
We hypothesize that intranasal insulin may acutely enhance signaling in the DMN and between the hypothalamus and the DMN in healthy young lean, overweight and obese adults. Furthermore, we hypothesize that this modification is related to peripheral metabolism and eating behavior. For this purpose, we acquired resting-state functional magnetic resonance imaging (fMRI) to measure functional connectivity of the brain in response to intranasal insulin and placebo administration.
Results
We evaluated insulin versus placebo-induced changes in functional connectivity in the DMN in lean, overweight and obese participants 30 min after spray application. For this purpose, we used four different DMN seed regions for the analyses (Supplementary Figure 1). This included the core regions and the prefrontal regions of the DMN, as the prefrontal cortex (PFC) is particular insulin responsive. The functional connectivity (FC) map of each network is shown in Supplementary Figure 2. We additionally included a peripheral insulin sensitivity index, assessed by an oral glucose tolerance test on a separate day, as a covariate into the design. Hence, we were able to evaluate potential interactions between central and peripheral insulin sensitivity.
We observed a main effect of group (body weight) in the precuneus within the default-mode network (F = 18.30; pFWE < 0.05 whole-brain corrected; MNI coordinates x: 0 y: −54 z: 60) (Fig. 1). Overweight/obese compared to lean participants revealed increased FC between the posterior cingulate cortex and the precuneus on both insulin and placebo day.
Figure 1.
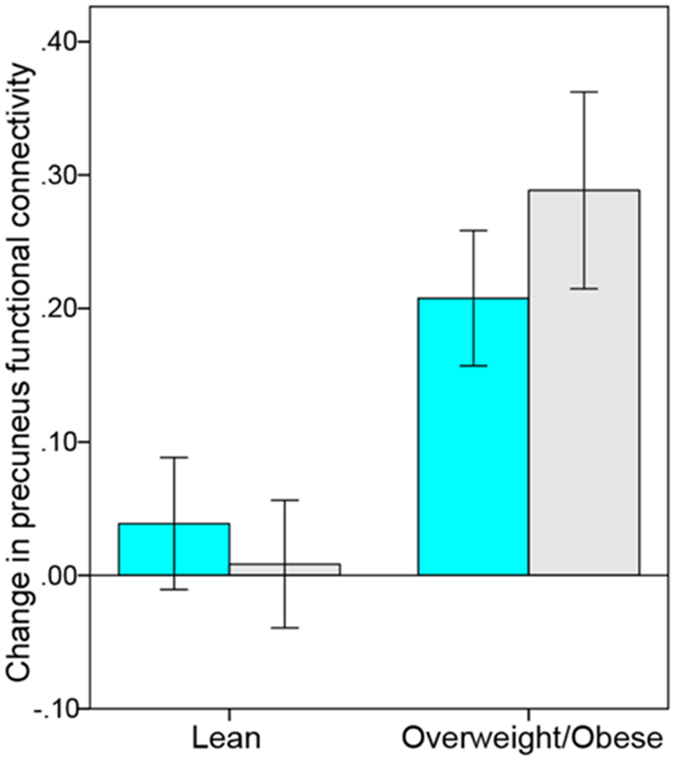
Change in functional connectivity in default-mode network (DMN) based on the posterior cingulate seed region after intranasal insulin (cyan) and placebo (gray) spray. Overweight and obese participants showed a stronger increase in precuneus functional connectivity (rsfMRI2 minus rsfMRI1) on both insulin and placebo day compared to lean participants (pFWE < 0.05, whole-brain corrected).
Insulin-induced changes in functional connectivity in the default-mode network
We observed a significant main effect of condition (insulin vs placebo) within the default-mode network, resulting in increased functional connectivity after intranasal insulin compared to placebo application in the hippocampus (pFWE < 0.05 small volume corrected). Specifically, insulin increased functional connectivity between the anterior medial PFC and the right hippocampus (F = 13.85; pFWE < 0.05 small volume corrected; MNI coordinates x: 33 y: −27 z: −9) (Fig. 2) and between the dorsal medial PFC and the right hippocampus (F = 15.44; pFWE < 0.05 small volume corrected; MNI coordinates x: 33 y: −21 z: −9) (Fig. 3). No significant group differences (body weight) were observed. Furthermore, we performed multiple regression analyses to investigate the relationship between the change in FC with hunger rating scores and different fat compartments. The change in FC between the dorsal medial PFC and the hippocampus significantly correlated with visceral adipose tissue (VAT) (T = 3.9, p < 0.001; r = 0.496; radj = 0.529 adjusted for BMI, age, sex, and total intracranial volume (TICV)) and with the change in subjective feeling of hunger 120 minutes after intranasal insulin spray application (T = −3.6, p = 0.001; r = −0.476; radj = −0.504 adjusted for BMI, age, sex, and TICV). No such correlations were observed for change in FC between the anterior medial PFC and the hippocampus and on the placebo day.
Figure 2.
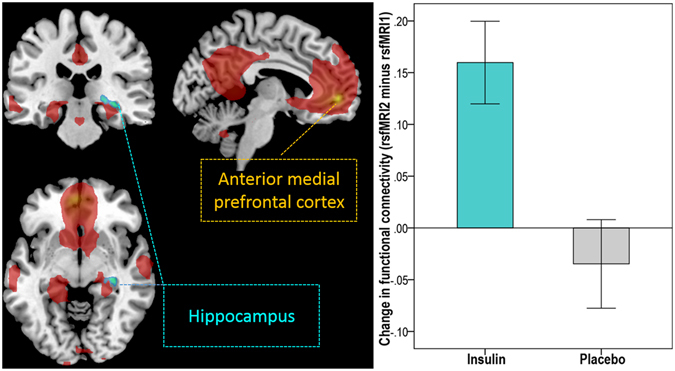
Intranasal insulin increased functional connectivity between the anterior medial prefrontal cortex (PFC) of the default-mode network (DMN) and the hippocampus in lean, overweight and obese participants. Group-averaged DMN of lean and overweight/obese participants under baseline condition (rsfMRI1) for the anterior medial PFC seed region is displayed in red (p < 0.05, FWE whole-brain corrected). Cyan-color coded region reveals voxels within the right hippocampus showing a significant change in functional connectivity within the DMN based on the anterior medial PFC seed region after intranasal insulin compared to placebo (pFWE < 0.05 small volume corrected). Bar plot on right shows the change in functional connectivity after intranasal insulin and placebo (rsfMRI2 minus rsfMRI1) between the anterior medial PFC and the hippocampus in lean, overweight and obese participants (i.e. the extracted differential correlation coefficients of the right hippocampus).
Figure 3.
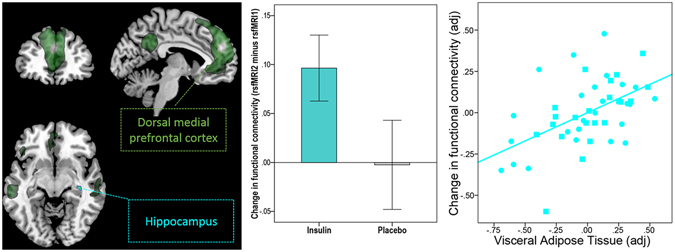
Intranasal insulin increases functional connectivity between the dorsal medial prefrontal cortex (PFC) of the default-mode network (DMN) and the hippocampus in lean, overweight and obese participants. Group-averaged DMN of lean and overweight/obese participants under baseline condition (rsfMRI1) for the dorsal medial PFC seed region is displayed in dark green (pFWE < 0.05, whole-brain corrected). Cyan-color coded region reveals voxels within the right hippocampus showing a significant change in functional connectivity within the DMN based on the dorsal medial PFC seed region after intranasal insulin compared to placebo (pFWE < 0.05 small volume corrected). Bar plot in the middle shows change in functional connectivity after intranasal insulin and placebo (rsfMRI2 minus rsfMRI1) between the dorsal medial PFC and the hippocampus in lean, overweight and obese participants (i.e. the extracted differential correlation coefficients of the right hippocampus). Partial correlation plot on the right shows significant correlation between visceral adipose tissue and the intranasal insulin induced change in functional connectivity between dorsal medial PFC and hippocampus adjusted for total intracranial volume, sex, age and BMI (p < 0.001, radj = 0.529). Circles represent lean participants and squares represent overweight and obese participants.
Mediation analyses was performed to test whether the increase in FC between the dorsal medial PFC and the hippocampus induced by intranasal insulin served as a mediator between abdominal fat (i.e. VAT) and hunger. This analysis revealed a significant negative indirect effect of VAT on hunger 120 min after intranasal insulin application via the dorsal medial PFC-hippocampus functional connectivity change (standardized indirect effect ab = −0.34, 95% Bootstrap CI −6.54 to −1.23; Fig. 4). In other words, the increase in functional connectivity induced by intranasal insulin suppressed the relationship between VAT and hunger. No such relationship was observed on the placebo day.
Figure 4.
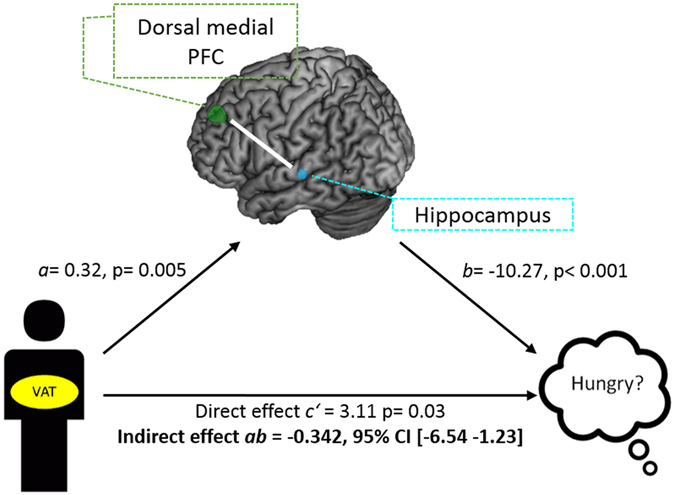
Model of visceral adipose tissue (VAT) as a predictor of subjective feeling of hunger mediated by functional connectivity change after insulin spray application. There is a significant indirect effect of VAT on the change of hunger via the change in functional connectivity between the dorsal medial prefrontal cortex and hippocampus 120 min after insulin. Path coefficients and corresponding p-values are shown next to arrows; path a indicates the relationship between VAT and insulin-induced hippocampus functional connectivity change, path b indicates the relationship between the insulin-induced hippocampus functional connectivity change and change in hunger; path ab indicates the indirect effect of VAT on hunger via the insulin-induced hippocampus functional connectivity change; path c’ indicate the direct effect of VAT on the change in hunger after insulin.
Insulin-induced changes in functional connectivity between the default-mode network and the hypothalamus
We observed a significant interaction between condition (insulin versus placebo) and peripheral insulin sensitivity in the hypothalamus (Fig. 5). Insulin increased functional connectivity after intranasal application compared to placebo between the anterior medial PFC and the hypothalamus (F = 10.84; pFWE < 0.05 small volume corrected; MNI coordinates x: −6 y: 0 z: −9) only in participants with high peripheral insulin sensitivity. The change in hypothalamic FC after insulin spray application significantly correlated positively with peripheral insulin sensitivity (T = 3.3, p = 0.002; r = 0.476; radj = 0.459, adjusted for VAT, age, sex, and TICV) (Fig. 5). No such relationship was observed on placebo day.
Figure 5.
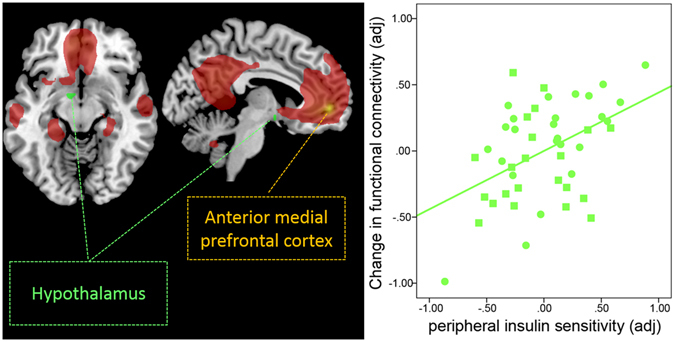
Intranasal insulin increases functional connectivity (FC) between the hypothalamus and the anterior medial prefrontal region of the default-mode network in peripherally insulin sensitive participants. Group-averaged DMN of lean and overweight/obese participants under baseline condition (rsfMRI1) for the anterior medial prefrontal cortex (PFC) seed region is displayed in red (pFWE < 0.05, whole-brain corrected). Bright green color-coded region reveals voxels within the hypothalamus showing a significant change in functional connectivity with the anterior medial PFC of the DMN, as identified by a significant interaction between condition (insulin versus placebo spray) and the peripheral insulin sensitivity index (pFWE < 0.05 small volume corrected). Partial correlation plot on the right shows a significant positive correlation between peripheral insulin sensitivity index and the change in functional connectivity between the anterior medial PFC and hypothalamus. With higher peripheral insulin sensitivity, we observed a stronger increase in functional connectivity adjusted for total intracranial volume, sex, age and visceral adipose tissue (radj = 0.459, p = 0.002). Circles represent lean participants and squares represent overweight and obese participants. No such relationship was observed after placebo administration.
Discussion
In healthy young lean, but also in overweight and obese participants, intranasal insulin acutely enhanced functional connectivity between the prefrontal regions of the DMN and the hippocampus. These regions are known to be crucial for higher cognitive processes. Interestingly, we found increased dorsal medial PFC-hippocampal functional connectivity to significantly modulate hunger. This insulin-induced increase acted as a mediator between individual’s visceral adipose tissue, a metabolic unfavorable abdominal fat depot, and subjective feeling of hunger. Participants with a stronger increase in functional connectivity felt less hungry 120 minutes after insulin administration. Furthermore, individuals with more visceral adipose tissue were hungrier. This relationship was suppressed by the increase in functional connectivity between the dorsal medial PFC and hippocampus. Moreover, the connection between metabolic and cognitive centers of the brain could be boosted by intranasal insulin, however only in participants with high peripheral insulin sensitivity. The higher the peripheral insulin sensitivity index, the stronger the increase in functional connectivity between the anterior medial prefrontal cortex of the DMN and the hypothalamus after insulin administration.
Neuroimaging studies investigating target brain regions of insulin action, using endogenous and exogenous stimulation of insulin, have identified the hypothalamus, striatal and frontal regions to be particularly insulin sensitive4, 7. Specifically, in response to glucose ingestion, individuals with a higher increase in endogenous insulin showed a more pronounced prefrontal cortex activity decrease to food cues37, 42, 43. Similarly, the PFC and hypothalamus neural activity attenuated in response to intranasal insulin11, 15, 39. Moreover, not just localized neural activation but also functional connectivity of the hypothalamus and PFC can be modulated by glucose43, 44 or by meal ingestion45–47. In the fasting compared to the fed state46 hypothalamic-PFC functional connectivity was enhanced, while the ingestion of a meal reduced functional connectivity to the medial and lateral PFC45, 47. Interestingly, other hormonal interventions with leptin48, 49 or intranasal oxytocin50–52 have likewise shown to alter PFC functional connectivity. Leptin replacement therapy in patients with lipodystrophy, for example, significantly increased hypothalamic-PFC functional connectivity accompanied by normalization of eating behavior49. Accordingly, in the current study we found the functional connection between the anterior medial PFC and the hypothalamus to increase in participants with favorable peripheral insulin sensitivity. Hence, evidence accumulates that brain-periphery interactions play an important role in the regulation of eating behavior and metabolism. With respect to insulin action, recent studies have shown that the prefrontal and hypothalamic response to insulin stimulation are significantly correlated with peripheral insulin sensitivity11, 15, 37, 39, 42. Moreover, intranasal insulin delivery to the brain improved peripheral insulin sensitivity in placebo-controlled hyperinsulinemic-euglycemic glucose clamps15, 53. This coincides with the current finding that central insulin administration can enhance the functional connectivity between cognitive and homeostatic brain centers in peripherally insulin sensitive individuals.
The insulin-induced heightened functional connectivity between the prefrontal regions of the DMN and the hippocampus was independent of peripheral IR. Lean, overweight and obese participants with poor and high peripheral insulin sensitivity showed an increase in functional connectivity after intranasal insulin administration. Consistent with this notion, Fadel and Reagan25 proposed that hippocampal IR may occur independent of peripheral IR. Rats with hippocampal-specific IR showed no changes in body weight and peripheral insulin sensitivity, however changes in neural plasticity and impaired spatial learning54. Interestingly, in the current study, we observed a link between central insulin action in the hippocampus and metabolism and hunger. The increased hippocampal functional connectivity acted as a mediator between perceived hunger and visceral adipose tissue. This is in line with animal and humans studies showing that the hippocampus processes visceral energy-status relevant information detecting interoceptive signals of hunger and satiety55, 56. Hippocampal neurons form memory of a meal and are involved in inhibitory effects of recent eating on subsequent food consumption56, 57. Concomitantly, patients with hippocampal lesions will rate their subjective state of hunger in the middle of the magnitude scale independent of when the last meal was consumed55, 58. Moreover, reduced sensitivity to internal signals is found in obesity59 and in individuals with high western diet consumption60. Specifically participants with self-reported high fat and high refined-sugar diet performed poorer on hippocampal sensitive memory tasks and were less accurate in recalling what they had previously eaten60. Free-fatty acids (FFAs), which can be mildly suppressed by intranasal insulin61, may mediate the relationship between visceral adipose tissue and brain insulin responsiveness. Specifically, elevated levels of saturated nonesterified fatty acids led to a diminished insulin reactivity in theta frequency activity generated in the hippocampus62. Hence, it is possible that circulating FFAs in individuals with high visceral adipose tissue interferes with the subjective feeling of hunger. Enhancing hippocampal functional connectivity by means of centrally acting insulin could potentially breach this viscous cycle improving internal awareness for hunger. Hence, we propose that the beneficial effects of boosting hippocampal functional connectivity with intranasal insulin go beyond improving cognition, as recently reported31. It can potentially improve metabolism by enhancing the sensitivity to internal signals, thereby reducing perceived hunger. Hence, intranasal insulin could be a potential therapeutic tool to improve memory formation for food and raise internal awareness for satiety and hunger signals.
While solid evidence exists that obesity-associated IR affects at least parts of the DMN4, the current study showed for the first time that DMN functional connectivity plays a pivotal role in central insulin action in cognitively healthy young adults. The prefrontal part of the DMN, in particular, may constitute a link between networks controlling insulin-mediated effects on metabolism and cognition. However, besides brain IR, peripheral IR seems to play an important role in DMN function. Even in cognitively intact prediabetes and T2D patients, the severity of peripheral IR is related to altered brain function in regions of the DMN showing reduced cerebral blood flow and disrupted functional connectivity63. Interestingly, treated T2D patients do not show reduced cerebral blood flow in the DMN compared to the insulin resistant controls64. Hence, it could be that altered brain functions in regions of the DMN is a consequence of peripheral IR rather than a cause of brain IR. Concurrently, we identified obesity-associated changes in functional connectivity in the posterior part of the DMN, which was not influenced by intranasal insulin. Hence, we propose the anterior part of the DMN to constitute an overlap between peripheral and central IR. However, further studies are necessary to investigate cause and consequences of central and peripheral IR.
A limitation of the study is the missing examinations on cognitive functions. All of our participants were students at the university and displayed no psychiatric or neurological illness. Furthermore, we used a thorough metabolic screening to exclude type 2 diabetes and other alterations associated with the metabolic syndrome. Nonetheless, to further link metabolic and cognitive endpoints of brain insulin action, further studies are necessary evaluating metabolism as well as cognition. Moreover, we cannot rule out a possible spillover of intranasal insulin into the peripheral blood15, 53, 65. More frequent blood sampling is needed to detect this phenomenon. We recently characterized this spillover at systemic elevated insulin levels. Even after mimicking the spillover effect during the placebo condition, intranasal insulin still significantly mediated whole-body metabolism53. However, no detailed kinetics have yet been reported at fasting insulin levels.
Taken together, we were able to show that acute administration of intranasal insulin administration can enhance DMN functional connectivity in healthy lean, overweight and obese adults. The insulin induced increase in dorsal medial PFC-hippocampal functional connectivity served as a mediator, suppressing the relationship between visceral adipose tissue and hunger. Furthermore, we observed a significant brain-periphery interaction of insulin action. Only individuals with an insulin-induced DMN-hypothalamic functional connectivity change revealed favorable peripheral insulin sensitivity. Therefore, enhancing brain functional connectivity using intranasal insulin has potential to boost cognition and metabolism. The relevance of our findings for the treatment of obesity and metabolic disease is currently however still speculative. Our results point to a novel mechanism of how brain insulin action facilitates weight loss by enhancing brain functional connectivity and reducing perceived hunger. Hence, intranasal insulin could be a potential therapeutic tool to improve internal awareness for satiety and hunger signals. Further intervention studies have to be conducted to demonstrate who will benefit from enhancing brain insulin action.
Methods
Participants
The study sample consisted of 25 healthy lean and 10 overweight and 12 obese adult participants (BMI range 19–40 kg/m2), who were also part of a recent study investigating brain insulin action using cerebral blood flow11. Overweight and obese participants were required to have a BMI greater than 25 kg/m². One obese subject could not be analyzed due to missing functional MRI data. The Ethics Committee of the Medical Faculty at the University of Tübingen approved the protocol and informed written consent was obtained from all participants. All participants were students at the University of Tübingen recruited using broadcast emails. The study was registered as clinical trial (NCT01797601; February 18th 2013). To assure that participants were healthy and did not suffer from psychiatric, neurological nor metabolic diseases, they underwent a thorough medical examination. To assess body fat distribution of the participants, whole-body MRI measurements were obtained at a 1.5-T whole body imager (Magnetom Sonata; Siemens Healthcare, Erlangen, Germany) (for further description please see Kullmann et al.11). To assess peripheral insulin sensitivity, all participants underwent a 75 g oral glucose tolerance test with blood drawing at five time points after an overnight fast prior to the intranasal experiment. Insulin sensitivity was estimated according to Matsuda and DeFronzo66. The study was performed in accordance with the relevant guidelines and regulations. Participants characteristics are summarized in Table 1.
Table 1.
Participants’ characteristics.
| Lean group | Overweight/Obese group | p | |
|---|---|---|---|
| Gender (female/male) | 10/15 | 11/11 | — |
| Age (y) | 25.88 ± 3.30 | 26.81 ± 3.62 | 0.360 |
| Body mass index (kg/m²) | 22.59 ± 1.99 | 30.57 ± 3.51 | <0.001 |
| oGTT-derived insulin sensitivity index (AU) | 16.0 ± 7.6 | 10.66 ± 6.56 | 0.005 |
| HbA1c (% and mmol/mol) | 5.2 ± 0.3/33.15 ± 3.1 | 5.3 ± 0.3/33.9 ± 2.7 | 0.380 |
| Whole-body MRI (in liter) | |||
| Total adipose tissue | 17.82 ± 4.41 | 40.5 ± 10.7 | <0.001 |
| Visceral adipose tissue | 1.55 ± 0.86 | 3.18 ± 1.48 | <0.001 |
| Subcutaneous adipose tissue | 4.87 ± 1.69 | 14.55 ± 4.6 | <0.001 |
Data are presented as mean ± SD. P = P-values for comparison of unadjusted loge-transformed data by ANOVA.
Study design
Intranasal insulin and placebo was administered on two separate study days (time-lag of 7–14 days) and fMRI was recorded. Studies were conducted after an overnight fast of at least 10 hours and started at 7.00 a.m. with a resting-state fMRI measurement under basal conditions (rsfMRI 1). After the basal measurement, an insulin/placebo spray was administered intranasally as described below. After 30 minutes, a second resting-state fMRI measurement was performed (rsfMRI 2).
Subjective feeling of hunger was rated at three time points (before spray application, 60 and 120 min after intranasal spray) on a visual analogue scale from 0 to 10 (0: not hungry at all; 10: very hungry) (Table 1). Venous blood samples were obtained at different time point (for details see Kullmann et al.11).
Application intranasal insulin/placebo
The insulin and placebo spray were prepared in nasal sprays. In a randomized fashion, participants received on one day 160 U of insulin (Insulin Actrapid; Novo Nordisk, Bagsvaerd, Denmark) and on the other measurement day vehicle as placebo. Participants were single-blinded to the order of the conditions.
Whole-brain fMRI Measurement
Data acquisition
Whole-brain fMRI data was obtained by using a 3.0 T scanner using a 12-channel head coil (Siemens Tim Trio, Erlangen, Germany). Functional data were collected by using gradient echo echo-planar imaging (GE-EPI) sequences. All participants were instructed not to focus their thoughts on anything in particular and to keep their eyes closed during the resting state fMRI acquisition. The following sequence was used: TR = 2 s, TE = 30 ms, FOV = 210 mm²,matrix 64 × 64, flip angle 90°, voxel size 3 × 3 × 3.6 mm3, slice thickness 3.6 mm, images were acquired in ascending order. Each brain volume comprised 26 axial slices and each functional run contained 176 image volumes, resulting in a total scan time of 6:04 minutes. In addition, high-resolution T1 weighted anatomical images (MPRage: 192 slices, matrix: 256 × 240, 1 × 1 × 1 mm3) of the brain were obtained.
Resting-state fMRI Data processing
We used the Data Processing Assistant for Resting-State fMRI (DPARSF)67 (http://www.restfmri.net) to analyze the resting state fMRI data. DPRSF is based on Statistical Parametric Mapping (SPM8) (http://www.fil.ion.ucl.ac.uk/spm) and Resting-State fMRI Data Analysis Toolkit68 (REST, http://www.restfmri.net). The functional images were realigned and co-registered to the T1 structural image. The anatomical image was normalized to the Montreal Neurological Institute (MNI) template using DARTEL, and the resulting parameter file was used to normalize the functional images (voxel size: 3 × 3 × 3 mm). Finally, the normalized images were smoothed with a three-dimensional isotropic Gaussian kernel (FWHM: 6 mm). A temporal filter (0.01~0.08 Hz) was applied to reduce low frequency drifts and high frequency physiological noise. Nuisance regression was performed using white matter, CSF, and the six head motion parameters as covariates. No participant had head motion with more than 2.0 mm maximum displacement or 2.0° of any angular motion.
Resting-state functional connectivity analyses
Functional connectivity (FC) maps were obtained using a seed-based voxel wise correlation approach by computing FC between a seed region and each voxel within the brain. We defined four seed regions according to Andrews-Hanna et al.69: the core region of the DMN and three prefrontal regions of DMN (seed 1: posterior cingulate/precuneus x: −8 y: −56 z: 26; seed 2: anterior medial prefrontal cortex x:−6 y: 52 z: −2; seed 3: dorsal medial prefrontal cortex x: 0 y: 52 z: 26 and seed 4: ventromedial prefrontal cortex x: 0 y: 26 z: −18 (Supplementary Figure 1). All seed regions included a 5 mm sphere. The FC maps were transferred to z values using Fisher’s transformation68. For further statistical analysis, FC maps of rsfMRI2 were subtracted from rsfMRI1 for both placebo and insulin day. Changes in FC 30 min after insulin versus placebo administration were analyzed in SPM8 using a full-factorial model (between group factor: lean and obese; within-group factor: insulin and placebo, covariate: oGTT-derived peripheral insulin sensitivity index). A statistical threshold of pFWE < 0.05 voxel-level whole-brain corrected was applied. Additionally, small volume correction was performed for the hypothalamus and the hippocampus, as they are a priori regions of interest. The hypothalamus and hippocampus masks were based on the wfu pick atlas (http://fmri.wfubmc.edu/software/PickAtlas).
Functional connectivity values (z-transformed correlation coefficients) of regions showing significant change in FC after insulin administration were extracted for further statistical analyses in SPSS (version 20, IBM, Armonk, USA). We evaluated whether changes in FC show a significant relationship with the subjective feeling of hunger after insulin spray application, with peripheral insulin sensitivity, BMI and with different fat compartments as evaluated with T1-weighted whole-body MRI data (visceral adipose tissue (VAT), subcutaneous adipose tissue (SCAT) and total adipose tissue (TAT))70 using a multiple regression analyses. All regressions included age, total intracranial volume (TICV) and sex as confounding regressors. An adjusted statistical threshold of p ≤ 0.002 correcting for number of tests (n = 25) was used.
Mediation analyses of the relationship between VAT, hunger and extracted FC change between dorsal medial PFC and hippocampus was performed using PROCESS version 2.15 procedure in SPSS (www.afhayes.com). The concept of a mediation analysis works as follows. The relationship between a predictor (x) and an outcome variable (y) can be explained by their relationship to a third variable (the mediator (m)). The predictor (x) predicts the mediator (m) through the path denoted by path a. The mediator (m) predicts the outcome (y) through the outcome denoted by path b. The relationship between predictor and outcome controlling for the mediator in the model is denoted as direct effect i.e. path c’. The total effect is the effect of the predictor on the outcome when the mediator is not present in the model (i.e. path c). The effect of mediation is investigated through the indirect effect, which is a cross product of a and b 71. The mediation model included VAT as the predictor (x), change in hunger rating as the outcome variable (y) and change in FC between dorsal medial PFC and hippocampus as the mediator (m). Additional covariates were added to the model for adjustments (covariates: BMI, age, sex and TICV). The significance of the mediation analysis (i.e. indirect effect ab) was estimated based on a bias-corrected bootstrap confidence interval (CI 95%, 10 000 bootstrap samples). If the confidence interval does not contain zero then the ‘true effect’ size is different from ‘no effect’. This means there is a significant mediation. Furthermore, we report a standardized indirect effect measure to ensure comparability with other studies71.
Electronic supplementary material
Acknowledgements
The study was supported in part by a grant (01GI0925) from the German Federal Ministry of Education and Research (BMBF) to the German Center for Diabetes Research (DZD e.V.), by the Helmholtz Alliance ICEMED - Imaging and Curing Environmental Metabolic Diseases, through the Initiative and Network Fund of the Helmholtz Association, by grants from the German Diabetes Foundation (DDG) to M.H. and S.K (DDG and DDS 309/01/12), and by the European Union Seventh Framework Programme (FP7/2007–2013) under Grant Agreement 607310 (Nudge-it). The funding sources were not involved in the study design, data collection analysis and interpretation of the data.
Author Contributions
S.K. designed study, ran experiment, analyzed and interpreted the data and wrote manuscript. M.H. designed study; interpreted data gave input for writing manuscript. R.V. assisted S.K. in fMRI data analysis. K.S. designed study and gave input for writing manuscript. J.M. responsible for whole-body MRI data collection and data entry. A.F., H.H. and H.P. designed study interpreted data gave input for writing manuscript. All authors declare no conflict of interest.
Competing Interests
The authors declare that they have no competing interests.
Footnotes
Electronic supplementary material
Supplementary information accompanies this paper at doi:10.1038/s41598-017-01907-w
Publisher's note: Springer Nature remains neutral with regard to jurisdictional claims in published maps and institutional affiliations.
References
- 1.Dickson, S. L. & Mercer, J. G. Neuroendocrinology of Appetite. First edn, 296 (John Wiley & Sons, 2016).
- 2.Williams KW, Elmquist JK. From neuroanatomy to behavior: central integration of peripheral signals regulating feeding behavior. Nat Neurosci. 2012;15:1350–1355. doi: 10.1038/nn.3217. [DOI] [PMC free article] [PubMed] [Google Scholar]
- 3.Stoeckel LE, et al. Complex mechanisms linking neurocognitive dysfunction to insulin resistance and other metabolic dysfunction. F1000Research. 2016;5:353. doi: 10.12688/f1000research.8300.1. [DOI] [PMC free article] [PubMed] [Google Scholar]
- 4.Kullmann S, et al. Brain Insulin Resistance at the Crossroads of Metabolic and Cognitive Disorders in Humans. Physiol Rev. 2016;96:1169–1209. doi: 10.1152/physrev.00032.2015. [DOI] [PubMed] [Google Scholar]
- 5.Kleinridders A, Ferris HA, Cai W, Kahn CR. Insulin action in brain regulates systemic metabolism and brain function. Diabetes. 2014;63:2232–2243. doi: 10.2337/db14-0568. [DOI] [PMC free article] [PubMed] [Google Scholar]
- 6.Lochhead JJ, Thorne RG. Intranasal delivery of biologics to the central nervous system. Advanced drug delivery reviews. 2012;64:614–628. doi: 10.1016/j.addr.2011.11.002. [DOI] [PubMed] [Google Scholar]
- 7.Kullmann, S., Heni, M., Fritsche, A. & Preissl, H. Insulin action in the human brain: evidence from neuroimaging studies. J Neuroendocrinol (2015). [DOI] [PubMed]
- 8.Heni, M., Kullmann, S., Preissl, H., Fritsche, A. & Haring, H. U. Impaired insulin action in the human brain: causes and metabolic consequences. Nat Rev Endocrinol (2015). [DOI] [PubMed]
- 9.Ott V, Benedict C, Schultes B, Born J, Hallschmid M. Intranasal administration of insulin to the brain impacts cognitive function and peripheral metabolism. Diabetes Obes Metab. 2012;14:214–221. doi: 10.1111/j.1463-1326.2011.01490.x. [DOI] [PubMed] [Google Scholar]
- 10.Benedict C, Kern W, Schultes B, Born J, Hallschmid M. Differential sensitivity of men and women to anorexigenic and memory-improving effects of intranasal insulin. J Clin Endocrinol Metab. 2008;93:1339–1344. doi: 10.1210/jc.2007-2606. [DOI] [PubMed] [Google Scholar]
- 11.Kullmann, S. et al. Selective Insulin Resistance in Homeostatic and Cognitive Control Brain Areas in Overweight and Obese Adults. Diabetes Care (2015). [DOI] [PubMed]
- 12.Hallschmid, M., Higgs, S., Thienel, M., Ott, V. & Lehnert, H. Postprandial Administration of Intranasal Insulin Intensifies Satiety and Reduces Intake of Palatable Snacks in Women. Diabetes (2012). [DOI] [PMC free article] [PubMed]
- 13.Rodriguez-Raecke, R., Yang, H., Brunner, Y. F. & Freiherr, J. Intranasal insulin boosts gustatory sensitivity. J Neuroendocrinol (2016). [DOI] [PubMed]
- 14.Brunner YF, Benedict C, Freiherr J. Intranasal insulin reduces olfactory sensitivity in normosmic humans. J Clin Endocrinol Metab. 2013;98:E1626–1630. doi: 10.1210/jc.2013-2061. [DOI] [PubMed] [Google Scholar]
- 15.Heni M, et al. Central insulin administration improves whole-body insulin sensitivity via hypothalamus and parasympathetic outputs in men. Diabetes. 2014;63:4083–4088. doi: 10.2337/db14-0477. [DOI] [PubMed] [Google Scholar]
- 16.Air EL, Benoit SC, Blake Smith KA, Clegg DJ, Woods SC. Acute third ventricular administration of insulin decreases food intake in two paradigms. Pharmacol Biochem Behav. 2002;72:423–429. doi: 10.1016/S0091-3057(01)00780-8. [DOI] [PubMed] [Google Scholar]
- 17.Ikeda H, et al. Intraventricular insulin reduces food intake and body weight of lean but not obese Zucker rats. Appetite. 1986;7:381–386. doi: 10.1016/S0195-6663(86)80006-X. [DOI] [PubMed] [Google Scholar]
- 18.Brown LM, Clegg DJ, Benoit SC, Woods SC. Intraventricular insulin and leptin reduce food intake and body weight in C57BL/6 J mice. Physiol Behav. 2006;89:687–691. doi: 10.1016/j.physbeh.2006.08.008. [DOI] [PubMed] [Google Scholar]
- 19.Benedict C, et al. Intranasal insulin improves memory in humans. Psychoneuroendocrinology. 2004;29:1326–1334. doi: 10.1016/j.psyneuen.2004.04.003. [DOI] [PubMed] [Google Scholar]
- 20.Claxton A, et al. Long Acting Intranasal Insulin Detemir Improves Cognition for Adults with Mild Cognitive Impairment or Early-Stage Alzheimer’s Disease Dementia. J Alzheimers Dis. 2015;45:1269–1270. doi: 10.3233/JAD-159002. [DOI] [PubMed] [Google Scholar]
- 21.Claxton A, et al. Sex and ApoE genotype differences in treatment response to two doses of intranasal insulin in adults with mild cognitive impairment or Alzheimer’s disease. J Alzheimers Dis. 2013;35:789–797. doi: 10.3233/JAD-122308. [DOI] [PMC free article] [PubMed] [Google Scholar]
- 22.Craft S, et al. Intranasal insulin therapy for Alzheimer disease and amnestic mild cognitive impairment: a pilot clinical trial. Arch Neurol. 2012;69:29–38. doi: 10.1001/archneurol.2011.233. [DOI] [PMC free article] [PubMed] [Google Scholar]
- 23.Novak V, et al. Enhancement of vasoreactivity and cognition by intranasal insulin in type 2 diabetes. Diabetes Care. 2014;37:751–759. doi: 10.2337/dc13-1672. [DOI] [PMC free article] [PubMed] [Google Scholar]
- 24.Brunner YF, Kofoet A, Benedict C, Freiherr J. Central insulin administration improves odor-cued reactivation of spatial memory in young men. J Clin Endocrinol Metab. 2015;100:212–219. doi: 10.1210/jc.2014-3018. [DOI] [PubMed] [Google Scholar]
- 25.Fadel JR, Reagan LP. Stop signs in hippocampal insulin signaling: the role of insulin resistance in structural, functional and behavioral deficits. Current opinion in behavioral sciences. 2016;9:47–54. doi: 10.1016/j.cobeha.2015.12.004. [DOI] [PMC free article] [PubMed] [Google Scholar]
- 26.Biessels GJ, Reagan LP. Hippocampal insulin resistance and cognitive dysfunction. Nat Rev Neurosci. 2015;16:660–671. doi: 10.1038/nrn4019. [DOI] [PubMed] [Google Scholar]
- 27.Dhamoon, M. S., Noble, J. M. & Craft, S. Intranasal insulin improves cognition and modulates beta-amyloid in early AD. Neurology72, 292-293; author reply 293-294 (2009). [DOI] [PubMed]
- 28.Reger MA, et al. Effects of intranasal insulin on cognition in memory-impaired older adults: modulation by APOE genotype. Neurobiol Aging. 2006;27:451–458. doi: 10.1016/j.neurobiolaging.2005.03.016. [DOI] [PubMed] [Google Scholar]
- 29.Reger MA, et al. Intranasal insulin administration dose-dependently modulates verbal memory and plasma amyloid-beta in memory-impaired older adults. J Alzheimers Dis. 2008;13:323–331. doi: 10.3233/JAD-2008-13309. [DOI] [PMC free article] [PubMed] [Google Scholar]
- 30.Reger MA, et al. Intranasal insulin improves cognition and modulates beta-amyloid in early AD. Neurology. 2008;70:440–448. doi: 10.1212/01.WNL.0000265401.62434.36. [DOI] [PubMed] [Google Scholar]
- 31.Zhang H, et al. Intranasal insulin enhanced resting-state functional connectivity of hippocampal regions in type 2 diabetes. Diabetes. 2015;64:1025–1034. doi: 10.2337/db14-1000. [DOI] [PMC free article] [PubMed] [Google Scholar]
- 32.Mohan A, et al. The Significance of the Default Mode Network (DMN) in Neurological and Neuropsychiatric Disorders: A Review. Yale J Biol Med. 2016;89:49–57. [PMC free article] [PubMed] [Google Scholar]
- 33.Musen G, et al. Resting-state brain functional connectivity is altered in type 2 diabetes. Diabetes. 2012;61:2375–2379. doi: 10.2337/db11-1669. [DOI] [PMC free article] [PubMed] [Google Scholar]
- 34.Xia W, et al. Insulin Resistance-Associated Interhemispheric Functional Connectivity Alterations in T2DM: A Resting-State fMRI Study. BioMed research international. 2015;2015:719076. doi: 10.1155/2015/719076. [DOI] [PMC free article] [PubMed] [Google Scholar]
- 35.Kullmann S, et al. Specific white matter tissue microstructure changes associated with obesity. Neuroimage. 2016;125:36–44. doi: 10.1016/j.neuroimage.2015.10.006. [DOI] [PMC free article] [PubMed] [Google Scholar]
- 36.Kullmann S, et al. The obese brain: Association of body mass index and insulin sensitivity with resting state network functional connectivity. Hum Brain Mapp. 2012;33:1052–1061. doi: 10.1002/hbm.21268. [DOI] [PMC free article] [PubMed] [Google Scholar]
- 37.Heni M, et al. Differential effect of glucose ingestion on the neural processing of food stimuli in lean and overweight adults. Hum Brain Mapp. 2013;35:918–928. doi: 10.1002/hbm.22223. [DOI] [PMC free article] [PubMed] [Google Scholar]
- 38.Kullmann S, et al. Intranasal insulin modulates intrinsic reward and prefrontal circuitry of the human brain in lean women. Neuroendocrinology. 2013;97:176–182. doi: 10.1159/000341406. [DOI] [PubMed] [Google Scholar]
- 39.Heni M, et al. Nasal insulin changes peripheral insulin sensitivity simultaneously with altered activity in homeostatic and reward-related human brain regions. Diabetologia. 2012;55:1773–1782. doi: 10.1007/s00125-012-2528-y. [DOI] [PubMed] [Google Scholar]
- 40.Kullmann S, et al. Resting-state functional connectivity of the human hypothalamus. Hum Brain Mapp. 2014;35:6088–6096. doi: 10.1002/hbm.22607. [DOI] [PMC free article] [PubMed] [Google Scholar]
- 41.Tschritter O, et al. The cerebrocortical response to hyperinsulinemia is reduced in overweight humans: a magnetoencephalographic study. Proc Natl Acad Sci USA. 2006;103:12103–12108. doi: 10.1073/pnas.0604404103. [DOI] [PMC free article] [PubMed] [Google Scholar]
- 42.Kroemer, N. B. et al. (Still) longing for food: Insulin reactivity modulates response to food pictures. Hum Brain Mapp (2012). [DOI] [PMC free article] [PubMed]
- 43.Page KA, et al. Effects of fructose vs glucose on regional cerebral blood flow in brain regions involved with appetite and reward pathways. JAMA. 2013;309:63–70. doi: 10.1001/jama.2012.116975. [DOI] [PMC free article] [PubMed] [Google Scholar]
- 44.Jastreboff AM, et al. Altered Brain Response to Drinking Glucose and Fructose in Obese Adolescents. Diabetes. 2016;65:1929–1939. doi: 10.2337/db15-1216. [DOI] [PMC free article] [PubMed] [Google Scholar]
- 45.Pribic, T. et al. Brain networks associated with cognitive and hedonic responses to a meal. Neurogastroenterol Motil (2017). [DOI] [PMC free article] [PubMed]
- 46.Wright H, et al. Differential effects of hunger and satiety on insular cortex and hypothalamic functional connectivity. Eur J Neurosci. 2016;43:1181–1189. doi: 10.1111/ejn.13182. [DOI] [PMC free article] [PubMed] [Google Scholar]
- 47.Lips MA, et al. Resting-state functional connectivity of brain regions involved in cognitive control, motivation, and reward is enhanced in obese females. Am J Clin Nutr. 2014;100:524–531. doi: 10.3945/ajcn.113.080671. [DOI] [PubMed] [Google Scholar]
- 48.Farr OM, et al. Leptin therapy alters appetite and neural responses to food stimuli in brain areas of leptin-sensitive subjects without altering brain structure. J Clin Endocrinol Metab. 2014;99:E2529–2538. doi: 10.1210/jc.2014-2774. [DOI] [PMC free article] [PubMed] [Google Scholar]
- 49.Schlogl H, et al. Leptin Substitution in Patients With Lipodystrophy: Neural Correlates for Long-term Success in the Normalization of Eating Behavior. Diabetes. 2016;65:2179–2186. doi: 10.2337/db15-1550. [DOI] [PubMed] [Google Scholar]
- 50.Eckstein, M. et al. Oxytocin differentially alters resting state functional connectivity between amygdala subregions and emotional control networks: inverse correlation with depressive traits. Neuroimage (2017). [DOI] [PubMed]
- 51.Ebner NC, et al. Oxytocin’s effect on resting-state functional connectivity varies by age and sex. Psychoneuroendocrinology. 2016;69:50–59. doi: 10.1016/j.psyneuen.2016.03.013. [DOI] [PMC free article] [PubMed] [Google Scholar]
- 52.Bethlehem RA, van Honk J, Auyeung B, Baron-Cohen S. Oxytocin, brain physiology, and functional connectivity: a review of intranasal oxytocin fMRI studies. Psychoneuroendocrinology. 2013;38:962–974. doi: 10.1016/j.psyneuen.2012.10.011. [DOI] [PubMed] [Google Scholar]
- 53.Heni, M. et al. Hypothalamic and Striatal Insulin Action Suppresses Endogenous Glucose Production and May Stimulate Glucose Uptake During Hyperinsulinemia in Lean but not in Overweight Men. Diabetes (2017). [DOI] [PubMed]
- 54.Grillo CA, et al. Hippocampal Insulin Resistance Impairs Spatial Learning and Synaptic Plasticity. Diabetes. 2015;64:3927–3936. doi: 10.2337/db15-0596. [DOI] [PMC free article] [PubMed] [Google Scholar]
- 55.Kanoski, S. E. & Grill, H. J. Hippocampus Contributions to Food Intake Control: Mnemonic, Neuroanatomical, and Endocrine Mechanisms. Biol Psychiatry (2015). [DOI] [PMC free article] [PubMed]
- 56.Coppin, G. The anterior medial temporal lobes: Their role in food intake and body weight regulation. Physiol Behav (2016). [DOI] [PubMed]
- 57.Higgs S. Cognitive processing of food rewards. Appetite. 2016;104:10–17. doi: 10.1016/j.appet.2015.10.003. [DOI] [PubMed] [Google Scholar]
- 58.Higgs S, Williamson AC, Rotshtein P, Humphreys GW. Sensory-specific satiety is intact in amnesics who eat multiple meals. Psychol Sci. 2008;19:623–628. doi: 10.1111/j.1467-9280.2008.02132.x. [DOI] [PubMed] [Google Scholar]
- 59.Herbert BM, Pollatos O. Attenuated interoceptive sensitivity in overweight and obese individuals. Eat Behav. 2014;15:445–448. doi: 10.1016/j.eatbeh.2014.06.002. [DOI] [PubMed] [Google Scholar]
- 60.Francis HM, Stevenson RJ. Higher reported saturated fat and refined sugar intake is associated with reduced hippocampal-dependent memory and sensitivity to interoceptive signals. Behav Neurosci. 2011;125:943–955. doi: 10.1037/a0025998. [DOI] [PubMed] [Google Scholar]
- 61.Iwen KA, et al. Intranasal insulin suppresses systemic but not subcutaneous lipolysis in healthy humans. J Clin Endocrinol Metab. 2014;99:E246–251. doi: 10.1210/jc.2013-3169. [DOI] [PMC free article] [PubMed] [Google Scholar]
- 62.Tschritter O, et al. The insulin effect on cerebrocortical theta activity is associated with serum concentrations of saturated nonesterified Fatty acids. J Clin Endocrinol Metab. 2009;94:4600–4607. doi: 10.1210/jc.2009-0469. [DOI] [PubMed] [Google Scholar]
- 63.Baker LD, et al. Insulin resistance and Alzheimer-like reductions in regional cerebral glucose metabolism for cognitively normal adults with prediabetes or early type 2 diabetes. Arch Neurol. 2011;68:51–57. doi: 10.1001/archneurol.2010.225. [DOI] [PMC free article] [PubMed] [Google Scholar]
- 64.Rusinek H, et al. Cerebral perfusion in insulin resistance and type 2 diabetes. J Cereb Blood Flow Metab. 2015;35:95–102. doi: 10.1038/jcbfm.2014.173. [DOI] [PMC free article] [PubMed] [Google Scholar]
- 65.Dash S, Xiao C, Morgantini C, Koulajian K, Lewis GF. Intranasal insulin suppresses endogenous glucose production in humans compared with placebo in the presence of similar venous insulin concentrations. Diabetes. 2015;64:766–774. doi: 10.2337/db14-0685. [DOI] [PubMed] [Google Scholar]
- 66.Matsuda M, DeFronzo RA. Insulin sensitivity indices obtained from oral glucose tolerance testing: comparison with the euglycemic insulin clamp. Diabetes Care. 1999;22:1462–1470. doi: 10.2337/diacare.22.9.1462. [DOI] [PubMed] [Google Scholar]
- 67.Chao-Gan Y, Yu-Feng Z. DPARSF: A MATLAB Toolbox for “Pipeline” Data Analysis of Resting-State fMRI. Front Syst Neurosci. 2010;4:13. doi: 10.3389/fnsys.2010.00013. [DOI] [PMC free article] [PubMed] [Google Scholar]
- 68.Song XW, et al. REST: a toolkit for resting-state functional magnetic resonance imaging data processing. PLoS One. 2011;6:e25031. doi: 10.1371/journal.pone.0025031. [DOI] [PMC free article] [PubMed] [Google Scholar]
- 69.Andrews-Hanna JR, Reidler JS, Sepulcre J, Poulin R, Buckner RL. Functional-anatomic fractionation of the brain’s default network. Neuron. 2010;65:550–562. doi: 10.1016/j.neuron.2010.02.005. [DOI] [PMC free article] [PubMed] [Google Scholar]
- 70.Machann J, et al. Follow-up whole-body assessment of adipose tissue compartments during a lifestyle intervention in a large cohort at increased risk for type 2 diabetes. Radiology. 2010;257:353–363. doi: 10.1148/radiol.10092284. [DOI] [PubMed] [Google Scholar]
- 71.Field, A. Discovering Statistics Using IBM SPSS Statistics. 4 edn. (SAGE Publications Ltd, 2013).
Associated Data
This section collects any data citations, data availability statements, or supplementary materials included in this article.