

Abstract
Selection breeding has played a key role in the improvement of seed yield and quality in oilseed rape (Brassica napus L.). We genotyped Tapidor (European), Ningyou7 (Chinese) and their progenitors with the Brassica 60 K Illumina Infinium SNP array and mapped a total of 29,347 SNP markers onto the reference genome of Darmor-bzh. Identity by descent (IBD) refers to a haplotype segment of a chromosome inherited from a shared common ancestor. IBDs identified on the C subgenome were larger than those on the A subgenome within both the Tapidor and Ningyou7 pedigrees. IBD number and length were greater in the Ningyou7 pedigree than in the Tapidor pedigree. Seventy nine QTLs for flowering time, seed quality and root morphology traits were identified in the IBDs of Tapidor and Ningyou7. Many more candidate genes had been selected within the Ningyou7 pedigree than within the Tapidor pedigree. These results highlight differences in the transfer of favorable gene clusters controlling key traits during selection breeding in Europe and China.
Introduction
Oilseed rape (OSR, canola, Brassica napus L.) is the third largest source of vegetable oil in the world1, providing food, feed and fuel. In recent years, the demand for OSR has increased due to the rising demand for biofuels2. Over 70 million tonnes of rapeseed are produced annually across the world (FAOSTAT)3.
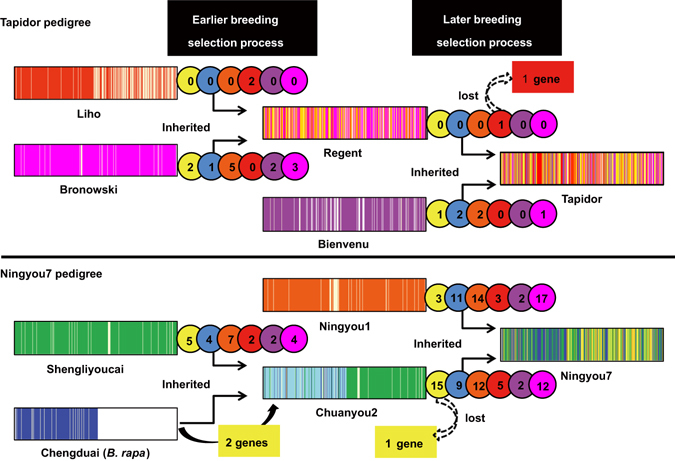
Brassica napus (AC genome) is a domesticated allotetraploid, arising from natural hybridization of the diploid species B. rapa (A) and B. oleracea (C) over 7500 years ago4. Modern canola-type OSR arose from the selection of improved seed composition attributes following introduction of beneficial alleles from exotic germplasm. The pedigrees of the cultivars Tapidor and Ningyou7 are well-documented5–10. Tapidor was derived from a cross between Regent and Bienvenu5. It has a high yield and oil content, low erucic acid and glucosinolate content in the seed, and was one of the most popular modern cultivars in the 1990s in northern Europe5, 6 (Fig. 1). Regent was selected from the offspring of a cross between Liho and Bronowski. Liho is a silage B. napus cultivar with low seed erucic acid content6, 7. Bronowski is a cultivar with low seed glucosinolate content6.
Figure 1.
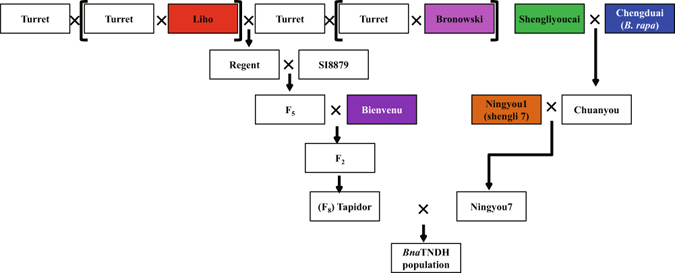
Schematic of genetic transfer in the pedigrees of cultivars Tapidor and Ningyou7. Cultivars Regent, Bienvenu, Liho and Bronowski are ancestors of cultivar Tapidor, with all cultivars developed in European countries or Canada. Cultivars Ningyou1, Chuanyou2, Shengliyoucai and Chengduai are ancestors of cultivar Ningyou7, which were all bred in Asian countries and most in China. Of these, cultivar Chengduai is Brassica rapa (A genome), and the remainder are Brassica napus (AC genome). The BnaTNDH population is derived from a cross between homozygous lines derived from cultivars Tapidor and Ningyou7.
The first popular B. napus variety in China was introduced from Japan in the 1930s and renamed as Shengliyoucai (Victory OSR) in the 1950s. Shengliyoucai was crossed with Chengduai, an early flowering B. rapa variety widely planted in the Sichuan province of China, and Chuanyou2 selected from the resulting progeny8, 9. Ningyou1, a semi-winter cultivar with early flowering time and good yield was crossed with Chuanyou2, and Ningyou7 resulted from their offspring10. Ningyou7 had high seed oil content, earlier flowering time and greater seed yield than its ancestors6.
In B. napus most traits affecting yield and quality have a complex polygenic basis11–14. Mapping of quantitative trait loci (QTL), which is used to identify genomic regions that are responsible for trait variation, is based on associations between polymorphic markers and phenotypic values13, 14 in unselected biparental segregating populations. This method can reveal the genetic basis of complex traits for which prior knowledge may be limited and the lack of which would otherwise present a major constraint to crop breeding15. The BnaTNDH mapping population was generated through anther culture of the F1 generation of a cross between Tapidor and Ningyou716. Within this population, five to 18 QTLs for flowering time have been detected in 12 winter microenvironments and three spring microenvironments, with about 60% of the phenotypic variation for flowering time attributed to genetic effects17. A QTL on linkage group A10, qFT10-4, was detected in a spring-cropped environment. BnaA.FLC.10 has been identified as a candidate gene that has been shown to be an important determinant of winter versus spring type OSR17. In another study with the same population grown in ten environments across three geographic regions18, 437 SNPs associated with flowering time were detected, some of which were associated with known genes such as orthologs of APETALA1 in A. thaliana. Genetic loci contributing to seed erucic acid content11–14, 16, 19, seed and leaf glucosinolate content14, 20, 21, and root traits affecting phosphorus (Pi) acquisition22, 23 have also been identified in B. napus by QTL mapping or through genome wide associated studies (GWAS).
Identity by descent (IBD) refers to a haplotype segment of a chromosome inherited from a shared common ancestor24. IBD segments have been employed to determine the origin of low diversity regions in humans to detect rare alleles related to diastolic blood pressure25. Selection tends to increase the number of IBD segments among individuals in a population. Strong and very recent selection in the human genome has been identified by scanning regions with excess IBD sharing26, 27.
Based on the differences between the number of segregating sites and the average number of nucleotide differences, Tajima’s D test can be used to distinguish a DNA sequence diverging randomly from another that is diverging due to a non-random process, including directional selection or balancing selection, demographic expansion or contraction, genetic hitchhiking or introgression28. In maize, Tajima’s D test has been used to establish the genome location(s) where selection has occurred29. When compared with long term selection in natural environments, domestication promotes rapid phenotypic evolution through artificial selection30. Random genetic drift is a powerful mechanism that enables populations of finite size to acquire genetic structure31. This can be seen in the domestication bottleneck and associated reduction in genetic diversity for specific target genes subject to artificial selection, with the magnitude and variance of this reduction across loci providing insights into the demographic history of domestication32.
In this study, homozygous lines derived from Tapidor, Ningyou7 and their ancestors were screened using the genome-anchored Brassica 60 K Illumina Infinium SNP array. The objectives were (1) to survey IBD regions in the pedigree of these cultivars to identify differences in the extent of IBD transfer from their ancestors to offspring; (2) to identify candidate genes underlying QTL within IBD regions for flowering time, seed quality and root morphology traits and uncover any gene clusters transferred from the progenitors to Tapidor and Ningyou7, (3) to identify the genome regions where breeding selection has occurred using Tajima’s D and gene diversity tests.
Results
SNP distribution in the Tapidor and Ningyou7 pedigrees and alignment to the B. napus reference genome
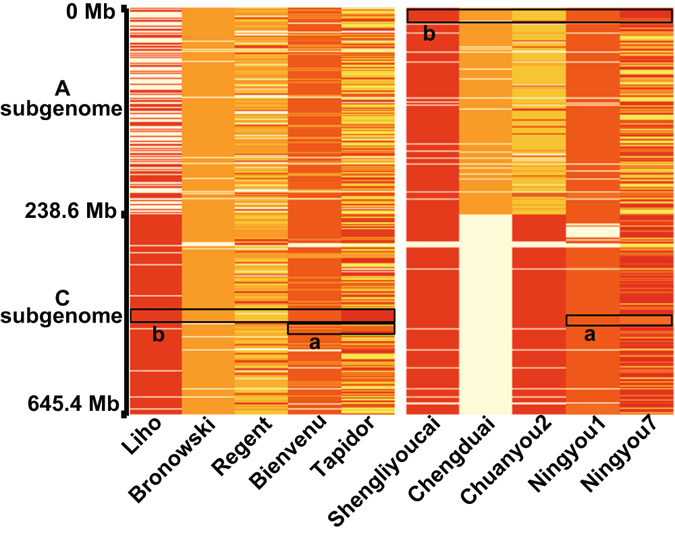
Tapidor, Ningyou7 and their eight ancestors (inbred selections) were screened using the 60 K Brassica Infinium SNP array, and a total of 29,347 high–quality SNP markers were mapped to 643.7 Mb across the 19 chromosomes of the 849.7 Mb reference genome of B. napus cultivar Darmor-bzh (Supplementary Table S1). C03 was the longest chromosome, represented by ~60.5 Mb in the Tapidor and Ningyou7 pedigrees and ~60.6 Mb in cultivar Darmor-bzh, while A10 was the shortest chromosome, with ~17.4 Mb in both the Tapidor and Ningyou7 pedigrees as well as Darmor-bzh (Fig. 2 ). For all 19 chromosomes, the lengths represented within the Tapidor and Ningyou7 pedigrees were slightly shorter than those of Darmor-bzh. The total length of the A subgenome (A01 to A10) was 238.8 Mb and of the C subgenome (C01 to C09) 404.9 Mb (Supplementary Table S1). An average density of 46 SNP per Mb was recorded in the genomes of the Tapidor and Ningyou7 pedigrees. Compared with other chromosomes, SNP marker densities were lower in A02 (30 SNP per Mb), C05 (20) and C09 (22) (Supplementary Table S1).
Figure 2.
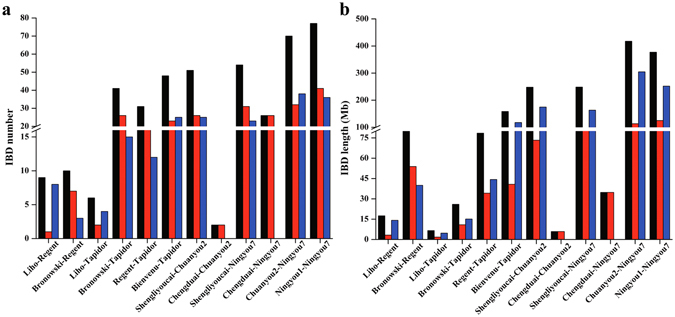
The number and length of identity by descent (IBD) blocks revealing the transfer of haplotype segments in the Tapidor and Ningyou7 pedigree cultivars. Number (a) and length (b) of IBD in the A and C sub-genomes of cultivars in the Tapidor and Ningyou7 pedigrees. The transfer of IBD from each progenitor to cultivars Regent, Tapidor, Chuanyou2 or Ningyou7 in the whole genome (black), A subgenome (red) and C subgenome (blue) are indicated.
Difference in IBD transfer between Tapidor and Ningyou7 pedigrees
Identity by descent (IBD) detected by pairwise comparison of cultivars within both pedigrees was calculated, along with the number and length of IBD blocks in the A and C subgenomes (Fig. 2, and Supplementary Table S2), and for both measures found to be greater in the Ningyou7 pedigree. Within the A subgenome of Tapidor pedigree, 78 IBD blocks with a total length of 161.2 Mb were identified, and for the C subgenome 67 IBD blocks (304.5 Mb). Within the Ningyou7 pedigree, 158 IBD blocks (438 Mb) were identified in the A subgenome and 122 IBD blocks (894.2 Mb) in the C subgenome (Fig. 2).
Most pairwise comparisons of cultivars detected more IBD blocks in the A subgenome than in the C subgenome, e.g. Bronowski vs Tapidor, Regent vs Tapidor, Bienvenu vs Tapidor, Shengliyoucai vs Ningyou7 and Ningyou1 vs Ningyou7 (Fig. 2). In contrast, there were fewer IBD blocks in the A subgenome for Liho vs Regent, Liho vs Tapidor and Ningyou7 vs Chuanyou2 (Fig. 2). No significant difference between subgenomes was observed for Bronowski vs Regent and Shengliyoucai vs Chuanyou2 (Fig. 2). The total lengths of the IBD blocks were shorter in the A subgenome than in the C subgenome for all pairwise comparisons of cultivars apart from Bronowski vs Tapidor. Overall the A subgenome showed more genetic variation than the C subgenome.
Within the Tapidor pedigree, the progenitor cultivar comparison of Bronowski vs Regent had the most (48) and longest (158.4 Mb) IBD blocks, whilst Liho vs Tapidor had the least (6), and shortest (6.6 Mb) IBD blocks (Fig. 2). Within the Ningyou7 pedigree, Ningyou1 vs Ningyou7 had the most (77), and Chengduai vs Chuanyou2 the least (2) and shortest (5.9 Mb) IBD blocks, while Chunayou2 vs Ningyou7 had the longest (417.7 Mb) IBD blocks (Fig. 2 and Supplementary Table S2). These results suggest that the IBD block length decreases with increasing number of generations and, hence, recombination cycles.
Two paths of haplotype transfer are possible within the Tapidor and Ningyou7 pedigrees, either via direct linear transfer from original parent to progeny in recent breeding crosses, or indirectly by transfer from intermediate parents generated in earlier breeding crosses (Fig. 3). Of the 79 directly transferred IBD blocks (corresponding to 236.9 Mb) identified within the Tapidor pedigree, 31 (78.5 Mb) were derived from Regent and 48 (158.4 Mb) from Bienvenu, with 47 indirectly transferred IBD blocks, including six (6.6 Mb) originating from Liho and 41 (26.0 Mb) from Bronowski (Table 1 and Fig. 3b). In contrast, of the 147 directly transferred IBD blocks identified in the Ningyou7 pedigree, 70 (417.7 Mb) were derived from Chuangyou2 and 77 (377.2 Mb) from Ningyou1, with 80 indirectly transferred IBDs, including 54 (248.5 Mb) from Shengliyoucai and 26 (34.8 Mb) from Chengduai (B. rapa) (Table 1 and Fig. 3a).
Figure 3.
The transfer of identity by descent (IBD) blocks from earlier cultivars to the Tapidor and Ningyou7 cultivars based on SNP markers. Progenitor genomes are indicated by shading for Tapidor (left side) and for Ningyou7 (right). The breeding of both Tapidor and Ningyou7 has selected for IBD from both recent (a) and distant (b) ancestor cultivars.
Table 1.
Number and total size of identity by descent (IBD) blocks by direct and indirect genetic transfer in the breeding of Tapidor and Ningyou7.
| Pedigree | Group | Size (Mb) | Number of IBD | Path of genetic transfer | Total IBD size(Mb) |
|---|---|---|---|---|---|
| Tapidor | Liho vs Tapidor | 6.6 | 6 | indirect | 32.6 |
| Bronowski vs Tapidor | 26.0 | 41 | indirect | ||
| Regent vs Tapidor | 78.5 | 31 | direct | 236.9 | |
| Bienvenu vs Tapidor | 158.4 | 48 | direct | ||
| Shengliyoucai vs Ningyou7 | 248.5 | 54 | indirect | 283.3 | |
| Ningyou7 | Chengduai vs Ningyou7 | 34.8 | 26 | indirect | |
| Chuanyou2 vs Ningyou7 | 417.7 | 70 | direct | 794.9 | |
| Ningyou1 vs Ningyou7 | 377.2 | 77 | direct |
The physical positions corresponding to QTLs identified for flowering time, seed oil content, seed erucic acid content, seed glucosinolate content and root morphology traits were mapped on the genome of the Tapidor and Ningyou7 pedigrees (Luo et al. unpublished data). A notable number of consensus QTL and genes were identified in the IBD block regions. These included those for flowering time (20 of 68 consensus QTL and 37 genes), seed oil content (21 of 73 QTL, 42 genes), seed glucosinolate content (15 of 45 QTL, 40 genes), and seed erucic acid content (7 of 35 QTL, 17 genes), as well as for root traits (16 of 56 QTL, 42 genes) (Fig. 4 and Supplementary Table S2).
Figure 4.
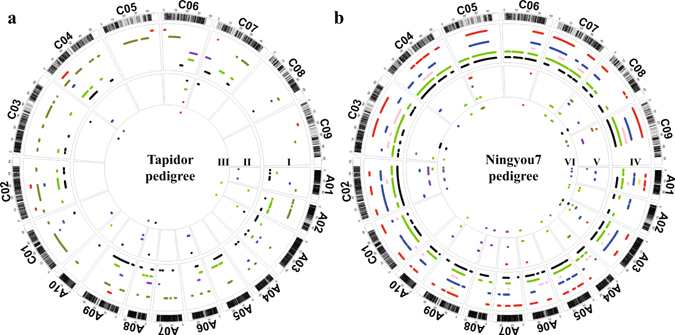
Distribution of QTLs detected for flowering time, seed quality and root morphology traits within the BnaTNDH population, and the candidate genes underlying the QTL region located in IBDs of cultivars of the Tapidor and Ningyou7 pedigrees. The outermost circle represents the SNP markers located on the genome of cultivar Darmor-bzh. Circle ‘I’ indicates the locations of IBD blocks on each of the chromosomes within the Tapdior pedigree; ‘IV’ within the Ningyou7 pedigree. Circle ‘II’ represents the additive effect QTLs for different agronomic traits located in the IBD regions within the Tapidor pedigree, and ‘V’ within the Ningyou7 pedigree. Circle ‘III’ demonstrates the candidate genes located in the QTL regions within the Tapidor pedigree and ‘VI’ within the Ningyou7 pedigree.
Evidence for gene level breeding selection in the Tapidor and Ningyou7 pedigrees
Based on the neutral selection theory for populations28, Tajima’s D values were calculated in each of the Tapidor and Ningyou7 pedigrees. Tajima’s D test allows detection of the location of selection at the DNA level. A value of 0.44 across the genome was associated with the Tapidor pedigree, compared with only 0.02 in the Ningyou7 pedigree. The value ranged from −0.23 (C09) to 0.94 (C01) in the Tapidor pedigree, and from −0.40 (C02) to 0.48 (C05) in the Ningyou7 pedigree (Supplementary Table S2). Within the Tapidor pedigree negative values were associated with C09, while in the Ningyou7 pedigree they were associated with two A subgenome chromosomes (A03, A05) and six C subgenome chromosomes (C02, C03, C04, C06, C07 and C09), indicating that directional selection had increased the rare alleles (Fig. 5, Supplementary Fig. S1 and Supplementary Table S2). We identified four classes of Tajima D values accounting for the total SNP variation within the Tapidor (Tpedigree) and Ningyou7 pedigrees (Npedigree), with Class 1 having (−2 to −1): 5% of Tpedigree vs 13% Npedigree; Class 2 (−1 to 0): 20% of Tpedigree vs 34% Npedigree; Class 3 (0 to 1): Tpedigree 48% vs 40% Npedigree; Class 4 (1 to 2): Tpedigree 13% vs 13% Npedigree (Supplementary Fig. S1).
Figure 5.
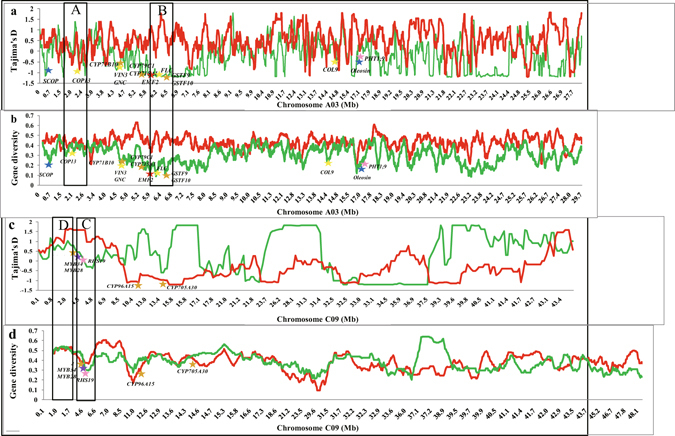
Variation in Tajima’s D (a,c) and gene diversity (b,d) values across chromosome A03 (a,b) and chromosome C09 (c,d) for cultivars in the Tapidor (red) and Ningyou7 (green) pedigrees. Key genes controlling flowering time (yellow stars), seed oil content (blue stars), seed glucosinolate content (orange star), seed erucic acid content (red stars), seed protein content (purple stars), and root morphological traits (pink stars) are indicated. Examples of genes in regions with Tajima’s D <0 and gene diversity >0.3, implying early selection during the breeding process (Box A), in regions with Tajima’s D <0 and gene diversity <0.3, implying later selection in the breeding process (Box B), in regions with Tajima’s D >0 and gene diversity <0.3, indicating selection before the pedigrees shown here (Box C), and in regions with Tajima’s D >0 and gene diversity >0.3, implying no selection on the locus (Box D), are illustrated.
Gene diversity across all chromosomes was similar for both pedigrees (Supplementary Table S2). In the Tapidor pedigree, mean values ranged from 0.35 (C05) to 0.44 (A04) with a mean of 0.40, compared with 0.3 (A02) to 0.52 (C01) with a mean of 0.36 in the Ningyou7 pedigree. The mean polymorphism information content (PIC) was slightly greater in the Tapidor pedigree (0.34, ranging from 0.28 in C05 to 0.38 in A04) than in the Ningyou7 pedigree (0.31, ranging from 0.24 in A02 to 0.45 in C01) (Supplementary Fig. S2 and Supplementary Table S2).
Two primary artificial selection processes are apparent in the breeding history of Tapidor and Ningyou7 (Fig. 5). Where a locus has a Tajima’s D <0 and gene diversity <0.3 (Fig. 5A), the artificial breeding selection of the locus is more likely to have occurred during the earlier breeding cycles. Where a locus has a Tajima’s D <0 and gene diversity >0.3 (Fig. 5B), the artificial breeding selection of the locus is likely to have occurred in a later round of breeding selection. Where a locus has a Tajima’s D >0 and gene diversity <0.3 (Fig. 5C), the artificial breeding selection of the locus is more likely to have taken place prior to the founding cultivars. Finally, where a locus has a Tajima’s D >0 and gene diversity >0.3 (Fig. 5D), there is no strong evidence for artificial breeding selection occurring at the locus (Figs 5 and 6)30. A total of 42 genes, 15 within the Tapidor and 27 within the Ningyou7 pedigrees, were detected where genetic transfer was associated within the earlier breeding selection process (Fig. 6 and Supplementary Table S2). Among these genes, two for flowering time and one for seed erucic acid content in the Tapidor pedigree appeared to have been subject to breeding selection. In the Ningyou7 pedigree, the genes involved in breeding selection included five for flowering time, two for seed erucic acid content, three for seed glucosinolate content and two for root morphology and phosphorus uptake. In the later breeding selection process, only two genes in Tapidor, but 116 in Ningyou7 were detected as being associated with genetic transfer (Fig. 6 and Supplementary Table S2). Of these, only one from the Tapidor pedigree and 65 from the Ningyou7 pedigree appeared to have been subject to breeding selection. The sole gene detected within the Tapidor pedigree, BnaA.FAE1, is an ortholog of KCS18 (3-ketoacyl-CoA synthase 18) located on A08, and represents one of the key domestication genes introduced from Liho, and known to contribute to modern ‘double-low’ canola, by reducing seed erucic acid content. The genes within the Ningyou7 pedigree included 15 for flowering time, ten for oil content, 18 for glucosinolate content, ten for erucic acid content, two for seed protein content, and ten for root morphology and phosphorus uptake (Fig. 6 and Supplementary Table S2).
Figure 6.
The transfer of candidate genes underlying the QTL region located in IBDs from earlier cultivars to the Tapidor and Ningyou7 cultivars in the breeding process based on SNP markers. Genomes are represented as rectangular boxes and the chromosomes of progenitor cultivars are indicated in different colors. Colored discs represent the number of key genes originating from each ancestor cultivar that have contributed to: flowering time (yellow), seed oil content (blue), seed glucosinolate content (orange), seed erucic acid content (red), seed protein content (purple), and root morphological traits (pink). Rectangular boxes represent genes that were not transferred to Tapidor and Ningyou7 for flowering time (yellow) and seed erucic acid content (red). The number in parenthesis is the theoretical genetic information transferred from progenitor cultivars to Tapidor and Ningyou7.
Favorable gene clusters transferred in the breeding of Tapidor and Ningyou7
Genetic hitchhiking (linkage drag) effects contribute to linkage disequilibrium (LD)33. The LD of the ten cultivars within the Tapidor and Ningyou7 pedigrees was calculated and used to estimate the extent of linkage drag. A mean correlation coefficient (r2) of 0.227 in the pedigree lineage indicated that a significant genetic relationship might exist at the whole genome level. When r2 = 0.2, the LD decay was 0.7 Mb. Thus, where genes are located within a region of LD ≤0.7 Mb in the B. napus genome they will form a cluster, and are more likely to be transferred as an intact haplotype block from the parents to offspring. A total of 24 favorable gene clusters, 10 in the A subgenome and 14 in the C subgenome were identified. These were associated with seed quality, flowering time, and root morphology traits linked to phosphorus uptake. They were located on all chromosomes apart from A02, C06 and C07 (Fig. 7 and Supplementary Table S2). Genetic transfer was detected within the Ningyou7 pedigree (18 clusters), the Tapidor pedigree (2 clusters) and within both pedigrees (4 clusters). In addition, 12 gene clusters were associated with combinations of two or more important agronomic traits, such as flowering time, root morphology and phosphorus uptake (No 6, A06), or flowering time and seed oil content (No. 14, C02; No. 20, C05; No. 22, C08) (Supplementary Table S2).
Figure 7.
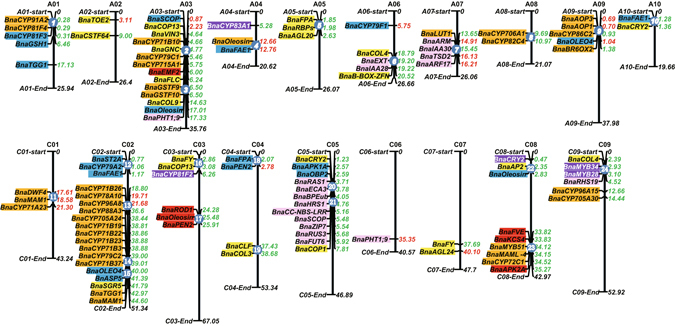
The distribution of gene clusters controlling important agronomic traits located on the physical map of B. napus. Key genes controlling flowering time (yellow boxes), seed oil content (blue boxes), seed glucosinolate content (orange boxes), seed erucic acid content (red boxes), seed protein content (purple boxes), and root morphological traits (pink boxes) detected within QTL regions in the BnaTNDH mapping population plotted on the 19 chromosomes of Darmor-bzh. Numbers to the right of each chromosome indicate the position of beneficial alleles from the Tapidor pedigree (red) or the Ningyou7 pedigree (green). The blue disc with white numbers on chromosomes indicates the gene clusters of important agronomic traits in the two cultivar pedigrees.
Discussion
Tapidor is a double-low (low seed glucosinolate and low seed erucic acid content) winter B. napus cultivar developed in Europe. Ningyou7 is a double-high (high seed glucosinolate and high seed erucic acid content) semi-winter B. napus cultivar developed in China. The flowering time of Tapidor is later than that of Ningyou717, and has a longer primary root and fewer lateral roots than Ningyou723. Agronomic and seed traits within the pedigrees of both these cultivars have undergone substantial improvement through extensive breeding efforts. These cultivars were crossed to generate the BnaTNDH biparental doubled haploid segregating population, which has been used extensively to understand the genetic basis of many agronomic and economically important traits in B. napus 1, 13, 14, 16, 17, 19, 23, 33–36. Uncovering the associated underlying patterns of allelic variation in the context of the sequenced genome is anticipated to provide valuable knowledge that will guide subsequent advances in breeding1, 11.
In this study, Tapidor, Ningyou7 and their eight progenitor ancestors were screened with the 60 K Brassica Infinium SNP array. A total of 29,347 high–quality SNP markers were mapped to the 19 pseudomolecule chromosomes of Darmor-bzh (Supplementary Table S1). Using the SNP markers of Tapidor and Ningyou7 as the reference for each pedigree, IBD regions detected from pairwise comparisons of cultivars in each of the pedigrees were assessed (Fig. 4 and Supplementary Fig. S3). The number of IBD blocks for the cultivars in the Ningyou7 pedigree was greater than that in the Tapidor pedigree (Fig. 4), which provides evidence of a greater power of selection or increased recombination occurring in the recent breeding of Ningyou726–28. The IBD regions that Regent inherited from the two grandparents studied here summed to only about 176 Mb (Table 1), only a subset of the 650 Mb covered by the SNP markers (Fig. 4). This can be attributed to Regent having inherited almost 75% of its genome complement from Turret5. A similar consequence of complex or unbalanced pedigree construction appears to account for the relatively low level of 202 Mb IBD regions for Tapidor derived from the parents and grandparents studied here (Fig. 4; Table 1). In this case, Tapidor has derived part of its genome complement from SI8879 as well as from Turret7 (Fig. 1). Overall, the total IBD length in the C subgenome was larger than that in the A subgenome in both pedigrees (Fig. 4), suggesting that the C subgenome of parental cultivars has contributed more to the selected agronomic traits of current cultivars than the A sub-genome, whether bred in Europe or in China. The relative conservation of the C subgenome during breeding of both Tapidor and Ningyou7 is consistent with observations that i) canola OSR cultivars show less genetic variation in the C compared with A subgenomes11 and ii) LD decay of canola OSR cultivars is much larger in the C than in the A subgenome37.
The QTLs for flowering time, seed oil content, seed glucosinolate content, seed erucic acid content, seed protein content and root morphological traits were reanalyzed using the new high-density SNP-based BnaTNDH linkage map36 (Luo et al. unpublished data). The QTLs and putative genes located in the IBD regions of cultivars within the Tapidor and Ningyou7 pedigrees illustrate the differences in haplotype transfer from the progenitor cultivars to Tapidor and Ningyou7 (Fig. 6 and Supplementary Table S2). The 18 favorable gene clusters identified in the Ningyou7 pedigree were involved in six important agronomic traits, while the two favorable gene clusters identified in the Tapidor pedigree were only associated with seed glucosinolate and protein content (Fig. 7 and Supplementary Table S2). Half of the 24 favorable gene clusters were associated with two or more important agronomic traits, suggesting that agronomic traits such as flowering time and root morphology could influence seed quality traits, including oil, erucic acid, protein, and glucosinolate content14, 23, 38. This might be due to pleiotropic effects when a favourable gene substitution occurs in a population, or due to changes in gene frequencies at closely linked loci39.
Genes with lower gene diversity in a population tend to reflect selection in the breeding of cultivars29, 40. In our study BnaA05g03310D (BnaA.FPA), which is the B. napus ortholog of the flowering time gene AT2G43410 in A. thaliana and Bra004761 in B. rapa (Chiifu-401), was detected within the IBD block on A05 with lower gene diversity in two early breeding cycles in pairwise comparison of progenitor cultivars Chunayou2 vs Shengliyoucai, Ningyou7 vs Shengliyoucai and Ningyou7 vs Chuanyou2 from the Ningyou7 pedigree (Fig. 7). The donor parent of BnaFPA is Shengliyoucai and the gene was transferred via Chuanyou2 to Ningyou7. In south China, early flowering results in early harvest of OSR, which can alleviate loss of seed yield due to high temperatures from late April to early May.
Plant roots are of fundamental importance to soil resource acquisition41. Phosphorus acquisition can be improved by increasing the lateral roots distributed in the topsoil42. An ortholog of AtIAA28 was found within an IBD block on A06 which is conserved from Shengliyoucai to Chuangyou2 and hence to Ningyou7, and is co-located within a QTL for lateral root development (Fig. 6 and Supplementary Table S2). Genes homologous to AtPht1;9 are found within IBD blocks on A09 conserved from Shengliyoucai to Chuanyou2 in the same pedigree, and are collocated within a QTL for primary root length and seed yield per plants at both low and high phosphorus supply (Fig. 6 and Supplementary Table S2). In the Tapidor pedigree, orthologous alleles of AtPht1;9 were conserved from Bienvenu to Tapidor. Genes that have been subject to breeding selection show lower gene diversity (Supplementary Table S2). The B. napus orthologue of A. thaliana AtPht1;9, BnaA03g35470D, is located on chromosome A03 and has also been detected as a contributor to responses to phosphorus deficiency in a B. napus population of 405 inbred lines (Wang et al., unpublished data). Phosphate fertilizers were used extensively in European agriculture43 during the period Tapidor was bred from Liho and Bronowski, whilst little phosphate fertilizer was being used in China during the time Ningyou7 was being developed from Shengliyoucai and Chengduai. It is possible, therefore, that differences in root morphology between Tapidor and Ningyou723, 36 might be attributed to selective breeding under these contrasting conditions.
Although the Brassica 60 K Infinium SNP array44 provides a straightforward and powerful platform to facilitate assessment of genetic variation among B. napus cultivars, we recognize that the detection of SNP variation may be biased due to the relatively small number of genotypes that were originally used to identify SNPs. Since sequence data from both Ningyou7 and Tapidor as samples in the development of the SNP array45, this could affect the utility of Tajima’s D as a measure of the evolutionary history of a locus. In particular, this could occur since Tajima’s D is based on detection of pairwise differences between samples. An example of this potential bias is apparent in the detection of only one FAE (KCS18) locus on A08, whereas the corresponding C genome copy on C03 was not detected as a candidate gene, although it had previously been identified in contributing to the low erucic acid phenotype of Tapidor19. Moreover, the detection of candidate genes and estimates of gene diversity based on array data does not take into account those polymorphisms that may be present between Tapidor and Ningyou7 but not represented on the array. Based on the transcriptome data of Bancroft et al. (2011)1, 19 of 105 candidate genes within IBD blocks and QTL had between 1 and 12 SNPs between Tapidor and Ningyou7 and appear to be associated with the set of traits investigated in our study (Supplementary Table S3). Unfortunately we were not able to differentiate gene homologs as the transcriptome data are not yet anchored to physical map positions1. However, the polymorphisms that were discovered could be used to generate molecular markers to assign gene loci to specific QTL regions.
The total IBD block length in the C subgenome was larger than that in the A subgenome in both the Tapidor and Ningyou7 pedigrees, suggesting that the C subgenome had probably contributed more to agronomically useful traits than the A subgenome in the breeding of OSR in both Europe and China. The genetic differences in improved traits (flowering time; seed yield; seed oil, glucosinolate and erucic acid content; and root traits for P uptake) during the breeding history of Tapidor and Ningyou7 have been identified from IBD, QTLs and candidate genes, as well as with Tajima’s D and a gene diversity test in the two pedigrees. Twenty four favorable gene clusters were detected as being transferred from the progenitor parents to Tapidor and Ningyou7, and could be used for further improving and dissecting the agronomic traits of B. napus.
Methods
Plant materials
Tapidor pedigree cultivars originate from European countries and Canada. Among these Liho came originally from Germany, Bronowski from Poland, Bienvenu and Tapidor from France, and Regent from Canada. Ningyou7 pedigree cultivars originate from Asian countries, with Shengliyoucai from Japan, and Chengduai, Chuanyou2, Ningyou1 and Ningyou7 from China. The species and geographical origin and basic traits of all cultivars studied are summarized in Supplementary Table S4, and their pedigrees are summarized in Fig. 5. Seeds were provided by Jinling Meng and grown in the field in Wuhan (114°20′54″E, 30°28′36″N) with self-pollination. Traits (seed oil content; seed glucosinolate content; seed erucic acid content; seed protein content) were assessed by near-infrared reflectance spectroscopy (NIR; Systems 5000)11 and flowering time assessed according to Long et al.17. Root traits and phosphorus uptake were evaluated according to Shi et al. and Zhang et al.23, 36 (Supplementary Table S5).
Collection of agronomic traits and QTL mapping
Data collection
Data for flowering time of the BnaTNDH population and its parental lines, Tapidor and Ningyou7, were mostly obtained from previous studies17 across 11 environments over four years. Flowering time was calculated as the time from sowing to the date when the first flower of half of the plants in the plot had opened. Lines that did not flower in all the spring-cropped environments were given a score of 150 days18, 46. Data for seed oil, glucosinolate, erucic acid and protein content of the BnaTNDH population and its two parents were also acquired primarily from previous studies13, 14 across 15 environments over five years. In these studies approximately 3 g seed per accession were analysed using NIRS on a reflectance scanning mode14. Root morphology data for the BnaTNDH population and two parents grown at low phosphorus (LP) and high phosphorus (HP) supply were obtained from a previous study by Shi et al.23. The plants were grown at LP (0.006 mM P) and HP (0.625 mM P) supply on agar, with ample supply of all other nutrients. The trays were scanned at 12 d. Seedling traits, including primary root length, lateral root number, lateral root density, lateral root length, root and shoot fresh weight, were determined.
QTL mapping and prediction of candidate genes underlying the QTL regions
All the data for flowering time, seed quality and root morphology traits from the BnaTNDH population were used to conduct QTL analysis using the BnaTNDH 2041 linkage map, a new high-density SNP-based genetic linkage map36 (Luo et al., unpublished data). QTL detection employed the composite interval method (CIM) using QTL cartographer software version WinQTLCart2.547. SNP markers flanking the QTL regions were mapped on the genome of Darmor-bz 4. The genes related to the studied traits located in the homologous physical regions of Darmor-bzh were predicted to be the candidate genes.
Genotyping
DNA extraction
A modified cetyltrimethyl ammonium bromide (CTAB) method was used to extract DNA from young leaves48. Four leaves from different individuals of each line were used to construct DNA bulks. The DNA concentration in bulks was measured by electrophoresis through a conventional 2% agarose gel. 30 ng μl−1, 50 ng μl−1 and 100 ng μl−1 λDNA (48502 bp) was used as reference. The final DNA concentration was adjusted to be 50 ng μl−1.
Microarray hybridization and SNPs identification
The Brassica 60 K Illumina Infinium SNP array (Illumina, USA) contains 52,157 probes, each representing a distinct locus. Microarray hybridization consisted of the following steps: I, The DNA samples were denatured and neutralized to be prepared for amplification; II, The amplified product was fragmented by MSM enzyme; III, After precipitation using isopropanol, the fragmented DNA was collected by centrifugation at 4 °C and the precipitated DNA was re-suspended and in hybridization buffer at 48 °C and denatured at 95 °C; IV, Re-suspended DNA were added to a beadchip for hybridization at 48 °C; V, Using the captured DNA as a template, oligos were extended on the beadchip by a single base; VI, The Illumina HiScan was used to scan the beadchip, using a laser to excite the fluorophore of the single-base extension product on the beads. The scanner recorded high-resolution images of the light emitted from the fluorophores, which were analysed using the Illumina HiSeq 2000. The fluorophores had red and green colors, which represented four different types of SNP marker (A, T, C and G). Genetic loci were identified by statistical analysis (Infinium HD Assay Ultra, Manual, Experienced User Card)14, 18, 35.
Physical mapping of SNP markers
The Brassica 60 K Illumina Infinium SNP array was designed based on reference sequences of B. rapa (AA) and B. oleracea (CC)14. Each of the SNP markers is attached to a length of 50 bp SNP probe. The genome of Darmor-bzh was used as the reference genome and all the SNP markers were mapped to its physical map. Only one copy of BLAST hits of the SNP marker against the reference sequences were considered to be the most likely SNP position14.
Identity by descent (IBD) analysis in Tapidor and Ningyou7 pedigrees
Identity by descent (IBD) is a segment on the chromosome representing a haplotype block inherited from a shared common ancestor24. The software fastIBD (Beagle version 4.0)49 was used to detect IBD between pairs of cultivars among the Tapidor and Ningyou7 pedigrees using genome-wide SNP data. The software takes account of haplotype frequencies and uncertain haplotypes whilst enabling fast computation using genome-wide SNP data. Linked markers were identified at a P value(E) < 10−9.
The distributions of IBD regions in Tapidor and Ningyou7 pedigrees were represented using R3.1.3 plotting software3. Using SNP markers for Tapidor or Ningyou7 as a reference, IBD regions for pairs of cultivars within the respective pedigrees were mapped. Based on the physical map (anchored genome sequence) of Darmor-bzh, the genes detected both within the QTL regions detected in the BnaTNDH population, and within the IBD region of the progenitors of Tapidor and Ningyou7, were used to identify gene clusters.
Tajima’s D test and Gene diversity
Tajima’s D test is used to determine where selection has occurred at the DNA level based on the neutral selection theory of populations29. The Dnasp5 software50 uses a sliding window method (segment of DNA) which progressively scans along the genome sequences in steps, and was employed to calculate parameters across a DNA region. The parameter is calculated in each window, and the value assigned to the nucleotide at the midpoint of the window. The D pair statistic is an estimate of the diversity level of the five cultivars within each pedigree using a sliding windows analysis, and is able to establish the variation of a unit of 15 loci with a single locus at each step29.
PowerMarker V3.25 was employed to calculate allelic frequency differences, in order to speculate on the genetic difference due to mutations and selection29, 51. The genome wide distribution of gene diversity for each of the 19 chromosomes was assessed in the BnaTNDH population. The selection loci in genomes of the Tapidor and Ningyou7 pedigrees were determined by combining the gene diversity test and the candidate genes underlying the QTL regions. A higher frequency of selection events is associated with regions with lower gene diversity. Based on two main breeding selection cycles, the gene diversity changes among three cultivars were calculated. These cultivars were earlier breeding cycle cultivars (Liho, Bronowski and Regent) and later breeding cycle cultivars (Bienvenu, Regent and Tapidor).
Nei’s measure of the average gene diversity per locus HS is determined by the formula30:
where k is the total number of loci (differentiating factors), H Ss = 1 − q s 2 − (1 − q s)2, and qs is the frequency of one of the two alleles at the sth diallelic locus (or virulence frequency, or band frequency, or frequency of appearance 1 at the sth differentiating factor).
Linkage disequilibrium (LD)
The model of non-linear regression in TASSEL 3.014 was used to calculate the LD of whole-genome of the ten cultivars in Tapidor and Ningyou7 pedigrees. The full matrix LD model was chosen and the correlation coefficient (r2) for pairs of markers was calculated using a sliding window with increments of half a window each step52. A curved line was fitted based on X (r2) and Y (physical distance) and r2 was 1 while physical distance of two loci equal to 0 bp. When r2 fell below 0.2, the physical distance was estimated53. Where genes are located within a region of linkage disequilibrium (LD ≤ 0.7 Mb) in the B. napus genome they will form a cluster, and are more likely to be transferred as an intact haplotype block from the parents to offspring.
Electronic supplementary material
Acknowledgements
The authors acknowledge the financial support from the National Nature Science Foundation of China (Grant No. 31471933), National Key Research and Development Program for Crop Breeding (Grant No. 2016YFD0100305), New Century Excellent Talents in University of Ministry of Education of China (Grant No. NCET-13-0809) and the Fundamental Research Funds for the Central Universities of China (Grant Nos 2014PY020; 2662015PY105). GK is supported by the Chutian Scholar Fund of Hubei province.
Author Contributions
Conceptual and experiment designs by L.S., Y.L., X.W., F.X. and J.M.; Experiments were conducted by X.W., Y.L., J.Z., Y.Z., P.Y. and Q.Z.; Data analysis performed by X.W., N.W., G.D., Z.L., P.L., and H.C.; Reagents/materials/analysis tools were contributed by L.S., M.B., H.Z. and J.M. and the report was written by X.W., L.S., G.K. and P.W. All the authors have commented, read and approved the final manuscript.
Competing Interests
The authors declare that they have no competing interests.
Footnotes
Electronic supplementary material
Supplementary information accompanies this paper at doi:10.1038/s41598-017-02188-z
Publisher's note: Springer Nature remains neutral with regard to jurisdictional claims in published maps and institutional affiliations.
References
- 1.Bancroft I, et al. Dissecting the genome of the polyploid crop oilseed rape by transcriptome sequencing. Nat. Biotechnol. 2011;29:762–766. doi: 10.1038/nbt.1926. [DOI] [PubMed] [Google Scholar]
- 2.USDA, E. County Typology Codes. (Washington, DC: USDA, 2015).
- 3.FAOSTAT (Food and Agriculture Organization of the United Nations, Statistics Division). Production (Crops). (2014) Available at: http://faostat3.fao.org/download/Q/QC/E. (Accessed: 21st July 2016).
- 4.Chalhoub B, et al. Plant genetics. Early allopolyploid evolution in the post-Neolithic Brassica napus oilseed genome. Science. 2014;345:950–953. doi: 10.1126/science.1253435. [DOI] [PubMed] [Google Scholar]
- 5.Sharpe AG, Lydiate DJ. Mapping the mosaic of ancestral genotypes in a cultivar of oilseed rape (Brassica napus) selected via pedigree breeding. Genome. 2003;46:461–468. doi: 10.1139/g03-031. [DOI] [PubMed] [Google Scholar]
- 6.Klassen AJ, Downey RK, Capcara JJ. Westar summer rape. Can. J. Plant Sci. 1987;67:491–493. doi: 10.4141/cjps87-068. [DOI] [Google Scholar]
- 7.Fu YB, Gugel RK. Genetic diversity of Canadian elite summer rape (Brassica napus L.) cultivars from the pre-to post-canola quality era. Can. J. Plant Sci. 2010;90:23–33. doi: 10.4141/CJPS09073. [DOI] [Google Scholar]
- 8.Liu H. Origin and evolution of rapeseeds. Acta. Agron. Sin. 1984;1:10–18. [Google Scholar]
- 9.Zhang J, Qi C, Jiang X, Pu H. Pedigree and trait analysis of rapeseed varieties registered in Jiangsu province in 1982–2012. J. Plant Genet. 2014;15:7–22. [Google Scholar]
- 10.Chen Z, Wei Z, Xu Z. Study on hypocotyl protoplast culture of rapeseed. Chin. J. Biotechnol. 1994;1:005. [PubMed] [Google Scholar]
- 11.Wang N, et al. Genome-wide investigation of genetic changes during modern breeding of Brassica napus. Theor. Appl. Genet. 2014;127:1817–1829. doi: 10.1007/s00122-014-2343-6. [DOI] [PubMed] [Google Scholar]
- 12.Li F, et al. Genome-wide association study dissects the genetic architecture of seed weight and seed quality in rapeseed (Brassica napus L.) DNA Res. 2014;21:355–367. doi: 10.1093/dnares/dsu002. [DOI] [PMC free article] [PubMed] [Google Scholar]
- 13.Jiang C, et al. Quantitative trait loci that control the oil content variation of rapeseed (Brassica napus L.) Theor. Appl. Genet. 2014;127:957–968. doi: 10.1007/s00122-014-2271-5. [DOI] [PubMed] [Google Scholar]
- 14.Cao Z, et al. Analysis of QTLs for erucic acid and oil content in seeds on A8 chromosome and the linkage drag between the alleles for the two traits in Brassica napus. J. Genet. Genomics. 2010;37:231–240. doi: 10.1016/S1673-8527(09)60041-2. [DOI] [PubMed] [Google Scholar]
- 15.Lukowitz W, Gillmor CS, Scheible WR. Positional cloning in Arabidopsis. Why it feels good to have a genome initiative working for you. Plant Physiol. 2000;123:7–806. doi: 10.1104/pp.123.3.795. [DOI] [PMC free article] [PubMed] [Google Scholar]
- 16.Qiu D, et al. A comparative linkage map of oilseed rape and its use for QTL analysis of seed oil and erucic acid content. Theor. Appl. Genet. 2006;114:67–80. doi: 10.1007/s00122-006-0411-2. [DOI] [PubMed] [Google Scholar]
- 17.Long Y, et al. Flowering time quantitative trait loci analysis of oilseed brassica in multiple environments and genomewide alignment with Arabidopsis. Genetics. 2007;177:2433–2444. doi: 10.1534/genetics.107.080705. [DOI] [PMC free article] [PubMed] [Google Scholar]
- 18.Li L, et al. Genome wide analysis of flowering time trait in multiple environments via high-throughput genotyping technique in Brassica napus L. PLoS One. 2015;10:e0119425. doi: 10.1371/journal.pone.0119425. [DOI] [PMC free article] [PubMed] [Google Scholar]
- 19.Wang N, et al. A functional genomics resource for Brassica napus: development of an EMS mutagenized population and discovery of FAE1 point mutations by TILLING. New Phytol. 2008;180:751–765. doi: 10.1111/j.1469-8137.2008.02619.x. [DOI] [PubMed] [Google Scholar]
- 20.Feng J, et al. Characterization of metabolite quantitative trait loci and metabolic networks that control glucosinolate concentration in the seeds and leaves of Brassica napus. New Phytol. 2012;193:96–108. doi: 10.1111/j.1469-8137.2011.03890.x. [DOI] [PubMed] [Google Scholar]
- 21.Augustine R, Mukhopadhyay A, Bisht NC. Targeted silencing of BjMYB28 transcription factor gene directs development of low glucosinolate lines in oilseed Brassica juncea. Plant Biotechnol. J. 2013;11:855–866. doi: 10.1111/pbi.12078. [DOI] [PubMed] [Google Scholar]
- 22.Yang M, Ding G, Shi L, Xu F, Meng J. Detection of QTL for phosphorus efficiency at vegetative stage in Brassica napus. Plan Soil. 2010;339:97–111. doi: 10.1007/s11104-010-0516-x. [DOI] [Google Scholar]
- 23.Shi L, et al. High-throughput root phenotyping screens identify genetic loci associated with root architectural traits in Brassica napus under contrasting phosphate availabilities. Ann. Bot. 2013;112:381–389. doi: 10.1093/aob/mcs245. [DOI] [PMC free article] [PubMed] [Google Scholar]
- 24.Browning SR. Estimation of pairwise identity by descent from dense genetic marker data in a population sample of haplotypes. Genetics. 2008;178:2123–2132. doi: 10.1534/genetics.107.084624. [DOI] [PMC free article] [PubMed] [Google Scholar]
- 25.Blue EM, et al. Identity-by-descent graphs offer a flexible framework for imputation and both linkage and association analyses. BMC Proc. 2014;8:S19. doi: 10.1186/1753-6561-8-S1-S19. [DOI] [PMC free article] [PubMed] [Google Scholar]
- 26.Albrechtsen A, Moltke I, Nielsen R. Natural selection and the distribution of identity-by-descent in the human genome. Genetics. 2010;186:295–308. doi: 10.1534/genetics.110.113977. [DOI] [PMC free article] [PubMed] [Google Scholar]
- 27.Han L, Abney M. Identity by descent estimation with dense genome-wide genotype data. Genet. Epidemiol. 2011;35:557–567. doi: 10.1002/gepi.20544. [DOI] [PMC free article] [PubMed] [Google Scholar]
- 28.Tajima F. Statistical method for testing the neutral mutation hypothesis by DNA polymorphism. Genetics. 1989;123:585–595. doi: 10.1093/genetics/123.3.585. [DOI] [PMC free article] [PubMed] [Google Scholar]
- 29.Lai J, et al. Genome-wide patterns of genetic variation among elite maize inbred lines. Nat. Genet. 2010;42:1027–1030. doi: 10.1038/ng.684. [DOI] [PubMed] [Google Scholar]
- 30.Nei M, Roychoudhury AK. Sampling variances of heterozygosity and genetic distance. Genetics. 1974;76:379–390. doi: 10.1093/genetics/76.2.379. [DOI] [PMC free article] [PubMed] [Google Scholar]
- 31.Kimura M. Evolutionary rate at the molecular level. Nature. 1968;217:624–6. doi: 10.1038/217624a0. [DOI] [PubMed] [Google Scholar]
- 32.Wright SI, et al. The effects of artificial selection on the maize genome. Science. 2005;308:1310–1314. doi: 10.1126/science.1107891. [DOI] [PubMed] [Google Scholar]
- 33.Thomson G. Effect of a selected locus on linked neutral loci. Genetics. 1977;85:753–788. doi: 10.1093/genetics/85.4.753. [DOI] [PMC free article] [PubMed] [Google Scholar]
- 34.Wang J, et al. The evolution of Brassica napus FLOWERING LOCUST paralogues in the context of inverted chromosomal duplication blocks. BMC Evol. Biol. 2009;9:271. doi: 10.1186/1471-2148-9-271. [DOI] [PMC free article] [PubMed] [Google Scholar]
- 35.Long Y, et al. Epigenetic QTL mapping in Brassica napus. Genetics. 2011;189:1093–102. doi: 10.1534/genetics.111.131615. [DOI] [PMC free article] [PubMed] [Google Scholar]
- 36.Zhang Y, et al. QTL meta-analysis of root traits in Brassica napus under contrasting phosphorus supply in two growth systems. Sci. Rep. 2016;6:33113. doi: 10.1038/srep33113. [DOI] [PMC free article] [PubMed] [Google Scholar]
- 37.Liu S, et al. A genome-wide association study reveals novel elite allelic variations in seed oil content of Brassica napus. Theor. Appl. Genet. 2016;129:1203–1215. doi: 10.1007/s00122-016-2697-z. [DOI] [PubMed] [Google Scholar]
- 38.Quijada PA, Udall JA, Lambert B, Osborn TC. Quantitative trait analysis of seed yield and other complex traits in hybrid spring rapeseed (Brassica napus L.): 1. Identification of genomic regions from winter germplasm. Theor. Appl. Genet. 2006;113:549–561. doi: 10.1007/s00122-006-0323-1. [DOI] [PubMed] [Google Scholar]
- 39.Smith JM, Haigh J. Hitch-hiking effect of a favorable gene. Genetics Res. 1974;23:23–35. doi: 10.1017/S0016672300014634. [DOI] [PubMed] [Google Scholar]
- 40.Xu X, et al. Resequencing 50 accessions of cultivated and wild rice yields markers for identifying agronomically important genes. Nat. Biotechnol. 2012;30:105–111. doi: 10.1038/nbt.2050. [DOI] [PubMed] [Google Scholar]
- 41.White PJ, et al. Matching roots to their environment. Ann. Bot. 2013;112:207–222. doi: 10.1093/aob/mct123. [DOI] [PMC free article] [PubMed] [Google Scholar]
- 42.Lynch JP, Brown KM. Topsoil foraging–an architectural adaptation of plants to low phosphorus availability. Plant Soil. 2001;237:225–237. doi: 10.1023/A:1013324727040. [DOI] [Google Scholar]
- 43.Johnston, A. E. & Steen, I. Understanding phosphorus and its use in agriculture. European Fertilizer Manufacturers Association (2000).
- 44.Clarke WE, et al. A high-density SNP genotyping array for Brassica napus and its ancestral diploid species based on optimised selection of single-locus markers in the allotetraploid genome. Theor. Appl. Genet. 2016;129:1887–1899. doi: 10.1007/s00122-016-2746-7. [DOI] [PMC free article] [PubMed] [Google Scholar]
- 45.Curk F, et al. Nuclear species-diagnostic SNP markers mined from 454 amplicon sequencing reveal admixture genomic structure of modern citrus varieties. PloS one. 2015;10:e0125628. doi: 10.1371/journal.pone.0125628. [DOI] [PMC free article] [PubMed] [Google Scholar]
- 46.Osborn TC, et al. Comparison of flowering time genes in Brassica rapa, B. napus and Arabidopsis thaliana. Genetics. 1997;146:1123–1129. doi: 10.1093/genetics/146.3.1123. [DOI] [PMC free article] [PubMed] [Google Scholar]
- 47.Wang, S. C., Bastern, C. J. & Zeng, Z. B. Windows QTLCartographer 2.5. Department of Statistics, North Carolina State University, Raleigh, NC. (2012) Available at: http://statgen.ncsu.edu/qtlcart/WQTLCart.htm. (Accessed: 12th November 2015).
- 48.Lodhi MA, et al. A simple and efficient method for DNA extraction from grapevine cultivars and Vitis species. Plant Mol. Biol. Rep. 1994;12:6–13. doi: 10.1007/BF02668658. [DOI] [Google Scholar]
- 49.Browning BL, Browning SR. A fast, powerful method for detecting identity by descent. Am. J. Hum. Genet. 2011;88:173–182. doi: 10.1016/j.ajhg.2011.01.010. [DOI] [PMC free article] [PubMed] [Google Scholar]
- 50.Librado P, Rozas J. DnaSP v5: a software for comprehensive analysis of DNA polymorphism data. Bioinformatics. 2009;25:1451–1452. doi: 10.1093/bioinformatics/btp187. [DOI] [PubMed] [Google Scholar]
- 51.Liu K, Muse SV. PowerMarker: an integrated analysis environment for genetic marker analysis. Bioinformatics. 2005;21:2128–2129. doi: 10.1093/bioinformatics/bti282. [DOI] [PubMed] [Google Scholar]
- 52.Slatkin M. Linkage disequilibrium–understanding the evolutionary past and mapping the medical future. Nat. Rev. Genet. 2008;9:477–485. doi: 10.1038/nrg2361. [DOI] [PMC free article] [PubMed] [Google Scholar]
- 53.Xiao Y, et al. Genetic structure and linkage disequilibrium pattern of a rapeseed (Brassica napus L.) association mapping panel revealed by microsatellites. Theor. Appl. Genet. 2012;125:437–447. doi: 10.1007/s00122-012-1843-5. [DOI] [PubMed] [Google Scholar]
Associated Data
This section collects any data citations, data availability statements, or supplementary materials included in this article.