Supplemental Digital Content is available in the text.
Keywords: biomarkers, brain, diagnostic imaging, magnetic resonance imaging, stroke
Abstract
Background and Purpose—
The susceptibility vessel sign (SVS) is a hypointense signal visualized because of the susceptibility effect of thrombi, sensitively detected on susceptibility-weighted magnetic resonance imaging. The relationship of SVS parameters with the stroke subtype and recanalization status after endovascular treatment remains uncertain.
Methods—
The data from 89 patients with acute stroke caused by anterior circulation infarcts who underwent susceptibility-weighted magnetic resonance imaging before endovascular treatment were examined. Independent reviewers, blinded to the stroke subtype and recanalization status, measured the SVS diameter, length, and estimated volume. The intra- and interrater agreements of the SVS parameters were assessed.
Results—
The SVS was identified in 78% of the patients. SVS was more commonly associated with cardioembolism than with noncardioembolism (P=0.01). The SVS diameter (P<0.01) and length (P=0.01) were larger in the cardioembolism group. The SVS diameter was larger in the recanalization group (thrombolysis in cerebral infarction ≥2b) than in the nonrecanalization group (P=0.04). Multivariable analysis revealed that the SVS diameter was an independent predictor of cardioembolism (adjusted odds ratio, 1.97; 95% confidence interval, 1.34–2.90; P<0.01). There was no significant association between the SVS volume and the recanalization status (adjusted odds ratio, 1.003; 95% confidence interval, 0.999–1.006; P=0.12). The optimal cutoff value of the SVS diameter for the cardioembolism was 5.5 mm (sensitivity, 45.6%; specificity, 93.8%).
Conclusions—
Increased SVS diameter on susceptibility-weighted magnetic resonance imaging may predict cardioembolism. No clear association was found between SVS volume and endovascular recanalization.
The susceptibility vessel sign (SVS) is classically defined as a dark blooming artifact visible on T2*-weighted gradient echo (GRE) images because of the magnetic susceptibility effect of deoxygenated hemoglobin in the red blood cells (RBCs) trapped in occlusive vessels.1 Its existence is usually defined when the blooming artifact exceeds the proper vessel diameter. The SVS on GRE (GRE-SVS) images is observed to contain RBC-rich thrombi when retrieved.2 It was also reported that the presence of GRE-SVS is associated with cardioembolic stroke and subsequent spontaneous recanalization.3 Although endovascular treatment is an effective treatment option to reverse the clinical course of ischemic stroke, individual prognosis must be considered before proceeding with the therapy.4 The characteristics of the clot may determine the success of the endovascular treatment, but how it affects recanalization remains unclear.
With the development of susceptibility-weighted magnetic resonance imaging (SWMRI), which is more sensitive than T2*-weighted GRE imaging, the clot detection rate was much higher.5 For better use of this highly sensitive tool, we redefined the SVS as a hypointense signal independent of its size and quantitatively analyzed the SVS diameter and length in patients with acute ischemic stroke who underwent endovascular treatment. We assessed the correlation between the 2 SVS parameters and the stroke mechanism and that between the SVS volume and the recanalization status.
Methods
Collection of Patient Data
In this observational study based on a prospective stroke registry, we retrospectively reviewed the clinical and radiological information from patients with acute ischemic stroke who received endovascular treatment at Seoul National University Hospital between February 2010 and June 2015. The authors collected eligible cases using the following inclusion criteria: (1) a final diagnosis of acute ischemic stroke or transient ischemic attack; (2) endovascular treatment performed, regardless of the use of IV r-tPA (recombinant tissue-type plasminogen activator; 0.9 mg/kg); (3) diffusion-weighted imaging, susceptibility weight angiography, or susceptibility-weighted imaging (SWI), and time-of-flight magnetic resonance angiography performed before the endovascular treatment; and (4) symptomatic occlusion of intracranial arteries of anterior circulation (ie, the distal internal carotid, anterior, or middle cerebral arteries). The exclusion criteria were as follows: (1) poor SWMRI image quality and (2) cessation of endovascular treatment because of poor medical condition. Finally, a total of 89 cases were eligible for the analysis. Endovascular treatment was performed by skilled intervention neuroradiologists according to the current clinical practice guidelines and institutional protocols. This study was approved by the Institutional Review Board at the Seoul National University Hospital (IRB no H-1509-049-702).
Definition of Clinical Information
We collected the participants’ baseline demographic and clinical information, including age; sex; history of stroke; history of transient ischemic attack; cardiovascular risk factors such as hypertension, diabetes mellitus, hyperlipidemia, atrial fibrillation, and habitual smoking (current or past regular smoking). The symptom onset, groin puncture time, time of bolus injection of r-tPA, if any, and the National Institutes of Health Stroke Scale score at admission were collected. The stroke subtype was assessed using the TOAST classification (Trial of ORG 10172 in Acute Stroke Treatment).6 The hyperacute recanalization procedure was performed according to the current clinical practice guidelines, institutional protocols, and discretion of the physician.7 Intravenous r-tPA was administered according to the clinical context (time window, age, comorbidity, etc) before performing the magnetic resonance imaging (MRI).
Brain MRI
The patients were examined using a 3T or 1.5T MRI unit (Verio, Siemens, Erlangen, Germany; Discovery MR750W, General Electric Medical System; Signa Excite HD, General Electric Medical System). Verio 3T SWI was performed with the following parameters: repetition time (TR), 28.0 ms; echo time (TE), 20.0 ms; flip angle, 15.0°; slice thickness, 3.0 mm; and intersection gap, 0 mm. Discovery 3T susceptibility weight angiography was performed with the following parameters: TR, 38.1 ms; TE, 23.3 ms; flip angle, 25.0°; slice thickness, 4.0 mm; intersection gap, 0 mm. Signa 1.5T susceptibility weight angiography was performed with the following parameters: TR, 59.1 ms; TE, 6.2 ms; flip angle, 25.0°; slice thickness, 3.0 mm; and intersection gap, 0 mm. Other sequences included diffusion-weighted imaging (3T: TR, 6900.0 ms; TE, 55.0 ms; flip angle, 90.0°; b value, 1000 s/mm2; slice thickness, 3.0 mm; intersection gap, 0.9 mm; 1.5T: TR, 8825.0 ms; TE, 75.5 ms; flip angle, 90.0°; b value, 1000 s/mm2; slice thickness, 3.0 mm; intersection gap, 1.0 mm) and time-of-flight magnetic resonance angiography (3T: TR, 21.0 ms; TE, 3.8 ms; flip angle, 18.0°; slice thickness, 0.8 mm; intersection gap, 0 mm; 1.5T: TR, 23.0 ms; TE, 6.8 ms; flip angle, 20.0°; slice thickness, 1.2 mm; intersection gap, 0 mm).
Image Analysis
SVS Measurement
The SWMRI data were interpreted by 2 investigators (D.-W.K. and D.Y.K.). The intra- and interrater agreements for the measurement of the SVS diameter and length were assessed using the intraclass correlation coefficient (ICC) and its 95% confidence interval (CI). The site of occlusion was defined based on the conventional angiography. In case of tandem occlusion, the intracranial occlusion site was used for evaluation. The SVS was defined as a hypointense signal on SWMRI in the corresponding symptomatic occlusive vessels (Figure 1). In contrast with the conventional definition, the SVS was confirmed to be present even if the SVS diameter was smaller than the diameter of the contralateral artery. The SVS length was measured using a previously described method.8 The in-plane length of the SVS (M1 segment of the middle cerebral arteries) corresponded to the distance between the proximal and distal parts of the SVS (Figure I in the online-only Data Supplement); the length of the SVS perpendicular to the axial acquisition plane (supraclinoid internal carotid artery, anterior cerebral artery, and M2 segment of middle cerebral artery [MCA M2]) was obtained by multiplying the number of cross-sectional locations where the clot was visible by the slice thickness. The SVS diameter was obtained by measuring the largest transverse distance perpendicular to the SVS length. If no hypodense signal was visualized, diameter and length was recorded as zero. The SVS volume was calculated as π×[(SVS diameter)/2]×(SVS length) assuming a cylindrical shape.
Figure 1.

Susceptibility vessel signs (SVS) on susceptibility-weighted magnetic resonance image (SWMRI). Conventional angiography showed left proximal middle cerebral artery (MCA, A), right MCA (B), and left MCA (C) occlusions with various SVS diameters (A, 0 mm; B, 1.7 mm; C, 7.2 mm) on SWMRI.
Thrombolysis in Cerebral Infarction Grading
The thrombolysis in cerebral infarction (TICI) grading was performed by 2 investigators (D.-W.K. and D.Y.K.). The interrater agreement for the TICI grading was assessed using κ statistics and its 95% CI. We also obtained the recanalization time at which the distal flow became visible. TICI was graded as previously described9: grade 0, no perfusion; grade 1, penetration with minimal perfusion; grade 2a, partial filling (2/3) of the entire vascular territory is visible; grade 2b, complete filling of all of the expected vascular territory is visible, but the filling is slower than normal; and grade 3, complete perfusion.
Statistical Analysis
All analyses were performed using the SPSS version 19.0 software package. Continuous variables were compared with the Student t test, whereas categorical variables were compared with the χ2 test. Two multivariable binary logistic regression analyses were performed to determine the independent predictors of the stroke subtype and recanalization status. Variables were selected for entry into the model on the basis of their clinical relevance. Results with 2-tailed P values of <0.05 were considered statistically significant. To determine the SVS diameter cutoff values capable of distinguishing between the groups, receiver-operating characteristics analysis was performed, and the areas under the curve were calculated.
Results
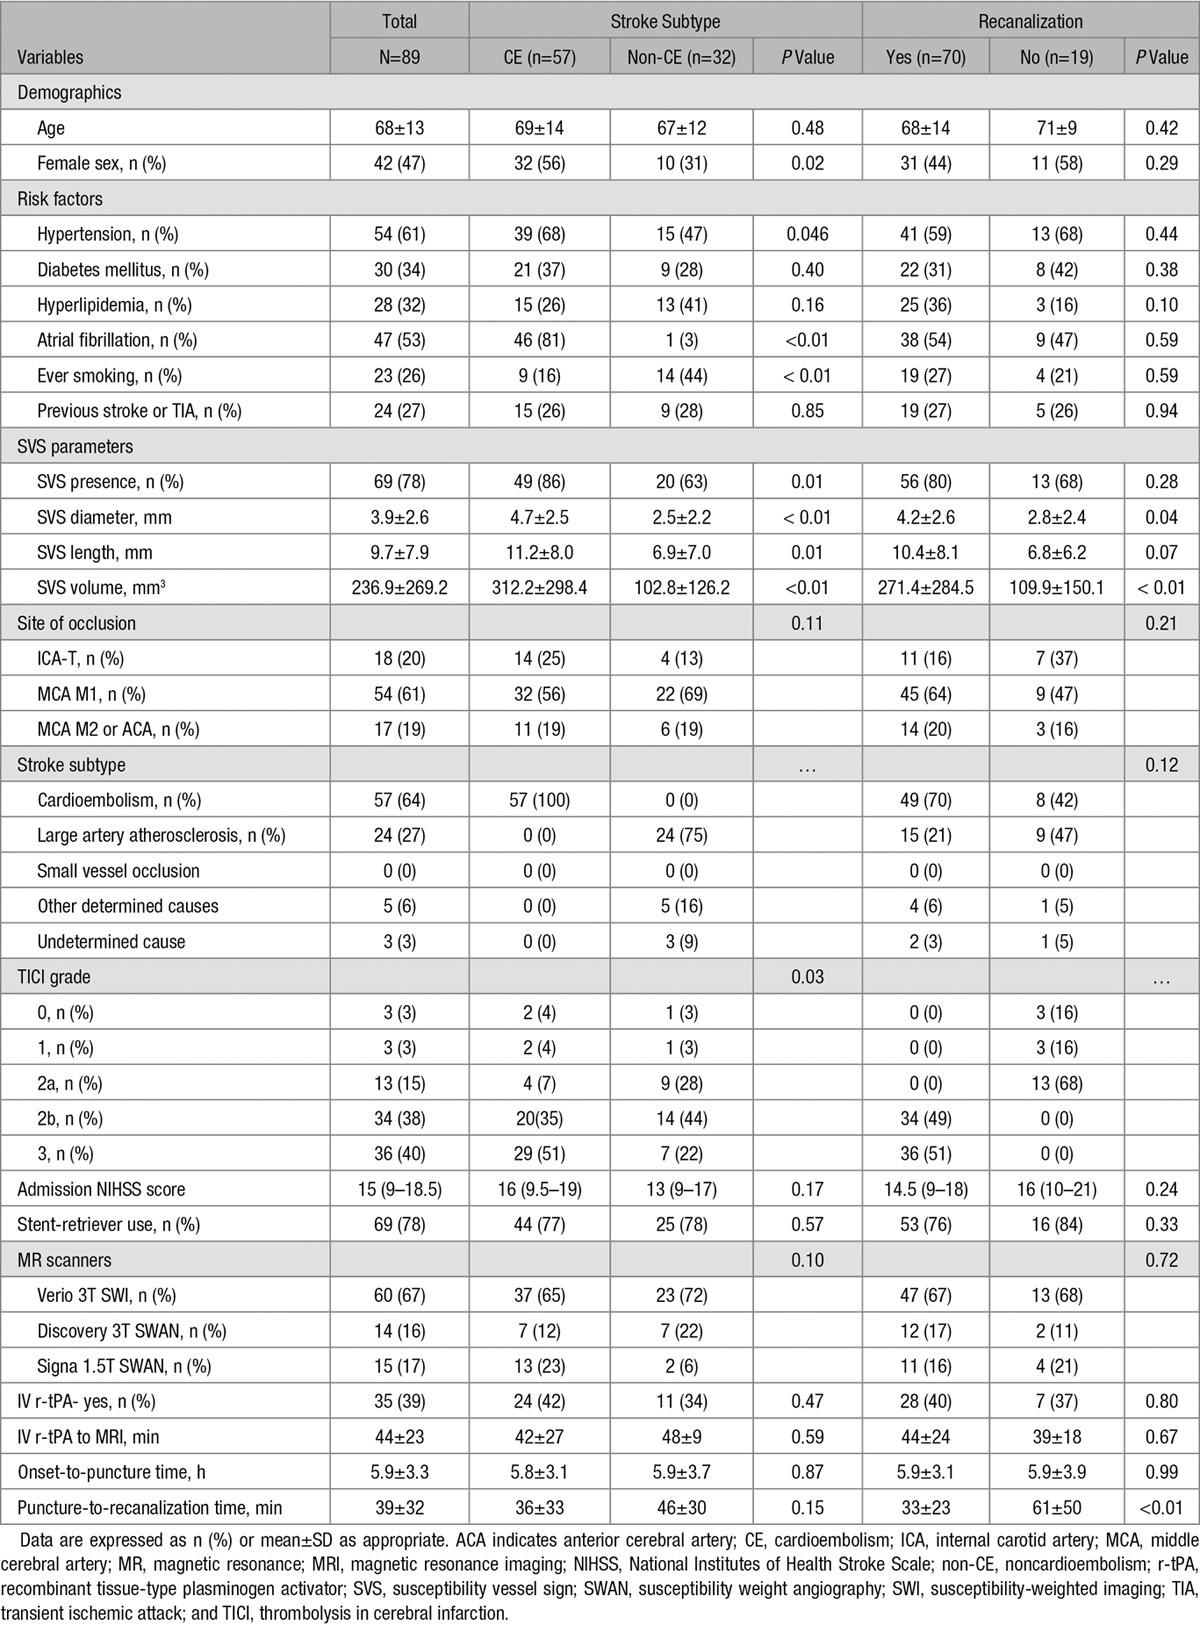
Of the 2247 patients with acute ischemic stroke from February 2010 to June 2015, 144 patients underwent endovascular treatment, 124 patients underwent MRI including SWMRI, and 94 patients had symptomatic occlusion of intracranial arteries of anterior circulation. Four patients were excluded because of poor quality of SWMRI, and 1 patient was excluded because of incomplete endovascular treatment because of poor medical condition. Finally, 89 patients met the eligibility criteria. Baseline characteristics and factors associated with cardioembolic stroke and recanalization status are described in Table 1.
Table 1.
Factors Associated With Cardioembolic Stroke and Recanalization

Of a total of 89 cases, the SVS was visible in 78% of the cases (n=69). Based on the conventional angiography, 18 (20.2%) of terminal internal carotid artery, 54 (60.7%) of M1 segment of middle cerebral artery (MCA M1), and 17 (19.1%) of M2 segment of middle cerebral artery or anterior cerebral artery were occluded. The average SVS length, diameter, and volume were 9.7±7.9 mm, 3.9±2.6 mm, and 236.9±269.2 mm3, respectively. Interrater agreements were excellent for measuring both SVS diameter (ICC=0.88, 95% CI, 0.82–0.92) and length (ICC=0.97, 95% CI, 0.95–0.98). Intra-rater agreements were high as well (ICC for SVS diameter=0.95, 95% CI, 0.91–0.97; ICC for SVS length=0.98, 95% CI, 0.96–0.99). SVS parameters and clinical characteristics were comparable among different magnetic resonance (MR) scanners (Table I in the online-only Data Supplement).
Association Between SVS and Stroke Subtypes
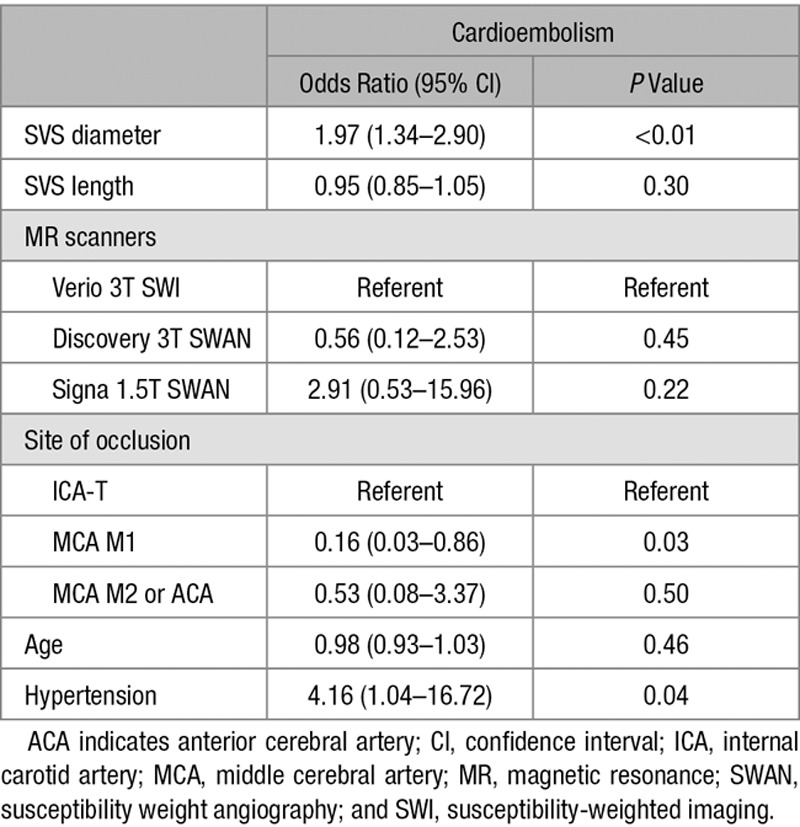
The presence of an SVS was significantly associated with cardioembolic stroke. Of the 57 patients with cardioembolic stroke, 49 patients (86%) had an SVS; on the contrary, of the 32 patients with other subtypes of stroke, only 20 patients (63%) had an SVS (P=0.01). The SVS length (11.2±8.0 versus 6.9±7.0 mm; P=0.01) and diameter (4.7±2.5 versus 2.5±2.2 mm; P<0.01) were larger in patients with cardioembolic stroke than in patients with other stroke subtypes. Other demographic and clinical variables were shown in Table 1. Recanalization with TICI grade ≥2b was achieved in more patients with cardioembolic stroke than in patients with other stroke subtypes (86% versus 66%; P=0.03). Multivariable analysis revealed that the increased SVS diameter was independently associated with cardioembolic stroke after controlling for the effects of age, hypertension, MR scanners, and site of occlusion (Table 2; OR, 1.97; 95% CI, 1.34–2.90; P<0.01). No significant association was shown between SVS length and cardioembolic stroke.
Table 2.
Predictors of Cardioembolic Stroke Based on Multiple Logistic Regression Analysis

Association Between SVS and Recanalization
The interobserver κ score for TICI was 0.84. The SVS diameter (4.2±2.6 versus 2.8±2.4 mm; P=0.04) was larger in the recanalization group than in the nonrecanalization group. Cardioembolic stroke was more common in the recanalization group (70% versus 42%; P=0.03); the prevalence of atrial fibrillation did not differ between patients with and without recanalization (54% versus 47%; P=0.59). Other demographic and clinical variables were not different between groups except puncture-to-recanalization time. There were no differences in onset-to-puncture time.
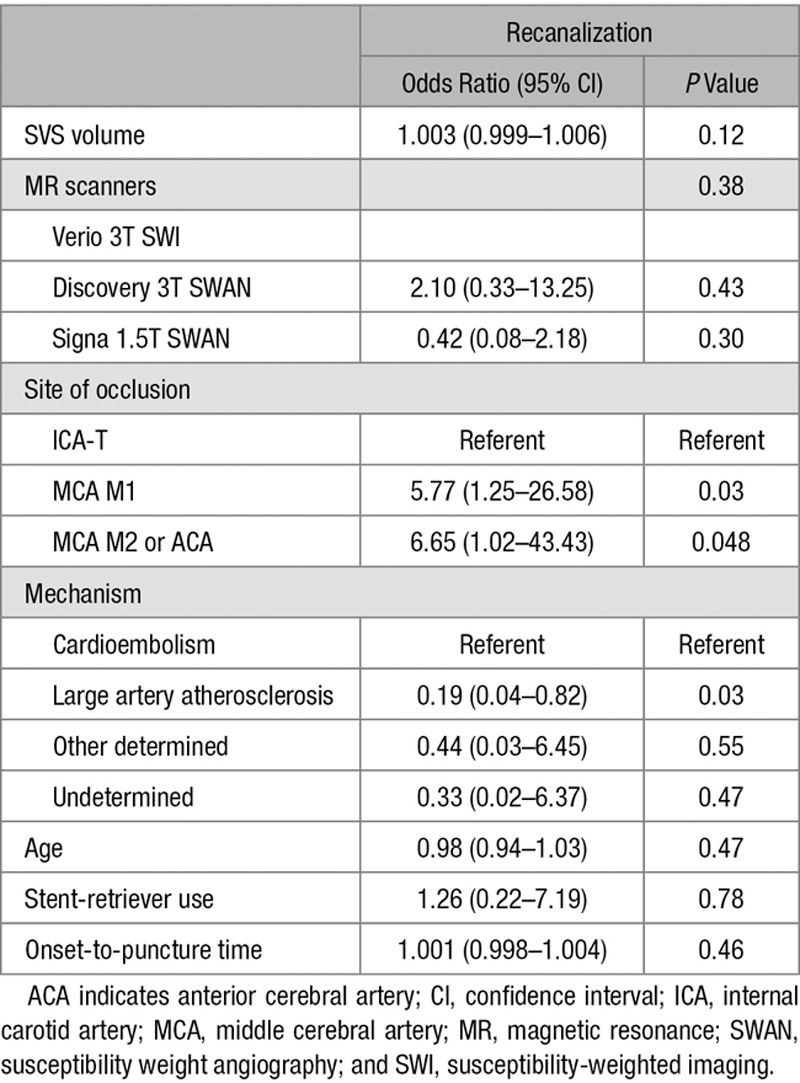
To further quantify the amount of SVS, we calculated SVS volume assuming SVS appearance is cylindrical using the diameter and length. The SVS volume was larger in both the cardioembolic stroke (312.2±298.4 versus 102.8±126.2 mm3; P<0.01) and the recanalization (271.4±284.5 versus 109.9±150.1 mm3; P<0.01) groups, compared with that in the noncardioembolic stroke and nonrecanalization groups, respectively. There was no clear association between the SVS volume and recanalization status (Table 3; OR, 1.003; 95% CI, 0.999–1.006). Among the covariates, large artery atherosclerosis better predicted poor recanalization compared with cardioembolism (OR, 0.19; 95% CI, 0.04–0.82). The MCA M1, MCA M2, or anterior cerebral artery locations were independent predictors of successful recanalization as well (MCA M1: OR, 5.77; 95% CI, 1.25–26.58 and MCA M2 or anterior cerebral artery: OR, 6.65; 95% CI, 1.02–43.43).
Table 3.
Predictors of Recanalization Based on Multiple Logistic Regression Analysis

Cutoff Value of the SVS Diameter for Cardioembolism
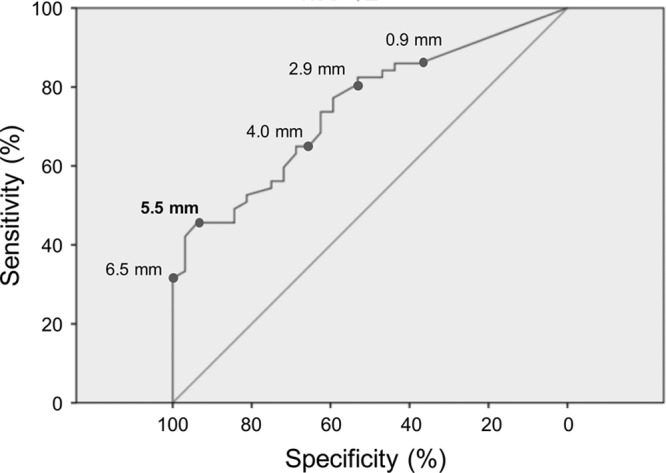
To investigate whether a cutoff value of the SVS diameter with a considerably high sensitivity and specificity did exist, the receiver-operating characteristics analysis was performed. The areas under the curve were 0.75 (95% CI, 0.65–0.85) for cardioembolic stroke (Figure 2). The optimal cutoff value for the SVS diameter to predict cardioembolic stroke was 5.5 mm (sensitivity, 45.6%; specificity, 93.8%). In other words, SVSs larger than 5.5 mm predicted both cardioembolic strokes.
Figure 2.

Receiver-operating characteristics (ROC) analysis. The ROC curve of susceptibility vessel sign diameters for predicting cardioembolic stroke is shown.
Discussion
We found that the increase in the SVS diameter reflected cardioembolic stroke more than the other stroke subtypes. There was no association between the SVS volume and the recanalization status. In addition, a cutoff value of 5.5 mm for the SVS diameter predicted cardioembolism with a high specificity.
Although the SVS has been classically defined as a hypointense signal intensity larger than the diameter of the contralateral vessels,1 we measured smaller hypointense signals as well in this study. The SVS diameter was measured as a continuous variable because SWMRI can visualize small SVS sensitively with clear boundaries compared with GRE.10
Interestingly, SVS of variable diameters and lengths were detected in this study. One possible explanation is that the SVS parameters simply reflect the size of the thrombus. Even in large vessel occlusion such as M1 segment of MCA, if there is underlying significant stenosis, the diameter of SVS can be relatively small. On the contrary, SVS parameters may reflect different characteristics of variable thrombus. If paramagnecity of the clots with same size are different, the SVS parameters may be differently measured because of the difference in susceptibility artifacts.
The association between the SVS parameters and the stroke subtype has been a topic of debate. Although Allibert et al showed that the presence of an SVS in SWI was not associated with cardioembolism,5 Horie et al showed that cardioembolic stroke was more frequently associated with the presence of an SVS in susceptibility weight angiography.11 Our study, which analyzed the SVS quantitatively, showed that the increased SVS diameter was associated with cardioembolic stroke. A recent study analyzing the retrieved clots demonstrated that GRE-SVS was associated with both cardioembolism and RBC-rich clot.12 However, another recent pathological studies of retrieved clots showed that arterioembolic clots had more RBC proportion than cardioembolic clots, which is opposed to the traditional concept of cardioembolic clot being mostly RBC rich.13,14 Thus, correlation analysis between SVS diameter in SWI and pathological findings of retrieved clot is needed to resolve these controversies.
The recanalization rate after endovascular treatment has markedly increased with the use of stent retrievers.15 The high recanalization rate (78.6%) in this study could be one of the reasons because of which the SVS volume was not significantly associated with successful recanalization. A recent study showed that the presence of an SVS predicted favorable clinical outcomes in patients with anterior circulation strokes who underwent endovascular treatment.16 However, SVS was not significantly associated with successful recanalization (81% versus 70% of TICI ≥2b in the SVS-positive and SVS-negative groups, respectively; P=0.34). Soize et al showed that the longer thrombi were associated with poor recanalization using a stent retriever.17 However, the T2*-SVS was defined to be present only when its diameter was larger than the corresponding contralateral arteries. Because smaller SVS was not detected in that study, the results could differ from our findings.
Our findings suggested that the effects of clot volume to recanalization are different in endovascular and r-tPA treatments. There are several studies about the association between SVS and IV r-tPA treatment. Legrand et al18 reported that higher clot burden on T2*-MRI was associated with lower 24-hour recanalization rate in anterior circulation strokes treated with IV thrombolysis ≤4.5 hours from the onset of symptoms. This result might be because of the poor diffusion of r-tPA from the end of the clot in large clots. Yan et al19 showed that the SVS width on SWI might reflect the content of hemosiderin, and extremely overestimated SVSs were resistant to IV r-tPA because the authors assumed that they reflect aged thrombi.
A few points may require further clarification. First, the MRI was not performed in the same scanner, although clinical and imaging findings according to the MR scanners were comparable. Second, histopathologic analysis of the thrombi was not available in this study. Third, inherent measurement error can exist because of the blooming effect of SWI despite good intra- and interrater agreements. Fourth, the multivariable model might not have been fully adjusted for all potential confounders because of small sample size.
In conclusion, we demonstrated that a large SVS diameter was more suggestive of cardioembolic stroke. Our study suggests that the SVS volume was not associated with successful recanalization in endovascular treatment.
Sources of Funding
This research was supported by a grant of the Korea Health Technology R&D Project through the Korea Health Industry Development Institute, funded by the Ministry of Health & Welfare, Republic of Korea (grant number: HI14C0211), and also supported by Basic Science Research Program through the National Research Foundation of Korea (NRF) funded by the Ministry of Science, ICT & Future Planning (NRF-2015R1A2A2A01007770).
Disclosures
None.
Supplementary Material
Footnotes
Drs Kang and Jeong contributed equally.
The online-only Data Supplement is available with this article at http://stroke.ahajournals.org/lookup/suppl/doi:10.1161/STROKEAHA.116.016217/-/DC1.
References
- 1.Flacke S, Urbach H, Keller E, Träber F, Hartmann A, Textor J, et al. Middle cerebral artery (MCA) susceptibility sign at susceptibility-based perfusion MR imaging: clinical importance and comparison with hyperdense MCA sign at CT. Radiology. 2000;215:476–482. doi: 10.1148/radiology.215.2.r00ma09476. doi: 10.1148/radiology.215.2.r00ma09476. [DOI] [PubMed] [Google Scholar]
- 2.Liebeskind DS, Sanossian N, Yong WH, Starkman S, Tsang MP, Moya AL, et al. CT and MRI early vessel signs reflect clot composition in acute stroke. Stroke. 2011;42:1237–1243. doi: 10.1161/STROKEAHA.110.605576. doi: 10.1161/STROKEAHA.110.605576. [DOI] [PMC free article] [PubMed] [Google Scholar]
- 3.Cho KH, Kim JS, Kwon SU, Cho AH, Kang DW. Significance of susceptibility vessel sign on T2*-weighted gradient echo imaging for identification of stroke subtypes. Stroke. 2005;36:2379–2383. doi: 10.1161/01.STR.0000185932.73486.7a. doi: 10.1161/01.STR.0000185932.73486.7a. [DOI] [PubMed] [Google Scholar]
- 4.Rodrigues FB, Neves JB, Caldeira D, Ferro JM, Ferreira JJ, Costa J. Endovascular treatment versus medical care alone for ischaemic stroke: systematic review and meta-analysis. BMJ. 2016;353:i1754. doi: 10.1136/bmj.i1754. [DOI] [PMC free article] [PubMed] [Google Scholar]
- 5.Allibert R, Billon Grand C, Vuillier F, Cattin F, Muzard E, Biondi A, et al. Advantages of susceptibility-weighted magnetic resonance sequences in the visualization of intravascular thrombi in acute ischemic stroke. Int J Stroke. 2014;9:980–984. doi: 10.1111/ijs.12373. doi: 10.1111/ijs.12373. [DOI] [PubMed] [Google Scholar]
- 6.Adams HP, Jr, Bendixen BH, Kappelle LJ, Biller J, Love BB, Gordon DL, et al. Classification of subtype of acute ischemic stroke. Definitions for use in a multicenter clinical trial. TOAST. Trial of Org 10172 in Acute Stroke Treatment. Stroke. 1993;24:35–41. doi: 10.1161/01.str.24.1.35. [DOI] [PubMed] [Google Scholar]
- 7.Jauch EC, Saver JL, Adams HP, Jr, Bruno A, Connors JJ, Demaerschalk BM, et al. American Heart Association Stroke Council; Council on Cardiovascular Nursing; Council on Peripheral Vascular Disease; Council on Clinical Cardiology. Guidelines for the early management of patients with acute ischemic stroke: a guideline for healthcare professionals from the American Heart Association/American Stroke Association. Stroke. 2013;44:870–947. doi: 10.1161/STR.0b013e318284056a. doi: 10.1161/STR.0b013e318284056a. [DOI] [PubMed] [Google Scholar]
- 8.Naggara O, Raymond J, Domingo Ayllon M, Al-Shareef F, Touzé E, Chenoufi M, et al. T2* “susceptibility vessel sign” demonstrates clot location and length in acute ischemic stroke. PLoS One. 2013;8:e76727. doi: 10.1371/journal.pone.0076727. doi: 10.1371/journal.pone.0076727. [DOI] [PMC free article] [PubMed] [Google Scholar]
- 9.Higashida RT, Furlan AJ, Roberts H, Tomsick T, Connors B, Barr J, et al. Technology Assessment Committee of the American Society of Interventional and Therapeutic Neuroradiology; Technology Assessment Committee of the Society of Interventional Radiology. Trial design and reporting standards for intra-arterial cerebral thrombolysis for acute ischemic stroke. Stroke. 2003;34:e109–e137. doi: 10.1161/01.STR.0000082721.62796.09. doi: 10.1161/01.STR.0000082721.62796.09. [DOI] [PubMed] [Google Scholar]
- 10.de Souza JM, Domingues RC, Cruz LC, Jr, Domingues FS, Iasbeck T, Gasparetto EL. Susceptibility-weighted imaging for the evaluation of patients with familial cerebral cavernous malformations: a comparison with t2-weighted fast spin-echo and gradient-echo sequences. AJNR Am J Neuroradiol. 2008;29:154–158. doi: 10.3174/ajnr.A0748. doi: 10.3174/ajnr.A0748. [DOI] [PMC free article] [PubMed] [Google Scholar]
- 11.Horie N, Tateishi Y, Morikawa M, Morofuji Y, Hayashi K, Izumo T, et al. Acute stroke with major intracranial vessel occlusion: characteristics of cardioembolism and atherosclerosis-related in situ stenosis/occlusion. J Clin Neurosci. 2016;32:24–29. doi: 10.1016/j.jocn.2015.12.043. doi: 10.1016/j.jocn.2015.12.043. [DOI] [PubMed] [Google Scholar]
- 12.Kim SK, Yoon W, Kim TS, Kim HS, Heo TW, Park MS. Histologic analysis of retrieved clots in acute ischemic stroke: correlation with stroke etiology and gradient- echo MRI. AJNR Am J Neuroradiol. 2015;36:1756–1762. doi: 10.3174/ajnr.A4402. doi: 10.3174/ajnr.A4402. [DOI] [PMC free article] [PubMed] [Google Scholar]
- 13.Boeckh-Behrens T, Kleine JF, Zimmer C, Neff F, Scheipl F, Pelisek J, et al. Thrombus histology suggests cardioembolic cause in cryptogenic stroke. Stroke. 2016;47:1864–1871. doi: 10.1161/STROKEAHA.116.013105. doi: 10.1161/STROKEAHA.116.013105. [DOI] [PubMed] [Google Scholar]
- 14.Niesten JM, van der Schaaf IC, van Dam L, Vink A, Vos JA, Schonewille WJ, et al. Histopathologic composition of cerebral thrombi of acute stroke patients is correlated with stroke subtype and thrombus attenuation. PLoS One. 2014;9:e88882. doi: 10.1371/journal.pone.0088882. doi: 10.1371/journal.pone.0088882. [DOI] [PMC free article] [PubMed] [Google Scholar]
- 15.Widimsky P, Hopkins LN. Catheter-based interventions for acute ischaemic stroke. Eur Heart J. 2016;37:3081–3089. doi: 10.1093/eurheartj/ehv521. doi: 10.1093/eurheartj/ehv521. [DOI] [PMC free article] [PubMed] [Google Scholar]
- 16.Bourcier R, Volpi S, Guyomarch B, Daumas-Duport B, Lintia-Gaultier A, Papagiannaki C, et al. Susceptibility vessel sign on MRI predicts favorable clinical outcome in patients with anterior circulation acute stroke treated with mechanical thrombectomy. AJNR Am J Neuroradiol. 2015;36:2346–2353. doi: 10.3174/ajnr.A4483. doi: 10.3174/ajnr.A4483. [DOI] [PMC free article] [PubMed] [Google Scholar]
- 17.Soize S, Batista AL, Rodriguez Regent C, Trystram D, Tisserand M, Turc G, et al. Susceptibility vessel sign on T2* magnetic resonance imaging and recanalization results of mechanical thrombectomy with stent retrievers: a multicentre cohort study. Eur J Neurol. 2015;22:967–972. doi: 10.1111/ene.12693. doi: 10.1111/ene.12693. [DOI] [PubMed] [Google Scholar]
- 18.Legrand L, Naggara O, Turc G, Mellerio C, Roca P, Calvet D, et al. Clot burden score on admission T2*-MRI predicts recanalization in acute stroke. Stroke. 2013;44:1878–1884. doi: 10.1161/STROKEAHA.113.001026. doi: 10.1161/STROKEAHA.113.001026. [DOI] [PubMed] [Google Scholar]
- 19.Yan S, Chen Q, Zhang X, Xu M, Han Q, Shao A, et al. Extensive blooming artifact predicts no recanalization after intravenous thrombolysis. Eur J Neurol. 2016;23:737–743. doi: 10.1111/ene.12930. doi: 10.1111/ene.12930. [DOI] [PubMed] [Google Scholar]


