

Abstract
Objective
S-Adenosylmethionine (SAMe) is a major methyl donor in the brain and is also an antidepressant with few reported side effects; however, SAMe is relatively expensive and unstable. Brain SAMe can be increased by giving methionine to rats, raising the possibility that methionine may be an antidepressant. We aimed to study whether SAMe and methionine, when given orally to rats, could raise levels of SAMe in the central nervous system (CNS). We also aimed to test the relative abilities of SAMe and methionine to increase tail-flick latency after a thermal stimulus. This test was used to measure changes in CNS function.
Methods
Rats were given SAMe and methionine orally at various doses, and biochemical and behavioural testing was carried out at intervals up to 6 hours later.
Results
Methionine raised SAMe levels in various regions of the CNS and increased tail-flick latency, both at lower doses than SAMe.
Conclusion
Methionine should be tested for antidepressant properties in humans.
Medical subject headings: antidepressive agents; methionine; models, animal; S-adenosylmethionine
Abstract
Objectif
La S-Adénosylméthionine (SAMe) est un important donneur de méthyle dans le cerveau. C'est aussi un antidépresseur qui a peu d'effets secondaires signalés. La SAMe est toutefois relativement coûteuse et instable. Il est possible de hausser la concentration de SAMe dans le cerveau en administrant de la méthionine aux rats, ce qui indique que la méthionine pourrait être un antidépresseur. Nous voulions déterminer si la SAMe et la méthionine administrées oralement à des rats pourraient hausser la concentration de SAMe dans le système nerveux central (SNC). Nous voulions aussi vérifier la capacité relative de la SAMe et de la méthionine d'accroÎtre la latence du retrait de la queue après un stimulus thermique. Nous avons utilisé ce test pour mesurer les changement du fonctionnement du SNC.
Méthodes
On a administré à des rats diverses doses de SAMe et de méthionine par voie orale et procédé par la suite à des tests biochimiques et comportementaux à des intervalles pouvant atteindre six heures.
Résultats
La méthionine a haussé les concentrations de SAMe dans diverses régions du SNC et accru la latence du retrait de la queue, à des doses plus faibles que la SAMe dans les deux cas. Conclusion : Il faudrait tester les caractéristiques d'antidépresseur de la méthionine chez les êtres humains.
Introduction
S-Adenosylmethionine (SAMe) is an antidepressant. At least 10 placebo-controlled studies have demonstrated this, with few side effects reported.1,2 SAMe is used as an antidepressant in some European countries (e.g., Italy). SAMe is available over the counter, as a dietary supplement, in the United States. In Canada, it is regulated as a drug and is not currently available. SAMe is relatively expensive, and its instability when exposed to oxygen raises doubts about the actual composition of some preparations.3 Nonetheless, its antidepressant efficacy is of theoretical interest, given that it is a major methyl donor. SAMe donates methyl groups to a variety of compounds yielding S-adenosylhomocysteine (SAH). Administration of SAMe increases cerebrospinal fluid (CSF) 5-hydroxyindoleacetic acid (5-HIAA) in humans4 and brain serotonin in rats,5,6 although the mechanism of this connection between SAMe and serotonin is unknown. SAMe has a variety of other effects, such as methylation of phospholipids (with potential effects on membrane fluidity and receptor function)7,8,9 and methylation of proteins and nucleoproteins.10 A recent review mentioned over 35 methylation reactions involving SAMe,2 so there are other potential mechanisms that may contribute to the effects of SAMe, in addition to its effects on serotonin. Low levels of CSF SAMe were found in depressed patients in 2 studies,2,11 whereas a third study found levels that were lower than in healthy individuals but not significantly so.12
One unanswered question about SAMe is how it gets into the brain when used clinically. There is no known mechanism to transport SAMe into the brain. The brain synthesizes SAMe from methionine, which is transported into the brain by the active transport system that is active toward all large neutral amino acids.13,14 Administration of methionine increases rat brain SAMe,15 presumably because methionine adenosyltransferase, the enzyme that produces SAMe from methionine, is not normally fully saturated with methionine. The purpose of the present study was to compare the ability of SAMe and methionine, when given orally to rats, to increase the brain level of SAMe.
Because preliminary results showed that administration of SAMe increases tail-flick latency after a thermal stimulus, this measure was used as a simple test of altered central nervous system (CNS) function after administration of the compounds. We wanted to see whether SAMe and methionine would alter tail-flick latency in a similar fashion. We used tail-flick latency rather than an animal model of antidepressant action for several reasons. First, all animal tests of antidepressant action have limitations. Second, most animal tests of antidepressant effect have been used with classic antidepressants. An antidepressant such as SAMe, which may act in a very different way from classic antidepressants, would not necessarily have the same effect as a classic antidepressant. Third, the tail-flick test is minimally intrusive for the animal, unlike most tests of antidepressant action.
Methods
Male Long–Evans rats, obtained from Charles River Canada (St. Constant, Que.), were housed in groups of 4 per cage in a room with a 12-hour light/dark cycle and with free access to food and water. The animals weighed 150–175 g at the time of testing. S-Adenosylmethionine and L-methionine (Sigma Chemicals, St. Louis, Mo.) were dissolved immediately before use in distilled water. Rats were given S-adenosylmethionine (0–400 mg/kg), methionine (0–100 mg/kg) or water orally by gavage at a volume of 1 mL/kg body weight during the light part of the cycle. In all experiments, all the animals were gavaged at the same time early in the light part of the light/dark cycle. The compounds were given orally because this is the method of administration when SAMe is given as an antidepressant. The studies were carried out in accordance with the regulations of the Canadian Council on Animal Care.
The apparatus used to present thermal stimulation of the tail and automatically record the tail-flick latencies of the rats was obtained from Omnitech Electronics (Columbus, Ohio). Rats were habituated to the laboratory environment by being brought to the laboratory, weighed and held for 1–2 minutes for 3 days before an experiment. During testing, the animals were placed on a platform so that a portion of their tail was placed over a V-shaped groove under which there was a heat source. The animals were restrained in a towel with their tail protruding for the period of the test. A switch on the apparatus turned on a light source and the heat source and activated a timer. The time it took for the rat to move its tail away from the heat source (the tail-flick latency) was measured automatically. Movement of the tail allowed the light beam to reach a detector that automatically stopped the clock and turned off the heat source. The intensity of the heat source was adjusted to produce a baseline response time of 7–9 seconds. To prevent tissue injury, a cutoff time of 18 seconds was chosen. Results for each animal were the median of 3 trials.
SAMe and SAH were measured by high-performance liquid chromatography with absorbance detection16 using a Waters (Milford, Mass.) Nova-Pak C18 column (300 mm х3.9 mm inner diameter). The mobile phase consisted of 40 mmol/L ammonium dihydrogenphosphate, 6 mmol/L heptanesulfonic acid sodium salt monohydrate and 6% (volume [of solute] per volume [of solvent]) methanol. The pH was adjusted to 4.2 by the addition of hydrochloric acid. The flow rate was set at 0.8 mL/min and the detector was set at 254 nm. The chromatograms were similar to those described by Guattari.16 SAH was measured in addition to SAMe for comparison. Measurements were made in CNS areas and also the liver and blood. The CNS areas, namely, brain stem, cerebellum, rest of brain and spinal cord, were chosen because they were of sufficient size to ensure that they contained sufficient SAMe for accurate measurement.
Tissues were homogenized in 4 volumes (volume/wet weight) of 0.4 mol/L perchloric acid (containing 0.1% [weight/volume] ethylenediamine tetra-acetate and 0.1% [weight/volume] sodium metabisulfite to prevent oxidation of the compounds being measured) with a Polytron Sonicator (Branson Sonic Power, Danbury, Conn.). Samples were then centrifuged at 10 000g for 20 minutes at 4°C, filtered through a 0.2-μm membrane, and injected into the chromatograph. Blood was collected in a tube containing 50 μL of 25% weight/volume heparin (Sigma Chemicals) and mixed with 25% of its volume of perchloric acid.
In experiments looking at changes over time, data were analyzed using a condition (control or active treatment) by time analysis of variance (ANOVA). Individual time points were compared using t tests. For dose–response experiments a 1-way ANOVA was used, and the effects of different doses were compared using Scheffé tests. Results were considered statistically significant with p < 0.05.
Results
Initially, a dose of SAMe that was known to raise brain SAMe levels (200 mg/kg)17 was tested for its time course of action on tail-flick latency, in order to see how quickly SAMe administration may alter CNS function (Fig. 1). Similarly, a dose of methionine that was known to raise brain SAMe (50 mg/kg)15 was tested (Fig. 1). Whereas SAMe increased tail-flick latency within 1.5 hours, the effect of methionine was not apparent until 4 hours. A group х time repeated-measures ANOVA revealed a significant main effect of SAMe (F1,42 = 9.8, p = 0.007). The t-test results at the individual time points indicated that SAMe increased the tail-flick latency at 1.5 hours (t = 3.5, p = 0.003) and 3 hours (t = 2.9, p = 0.013). ANOVA after methionine administration revealed a significant time х treatment interaction (F3,42 = 16, p < 0.001). The t-test results at the individual time points indicated that methionine increased the tail-flick latency at 4 hours (t = 4.2, p < 0.001) and 6 hours (t = 3.4, p = 0.004).
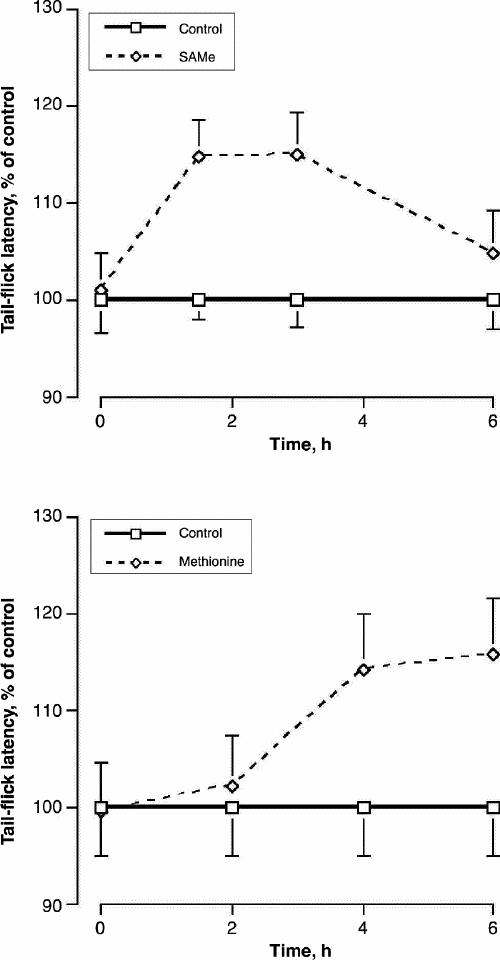
Fig. 1: The effect of S-adenosylmethionine (SAMe) (upper panel) and methionine (lower panel) on the time course of tail-flick latency. Rats were given SAMe (200 mg/kg) or methionine (50 mg/kg) orally. Values are given as mean of 8 (and standard error of the mean [SE]). As tail-flick latency tended to vary throughout the day, values are expressed as a percentage of control values at each time.
Next, we studied the effect of the administration of SAMe and methionine on metabolism in brain regions, liver and blood. Different doses of SAMe were given to the rats, and SAMe and SAH levels in regions of the CNS, liver and blood were measured after 2 hours (Table 1). This time was chosen because the time course of tail-flick latency suggested that 2 hours is within the time range that SAMe has its greatest effect on latency. For the same reason, a dose–response study was performed with methionine, and SAMe and SAH were measured after 4 hours (Table 2). SAMe administration increased liver SAMe by up to 49% and blood SAMe by as much as 38%; however, there were fewer changes in the CNS. The changes in cerebellum and spinal cord were not statistically significant. In the brain stem the 400-mg/kg dose increased SAMe levels by 26%, and in the rest of the brain the maximum increase was 12%. SAH levels were, in general, unchanged. ANOVA revealed significant effects for SAH in the cerebellum (F3,22 = 7.6, p = 0.001) and for SAMe in the brain stem (F3,22 = 12, p < 0.001), rest of brain (F3,22 = 6.6, p = 0.002), liver (F3,22 = 7.2, p = 0.002) and blood (F3,22 = 10, p < 0.001).
Table 1
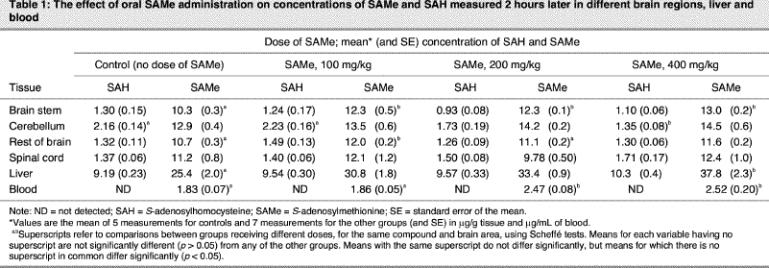
Table 2
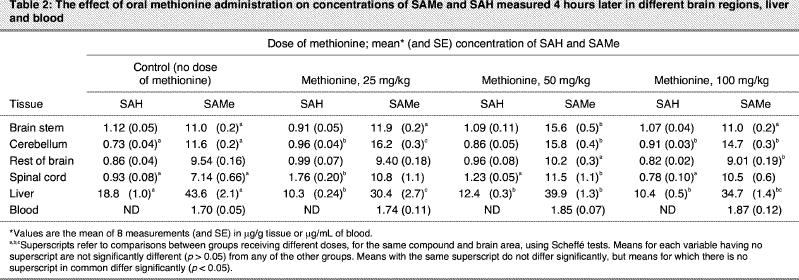
Methionine administration caused a modest decrease in liver SAMe and SAH levels and did not alter blood SAMe. However, methionine, compared with SAMe, tended to cause larger changes in the CNS at lower doses. Whereas the rest of the brain showed no significant increase, SAMe levels increased by a maximum of 42% in the brain stem, 40% in the cerebellum and 61% in the spinal cord. For all 3 of these brain parts, the increase was greater with the 50-mg/kg dose of methionine than at 100 mg/kg. For the brain stem, the value had returned to the same level as in controls at 100 mg/kg. Methionine caused significant increases in SAH levels in the cerebellum and spinal cord. In the spinal cord, the greatest increase was at 25 mg/kg, with no change from control values at 100 mg/kg. ANOVA revealed significant effects for SAH in the cerebellum (F3,28 = 5.5, p = 0.004), spinal cord and liver, and for SAMe in the brain stem (F3,28 = 46, p < 0.001), cerebellum (F3,28 = 5.5, p = 0.004), rest of brain (F3,28 = 5.3, p = 0.005), spinal cord (F3,28 = 4.2, p = 0.016) and liver (F3,28 = 8.8, p < 0.001).
In a dose–response study of the effects of the administration of SAMe and methionine on tail-flick latency, measurements were made at the same time as in the biochemical study (Fig. 2). Both compounds caused significant increases in tail-flick latency; however, although SAMe administration increased tail-flick latency at all 3 doses, after administration of methionine latency returned to control values at the highest dose. ANOVA revealed a significant effect of SAMe (F3,36 = 3.8, p = 0.018) and methionine (F3,36 = 2.9, p = 0.046). Scheffé tests revealed a significant difference between controls and 400 mg/kg SAMe (p < 0.05) and between 100 mg/kg and 400 mg/kg SAMe (p < 0.05). In the methionine study, the control and the 50 mg/kg group differed significantly (p < 0.05).
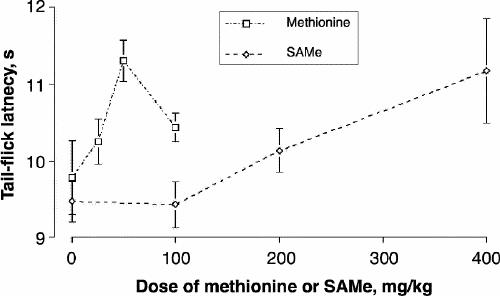
Fig. 2: The effect of different doses of SAMe and methionine on tail-flick latency. Rats were given the compounds orally. Values are the mean of 10 (and SE).
Discussion
This study demonstrated that SAMe can get into the brain after oral administration; however, the extent to which it penetrates the blood–brain barrier is limited. The increase in any area of the CNS was less than the increase in liver and blood, and the changes in cerebellum and spinal cord were not significant. On the other hand, methionine caused larger increases in brain SAMe at lower doses.
It remains unclear how SAMe gets into the brain. The time course of tail-flick latency suggests that SAMe administration alters brain SAMe levels, with subsequent changes in brain biochemistry caused by elevated SAMe levels, more quickly than methionine administration. This rules out the possibility that SAMe is converted into methionine in the liver and that the methionine is transported into the brain where it is converted back into SAMe. Presumably SAMe diffuses across the blood–brain barrier, although we can not rule out the possibility of a low-capacity transporter. Our results are consistent with the finding that radioactive SAMe passes from blood to brain much more poorly than methionine.18 Methionine is transported into the brain by a transport system that is active toward all large neutral amino acids.13,14 As some of the large neutral amino acids are essential amino acids and all cells need amino acids for protein synthesis, the transporter is active in all regions of the CNS. The fact that methionine did not increase blood SAMe indicates that methionine increased local synthesis of SAMe in the CNS, rather than increasing synthesis of SAMe peripherally, with subsequent movement of SAMe from the periphery to the CNS. Presumably, the differences in the increase in SAMe levels in different regions of the CNS after methionine administration reflect regional differences in methionine metabolism. The most likely possibility involves differences in the activity of methionine adenosyltransferase, the enzyme that converts methionine to SAMe.
Data from both the biochemical and tail-flick studies suggest that there is an optimum dose of methionine and that above this dose there is a decrease in the synthesis of SAMe. The most likely explanation for this is substrate inhibition by methionine of methionine adenosyltransferase. This would also explain why even the lowest dose of methionine lowered liver SAMe levels. After oral administration, methionine is absorbed from the gastrointestinal tract and then passes though the liver before entering the general circulation. Therefore, at any given dose of methionine, the increase in liver methionine levels would be expected to be greater than levels in the brain. Thus, inhibition of SAMe synthesis would be expected to occur at lower doses of methionine in the liver than in the brain.
Given that methionine is more efficient than SAMe at raising brain SAMe levels, this raises the possibility that methionine, like SAMe, may be an antidepressant. The psychopharmacologic effects of methionine have been studied, but only in patients with schizophrenia. The results of the 10 studies reviewed by Cohen et al19 indicate that administration of methionine, usually in combination with a monoamine oxidase inhibitor, produced psychosis in 62 of 107 patients with chronic schizophrenia. In these studies, daily doses of L- or DL-methionine ranged from 2 g to 40 g and were given for periods of 1 week to 2 months. However, there are no reports of the effect of methionine on patients with mood disorders.
When SAMe is given as an antidepressant, the usual dose is in the range 0.5–1 g per day.1,2 As methionine has a molecular weight less than half that of SAMe, even lower doses of methionine may have effects. The daily requirement for methionine in adult humans is about 13 mg/kg per day, although about 30% of the human adult requirement of methionine can be replaced by cysteine.20 For a healthy adult, the requirement of methionine is about 0.5 g, given adequate intake of cysteine, and normal intakes are probably higher than this. Therefore, if methionine were tested for antidepressant action at a dose of 1 g per day, this would be unlikely to be much more than double the normal daily intake and thus would be considerably lower than doses found to have adverse effects in patients with schizophrenia. This dose would also be well below the dose we found to inhibit SAMe synthesis in the rat brain.
Our study suggests that modest doses of methionine can increase brain SAMe levels and alter CNS function in rats. Methionine may be a cheaper and more stable alternative to the use of SAMe.
Acknowledgments
This work was funded by a grant from the Canadian Institutes of Health Research.
Footnotes
Competing interests: None declared.
Correspondence to: Dr. Simon N. Young, Department of Psychiatry, McGill University, 1033 Pine Ave. W, Montréal QC H3A 1A1; fax 514 398-4370; simon.young@mcgill.ca
Submitted Nov. 26, 2002; Revised Jan. 20, 2004; Feb. 18, 2004; Accepted Feb. 27, 2004
References
- 1.Bressa GM. S-Adenosyl-L-methionine (SAMe) as antidepressant: meta-analysis of clinical studies. Acta Neurol Scand 1994;89:7-14. [DOI] [PubMed]
- 2.Bottiglieri T, Hyland K. S-Adenosylmethionine levels in psychiatric and neurological disorders: a review. Acta Neurol Scand 1994; 89:19-26. [DOI] [PubMed]
- 3.Revelle LK, Davignon DA, Reepmeyer JC, Zerfing RC. Stability- indicating proton nuclear magnetic resonance spectroscopic method for determination of S-adenosyl-L-methionine in tablets. J AOAC Int 1995;78:353-8. [PubMed]
- 4.Bottiglieri T, Laundy M, Martin R, Carney MWP, Nissenbaum H, Toone BK, et al. S-Adenosylmethionine influences monoamine metabolism. Lancet 1984;ii:224. [DOI] [PubMed]
- 5.Curcio M, Catto E, Stramentinoli G, Algeri S. Effect of S-adenosyl-L-methionine on serotonin metabolism in rat brain. Prog Neuropsychopharmacol Biol Psychiatry 1978;2:65-71. [DOI] [PubMed]
- 6.Fonlupt P, Barailler J, Roche M, Cronenberger L, Pacheco H. Effets de la S-adénosylméthionine et de la S-adénosylhomocystéine sur la synthèse, in vivo, de la noradrénaline et de la sérotonine dans différentes parties du cerveau de rat. C R Seances Acad Sci D 1979; 288: 283-6. [PubMed]
- 7.Hirata F, Axelrod J. Phospholipid methylation and biological signal transmission. Science 1980;209:1082-90. [DOI] [PubMed]
- 8.Crews FT, Hirata F, Axelrod J. Identification and properties of methyltransferases that synthesize phosphatidylcholine in rat brain synaptosomes. J Neurochem 1980;34:1491-8. [DOI] [PubMed]
- 9.Cimino M, Vantini G, Algeri S, Curatola G, Pezzoli C, Stramentinoli G. Age-related modification of dopaminergic and β-adrenergic receptor system: restoration to normal activity by modifying membrane fluidity with S-adenosylmethionine. Life Sci 1984; 34:2029-39. [DOI] [PubMed]
- 10.Reynolds EH, Stramentinoli G. Folic acid, S-adenosylmethionine and affective disorders. Psychol Med 1983;13:705-10. [DOI] [PubMed]
- 11.Bottiglieri T, Godfrey P, Flynn T, Carney MWP, Toone BK, Reynolds EH. Cerebrospinal fluid S-adenosylmethionine in depression and dementia: effects of treatment with parenteral and oral S-adenosylmethionine. J Neurol Neurosurg Psychiatry 1990; 53: 1096-8. [DOI] [PMC free article] [PubMed]
- 12.Bottiglieri T, Laundy M, Crellin R, Toone BK, Carney MWP, Reynolds EH. Homocysteine, folate, methylation, and monoamine metabolism in depression. J Neurol Neurosurg Psychiatry 2000; 69: 228-32. [DOI] [PMC free article] [PubMed]
- 13.Oldendorf WH, Szabo J. Amino acid assignment to one of three blood-brain barrier amino acid carriers. Am J Physiol 1976;230:94-8. [DOI] [PubMed]
- 14.Pardridge WM. Blood-brain barrier transport of nutrients. Nutr Rev 1986;44 Suppl:15-25. [DOI] [PubMed]
- 15.Rubin RA, Ordonez LA, Wurtman RJ. Physiological dependence of brain methionine and S-adenosylmethionine concentrations on serum amino acid pattern. J Neurochem 1974;23:227-31. [DOI] [PubMed]
- 16.Guattari B. High-performance liquid chromatographic determination with ultraviolet detection, of S-adenosyl-L-methionine and S-adenosyl-L-homocysteine in rat tissues and simultaneously of normetanephrine and metanephrine for phenylethanolamine-N-methyltransferase or catechol-O-methyltransferase activities. J Chromatogr 1991;567:254-60. [DOI] [PubMed]
- 17.Stramentinoli G, Catto E, Algeri S. The increase in S-adenosyl-L-methionine (SAMe) concentration in rat brain after its systemic administration. Commun Psychopharmacol 1977;1:89-97. [PubMed]
- 18.Baldessarini RJ, Kopin IJ. S-Adenosylmethionine in brain and other tissues. J Neurochem 1966;13:769-77. [DOI] [PubMed]
- 19.Cohen SM, Nichols A, Wyatt R, Pollin W. The administration of methionine to chronic schizophrenic patients: a review of ten studies. Biol Psychiatry 1974;8:209-25. [PubMed]
- 20.National Research Council. Recommended dietary allowances. 10th ed. Washington: National Academy Press; 1989. [PubMed]