Abstract
An experiment designed to collect a saturation transfer double difference (STDD) NMR spectrum using a solenoid microcoil NMR difference probe is reported. STDD-NMR allows the investigation of ligand-biomolecule binding, with moderate concentration requirements for unlabeled molecular targets and the ability to discern binding events in the presence of non-binding ligands. The NMR difference probe acquires the signals from two different samples at once, and cancels common signals automatically through a mechanism of switching between parallel excitation and serial acquisition of the sample signals. STDD spectra were acquired on a system consisting of human serum albumin and two ligands, octanoic acid and glucose. The non-binding ligand, glucose, was cancelled internally through phase cycling, while the protein signal was subtracted automatically by the difference probe. The proton NMR resonance signal from octanoic acid remained in the double difference spectrum. This work demonstrates that the double difference can be performed both internally and automatically through the utilization of the solenoid microcoil NMR difference probe and STDD-NMR pulse sequence, resulting in a clean signal from the binding ligand with good protein background subtraction and an overall favorable result when compared to the conventional approach.
Keywords: NMR, 1H, saturation transfer difference, protein, ligand binding, microcoil probe, nonmagnetic diodes
Introduction
NMR-based protein–ligand binding experiments are used extensively in drug discovery efforts.[1–4] These experiments are most commonly used to detect low to moderate affinity binding ligands, and they can provide reasonably high-throughput screening of drug–candidate interactions. Some of the more common techniques used for these investigations include: saturation transfer difference (STD), competitive ligand binding (CLB), nuclear overhauser effect (NOE) pumping, diffusion ordered spectroscopy (DOSY), WaterLOGSY, and structure activity relationships by NMR (SAR by NMR).[5–17] Binding ligands from these experiments are identified in the acquired spectra through magnetization transfer, chemical shift and line width differences, or diffusion coefficients.
One of the more successful approaches is SAR by NMR[17] that uses 15N-labeled protein to observe the binding event(s) that manifest themselves in 15N HSQC chemical shift changes. Once a binding ligand is found, a second ligand is found that binds to a nearby site, both of which are typically optimized in terms of their binding interaction by chemically modifying the ligand structure. On the basis of the protein structural information elucidated by either NMR spectroscopy or X-ray crystallography, the two ligands are linked together to create one high-affinity ligand. Other approaches observe the ligand, which make the preparation of the sample more straightforward, although the results typically provide less information on the specifics of the protein-binding pocket. Epitope mapping[8] has allowed more detailed characterization of the protein–ligand interaction from the perspective of the binding ligand.
STD spectroscopy utilizes magnetization transfer from the protein to the ligand to evidence binding events. STD–NMR is usually performed with the ligand present in excess, and is advantageous because of its ability to investigate proteins of unlimited size, as well as of short experimental duration. In the STD experiment, spectral acquisition alternates between saturation of an on-resonance protein signal with a selective Gaussian pulse-train and saturation of an off-resonance portion of the spectrum. The on-resonance spectrum is acquired by saturating the protein 1H signal that is far from the signal of interest of any ligand. Through spin diffusion among the protein 1H spins, saturated proton spins near the binding region come into contact with the ligand and cause partial saturation of the ligand's proton spins. The ligand's 1H signals are attenuated in the resultant on-resonance spectrum. The off-resonance acquisition produces a normal spectrum since no protein protons are saturated. Ideally, the difference spectrum between the normal spectrum and the on-resonance spectrum contains only signals from the binding ligand.
The STD spectrum however, contains protein background signals as well. To reduce the size of the protein background signal, one can use a T2 filter.[3] Alternatively, when this approach provides insufficient background suppression, the STD–NMR experiment can be extended from a single difference with one sample to a double difference involving two samples. Meyer et al. carried out this experiment to investigate ligand binding to platelet membrane proteins using one sample, containing only the protein-containing platelet cells and another sample containing the cells and ligands.[18] A saturation transfer double-difference (STDD) spectrum was obtained in which one difference was taken internally through phase cycling, and the second difference was taken by manual subtraction, canceling the protein signal. In this case, the spin lock filter was insufficient to cancel the many different signals emanating from the platelet cells.
Here we describe an extension of STDD spectroscopy by taking both differences internally and automatically with a dual solenoid microcoil difference probe.[19,20] Microcoil NMR[21,22] makes use of a small (≤1 mm dia) solenoidal transceiver coil that provides an increase in the efficiency of excitation and detection for mass limited samples. Microcoil NMR is amenable to hyphenation with coupled separations or liquid-handling techniques, and for high-throughput analysis.[23–30] The difference probe employs two solenoidal transceiver coils wound around two separate capillaries. Owing to the unique circuit in the difference probe, one coil produces positive NMR peaks, while the other produces negatively phased signals. Signals common to each coil that appear at the same chemical shift are canceled. In combination with phase cycling and the STD pulse sequence, the double-difference experiment performs two subtractions, both of which are performed internally, without changing samples. One of these differences cancels the nonbinding ligand through phase cycling in the STD pulse sequence, while the second difference that cancels the protein background signal results from the microcoil difference probe circuit. The final spectrum is a clean signal containing the binding ligand that is amenable for ligand-binding studies.
Experimental
The dual microcoil NMR difference probe was constructed using a wide-bore (73 mm) probe body, and can be seen in Fig. 1. A detailed description of the probe construction has been previously provided.[19] The present work was carried out using the same probe with two modifications. First, larger glass capillaries (1.3 mm OD, 1.1 mm ID, Drummond Scientific Co., Broomall, PA) were used to improve the concentration sensitivity of the probe and to reduce clogging from the protein-containing samples. The two solenoid microcoils were fabricated by wrapping polyurethane-coated high purity (99.99%) 42-gauge (63.5 μm dia) round copper wire (California Fine Wire Co., Grover Beach, CA) around the glass capillaries as done previously. Each coil is comprised of two wires wound in parallel for three turns, and is fixed to the capillaries using cyanoacrylate adhesive (Krazy Glue, Borden Inc., Columbus, OH). A magnetic susceptibility matching fluid, Fluorinert FC-43, was added to reduce the line-broadening effects of the copper wire.[21] Sample capillaries were mounted in a rectangular support made of Ultem plastic. To allow for sample input and output, high purity Teflon tubing (Upchurch Scientific, Oak Harbor, WA) was attached to the ends of the capillaries.
Figure 1.
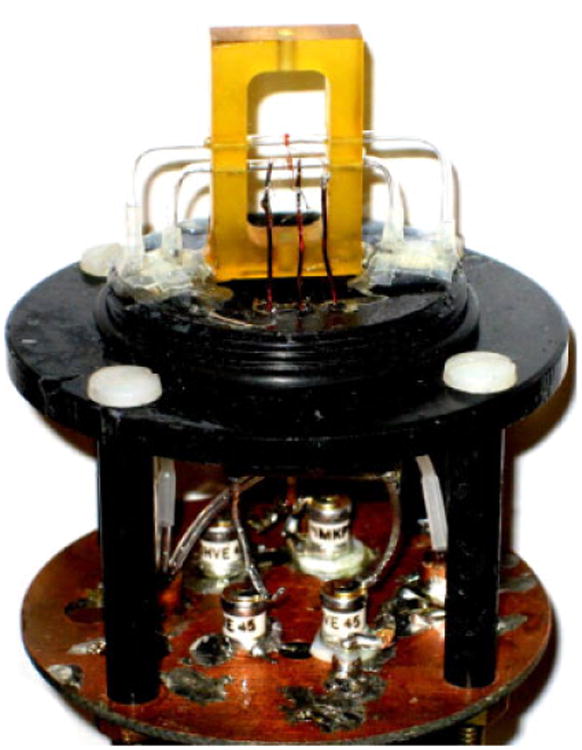
Microcoil difference probe head displaying sample capillaries and sample coils. The rest of the resonant circuitry is located just below the sample cells.
The tuning and matching circuitry (Fig. 2) is similar to our previously published circuit[19] except that the crossed diodes on the transmitter side were located outside the probe. Four nonmagnetic tunable capacitors (0.5–9 pF, Voltronics Corp, Denville, NJ) were located in an area below the detection coils to minimize the effects of magnetic susceptibility mismatches. Nonmagnetic diode dice (1N916, Semi Dice, South Easton, MA) were used for the internal crossed diodes on the receiver side of the circuit. The difference probe employs these crossed diodes as switches, such that during transmission the diodes are switched on passively (without external bias). This causes the sample coils to become connected in parallel, electrically, so that theoretically, each receives the same rf pulse amplitude and phase. During acquisition, the μV signal is too small to switch the diodes on and, therefore, from the perspective of the receiver, the coils are connected serially. The first crossed diode pair is used to isolate the signal from the transmitter portion of the tuning circuit, so that the signal energy in the receiver coils is not dissipated into the transmitter output circuitry. With respect to the receiver, the induced transverse magnetizations from the two sample coils produce voltages of opposite phase, and thus add with opposite sign, producing a difference spectrum. Minor changes in this phase are adjusted as necessary through manipulation of the variable capacitors in the circuit.
Figure 2.
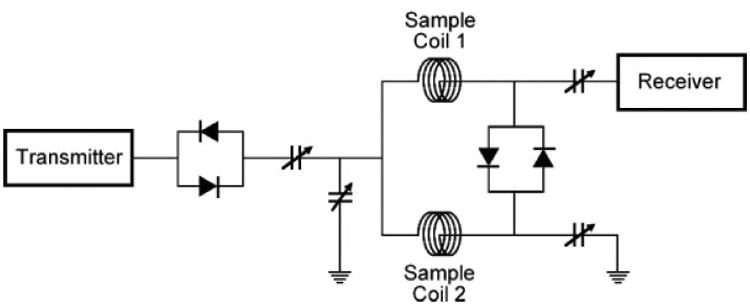
Circuit diagram employed in the dual microcoil NMR difference probe.
Spectra were collected on a Varian Inova spectrometer operating at 300 MHz. Data were collected on a protein–ligand system consisting of human serum albumin (HSA), octanoic acid (a binding ligand), and glucose (a nonbinding ligand), all from Sigma-Aldrich, St Louis, MO. For the reference proton spectrum, HSA (150 μm) in pH 7.4(10 mm) potassium phosphate (Mallinckrodt Baker, Phillipsburg, NJ) buffer prepared in D2O was loaded into one sample coil of the difference probe with phosphate buffer only loaded into the other capillary. Samples were injected using a standard 3 ml plastic syringe (Becton-Dickinson, Frankin Lakes, NJ) and a 1/16″ Luer lock syringe adapter.
STDD experiments were performed using the pulse sequence reported by Meyer and Peters,[3] but without the use of a T2 filter. The protein was saturated with a 20 dB, on-resonance Gaussian pulse train centered at 7.24 ppm. The off-resonance portion was acquired with the transmitter frequency set to 14 ppm, well away from any protein or ligand peaks of interest. The on-resonance frequency for the protein was chosen to be far from any ligand resonances.
For comparison, experiments were also performed using a commercial 5-mm quad-nucleus probe on the same system of compounds at the same concentrations. The only difference in this case was that the second difference, subtraction of the protein background, was performed manually in Excel.
Results and Discussion
Initial characterization of the dual microcoil difference probe showed a good response. Using a 5% H2O/95% D2O sample, we obtained line widths of 0.85 Hz for the upper sample coil, and 1.39 Hz for the lower coil with a mass sensitivity, Sm (S/N per micromole of analyte), of 5800 for the upper cell. This value of mass sensitivity is on the order of those reported for previous microcoil efforts.[31] Reference spectra of the ligands and protein are shown in Fig. 3. A reference spectrum was acquired for a sample consisting of 19 mM octanoic acid and 125 mm glucose in pH 7.4, 10 mm potassium phosphate buffer in D2O that was loaded into the upper coil, with just the 10 mm phosphate buffer in D2O in the lower capillary (Fig. 3(A)). A second reference spectrum of HSA (150 μm) was similarly acquired with phosphate buffer in D2O loaded into the other capillary (Fig. 3(B)), and illustrates the complexity of protein resonances arising from the serum albumin. The reference spectra were acquired using a standard 1D pulse sequence with a delay of 1 s, a pulse width of 11 μs at 55 dB, and an acquisition time of 1 s, for a repetition time of 2 s, and signal averaging over 8192 scans. Prior to the difference experiments, shim values and pulse widths were adjusted using 5% H2O/95% D2O samples to provide the best match of peak shape and intensity.
Figure 3.
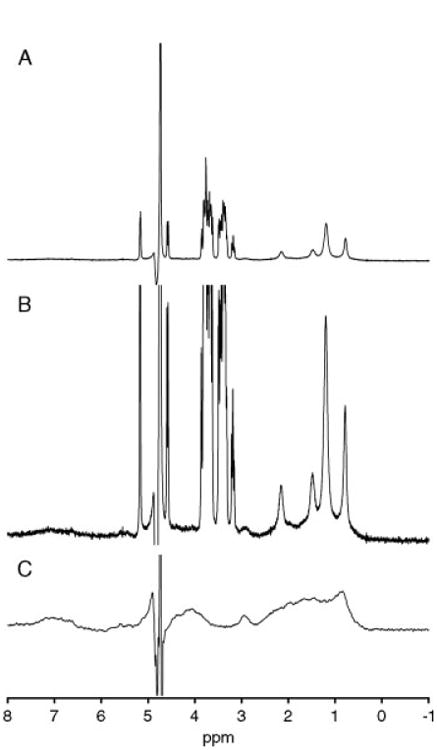
Reference spectra of ligands and protein used in this study obtained using the difference probe: (A) spectrum of 150 μm HSA, 19 mm octanoic acid, and 125 mm glucose in 10 mm potassium phosphate buffer prepared (pH 7.4) in D2O; (B) spectrum A scaled to show the underlying protein resonances in the baseline and (C) 150 μm HSA loaded into the top coil of the difference probe. For both spectra, potassium phosphate buffer was loaded into the lower sample capillary of the difference probe.
In Fig. 4, STD and STDD spectra are shown for HSA and the two ligands. HSA and the two ligands were loaded into one of the detection coils with phosphate buffer in the other coil. With the application of the STD pulse sequence, the resulting spectrum (Fig. 4(A)) shows the binding ligand, octanoic acid, along with some residual protein signal. Concentrations for the ligands and protein were the same as for the spectra acquired and shown in Fig. 3. The background protein signal is clearly evident in the spectrum as it obscures the ligand signal.
Figure 4.
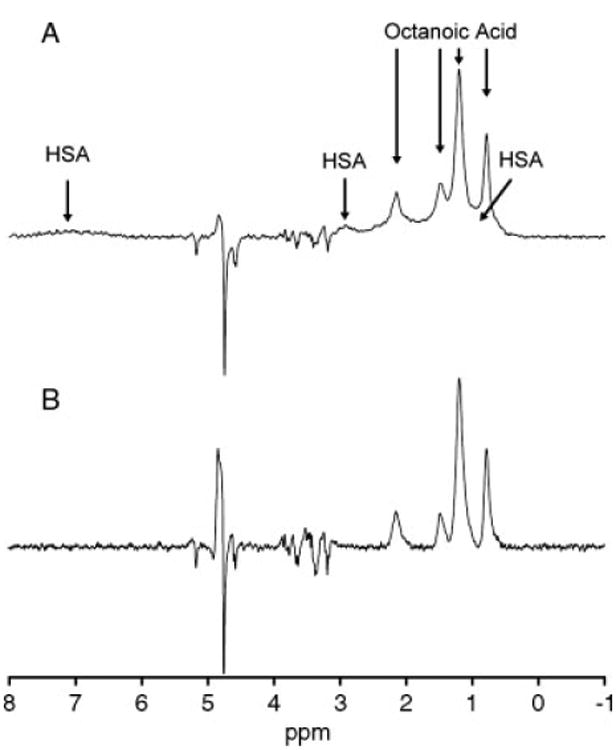
STD and STDD spectra for HSA and the two ligands. (A) HSA and the two ligands loaded into the difference probe, with phosphate buffer in the other sample capillary. The glucose resonances have been canceled internally due to phase cycling; however, the protein background signal is present. (B) Full STDD spectrum, with protein and ligands loaded in the top sample capillary, and only protein in buffer in the lower capillary. Glucose is largely attenuated in this spectrum due to phase cycling, and protein signal contributions are canceled by the difference probe, leaving only the binding ligand, octanoic acid, present in the spectrum along with a residual water signal.
The STDD spectrum was then acquired with the two ligands plus HSA (same concentrations as before) in the upper sample coil, and HSA only in the lower sample coil. During the initial probe evaluation, a discrepancy between signal intensities was observed in the two sample cells, partly caused by their difference in signal line widths. The upper coil produced nearly 3.3 times as much signal as the lower coil. The main cause of this discrepancy is probably because of the presence of nonideal diodes in the circuit. In a previous version of the difference probe[19] 1N914 diode dice were used, which had little effect (though still measurable) on the τ90 times. In the present work, we used 1N916 diodes because of availability issues, which clearly affected the τ90 of one of the coils. To achieve an effective incomplete cancellation of the residual HDO peak at ∼4.8 ppm. Ideally, the overall dynamic range of the NMR experiment is improved with this approach. However, this improvement is contingent on the effective match in peak shape of common solvent signals present in each of the capillaries. In addition, there will often be a residual protein signal present in the spectrum because of incomplete saturation. In principle, the protein signal could be eliminated by employing an appropriate T2 filter, but in some cases[18] residual signals persist. It can, therefore, be advantageous to use a separate sample of protein to improve the cancellation, such as by using the approach taken in this study.
In comparison, STD spectra were acquired on the same system of components at the same concentrations described above but using a 5-mm commercial NMR probe (Varian 4-nucleus AutoSwitchable). Separate acquisitions of the protein–ligand mixture and protein-only samples were made sequentially, and the double difference was performed manually in Microsoft Excel. Figure 5(A) shows a 1D acquisition of the protein–ligand mixture indicating the presence of all components in the system. Figure 5(B) spectrum is the STD experiment performed over 64 scans on the same sample, showing the cancellation of glucose resonances, while signals of the bound ligand, octanoic acid, cancellation of the residual protein signal in the STDD experiment, the protein concentration in the lower coil was increased 3.3-fold.
Figure 5.
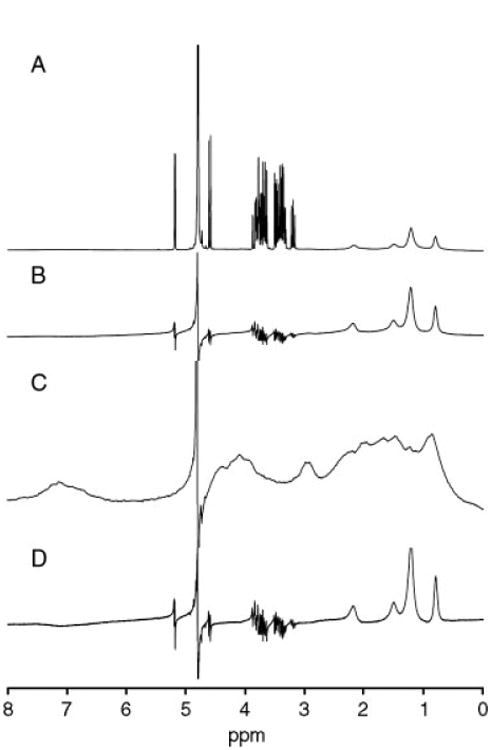
STD and manual STDD spectra for HSA and the two ligands performed using a commercial 5-mm NMR probe. (A) 1D spectrum of HSA, glucose, and octanoic acid at the same concentrations acquired over 64 scans. (B) STD performed on the same mixture, whereby glucose is canceled due to phase cycling, leaving only octanoic acid signals and protein background. (C) STD performed on 150 μm HSA to provide protein background for manual subtraction. The spectrum is scaled to indicate complexity of this background signal. (D) Double-difference spectrum performed by manual subtraction of spectrum C from B.
Figure 4(B) shows the full STDD spectrum. The nonbinding ligand glucose is canceled in this experiment through appropriate phase cycling. Half-height line widths of the octanoic acid peaks range from ∼34 to 49 Hz. This is primarily due to the nature of octanoic acid, where all 16 proton signals are compressed into 4 broad resonances, but the viscous nature of the compound also leads to micelle or emulsion formation in aqueous media. Additionally, the lack of a lock channel on the homebuilt probe, which allowed the frequency to drift considerably over the course of the acquisition is a secondary source of line broadening and contributed to unresolved couplings. The implementation of a lock channel would reduce general broadening due to the drift of Bo, enhancing the relative resolution and the sensitivity of the experiment. Bo inhomogeneity contributes to the difference in line shapes exhibited by the two coils. Although each coil is small and both are located in the homogeneous region of the static field, physical differences between the hand-wound coils as well as their different spatial locations contribute to these line shape mismatches. Practically, this problem is addressed through a compromise in shimming in order to provide for the best match in peak shape and intensity for the most effective cancellation.[20
If there is a large amount of residual solvent signal, the peak(s) can be difficult to cancel, leaving behind some partially edited resonances. This is indeed the case here, as noted by the remain. Again, the STD sequence was performed under the same NMR conditions on a sample of protein only, to provide a background reference for subtraction. The manual subtraction of 5(C) from 5(B) is shown in Fig. 5(D).
A comparison of the raw S/N of the STDD spectra taken with the homebuilt difference probe and the commercial probe shows a factor of 10-fold better performance for the commercial probe as measured using the region of the remaining octanoic acid peaks in the spectra. If the theoretical increase in signal averaging is taken into account (8192 scans vs 64, a factor of 8√2), this represents a ∼100-fold better concentration sensitivity (Sc) for the commercial probe. However, when the sample active volume and the mass of the analyte detected are taken into account, the difference probe outperforms the commercial probe by roughly a factor of 7 in mass sensitivity (S/N of 87 vs 12 per μg of octanoic acid). For the difference probe experiments, samples were analyzed by direct injection with a syringe, filling the entire flow cell path length. This volume is ∼250 μl for each cell, because a large inner diameter Teflon tubing was used for the transfer lines. Future versions of the probe can utilize silica capillary transfer lines and the sample plugs could be injected and moved via immiscible push solvents as has been demonstrated,[28] thereby decreasing the amount of sample significantly.
An important feature of the probe is that it appears to provide a better matching of the spectral baselines needed to produce the second difference. The presence of residual bumps in the baseline of the spectrum in Fig. 5(D) acquired with the commercial probe can be accounted for by the inconsistencies present in the two different samples needed to properly perform the manual subtraction of the protein background. This mismatch is not present in the automatic subtraction acquired by the homebuilt difference probe.
Conclusions
We have demonstrated the STDD NMR experiment using a microcoil NMR difference probe, and achieved the cancellation of signals from both a nonbinding ligand and the target protein. Cancellation of the signal from glucose occurs by the phase cycling in the STD pulse sequence, while cancellation of the protein signal results from the unique circuit in the microcoil difference probe. The use of microcoil probes for this type of investigation can be advantageous because of the increased mass sensitivity afforded by microcoil NMR, and the flow-through design can be used to improve sample throughput. The use of this approach compares favorably with manual subtraction of STD data acquired on a commercial probe. Further optimization of the probe circuitry will lead to a more effective cancellation without the need to weight the protein concentrations, and better resolution for more complex systems. The use of an increased solenoidal coil sample volume[32] would improve the concentration sensitivity of the method. Additionally, while we used a series of shaped Gaussian pulses for the saturation in order to follow the approach of Meyers et al., the substitution of a long soft pulse could potentially achieve the same level of irradiation while eliminating the extra time involved with optimizing the parameters for the shaped pulses.
Acknowledgments
The authors acknowledge financial support from the National Institutes of Health (5R01 RR018294-04), and also thank members of the Jonathan Amy Facility for chemical instrumentation, and John Pirolo of the Purdue Glass Shop for technical assistance.
References
- 1.Zartler ER, Shapiro MJ. Curr Pharm Des. 2006;12:3963. doi: 10.2174/138161206778743619. [DOI] [PubMed] [Google Scholar]
- 2.Lepre CA, Moore JM, Peng JW. Chem Rev. 2004;104:3641. doi: 10.1021/cr030409h. [DOI] [PubMed] [Google Scholar]
- 3.Meyer B, Peters T. Angew Chem Int Ed. 2003;42:864. doi: 10.1002/anie.200390233. [DOI] [PubMed] [Google Scholar]
- 4.Wyss DF, McCoy MA, Senior MM. Curr Opin Drug Discov Devel. 2002;5:630. [PubMed] [Google Scholar]
- 5.Soubias O, Gawrisch K. J Am Chem Soc. 2005;127:13110. doi: 10.1021/ja0538942. [DOI] [PubMed] [Google Scholar]
- 6.Wang Y, Liu D, Wyss DF. Magn Reson Chem. 2004;42:485. doi: 10.1002/mrc.1381. [DOI] [PubMed] [Google Scholar]
- 7.Yan J, Kline A, Mo H, Shapiro MJ, Zartler ER. J Magn Reson. 2003;163:270. doi: 10.1016/s1090-7807(03)00106-x. [DOI] [PubMed] [Google Scholar]
- 8.Mayer M, Meyer B. J Am Chem Soc. 2001;123:6108. doi: 10.1021/ja0100120. [DOI] [PubMed] [Google Scholar]
- 9.Mayer M, Meyer B. Angew Chem Int Ed. 1999;38:1784. doi: 10.1002/(SICI)1521-3773(19990614)38:12<1784::AID-ANIE1784>3.0.CO;2-Q. [DOI] [PubMed] [Google Scholar]
- 10.Siriwardena AH, Tian F, Noble S, Prestegard JH. Angew Chem Int Ed. 2002;41:3454. doi: 10.1002/1521-3773(20020916)41:18<3454::AID-ANIE3454>3.0.CO;2-L. [DOI] [PubMed] [Google Scholar]
- 11.Chen AD, Shapiro MJ. J Am Chem Soc. 2000;122:414. [Google Scholar]
- 12.Price KE, Lucas LH, Larive CK. Anal Bioanal Chem. 2004;378:1405. doi: 10.1007/s00216-003-2410-3. [DOI] [PubMed] [Google Scholar]
- 13.Pelta MD, Barjat H, Morris GA, Davis AL, Hammond SJ. Magn Reson Chem. 1998;36:706. [Google Scholar]
- 14.Wu D, Chen A, Johnson CS. J Magn Reson, Ser A. 1995;115:260. [Google Scholar]
- 15.Morris KF, Johnson CS. J Am Chem Soc. 1992;114:3139. [Google Scholar]
- 16.Dalvit C, Fasolini M, Flocco M, Knapp S, Pevarello P, Veronesi M. J Med Chem. 2002;45:2610. doi: 10.1021/jm011122k. [DOI] [PubMed] [Google Scholar]
- 17.Shuker SB, Hajduk PJ, Meadows RP, Fesik SW. Science. 1996;274:1531. doi: 10.1126/science.274.5292.1531. [DOI] [PubMed] [Google Scholar]
- 18.Claasen B, Axmann M, Meinecke R, Meyer B. J Am Chem Soc. 2005;127:916. doi: 10.1021/ja044434w. [DOI] [PubMed] [Google Scholar]
- 19.Macnaughtan MA, Hou T, MacNamara E, Santini RE, Raftery D. J Magn Reson. 2002;156:97. doi: 10.1006/jmre.2002.2535. [DOI] [PubMed] [Google Scholar]
- 20.Macnaughtan MA, Smith AP, Goldsbrough PB, Santini RE, Raftery D. Anal Bioanal Chem. 2004;378:1520. doi: 10.1007/s00216-003-2374-3. [DOI] [PubMed] [Google Scholar]
- 21.Olson DL, Peck TL, Webb AG, Magin RL, Sweedler JV. Science. 1995;270:1967. [Google Scholar]
- 22.Lacey ME, Subramanian R, Olson DL, Webb AG, Sweedler JV. Chem Rev. 1999;99:3133. doi: 10.1021/cr980140f. [DOI] [PubMed] [Google Scholar]
- 23.Hou T, MacNamara E, Raftery D. Anal Chim Acta. 1999;400:297. [Google Scholar]
- 24.Li Y, Wolters AM, Malawey PV, Sweedler JV, Webb AG. Anal Chem. 1999;71:4815. doi: 10.1021/ac990855y. [DOI] [PubMed] [Google Scholar]
- 25.Hou T, Smith J, MacNamara E, Macnaughtan M, Raftery D. Anal Chem. 2001;73:2541. doi: 10.1021/ac0100751. [DOI] [PubMed] [Google Scholar]
- 26.MacNaughtan MA, Hou T, Xu J, Raftery D. Anal Chem. 2003;75:5116. doi: 10.1021/ac034400r. [DOI] [PubMed] [Google Scholar]
- 27.Wang H, Ciobanu L, Edison AS, Webb AG. J Magn Reson. 2004;170:206. doi: 10.1016/j.jmr.2004.07.001. [DOI] [PubMed] [Google Scholar]
- 28.Kautz RA, Goetzinger WK, Karger BL. J Comb Chem. 2005;7:14. doi: 10.1021/cc0498940. [DOI] [PubMed] [Google Scholar]
- 29.Webb AG. Magn Reson Chem. 2005;43:688. doi: 10.1002/mrc.1616. [DOI] [PubMed] [Google Scholar]
- 30.Djukovic D, Liu S, Henry I, Tobias B, Raftery D. Anal Chem. 2006;78:7154. doi: 10.1021/ac0605748. [DOI] [PMC free article] [PubMed] [Google Scholar]
- 31.Olson DL, Norcross JA, O'Neil-Johnson M, Molitor PF, Detlefsen DJ, Wilson AG, Peck TL. Anal Chem. 2004;76:2966. doi: 10.1021/ac035426l. [DOI] [PubMed] [Google Scholar]
- 32.Henry ID, Park GHJ, Kc R, Raftery D. Concepts Magn Reson B. 2008;33B:1. doi: 10.1002/cmr.b.20152. [DOI] [PMC free article] [PubMed] [Google Scholar]


