

Abstract
A set of protocols was created to characterize prosthetic liners across six clinically relevant material properties. Properties included compressive elasticity, shear elasticity, tensile elasticity, volumetric elasticity, coefficient of friction (CoF), and thermal conductivity. Eighteen prosthetic liners representing the diverse range of commercial products were evaluated to create test procedures that maximized repeatability, minimized error, and provided clinically meaningful results. Shear and tensile elasticity test designs were augmented with finite element analysis (FEA) to optimize specimen geometries. Results showed that because of the wide range of available liner products, the compressive elasticity and tensile elasticity tests required two test maxima; samples were tested until they met either a strain-based or a stress-based maximum, whichever was reached first. The shear and tensile elasticity tests required that no cyclic conditioning be conducted because of limited endurance of the mounting adhesive with some liner materials. The coefficient of friction test was based on dynamic coefficient of friction, as it proved to be a more reliable measurement than static coefficient of friction. The volumetric elasticity test required that air be released beneath samples in the test chamber before testing. The thermal conductivity test best reflected the clinical environment when thermal grease was omitted and when liner samples were placed under pressure consistent with load bearing conditions. The developed procedures provide a standardized approach for evaluating liner products in the prosthetics industry. Test results can be used to improve clinical selection of liners for individual patients and guide development of new liner products.
Introduction
Transtibial amputations are the most common form of major (i.e., nondigit) limb loss, comprising about 42% of all lower-limb amputations [1]. A primary goal in the design of a transtibial prosthesis is to securely connect the socket to the limb to facilitate safe transmission of ambulatory stresses through delicate residual limb tissues [2,3]. An elastomeric or “gel” liner is often included in the design of the prosthesis to meet this goal. The liner serves to couple the limb to the socket, accommodate changes in limb shape and volume, and distribute concentrated socket stresses. Clinically, a liner must be matched to a patient based on a number of characteristics that include limb shape, tissue quality, socket design, anticipated volume change, and activity level.
Failure to properly match a liner to a patient can lead to a variety of clinical problems. For example, use of a soft liner (i.e., a liner with low tensile elasticity) by an individual with excessive adipose residual limb tissue may result in greater displacement or “pistoning” between the limb and socket. Similarly, use of a slick liner by an individual who sweats profusely may produce unwanted pistoning because the liner (and prosthesis) will slip relative to the user's residual limb. Pistoning can degrade proprioceptive stability and produce gait deviations that lead to trips and falls [4,5]. Miller and colleagues reported that 52.4% of 435 lower-limb amputees reported falling at least once over a 12 month period, and 39.5% reported falling two or more times [6]. Similarly, poor transmission of stresses between the socket and limb can lead to skin issues or breakdown. A survey of 805 lower-limb amputees found that 63.0% of participants experienced skin problems within the prior month, and 82.0% reported problems more than 1 month prior to the survey [3]. Collectively, these issues can lead to disuse of the prosthesis and reduced participation in desired life activities [7]. Selection of an appropriate prosthetic liner for a patient is therefore vitally important to a user's health and quality of life.
Commercially available prosthetic liners are made from foam or a gel. However, more than 85% of people with transtibial amputation use a suspension system that requires a gel liner [8]. A gel liner consists of an elastomeric polymer base that is commonly reinforced with a fabric backing. Matching a liner to a specific patient can be challenging, as there are presently more than 60 transtibial liner products available on the market, but a paucity of information about their relative performance [9]. Previous studies have examined liner material properties, but the scope of these studies was limited to few products [10,11], or liners that are no longer available for purchase [12,13]. In the absence of objective data to compare liner products, practitioners typically rely on information from liner manufacturers' literature or conference brochures [14]. Independent testing of prosthetic liners is needed to enable practitioners to effectively appraise current products and select those most appropriate for their patients.
The purpose of this research was therefore to develop tests to characterize overall elastomeric liner performance. Properties selected for testing were derived from clinically desirable liner characteristics including the ability to distribute ambulatory stresses, suspend the socket on the limb, adhere to a user's skin, accommodate residual limb volume changes, and facilitate transmission of body heat. Tests were designed to obtain quantitative information that could be used to compare and contrast different liner products. Once developed, these standardized tests could be applied to future efforts to evaluate available liners, inform clinical selection processes, and direct liner development efforts.
Methods
Six material properties were selected to characterize liner performance–compressive elasticity, shear elasticity, tensile elasticity, coefficient of friction, volumetric elasticity, and thermal conductivity. Compressive and shear elasticity were chosen to determine how a liner distributes ambulatory stresses on the residual limb during the stance phase of gait. Tensile elasticity was chosen to assess a liner's ability to resist stretching during swing phase. Coefficient of friction was selected to measure a liner's adherence to the residual limb. Volumetric elasticity was selected to indicate a liner's ability to accommodate limb volume changes. Finally, thermal conductivity was selected to quantify a liner's ability to facilitate heat transfer to or from the residual limb. The emphasis of this study was to design the testing equipment and to develop the set of standardized procedures that would be used to measure the selected liner properties. Candidate test variables were evaluated and optimized in order to test liners in conditions similar to those they experience inside a prosthetic socket.
Several industry resources guided development of the liner material property tests. These included testing standards from the American Society for Testing and Materials [15–24] (ASTM, West Conshohocken, PA) and material guidelines from Axel Products (Ann Arbor, MI), an industry expert in elastomeric testing [15,22,25,26]. Industry test standards served as a basis for design of the test fixtures, selection of initial test parameters (e.g., specimen geometry and conditioning procedures), and consideration of common sources of measurement error. Data from gait and interface stress studies on people with transtibial amputation informed initial test settings [10,27–33].
Because elastomers are soft materials and the designed tests involved large strain measurements [34,35], it was important to distinguish engineering and true stresses reported in the industry resources and scientific literature. Engineering stresses are simply the applied load divided by the initial (i.e., prestressed) cross-sectional area of a specimen. True stresses account for a specimen's material deformation and change in cross-sectional area under load. While material testing machines (MTMs) typically output engineering stresses, directly measured material responses (e.g., in-socket pressure measurements) and mechanical analyses (e.g., finite element analysis (FEA)) report true stresses. Therefore, MTM-measured engineering stresses were converted to true stresses for all analyses using the large deformation formulation of the Poisson effect for compression (Eq. (1)) and tension (Eq. (2)), where liner materials were assumed to be incompressible (i.e., Poisson's ratio of 0.5). The difference between the two equations reflects an increasing cross-sectional area for a specimen in compression and a decreasing cross-sectional area for a specimen in tension
| (1) |
| (2) |
Instrumentation.
A uniaxial MTM (5944, Instron, Norwood, MA) with custom fixtures was used to perform the compressive, shear, tensile, and volumetric elasticity tests (Fig. 1(a)). MTM movement was set by an electric ballscrew designed for high displacement rates (up to 30 mm per second). A measurement crosshead that contained a single-axis load cell was mounted to the ballscrew, and moved vertical relative to a base platform. The load cell had a full scale range of 1–500 N and a mean load measurement error of ±0.25% of the total applied load (weight of test fixture plus specimen load). Displacement measurement uncertainty was ±0.005 mm. The MTM was calibrated prior to testing and annually thereafter.
Fig. 1.
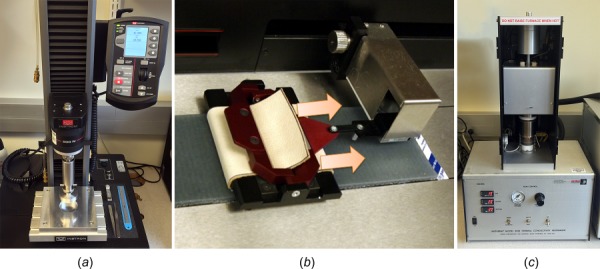
Instruments used for testing: (a) uniaxial material testing machine, (b) planar friction tester, and (c) guarded heat flow meter
A planar friction tester (PFT) (Advanced Friction tester, Hanatek, East Sussex, UK) was used to evaluate the coefficient of friction (CoF) between elastomer and skin (Fig. 1(b)). Similar to the MTM, the PFT was a single-axis instrument with an electric ballscrew-driven crosshead. However, the direction of crosshead movement was horizontal and the load cell measured the force required to pull a manufacturer-provided specimen sled. An orthopedic-grade soft leather (Cream Cow, WBC Industries, Westfield, NJ) was attached to the sled as a surrogate skin material. This material was chosen because it had a nonrigid structure, a surface roughness comparable to skin, and low sample-to-sample variation. Because the PFT was designed to meet the ASTM D1894 test standard [16], adjustments were limited target displacement rate and total measurement distance. The ASTM recommended displacement rate of 150 mm/min and measurement distance of 125 mm were maintained because increasing the displacement rate risked damage to the instrument. To improve the PFT's repeatability, an aluminum spacer was removed from the specimen sled to reduce the nose-down pitch moment that biased load distribution to the leading edge of the leather sample. Repeatability of the CoF test measurement with the specified configuration was ±0.008 across three specimens of the selected leather applied to a single liner product.
A guarded heat flow meter (HFM) (Unitherm 2022, Anter Corp, Pittsburgh, PA) was used to measure thermal conductivity (Fig. 1(c)). The HFM included the test instrument, a liquid cooling unit, and a pneumatic pressure supply. Test specimens were compressed with a pneumatic piston between a high-temperature upper plate and low-temperature bottom plate. Plate temperatures were maintained with heating coils on the test instrument and a constant flow from the liquid cooling system, which was typically maintained at 20 °C below the mean measurement temperature. Dynalene HC-30 (Dynalene Inc, Whitehall, PA) was selected among a wide range of coolants because its low freezing point enabled full-scale calibration from 0 °C to 60 °C. The core of the HFM was a calorimeter that measured the heat flux between the specimen and the bottom plate. No modifications were made to the HFM. Similar to the PFT, the HFM was designed to meet the ASTM E1530 test standard [24], and the only available adjustments were compressive pressure and mean specimen temperature. Repeatability of the HFM was assessed by creating an instrument calibration profile across a desired temperature range for three manufacturer provided, rigid polymer calibration samples of different thickness with matching thermal conductivities. For the applied calibration, the measurement repeatability was ±0.001 W/m K across three samples.
Materials.
Eighteen new elastomeric liners from six manufacturers were used to create testing procedures and optimize test parameters (Table 1). Liners were fabricated from a range of base polymers, including silicone, urethane, and thermoplastic elastomer (TPE). Evaluations related to each material property test determined test parameters or were used to assess the influence of confounding variables that might contribute to test inconsistencies. A single liner product was used when trying to minimize a confounding variable (e.g., the liner with the greatest CoF was used to evaluate lubricants for the compressive elasticity test). Three or more liner products were used to evaluate the influence of minor variables (e.g., the influence of conductive grease on thermal conductivity was evaluated on three liners with dissimilar fabric thicknesses and densities). All eighteen liners were evaluated when testing highly influential variables, (e.g., the influence of specimen aspect ratio on the compressive elasticity test).
Table 1.
Liner products evaluated for test protocols
| Manufacturer | Product | Base polymer |
|---|---|---|
| Alps | EasyLiner | TPE |
| Alps | Extreme | TPE |
| Alps | General Purpose | TPE |
| Medi | Relax 3 C | Silicone |
| Össur | Comfort | Silicone |
| Össur | Dermo | Silicone |
| Össur | Synergy | Silicone |
| Otto Bock | 6Y512 (no fabric) | Urethane |
| Otto Bock | 6Y512 (w/fabric) | Urethane |
| Otto Bock | 6Y520 (no fabric) | Urethane |
| Otto Bock | 6Y520 (w/fabric) | Urethane |
| Otto Bock | 6Y75 | Urethane |
| Otto Bock | 6Y92 | TPE |
| Prosthetic Design | SealMate | Silicone |
| WillowWood | Alpha® Classic Max | TPE |
| WillowWood | Alpha® Classic Original | TPE |
| WillowWood | Alpha® Hybrid Select | TPE |
| WillowWood | Alpha® Classic Spirit | TPE |
Testing Environment and Preconditioning.
Definitions of conditioning and preconditioning varied across the scientific literature and industry resources used to inform test development. For this study, preconditioning refers to thermally conditioning a liner before specimens were extracted from an intact liner, while conditioning refers to mechanically conditioning a specimen immediately before a test was conducted. All liner specimens were thermally preconditioned for a minimum of 24 h and tested in a temperature controlled room with ambient conditions of 21±1 °C and a mean humidity of 33% (22% min, 50% max). Liner specimens were also conditioned immediately prior to each material test. The method of conditioning varied by test, but in general, specimens were mechanically stressed until a repeatable response was achieved.
Specimen Extraction.
Liner specimens were either circular or rectangular in shape, with characteristic dimensions ranging from 10 to 210 mm. Rectangular specimens were punched with a test-specific steel rule die (Apple Steel Rule Die, Milwaukee, WI) using a 1.2 kg dead blow hammer (P/N 6051A37, McMaster-Carr, Elmhurst, IL). Circular specimens were punched with a hammer-driven gasket and washer punch set (P/N 33785A12, McMaster-Carr, Elmhurst, IL). The cutting edge of the punch or die was always placed on the elastomer at the beginning of the cut. Circular specimens were inspected and repunched if necessary to ensure that circularity was ±0.2 mm from punch size and that vertical edges were visibly square.
Compressive Elasticity.
The compressive elasticity test was designed to quantify a liner's ability to transmit and distribute concentrated pressures that are known to cause skin breakdown [36] or deep tissue injury [37]. Residual limb volume fluctuations occur in people with transtibial amputation [38] when applied pressures propagate to internal tissues (i.e., arterial blood flow decreases and extracellular fluid is driven out of the interstitial space and back into the capillaries [39]). A liner with a high compressive elasticity will optimize stability by delivering concentrated pressures to desirable load-bearing areas (e.g., patellar tendon). Conversely, a liner with a low compressive elasticity will optimize comfort by distributing pressure over sensitive areas (e.g., fibular head). The compressive elasticity test was designed first because it required consideration of the largest number of test variables and was most comprehensively supported by data in the scientific literature. Test conditions established for the compressive elasticity test were then used to set limits for other material property tests when reference data were unavailable.
Stress/Strain Maximum.
ASTM test standards [15,22] and industry experts [25,26] have recommended setting strain as a test maximum because of the elastomeric strain conditioning (i.e., the Mullins effect). While clinically applicable liner strains were not available in the literature, limb-socket normal stresses have been frequently reported [10,27–33]. Therefore, a strain limit that encompassed the reported stress values for clinically available liner products was needed. Studies that evaluated Pelite™ foam liners described mean pressures of 100 kPa with peaks up to 200 kPa [27–32]. These corresponded to a minimum strain limit of 53% using the reported Pelite modulus of 380 kPa [40]. A more recent study of two elastomeric liners showed lower peak pressures (i.e., mean of 60 kPa and a maximum of 85 kPa) [33]. As a final consideration, a safety limit of 60% strain was imposed to prevent damaging the MTM with thin liners. Accordingly, materials were tested to the lesser of a maximum stress of 250 kPa or maximum strain of 60%. The clinical applicability of these limits was verified by compressing a highly compliant liner specimen to 60% strain and verifying that the corresponding stress was at least 85 kPa, a recent maxima for soft elastomeric liners reported in the literature [33].
Strain Rate.
Prosthetic liners, like most elastomers, exhibit a viscoelastic (i.e., strain-rate dependent) stress–strain response [25]. To determine if strain rate affected compressive elasticity, all eighteen liners were tested at strain rates of 150%, 100%, 50%, and 0.5% per second. 150% per second was selected as the fastest strain-rate because it corresponded to the maximum safe operating condition for the MTM.
Specimen Size.
Since prosthetic liners are made from an elastomer with an orthotropic fabric backing, stiffness was expected to vary with specimen aspect ratio [41,42]. ASTM standards D945 [15] and D6147 [22] recommend round specimens with diameters between 13.0 and 29.0 mm with a thickness of 6.3 mm to 12.5 mm. To determine the influence of specimen diameter on stress–strain response, 12 mm, 19 mm, and 30 mm specimens from all liners were evaluated. Whenever possible, 6 mm thick liners were evaluated. If 6 mm liners were unavailable, 3 mm liners were tested.
Frictional Effects.
Elastomeric liners expand or “flow” when compressed, and compressive elasticity is ideally measured when specimens are allowed to freely deform. Based on initial maximum stress test results and the assumption of specimen incompressibility, specimen diameter was estimated to increase by 58% at 60% strain. Miller [43] reported that frictional effects experienced by a specimen during this expansion artificially increased stress–strain response in a way that was impossible to predict or correct. Potential solutions included switching the test method to biaxial extension (instead of uniaxial compression) or modifying the test setup to minimize friction. Biaxial testing was determined to be unfeasible as it would require two additional instruments (i.e., a biaxial tester for specimen loading and a digital image correlation system for strain measurement). Therefore, nine lubricants were tested with the liner product with the greatest CoF (Table 2). Each lubricant was tested with two liner specimens that were cyclically compressed for 15 min at a displacement rate matching 50% strain per second. The lubricant that best minimized frictional effect was identified as the product that (a) resulted in the most consistent stress–strain response, and (b) produced the lowest measured stress at 60% strain, indicating the smallest artificial increase in material response due to friction.
Table 2.
Lubricants evaluated for compressive tests
| Manufacturer | Product | Lubricant |
|---|---|---|
| C&C Synthetics | Outlast | Synthetic oil |
| DuPont | Poly adhesive | Teflon |
| Fuchs | Geralyn | Synthetic oil |
| HAAS | Automation oil | Petroleum oil |
| PMS | T-9 | N/A |
| Sherwin Williams | Tri-flow | PTFE |
| Starrett | M1 | N/A |
| WD-40 | 3-in-one | Petroleum oil |
| WD-40 | WD-40 | N/A |
Shear Elasticity.
The shear elasticity test was designed to quantify a liner's ability to transmit and distribute concentrated shear stresses. Shear stresses are present at the limb-socket interface when the socket is displaced proximal-distal or anterior–posterior relative to the residual limb. Additionally, shear stresses can be imposed through torsional moments about the long axis of the limb, or applied through medial–lateral loading of the prosthetic foot. As shear stress is a primary contributor to skin breakdown [44,45], elastomeric liners are often prescribed to distribute and reduce the shear stress experienced in the user's skin. Given the thickness of gel (2–6 mm) relative to fabric (0–1 mm) in an elastomeric liner, the gel is largely responsible for shear distribution. A simple shear test, as opposed to pure or notched shear methods, was selected as it did not require additional equipment to measure specimen deformation. Initial test parameters from the compressive elasticity test were used to define key parameters for the shear elasticity test, including maximum strain and strain rate.
Specimen Size.
Simple shear testing is susceptible to measurement errors due to stress concentrations present at the specimen corners. To minimize stress concentrations (and associated errors), ASTM D945 [15] recommends a specimen area of 600 mm2. However, no recommendations for the specimen height or width are specified. It was hypothesized that stress concentrations along the upper and lower edges of the specimen would be the greatest source of measurement error (Fig. 2). Therefore, two-dimensional (2D) FEA was conducted to determine the height-to-thickness ratio that minimized the area of stress concentrations. Then, a three-dimensional (3D) FEA specimen was created by extruding the 2D profile and evaluating the optimum width-to-thickness ratio. Once final specimen geometry was obtained, shear accuracy was estimated using eight shear moduli that spanned the range measured during compression testing.
Fig. 2.
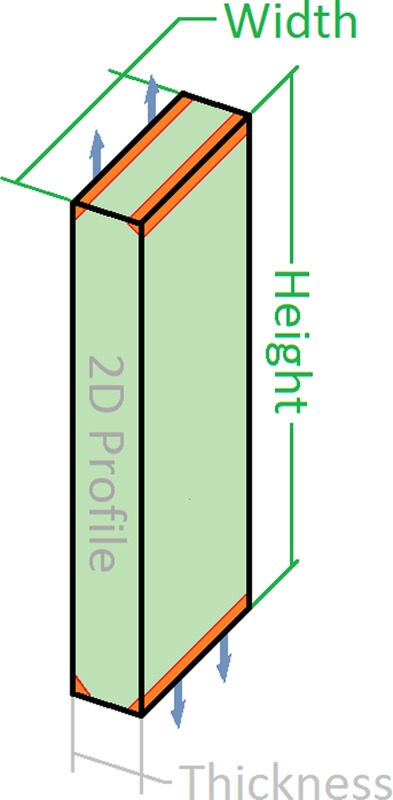
Stress concentrations in shear elasticity testing. Stress concentrations at the upper and lower specimen edges were predicted to be the greatest source of error. Height was optimized first, because adjustments changed the proportional area of influence within the 2D profile. Width was optimized second, because the area of influence was consistent in the extruded profile.
Adhesive Selection.
Eight adhesives (Table 3) were evaluated to determine their ability to bond a range of prosthetic liner materials (i.e., chemical variations of silicone, urethane, and TPE) to the aluminum test fixture. Adhesives were evaluated by measuring how well each successfully bonded liners to the test fixture over repeated 60% shear strain cycles, without peeling or delaminating.
Table 3.
Adhesives evaluated for shear and tensile tests
| Manufacturer | Product | Base Polymer |
|---|---|---|
| 3M | 4XL-EG | Epoxy |
| 3M | Poly adhesive | Acrylic |
| FabTech | PLU 90 | Urethane |
| Loctite | E-60HP | Expoy |
| Loctite | M-11FL | Urethane |
| Loctite | U-09FL | Urethane |
| Lord | 310A/B | Epoxy |
| Polymeric Systems | Sili-Thane 803 | Silicone |
Tensile Elasticity.
The tensile elasticity test quantifies a liner's ability to stretch axially. A liner experiences axial stretching during swing phase of the gait cycle when the prosthesis pulls away distally from the residual limb. Tensile elasticity may therefore influence the quality of suspension the liner provides. As published data regarding tensile stresses experienced by prosthetic liners in normal use are unavailable, the test maximum strain was set to the limit established during the compressive elasticity test, while the strain rate was set to the maximum displacement rate of the MTM (30 mm/s or approximately 20% strain per second). The tensile elasticity test limits were matched to the test limits established in compression and shear to follow guidelines [26] that ensure complete material models for mechanical analysis. Since tensile stresses are anticipated to be most prominent in swing phase (when the weight of the prosthesis is suspended by the liner), these limits are expected to exceed peak values that occur in normal use.
Specimen Attachment.
The pneumatic specimen grips supplied by the MTM manufacturer produced significant deformations in liner specimens. Therefore, a custom test fixture that used an adhesive bond, rather than clamping force, was designed to affix test specimens (Fig. 3(a)). Adhesive specimen tabs were mounted on a linear slide rail, both to accommodate different specimen thicknesses and to minimize secondary stresses caused by liner deformation during the tensile test. The pneumatic and adhesive specimen attachments were evaluated by comparing instrument strain measured by the MTM to localized strain measured by a digital caliper (CD-8” CSX, Mitutoyo, Aurora, IL) across three 10 mm regions centered on a liner specimen. The most suitable attachment method was the one that had the best agreement between instrument and local strains.
Fig. 3.
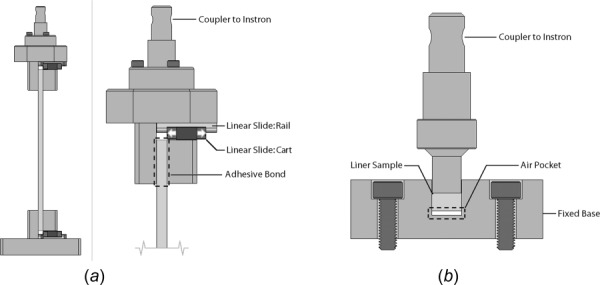
Tensile elasticity and volumetric elasticity test configurations: (a) tensile fixture with adhesive fixation. Left-side specimen mounts were fixed in place, while right-side specimen mounts were attached to a linear slide rail, allowing the specimen to thin while under tension. (b) bulk test fixture with air pocket. Air pockets were removed by center-punching with a large knitting needle, the eye of the needle created a gap that provided a low resistance path to outside of the well.
Specimen Size.
Similar to the simple shear test method used in the shear elasticity test, uniaxial tensile measurements were prone to stress concentrations at the specimen mount. To limit the effects of stress concentrations, ASTM D412 [18] recommends a tensile specimen geometry of 33.0–59.0 mm (L) by 3.0–12.0 mm (W). The recommended geometry was modified for the liner tensile test based on two factors. First, a larger specimen width (i.e., 32.0 mm) was selected to ensure the specimen included a sufficient number of intact fibers in the liner's fabric backing to contribute to tensile elasticity. Second, FEA was used to determine a specimen length that minimized the effects of stress concentrations at the specimen mounts. Three-dimensional candidate geometries were then analyzed to assess the effects of width. Once the optimum specimen geometry was selected, eight prospective moduli spanning the range of measured liner products were evaluated in FEA to quantify tensile modulus measurement accuracy.
Coefficient of Friction.
The CoF test quantifies a liner's ability to adhere to the limb. Liners regularly slip during ambulation, and the resulting abrasion can cause rashes or blisters [3,46,47]. CoF is also related to a liner's ability to propagate shear stresses through the skin–liner interface (e.g., a higher CoF will increase the maximum potential shear stress imposed on a limb). Previously reported measurements of the CoF between skin and prosthetic liner materials were substantially different: 0.35–0.68 [48] and 3.0–6.0 [49]. This broad range in measured CoF could have been the result of different measurement methods (e.g., torsional friction versus planar friction, measurement area (size), moisture saturation, applied pressure, or displacement rate) or variations in prosthetic liner materials. While some differences were expected between different methods, it was hypothesized that an order of magnitude increase in CoF was characteristic of chemical adherence that could only be the result of different liner materials. Initial tactile evaluation showed that some liner products exhibited sufficient adherence to support their own weight when suspended from human skin. Therefore, three liner samples with different base elastomeric polymers (i.e., urethane, silicone, and TPE) were used to evaluate the instrument's repeatability and assess the protocol's ability to reproduce the range of frictional coefficients reported in the literature.
Volumetric Elasticity.
The volumetric elasticity test quantifies a liner's stiffness when lateral expansion (i.e., flow) is inhibited. The size and shape of a residual limb change both over the course of a day [50] and over longer periods of time [39], affecting stress distributions over the entire residual limb. Management of these fluctuations is the single most challenging issue reported by prosthesis users [47]. Additionally, there are clinical assumptions in the prosthetic industry about the lateral expansion (flow) of different liner materials. For example, it is generally assumed that TPE liners flow more than polyurethane or silicone-based liners. The (Poisson's) ratio of lateral expansion, and therefore a liner's tendency to flow, can be estimated through the ratio of volumetric stiffness to compressive stiffness. From an engineering perspective, it is generally assumed that all elastomers are incompressible and little difference in volumetric elasticity is anticipated between liner products. However, it is important that a test be developed to verify or refute clinical assumptions and provide clinical insight into the relative performance of prosthetic liners.
Air Pockets.
Given the layered composition of elastomeric liners, a consistent, two-phase volumetric compression response was expected. The first phase would be relatively soft and correspond to compression of the fabric backing, the second phase would be stiff and correspond to compression of the elastomer. However, initial volumetric tests were inconsistent, exhibiting noticeably different elastic responses between specimens from the same liner product. It was hypothesized that such a response may have been due to air trapped in the bottom of the testing well (Fig. 3(b)). Two installation methods were therefore compared to determine which method produced a consistent two-phase volumetric response. Specimens in both methods were coated with the lubricant chosen for the compressive elasticity test, and either (a) the specimen was placed into the well inverted with the fabric facing down, or (b) the specimen was installed gel surface down while center-punched with a large knitting needle. The base of the needle was embedded into the specimen to allow trapped air to escape through the long eye. When all the air had been expelled, the needle was removed.
Thermal Conductivity.
The thermal conductivity test quantifies a liner's ability to transmit heat out of the limb. Excessive heat and sweating are common complaints from elastomeric liner users [3,46]. Elastomers are known to be relatively impermeable to both gases (air) and liquids (sweat). Further, most elastomers are insulating materials that limit conductive heat transfer. A liner with a high thermal conductivity can optimize comfort in a hot environment by moving heat away from a warm limb, while a liner with a low thermal conductivity can optimize comfort in a cold environment by insulating a cold limb. Contact temperatures on the upper and lower surfaces of the liner sample represented the desired experimental set point, since conductive heat transfer is governed by temperature gradients across a medium. The minimum desired contact temperature was 10 °C while the maximum was 40 °C, representing the lower [51] and upper [52] safe temperature boundaries for skin contact.
However, the HFM only allowed tests to be designed by setting the mean specimen temperature. Resulting contact temperatures were hard programmed by the instrument's manufacturer to be ±10 °C offset from the mean specimen temperature. Therefore, to achieve the desired contact temperature range of 10–40 °C, two tests were conducted with mean specimen temperatures of 20 °C and 30 °C. The instrument allowed mechanical adjustment of air pressure in a pneumatic piston that compressed the test specimen in 1 psi (7 kPa) increments from 5 to 60 psi (34–414 kPa). Piston air pressure was set to 10 psi (69 kPa) as a balance between mean sitting pressures of 5 kPa [53] and mean stance phase walking pressures of 100 kPa. In contrast to elasticity tests limits selected based upon peak stresses reported in the literature (i.e., extreme conditions experienced by a user), the thermal conductivity test was designed to reflect mean stresses (i.e., typical conditions experienced by a prosthesis user).
Test standards [24] often recommend use of thermal grease to eliminate air gaps and improve measurement accuracy. However, the fabric backing on a prosthetic liner presents a mixed volume of solid (fibers) and fluid (air) through which heat must transfer. To determine whether thermal grease significantly altered the heat transfer properties of the fabric backing, liner samples were tested both with and without grease applied onto the fabric side of the specimen. Samples were taken from three liner products that represented the range of fabrics used with prosthetic liners. One product had a loosely woven fabric backing that was 1.0 mm thick, one had a tightly knit and axially directed weave with aramid fibers that was 0.6 mm thick, and the last had a thin and loosely woven fabric that was less than 0.3 mm thick. Air was not considered a confounding factor if the absence of thermal grease did not decrease measurement repeatability.
Results
Compressive Elasticity
Stress/Strain Maximum.
The most compliant liner specimen achieved 85 kPa at 54% strain and 102 kPa at 60% strain (Fig. 4(a)). Therefore, the test limit of 60% strain was considered valid since it produced a stress that exceeded both the maximum measured pressure for elastomeric liners (85 kPa [33]) and the mean measured pressure for Pelite liners (100 kPa [27–32]). Additionally, the least compliant liner evaluated was stiffer than Pelite™, which verified the need for a second test limit of 250 kPa.
Fig. 4.
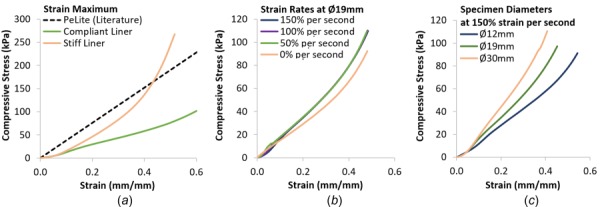
Compressive elasticity–parameter assessment: (a) the most compliant liner achieved 102 kPa at 60% strain, while the stiffest liner achieved 200 kPa at 47% strain. Averages for 18 liners specimens evaluating (b) strain rate and (c) specimen diameter.
Strain Rate.
Stress–strain response was nearly identical between 50 and 150% strain per second (Fig. 4(b)). Toe regions visible below 10% were caused by the MTM accelerating to the target strain rate, and were not representative of the material response. Tangent moduli were calculated over the linear regions of the stress–strain curves (i.e., between 10 and 35% strain) to facilitate a simple quantitative comparison between test conditions. The resulting tangent moduli were 194 kPa (150% per second), 191 kPa (100% per second), 187 kPa (50% per second), and 156 kPa (0% per second).
Specimen Size.
Tangent moduli increased linearly with diameter (R2 = 0.9999) but had a nonzero intercept (i.e., the projected modulus at zero diameter was 71 kPa) (Fig. 4(c)). For the specimen diameters evaluated, the resulting tangent moduli in the linear regions of the stress strain curve were 149 kPa (12 mm), 194 kPa (19 mm), and 267 kPa (30 mm).
Frictional Effects.
Of the lubricants evaluated, Outlast Synthetic Oil (C&C Synthetics, Mandeville, LA) was the most effective (Fig. 5). Other lubricants exhibited either an inconsistent stress–strain curve or unrepeatable maximum strains for a constant peak stress of 250 kPa during the 15 min cyclic compression test.
Fig. 5.
Compressive elasticity–effects of lubricants. Examples from two lubricants tested on the softest liner material (TPE): outlast synthetic oil (left) HAAS automation oil (right). Upper plots show overlayed stress–strain curves at nine load cycles and lower plots show displacement over time.
Shear Elasticity
Specimen Size.
Increasing the height-to-thickness ratio of the shear specimen (i.e., to decrease the influence of stress concentrations along the upper and lower specimen edges) did not significantly affect measurement accuracy. The absolute size of these concentrations was approximately the same across the tested height-to-thickness ratios; therefore, measurement was improved by increasing the portion of the specimen under a uniform stress (Fig. 6(a)). A height-to-thickness ratio of 20 was found to be optimal as smaller ratios exhibited an increase in net measurement error and greater ratios showed no meaningful change in measurement accuracy.
Fig. 6.
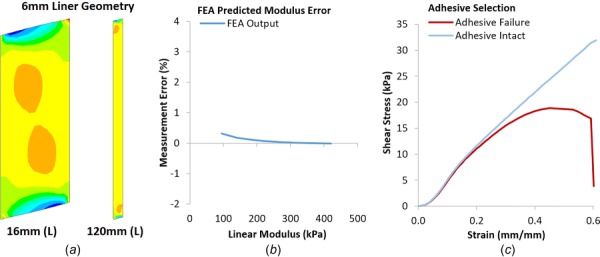
Shear elasticity–error assessment: (a) the influence of stress concentrations was minimized as length-to-thickness ratio was increased to 20, (b) load measurement error for the chosen specimen size decreased as linear modulus increased, and (c) experimental data showing an adhesive failure that began to peel at 15% strain and delaminated at 55% strain
FEA indicated that a 6 mm liner with a height-to-thickness ratio of 20 (120 mm) had an optimal width-to-thickness ratio of 5 (30 mm). Over the eight moduli simulated for the optimal specimen geometry, the mean predicted load measurement error was 0.1 ± 0.1%. This error was constant over all strains and was nonlinearly dependent on simulated modulus (Fig. 6(b)).
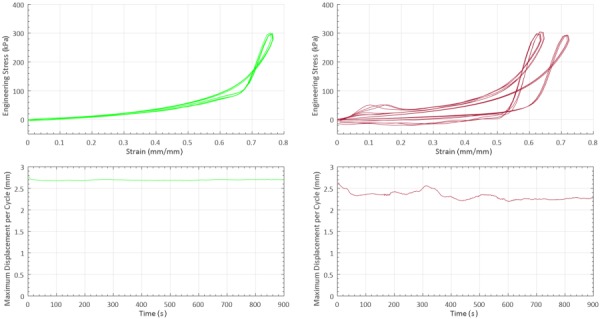
Adhesive Selection.
FabTech 90 (FabTech Systems, Everett, WA) was found to be the most effective adhesive. FabTech 90 created the strongest bonds with urethane-based elastomeric liners and bonds that were equal or greater in strength with silicone and TPE liners, relative to any of the other adhesives. While FabTech 90 could successfully bond all liners tested through at least five shear cycles, no adhesive was able to bond TPE liners throughout the duration of the 15 min cyclic test. All failures occurred between the elastomer and the adhesive. Failure modes were evident both in visual inspection of the specimen after testing, and in the resulting stress–strain curves. Edge peeling was characterized by a nonlinear (decreasing slope) stress–strain response, while a complete delamination was characterized by a sharp negative slope in the stress–strain response (Fig. 6(c)).
Tensile Elasticity
Specimen Attachment.
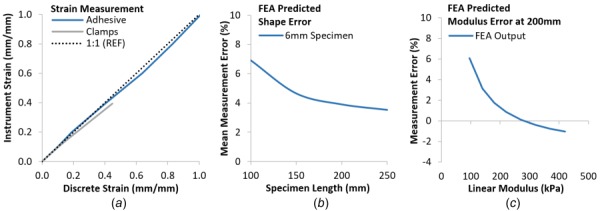
The manufacturer-supplied specimen grips demonstrated measurement error that increased with applied strain and an inability to provide sufficient fixation to hold a specimen beyond 45% strain (Fig. 7(a)). The custom adhesive fixture had a mean absolute error of 1.3 ± 2.1% and was able to provide fixation from 0 to 100% strain.
Fig. 7.
Tensile elasticity–error assessment: (a) adhesively mounted specimens minimized measurement error and increased the achievable maximum strain, (b) load measurement error decreased relative to specimen length, and (c) decreased with increased specimen stiffness at a length of 200 mm
Specimen Size.
Load measurement error decreased with increasing specimen length (Fig. 7(b)). The absolute specimen length was determined to be more important than length-to-thickness ratio in the tensile elasticity test because 210 mm was found to be the maximum length of the material that could be consistently removed from a liner. For the selected specimen length (210 mm), the FEA-predicted mean load measurement error was 1.2 ± 2.4%. Similar to shear, error was independent of strain and dependent on the simulated modulus (Fig. 7(c)).
Coefficient of Friction.
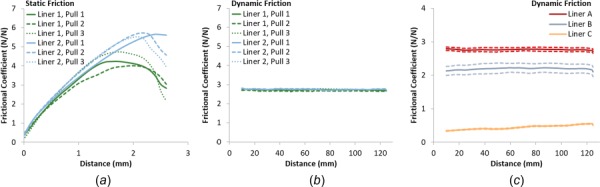
Static CoF measurements were less repeatable than dynamic CoF measurements. Comparing two liner samples of the same manufacturer and product, static CoF had a measured standard deviation of 0.75 across six pulls with two pieces of leather (Fig. 8(a)). Dynamic CoF for the same liners had a standard deviation of 0.02 (Fig. 8(b)). Measured dynamic CoFs were distinct across three different liner materials (i.e., urethane, silicone, and TPE) and roughly corresponded to the ranges of CoF reported in the literature [48,49] (Fig. 8(c)).
Fig. 8.
Coefficient of friction. Single liner model variability for (a) static and (b) dynamic friction. (c) mean and standard deviations of three liner models when measuring dynamic friction.
Volumetric Elasticity
Air Pockets.
Specimens without an air vent showed no clear linear response, while specimens with an air vent exhibited two distinct linear regions in the strain–strain curve (Fig. 9). Tangent modulus was evaluated from 200 to 500 kPa, and the measured modulus of the nonvented specimen (19,400 kPa) was an order of magnitude less than the vented specimen (114,000 kPa). This was evidence of a confounding factor, and indicated trapped air compressing at the bottom of the specimen well for the nonvented specimen (i.e., air has an adiabatic bulk modulus of 133 kPa [54]).
Fig. 9.
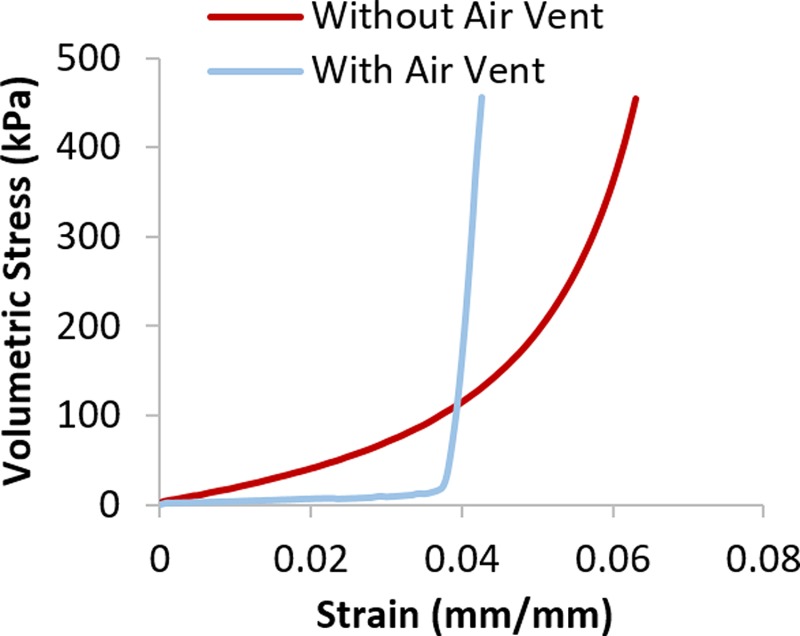
Volumetric elasticity–error assessment. Venting specimens significantly reduced the impact of air.
Thermal Conductivity.
Across the three liner products evaluated, the mean thermal conductivity without grease applied was 0.139 ± 0.002, 0.135 ± 0.002, and 0.173 ± 0.002 W/m K (Fig. 10). Mean thermal conductivities for the same samples after the application of thermal grease were 1.52 ± 0.002, 0.150 ± 0.003, and 0.193 ± 0.002 W/m K. The weight of thermal grease applied to each liner product was 1.56 ± 0.10, 0.98 ± 0.05, and 1.11 ± 0.02 g; the addition of grease resulted in a mean increase in thickness of 0.1 ± 0.1 mm.
Fig. 10.
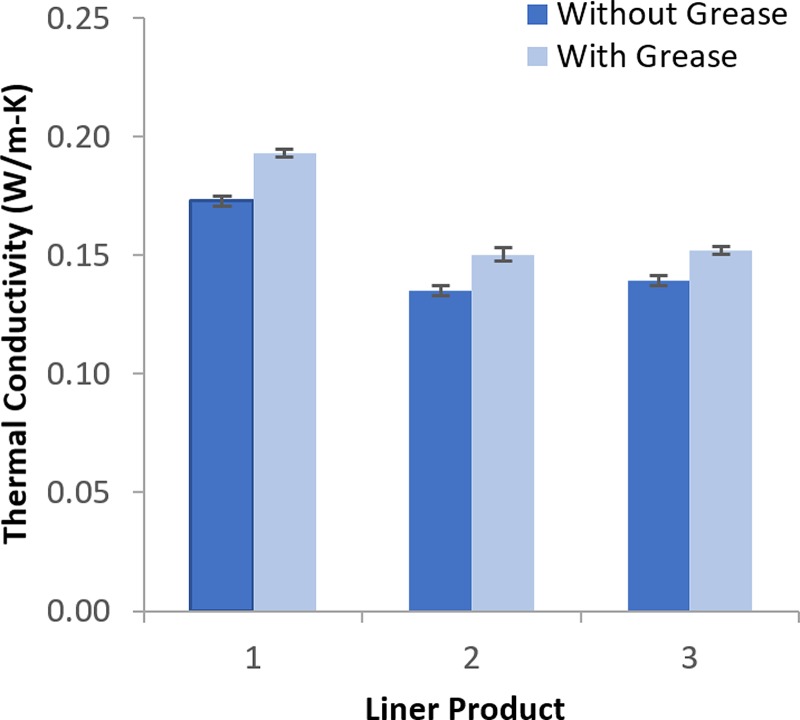
Thermal conductivity–error assessment. The absence of thermal grease resulted in a consistent change in thermal conductivity.
Discussion
The goal of this research was to design a set of standardized material property tests that would facilitate direct comparison of different prosthetic liner products. The unique composition of prosthetic liners (i.e., layered elastomer and fabric backing) required development of novel material tests suited to these materials. Rigorous tests were conducted to define and refine protocols that focused on repeatable results while minimizing measurement error.
To be consistent with material characterization guidelines and to ensure coherent material models for mechanical analysis [26], the final compressive elasticity test protocol was used as a template for the remaining material property tests. Final protocols consist of the same six fundamental steps, with preconditioning and end of test criteria being identical across all properties. Variations in sample geometry, preparation, conditioning, and measurement were specific to each material property test and based on instrument limitations, results of tests conducted for this study, and insights from the literature.
Compressive Elasticity
Protocol.
The compressive elasticity test protocol (Table 4) was the template to set test procedures needed to characterize a single liner sample. Three specimens per material property were collected when possible, and this was particularly important for tests with highly impactful factors (such as friction) since multiple samples helped identify invalid tests (e.g., poor lubrication).
Table 4.
Final test procedure for the measurement of compressive elasticity
| Preconditioning | Liner placed in a room controlled at 21 ± 1 °C for 24 h |
| Sample | Three circular specimens 19 mm (D) |
| Preparation | Specimens and test fixture lubricated (Outlast, C&C Synthetics) prior to installation |
| Conditioning | Cyclic compression at a constant rate of 100% strain per second to a stress maximum of 250 kPa for a total of 15 min |
| Measurement | Single compression at strain rates of 150% (dynamic) and 0.5% strain per second (quasi-static) |
| Test maximum was 60% strain or 500 kPa (whichever was lesser) | |
| End of test | Repeat measurement until consistent stress–strain response is achieved |
Sample.
A 19 mm specimen diameter should be used in the final test protocol. Specimens of three diameters were evaluated for the compressive elasticity test to determine the effect of aspect ratio and optimal specimen size. The observed linear increase in stiffness with increased specimen diameter was likely due to contributions from the fabric backing. As the elastomer flowed and expanded laterally, the fabric backing was placed under biaxial tension. Since the primary effect of a change in diameter was a parameter, as opposed to a confounding factor, 19 mm was chosen because it most closely matched the dimensions of sensors used in interface stress measurements reported in the literature [27–33].
Conditioning.
Specimens should be cyclically conditioned at 100% strain per second for 15 min prior to testing. This timeframe was chosen on the basis of stress relaxation guidelines that indicate that steady state is normally achieved 3–4 decades relative to the absolute time from minimum to maximum strain [21,22]. For example, at 100% strain per second, approximately 0.6 s are required to reach the 60% strain limit, and therefore specimen response should reach a steady state after 600–6000 s.
Measurement.
Strain rates of 150% and 0.5% per second should be used for the final test protocols to represent ambulatory (dynamic) and standing (quasi-static) loading conditions. Little difference was observed within the group of strain rates that corresponded to dynamic activity (50–150% per second). The only discernable change in stiffness due to viscoelastic effects was between dynamic and quasi-static responses.
Shear Elasticity
Protocol.
The shear elasticity test protocol (Table 5) differs from the compressive elasticity test protocol in the specifications of sample and conditioning. Compressive and shear elasticity tests were closely related in terms of their final protocols.
Table 5.
Final test procedure for the measurement of shear elasticity
| Preconditioning | Liner placed in a room controlled at 21 ± 1 °C for 24 h |
| Sample | One rectangular specimen 127 mm (H) × 32 mm (W) |
| Preparation | Specimens bonded to tabs (FabTech 90, FabTech Systems) prior to installation |
| Conditioning | None-adhesive could not withstand cyclic conditioning |
| Measurement | Single shear at strain rates of 150% (dynamic) and 0.5% strain per second (quasi-static) |
| Test maximum was 60% strain | |
| End of test | Repeat measurement until consistent stress–strain response is achieved |
Sample.
The specimen length should be 120 mm. FEA determined that specimen size required for an accurate measurement of shear elasticity was larger than expected. While ASTM D945 [15] recommended a nominal specimen size of 600 mm2 for a 12.5 mm thick specimen, results from the present testing indicated that the critical dimension was the specimen length along the displacement axis of the MTM. However, at this length only one shear specimen may be reliably extracted per liner when all other required specimen geometries are considered.
Conditioning.
Shear specimens should not be conditioned, as testing revealed that no combination of adhesives could successfully bond all liner products for 15 min. Instead, specimens were cyclically conditioned until a repeatable stress–strain response was achieved (typically two cycles).
Measurement.
As with compressive elasticity, interface pressures reported in the literature were used to validate the 60% strain limit for the shear elasticity test. MTM measured peak shear stresses in this study were 11 kPa for the softest liner and 50 kPa for the stiffest liner. These were similar to the reported mean and maximum shear stresses of 17 kPa and 59 kPa, respectively [27–32].
Tensile Elasticity
Protocol.
The tensile elasticity test protocol (Table 6) differs from the compressive elasticity test protocol in the specifications of sample, conditioning, and measurement. The motivation for changing the definition of sample conditioning is identical to shear, and is not discussed here.
Table 6.
Final test procedure for the measurement of tensile elasticity
| Preconditioning | Liner placed in a room controlled at 21 ± 1 °C for 24 h |
| Sample | One rectangular specimen 210 mm (H) × 32 mm (W) |
| Preparation | Specimens bonded to tabs (FabTech 90, FabTech Systems) prior to installation |
| Conditioning | None-adhesive could not withstand cyclic conditioning |
| Measurement | Single pull at displacement rates of 30 mm (dynamic) and 1 mm per second (quasi-static) |
| Test maximum was 60% strain or 500 kPa (whichever was lesser) | |
| End of test | Repeat measurement until consistent stress–strain response is achieved |
Sample.
FEA validation for the chosen specimen geometry predicted a mean load measurement error of 1.2%. Experimental results indicated that the lowest measured tangent modulus was approximately 120 kPa, and this correlated to a measurement error of 4%. While the FEA analysis assumed that liners were comprised of a linear isotropic material, the physical liners were orthotropic layered materials that exhibited a nonlinear (i.e., fabric dependent) stiffness. Since the fabric composition and thickness ratio varied by liner product, it was not possible to create a correction factor that would offer a consistent improvement in the measured property across all liners.
Measurement.
Similar to the compressive elasticity test, a 500 kPa test maximum should be imposed to provide an alternate upper limit. Some liners had directional fibers intended to stiffen axial elasticity while retaining a low elasticity in radial stretch. As a result, liner products with directional fibers are easy to stretch onto the limb during donning, but stiff and stable during swing phase. Finally, the tensile elasticity test was limited to 30 mm per second (approximately 20% strain per second) because it was the maximum displacement rate of the MTM test head.
Coefficient of Friction
Protocol.
The CoF test protocol (Table 7) varied from the compressive elasticity test protocol in the specifications of sample, conditioning, and measurement. The CoF and thermal conductivity tests are fundamentally different since they measure a single value coefficient rather than a stress–strain response. The available parameters and selected values used to set the specification for measurement are discussed in the methods.
Table 7.
Final test procedure for the measurement of coefficient of friction
| Preconditioning | Liner placed in a room controlled at 21 ± 1 °C for 24 h |
| Sample | (A) One rectangular liner specimen 210 mm (L) × 70 mm (W) |
| (B) Three rectangular leather specimens 63 mm (L) × 63 mm (W) | |
| Preparation | Liner specimens washed with hand soap and warm water then air dried |
| Conditioning | None |
| Measurement | Single pull at displacement rate of 150 mm per minute |
| Test maximum was 125 mm | |
| End of test | Repeat measurement until three consecutive pulls produce consistent responses |
Sample.
Leather samples should be tested per liner to reduce the influence of measurement variability. Since CoF measurement variability was relatively high, multiple specimens were desirable for this test. However, specimen size for frictional testing was the largest of the six material property tests, and it was not feasible to obtain more than one per liner.
Conditioning.
Conditioning should be a two-step process for each liner. First, to replicate clinical use, liners are washed with hand soap and warm water to remove any debris or residue and then allowed to air dry. Next, each leather sample is conditioned by repeated pulls until three consecutive pulls reported dynamic CoF within 0.05.
Volumetric Elasticity
Protocol.
The volumetric elasticity test protocol (Table 8) varied from the compressive elasticity test in the specifications of preparation, conditioning, and measurement. The (lack-of) conditioning is explained in the measurement definition.
Table 8.
Final test procedure for the measurement of volumetric elasticity
| Preconditioning | Liner placed in a room controlled at 21 ± 1 °C for 24 h |
| Sample | Three circular specimens 10 mm (D) |
| Preparation | Specimens and test fixture lubricated (Outlast, C&C Synthetics) prior to installation |
| Conditioning | None |
| Measurement | Single compressions at a strain rate of 0.1% strain per second |
| Test maximum was 500 kPa | |
| End of test | Repeat measurement until consistent stress–strain response is achieved |
Preparation.
Specimens should be lubricated and center punched with a large knitting needle during installation to produce the most consistent measurement response. Results indicated that center-punching improved accuracy and repeatability by allowing trapped air to escape. Similar to the compressive elasticity test, lubricating the specimens improved repeatability and facilitated the removal of air pockets.
Measurement.
Specimens should only be evaluated at a quasi-static rate (0.1% per second), and conditioned by repeating measurement until a consistent response is achieved. Results showed that a liner specimen's volumetric response could increase from 200 to 500 kPa in less than 0.3% strain (0.02 mm for a 6 mm thick liner), and therefore a quasi-static strain rate was needed to keep the MTM within safe operating conditions. Since a quasi-static test is not affected by viscoelastic behavior, decade-derived (15 min) cyclic conditioning was not necessary.
Thermal Conductivity
Protocol.
The thermal conductivity test protocol (Table 9) varied from the compressive elasticity test protocol in the specifications of sample, conditioning, and measurement. Similar to the CoF test, the available parameters and selected values used to set the measurement specifications for the thermal conductivity test are discussed in the methods. An important note is that the instrument used in this study (i.e., the Unitehrm 2022 HFM) was only able to set the mean specimen temperatures. If another instrument is used to perform this measurement, it should be set to the appropriate contact temperature range (10–40 °C) rather than match the mean specimen temperatures used by the Unitherm 2022.
Table 9.
Final test procedure for the measurement of thermal conductivity
| Preconditioning | Liner placed in a room controlled at 21 ± 1 °C for 24 h |
| Sample | One circular specimen 51 mm (D) |
| Preparation | Pneumatic piston pressure set to 69 kPa |
| Conditioning | Specimens compressed in instrument until constant thickness (15 min minimum) |
| Measurement | Two point thermal conductivity measurement with specimen contact temperatures of 10 and 40 °C |
| End of test | End of measurement |
Preparation.
Thermal grease should be omitted from specimens during the thermal conductivity test. While thermal grease was recommended by the standard [24], it was omitted to improve clinical applicability. Further, results showed that specimens tested without thermal grease had the same measurement repeatability as those with thermal grease.
Conditioning.
Specimens should be placed at a constant 69 kPa piston pressure until thickness is consistent (typically 15 min). Since the HFM requires static specimen geometry, conditioning by viscoelastic creep is most relevant.
Clinical Relevance
While the tests in this research focused on elastomeric liners, other materials such as foams (e.g., Pelite) have also been used as an interface material to couple limbs and sockets. Comparing liner materials from the present study to other biological and manufactured materials [40,55–57] (Fig. 11), elastomeric liners are seen to span the stiffness range of other common interface materials (i.e., prosthetic socks and foam liners). While foam and elastomeric liners have a similar stiffness, they have nearly opposite Poisson's ratios. The characteristic lateral expansion in compression (commonly called “flow” in the prosthetics industry) of elastomeric liners produce more distributed contact with the limb, and may be preferable to the weight savings of lower density foams.
Fig. 11.
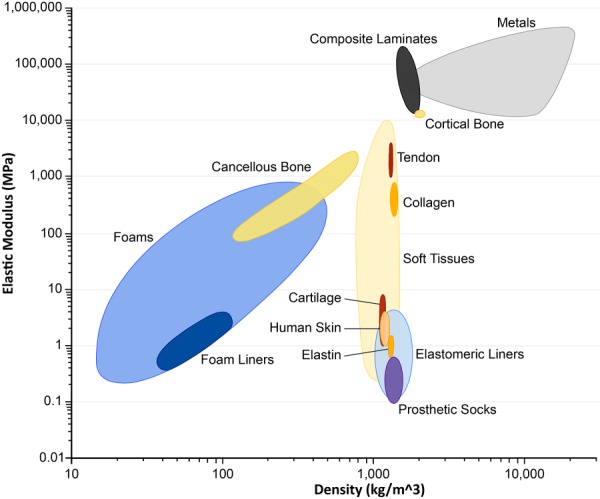
Materials comparison. Ashby plot of the materials contained in a human prosthesis system.
The test protocols developed in this study create a foundation for evidence-based standards of practice, by providing a means to quantitatively characterize and directly compare existing and emerging liner products. Each of the six properties can be associated with one or more characteristics that contribute to a prosthesis user's function, health, or quality of life. Each of the specified test properties typically offers contrasting responses to clinical challenges depending on the magnitude of the measured response (e.g., a high compressive elasticity can enhance stability, while a low compressive elasticity can enhance comfort). This emphasizes the need for practitioners to consider each of these properties when selecting a specific liner product for each individual patient.
Conclusions
There is a paucity of quantitative data on the mechanical behavior of elastomeric liners used in lower-limb prosthetics. This research produced a set of six, standardized material property tests that allow different liner materials to be objectively characterized and compared. Future research should apply these test methods to a selection of prosthetic liners to provide objective insight into clinical use and facilitate individualized liner selection. Additionally, these tests methods could produce data for mechanical analyses (e.g., FEA) that may provide insight into the compound loading conditions experienced inside a prosthesis.
Acknowledgment
Funding for this research was provided by the Institute of Child Health and Human Development of the National Institutes of Health under award number R01HD065766. The content is solely the responsibility of the authors and does not necessarily represent the official views of the National Institutes of Health. We also thank Alps, Össur, Otto Bock, Prosthetic Design, and WillowWood for donating the prosthetic liners used in this study.
Contributor Information
John C. Cagle, Department of Bioengineering, , University of Washington, , 3720 15th Avenue NE, Box 355061, , Seattle, WA 98195 , e-mail: jcagle@uw.edu
Per G. Reinhall, Department of Mechanical Engineering, , University of Washington, , Stevens Way, Box 352600, , Seattle, WA 98195 , e-mail: reinhall@uw.edu
Brian J. Hafner, Department of Rehabilitation Medicine, , University of Washington, , 1959 NE Pacific Street, Box 356490, , Seattle, WA 98195 , e-mail: bhafner@uw.edu
Joan E. Sanders, Department of Bioengineering, , University of Washington, , 3720 15th Avenue NE, Box 355061, , Seattle, WA 98195 , e-mail: jsanders@uw.edu
References
- [1]. Dillingham, T. R. , Pezzin, L. E. , and MacKenzie, E. J. , 2002, “ Limb Amputation and Limb Deficiency: Epidemiology and Recent Trends in the United States,” South. Med. J., 95(8), pp. 875–883. 10.1097/00007611-200208000-00018 [DOI] [PubMed] [Google Scholar]
- [2]. Pezzin, L. E. , Dillingham, T. R. , MacKenzie, E. J. , Ephraim, P. , and Rossbach, P. , 2004, “ Use and Satisfaction With Prosthetic Limb Devices and Related Services,” Arch. Phys. Med. Rehabil., 85(5), pp. 723–729. 10.1016/j.apmr.2003.06.002 [DOI] [PubMed] [Google Scholar]
- [3]. Meulenbelt, H. E. , Geertzen, J. H. , Jonkman, M. F. , and Dijkstra, P. U. , 2009, “ Determinants of Skin Problems of the Stump in Lower-Limb Amputees,” Arch. Phys. Med. Rehabil., 90(1), pp. 74–81. 10.1016/j.apmr.2008.07.015 [DOI] [PubMed] [Google Scholar]
- [4]. Latlief, G. , Elnitsky, C. , Hart-Hughes, S. , Phillips, S. L. , Adams-Koss, L. , Kent, R. , and Highsmith, M. J. , 2012, “ Patient Safety in the Rehabilitation of the Adult With an Amputation,” Phys. Med. Rehabil. Clin. North Am., 23(2), pp. 377–392. 10.1016/j.pmr.2012.02.011 [DOI] [PubMed] [Google Scholar]
- [5]. Vanicek, N. , Strike, S. , McNaughton, L. , and Polman, R. , 2009, “ Gait Patterns in Transtibial Amputee Fallers vs. Non-Fallers: Biomechanical Differences During Level Walking,” Gait Posture, 29(3), pp. 415–420. 10.1016/j.gaitpost.2008.10.062 [DOI] [PubMed] [Google Scholar]
- [6]. Miller, W. C. , Deathe, A. B. , Speechley, M. , and Koval, J. , 2001, “ The Influence of Falling, Fear of Falling, and Balance Confidence on Prosthetic Mobility and Social Activity Among Individuals With a Lower Extremity Amputation,” Arch. Phys. Med. Rehabil., 82(9), pp. 1238–1244. 10.1053/apmr.2001.25079 [DOI] [PubMed] [Google Scholar]
- [7]. Meulenbelt, H. E. , Geertzen, J. H. , Jonkman, M. F. , and Dijkstra, P. U. , 2011, “ Skin Problems Of the Stump in Lower Limb Amputees: 2. Influence on Functioning in Daily Life,” Acta Derm.–Venereol., 91(2), pp. 178–182. 10.2340/00015555-1023 [DOI] [PubMed] [Google Scholar]
- [8]. Whiteside, S. R. , 2015, Practice Analysis of Certified Practitioners, Whiteside S. R., ed., American Board for Certification in Orthotics, Prosthetics, & Pedorthotics, Alexandra, VA. [Google Scholar]
- [9]. Sanders, J. E. , Nicholson, B. S. , Zachariah, S. , Cassisi, D. , Karchin, A. , and Fergason, J. , 2004, “ Testing of Elastomeric Liners Used in Limb Prosthetics: Classification of 15 Products by Mechanical Performance,” J. Rehabil. Res. Dev., 41(2), pp. 175–186. 10.1682/JRRD.2004.02.0175 [DOI] [PubMed] [Google Scholar]
- [10]. Boutwell, E. , Stine, R. , Hansen, A. , Tucker, K. , and Gard, S. , 2012, “ Effect of Prosthetic Gel Liner Thickness on Gait Biomechanics and Pressure Distribution Within the Transtibial Socket,” J. Rehabil. Res. Dev., 49(2), pp. 227–240. 10.1682/JRRD.2010.06.0121 [DOI] [PubMed] [Google Scholar]
- [11]. Gholizadeh, H. , Osman, N. , Kamyab, M. , Eshraghi, A. , Abas, W. , and Azam, M. N. , 2012, “ Transtibial Prosthetic Socket Pistoning: Static Evaluation of Seal-In® X5 and Dermo® Liner Using Motion Analysis System,” Clin. Biomech., 27(1), pp. 34–39. 10.1016/j.clinbiomech.2011.07.004 [DOI] [PubMed] [Google Scholar]
- [12]. Emrich, R. , and Slater, K. , 1998, “ Comparative Analysis of Below-Knee Prosthetic Socket Liner Materials,” J. Med. Eng. Technol., 22(2), pp. 94–98. 10.3109/03091909809010005 [DOI] [PubMed] [Google Scholar]
- [13]. Covey, S. , Muonio, J. , and Street, G. , 2000, “ Flow Constraint and Loading Rate Effects on Prosthetic Liner Material and Human Tissue Mechanical Response,” J. Prosthetics Orthotics, 12(1), pp. 15–32. 10.1097/00008526-200012010-00007 [DOI] [Google Scholar]
- [14]. Hafner, B. J. , Cagle, J. C. , Allyn, K. J. , and Sanders, J. E. , 2016, “ Elastomeric Liners for People With Transtibial Amputation: Survey of Prosthetists' Clinical Practices,” Prosthetics Orthotics Int., (e-pub). 10.1177/0309364616661256 [DOI] [PMC free article] [PubMed] [Google Scholar]
- [15].ASTM, 2006, “ Standard Test Methods for Rubber Properties in Compression or Shear (Mechanical Oscillograph),” American Society for Testing and Materials, West Conshohocken, PA, Standard No. ASTM D945-06. 10.1520/D0945-06 [DOI]
- [16].ASTM, 2008, “ Standard Test Method for Static and Kinetic Coefficients of Friction of Plastic Film and Sheeting,” American Society for Testing and Materials, West Conshohocken, PA, Standard No. ASTM D1894-08. 10.1520/D1894 [DOI]
- [17].ASTM, 2007, “ Standard Practice for Rubber Conditioning For Low Temperature Testing,” American Society for Testing and Materials, West Conshohocken, PA, Standard No. ASTM D832-07. 10.1520/D0832-07 [DOI]
- [18].ASTM, 2008, “ Standard Test Methods for Vulcanized Rubber and Thermoplastic Elastomers–Tension,” American Society for Testing and Materials, West Conshohocken, PA, Standard No. ASTM D412-06a. 10.1520/D0412-06 [DOI]
- [19].ASTM, 2008, “ Standard Practice for Rubber–Measurement of Dimensions,” American Society for Testing and Materials, West Conshohocken, PA, Standard No. ASTM D3767-03. 10.1520/D3767-03 [DOI]
- [20].ASTM, 2007, “ Standard Practice for Thermoplastic Elastomers–Terminology and Abbreviations,” American Society for Testing and Materials, West Conshohocken, PA, Standard No. ASTM D5538-07. 10.1520/D5538 [DOI]
- [21].ASTM, 2007, “ Standard Practice for Stress Relaxation Testing of Raw Rubber, Unvulvanized Rubber Compounds, and Thermoplastic Elastomers,” American Society for Testing and Materials, West Conshohocken, PA, Standard No. ASTM D6048-07. 10.1520/D6048-07 [DOI]
- [22].ASTM, 2008, “ Standard Test Method for Vulcanized Rubber and Thermoplastic Elastomer Determination of Force Decay (Stress Relaxation) in Compression,” American Society for Testing and Materials, West Conshohocken, PA, Standard No. ASTM D6147-97. 10.1520/D6147-97R14 [DOI]
- [23].ASTM, 2008, “ Standard Guide for Reporting Properties for Plastics and Thermoplastic Elastomers,” American Society for Testing and Materials, West Conshohocken, PA, Standard No. ASTM D6436-08. 10.1520/D6436 [DOI]
- [24].ASTM, 2006, “ Standard Test Method for Evaluating the Resistance to Thermal Transmission of Materials by the Guarded Heat Flow Meter Technique,” American Society for Testing and Materials, West Conshohocken, PA, Standard No. ASTM E1530-06. 10.1520/E1530-11R16 [DOI]
- [25]. Dalrymple, T. , Choi, J. , and Miller, K. , 2007, “ Elastomer Rate-Dependence: A Testing and Material Modeling Methodology,” 172nd Technical Meeting of the Rubber Division of the American Chemical Society (ACS), Cleveland, OH, Oct. 16–18.http://www.axelproducts.com/downloads/Elastomer_Rate_Dependence_Presentation.pdf
- [26]. Miller, K. , 2008, “ Testing Elastomers for Hyperelastic Material Models in Finite Element Analysis,” Axel Products, Inc., Ann Arbor, MI.http://www.axelproducts.com/downloads/TestingForHyperelastic.pdf
- [27]. Sanders, J. E. , Zachariah, S. , Jacobsen, A. K. , and Fergason, J. , 2005, “ Changes in Interface Pressures and Shear Stresses Over Time on Trans-Tibial Amputee Subjects Ambulating With Prosthetic Limbs: Comparison of Diurnal and Six-Month Differences,” J. Biomech., 38(8), pp. 1566–1573. 10.1016/j.jbiomech.2004.08.008 [DOI] [PubMed] [Google Scholar]
- [28]. Sanders, J. E. , Fergason, J. R. , Zachariah, S. , and Jacobsen, A. K. , 2002, “ Interface Pressure and Shear Stress Changes With Amputee Weight Loss: Case Studies From Two Trans-Tibial Amputee Subjects,” Prosthetics Orthotics Int., 26(3), pp. 243–250. 10.1080/03093640208726654 [DOI] [PubMed] [Google Scholar]
- [29]. Sanders, J. E. , Greve, J. , Clinton, C. , and Hafner, B. J. , 2000, “ Changes in Interface Pressure and Stump Shape Over Time: Preliminary Results From a Trans-Tibial Amputee Subject,” Prosthetics Orthotics Int., 24(2), pp. 163–168. 10.1080/03093640008726539 [DOI] [PubMed] [Google Scholar]
- [30]. Sanders, J. E. , Zachariah, S. , Baker, A. B. , Greve, J. , and Clinton, C. , 2000, “ Effects of Changes in Cadence, Prosthetic Componentry, and Time on Interface Pressures and Shear Stresses of Three Trans-Tibial Amputees,” Clin. Biomech., 15(9), pp. 684–694. 10.1016/S0268-0033(00)00026-7 [DOI] [PubMed] [Google Scholar]
- [31]. Sanders, J. E. , and Daly, C. H. , 1999, “ Interface Pressures and Shear Stresses: Sagittal Plane Angular Alignment Effects in Three Trans-Tibial Amputee Case Studies,” Prosthetics Orthotics Int., 23, pp. 21–29.http://www.oandplibrary.org/poi/pdf/1999_01_021.pdf [DOI] [PubMed] [Google Scholar]
- [32]. Sanders, J. E. , Lam, D. , Dralle, A. , and Okumura, R. , 1997, “ Interface Pressures and Shear Stresses at Thirteen Socket Sites on Two Persons With Transtibial Amputation,” J. Rehabil. Res. Dev., 34(1), pp. 19–43.https://pdfs.semanticscholar.org/d595/f52f42e8b2e41aebfb9d2cade4240d50e831.pdf [PubMed] [Google Scholar]
- [33]. Ali, S. , Osman, N. , Mortaza, N. , Eshraghi, A. , Gholizadeh, H. , and Abas, W. , 2012, “ Clinical Investigation of the Interface Pressure in the Trans-Tibial Socket With Dermo and Seal-In X5 Liner During Walking and Their Effect on Patient Satisfaction,” Clin. Biomech., 27(9), pp. 943–948. 10.1016/j.clinbiomech.2012.06.004 [DOI] [PubMed] [Google Scholar]
- [34]. Mooney, M. , 1940, “ A Theory of Large Elastic Deformation,” J. Appl. Phys., 11(9), pp. 582–592. 10.1063/1.1712836 [DOI] [Google Scholar]
- [35]. Beatty, M. , 1987, “ Topics in Finite Elasticity: Hyperelasticity of Rubber, Elastomers, and Biological Tissues–With Examples,” ASME Appl. Mech. Rev., 40(12), pp. 1699–1734. 10.1115/1.3149545 [DOI] [Google Scholar]
- [36]. Meulenbelt, H. E. , Geertzen, J. H. , Dijkstra, P. U. , and Jonkman, M. F. , 2006, “ Skin Problems in Lower Limb Amputees: An Overview by Case Reports,” J. Eur. Acad. Dermatol., 21(2), pp. 147–155. 10.1111/j.1468-3083.2006.01936.x [DOI] [PubMed] [Google Scholar]
- [37]. Portnoy, S. , Siev-Ner, I. , Shabshin, N. , and Gefen, A. , 2011, “ Effects of Sitting Postures on Risks for Deep Tissue Injury in the Residuum of a Transtibial Prosthetic-User: A Biomechanical Case Study,” Comput. Methods Biomech. Biomed. Eng., 14(11), pp. 1009–1019. 10.1080/10255842.2010.504719 [DOI] [PubMed] [Google Scholar]
- [38]. Sanders, J. E. , Cagle, J. C. , Allyn, K. J. , Harrison, D. S. , and Ciol, M. A. , 2014, “ How do Walking, Standing, and Resting Influence Transtibial Amputee Residual Limb Fluid Volume?,” J. Rehabil. Res. Dev., 51(2), pp. 201–212. 10.1682/JRRD.2013.04.0085 [DOI] [PMC free article] [PubMed] [Google Scholar]
- [39]. Sanders, J. E. , and Fatone, S. , 2011, “ Residual Limb Volume Change: Systematic Review of Measurement and Management,” J. Rehabil. Res. Dev., 49(8), pp. 949–986. 10.1682/JRRD.2010.09.0189 [DOI] [PMC free article] [PubMed] [Google Scholar]
- [40]. Zhang, M. , Lord, M. , Turner-Smith, A. R. , and Roberts, V. C. , 1995, “ Development of a Non-Linear Finite Element Modelling of the Below-Knee Prosthetic Socket Interface,” Med. Eng. Phys., 17(8), pp. 559–566. 10.1016/1350-4533(95)00002-5 [DOI] [PubMed] [Google Scholar]
- [41]. Holzapfel, G. A. , and Ogden, R. W. , 2009, “ On Planar Biaxial Tests for Anisotropic Nonlinearly Elastic Solids. A Continuum Mechanical Framework,” Math. Mech. Solids, 14(5), pp. 474–489. 10.1177/1081286507084411 [DOI] [Google Scholar]
- [42]. Zhang, M. , Zheng, Y. P. , and Mak, A. , 1997, “ Estimating the Effective Young's Modulus of Soft Tissues From Indentation Tests—Nonlinear Finite Element Analysis of Effects of Friction and Large Deformation,” Med. Eng. Phys., 19(6), pp. 512–517. 10.1016/S1350-4533(97)00017-9 [DOI] [PubMed] [Google Scholar]
- [43]. Miller, K. , 2008, “ Compression or Biaxial Extension?,” Axel Products, Inc., Ann Arbor, MI: http://www.axelproducts.com/downloads/CompressionOrBiax.pdf [Google Scholar]
- [44]. Stucke, S. , McFarland, D. , Goss, L. , Fonov, S. , McMillan, G. R. , Tucker, A. , Berme, N. , Guler, H. C. , Bigelow, C. , and Davis, B. L. , 2012, “ Spatial Relationships Between Shearing Stresses and Pressure on the Plantar Skin Surface During Gait,” J. Biomech., 45(3), pp. 619–622. 10.1016/j.jbiomech.2011.11.004 [DOI] [PMC free article] [PubMed] [Google Scholar]
- [45]. Jee, T. , and Komvopoulos, K. , 2014, “ In Vitro Investigation of Skin Damage Due to Microscale Shearing,” J. Biomed. Mater. Res. Part A, 102(11), pp. 4078–4086. 10.1002/jbm.a.35055 [DOI] [PubMed] [Google Scholar]
- [46]. Meulenbelt, H. E. , Geertzen, J. H. , Jonkman, M. F. , and Dijkstra, P. U. , 2011, “ Skin Problems of the Stump in Lower Limb Amputees—1: A Clinical Study,” Acta Derm.–Venereol., 91(2), pp. 173–177. 10.2340/00015555-1040 [DOI] [PubMed] [Google Scholar]
- [47]. Ahmad, A. , 2009, “ Prosthetic Problems of Transtibial Amputee,” J. Postgrad. Med. Inst., 23(2), pp. 155–158.http://www.jpmi.org.pk/index.php/jpmi/article/view/80 [Google Scholar]
- [48]. Zhang, M. , and Mak, A. F. T. , 1999, “ In Vivo Friction Properties of Human Skin,” Prosthetics Orthotics Int., 23(2), pp. 135–141.http://www.oandplibrary.org/poi/pdf/1999_02_135.pdf [DOI] [PubMed] [Google Scholar]
- [49]. Visscher, M. O. , Robinson, M. , Fugit, B. , Rosenberg, R. J. , Hoath, S. B. , and Wickett, R. R. , 2011, “ Amputee Skin Condition: Occlusion, Stratum Corneum Hydration and Free Amino Acid Levels,” Arch. Dermatol. Res., 303(2), pp. 117–124. 10.1007/s00403-010-1111-y [DOI] [PubMed] [Google Scholar]
- [50]. Sanders, J. E. , Allyn, K. J. , Harrison, D. S. , Myers, T. R. , Ciol, M. A. , and Tsai, E. C. , 2012, “ Preliminary Investigation of Residual-Limb Fluid Volume Changes Within One Day,” J. Rehabil. Res. Dev., 49(10), pp. 1467–1478. 10.1682/JRRD.2011.12.0236 [DOI] [PMC free article] [PubMed] [Google Scholar]
- [51]. Ungley, C. C. , and Durh, M. D. , 1942, “ Peripheral Vasoneuropathy After Chilling “Immersion Foot and Immersion Hand”,” Lancet, 240(6216), pp. 447–451. 10.1016/S0140-6736(00)58135-5 [DOI] [Google Scholar]
- [52]. Irzmańska, E. , Lipp-Symonowicz, B. , Kujawa, J. , and Irzmański, R. , 2010, “ Textiles Preventing Skin Damage,” Fibres Text. East. Eur., 79(2), pp. 84–90.http://www.fibtex.lodz.pl/article342.html [Google Scholar]
- [53]. Hartley, T. L. , 2012, “ Bioimpedance Analysis to Determine the Effect of Pressure Release on Limb Fluid Volume Change in Persons With Transtibial Limb Loss,” Masters thesis, University of Washington, Seattle, WA.https://digital.lib.washington.edu/researchworks/bitstream/handle/1773/20900/Hartley_washington_0250O_10259.pdf?sequence=1
- [54]. Pierrus, J. , and de Lange, O. L. , 1997, “ Experimental and Theoretical Study of Adiabatic, Intermediate, and Isothermal Oscillations in Air,” Phys. Rev. E, 56(3), pp. 2841–2850. 10.1103/PhysRevE.56.2841 [DOI] [Google Scholar]
- [55]. Ashby, M. F. , 2011, Material Selection in Mechanical Design, 4th ed., Butterworth-Heinemann Burlington, MA. [Google Scholar]
- [56]. Sanders, J. E. , Cagle, J. C. , Harrison, D. S. , and Karchin, A. , 2012, “ Amputee Socks: How Does Sock Ply Relate to Sock Thickness?,” Prosthetics Orthotics Int., 36(1), pp. 77–86. 10.1177/0309364611431290 [DOI] [PMC free article] [PubMed] [Google Scholar]
- [57]. Sanders, J. E. , Greve, J. , Mitchell, S. , and Zachariah, S. , 1998, “ Material Properties of Commonly-Used Interface Materials and Their Static Coefficients of Friction With Skin and Socks,” J. Rehabil. Res. Dev., 35(2), pp. 161–176.http://www.rehab.research.va.gov/jour/98/35/2/pdf/sanders.pdf [PubMed] [Google Scholar]