Abstract
Two size-based separation strategies are evaluated for suspensions consisting of giant unilamellar vesicles with a broad, continuous distribution of diameters. Microfluidic devices were designed to separate an initial suspension into larger and smaller particles via either filtration or inertial focusing. These separation mechanisms were tested with suspensions of vesicles and suspensions of rigid spheres separately to illustrate the effect of deformability on separation ability. We define several separation metrics to assess the separation ability and to enable comparison between separation strategies. The filtration device significantly reduced the polydispersity of the separated vesicle fractions relative to the starting suspension and displayed an ability to separate vesicle suspensions at high throughputs. The device that utilized inertial focusing exhibited adequate polydispersity reduction and performed best with diluted vesicle suspensions. The inertial device had fewer issues with debris and trapped air, leading to short device preparation times and indicating a potential for continuous separation operation.
INTRODUCTION
Many diagnostic applications depend on the ability to separate suspensions of cells into components of interest. Microfluidic devices provide ways to conduct these separations without requiring the extra step of cell labeling, which could change the properties of cell. Microfluidics also offers a low cost approach by requiring minimal sample amounts and easily accessible equipment.1–3 Most separation devices are tested on rigid spherical particles or with suspensions of red blood cells (RBCs); however, devices showing good separation results with rigid particles do not necessarily yield the same performance when using a suspension of deformable particles.4,5 Testing separation devices with suspensions of vesicles allows for the effect of deformability to be included, while also providing the ability to investigate a broader range of particle sizes than those that are available from testing a suspension of cells.
Besides the advantages of using vesicles to test the separation devices, vesicle suspensions have intrinsic value for study after the separation process. Vesicles serve as a simple model for cells as they exhibit behavior similar to RBCs in channel flow conditions,6,7 and they have potential as drug delivery vehicles.8 The thin lipid membrane of vesicles is characterized by a resistance to bending, but, unlike the membrane of RBCs, it is fluid and offers negligible resistance to shear. Experiments have been conducted on single vesicles in simple Poiseuille flow in an attempt to understand the physics behind vesicle migration lateral to the flow direction;9 extensive computational investigations into what controls the flow behavior of vesicle suspensions have also been conducted.10–18 The theory and computational studies have so far only considered either monodisperse or bidisperse suspensions, leading to a need for vesicle suspensions with reduced polydispersity—such as those that have undergone size separation—if experiments to study the collective migration behavior of vesicle suspensions are to be performed and compared to the theory and simulation.
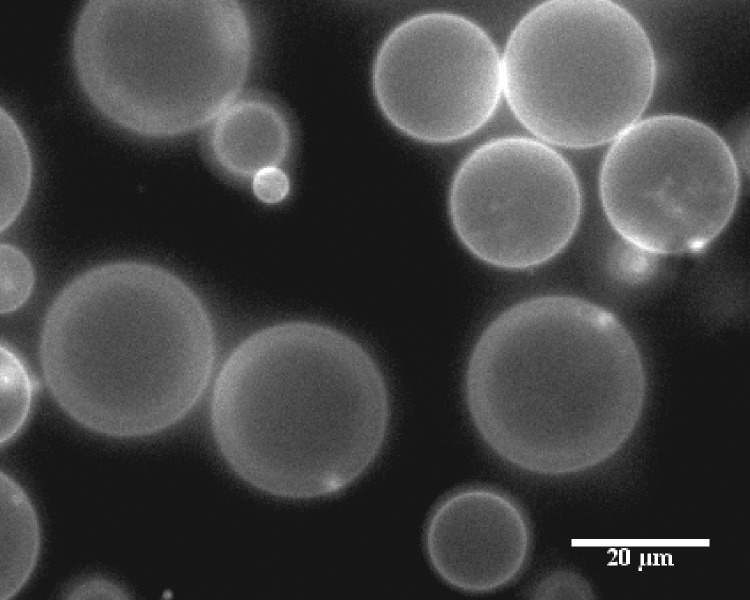
Experimental studies of suspension flow behavior of vesicles require, ideally, the ability to generate suspensions of monodisperse, deformable particles; however, generation of monodisperse giant unilamellar vesicles can be very difficult. Microfluidic methods19 that have been tried include utilizing water-oil-water emulsions,20,21 but this process is very sensitive to initial startup conditions and tailoring the hydrophobicity/hydrophilicity of channel walls and has not yet been optimized for consistent generation of vesicles. Electroformation22 is a technique that produces many unilamellar (rather than multilamellar) vesicles, but the suspension produced is usually very polydisperse with a wide range of vesicle sizes (Fig. 1). Other methods23,24 that generate vesicles include gentle hydration, extrusion, and sonication, but these methods produce predominantly multilamellar vesicles or vesicles that are less than 1 micron in diameter, much smaller than the size range of interest, around 10–20 μm, which is of the same order as cells.
FIG. 1.
Polydisperse vesicles produced via electroformation.
An alternative to microfluidic generation of monodisperse vesicles is to make polydisperse suspensions followed by size-based separation to produce suspensions with limited polydispersity. Label-free separation methods are attractive due to their ability to preserve the original vesicle (or cell) properties. These include filtration via obstacles (by weirs, pillars, cross-flows, or membranes), hydrodynamic filtration and pinched flow fractionation, deterministic lateral displacement, and inertial focusing, among others.3 Here, we consider two separation schemes from this group: a cross-flow filter (that utilizes a size exclusion mechanism) and an inertial focusing separator. The filter was chosen because this design has shown promising results for use with vesicles;25 however, the extent to which this device reduced the suspension polydispersity was unclear. The inertial device4 was chosen because of positive results on suspensions of rigid spheres and its potential for adjusting the focusing size cutoff through changing only the device depth. The chosen designs have the potential to be implemented in a cascade for improved separation, and both device footprints are small, lending themselves to parallelization for higher throughput. These two separation schemes are easy to implement, as they do not require extra equipment to generate external fields (e.g., magnetic, acoustic, and optical), which other label-free methods might employ. An additional advantage is the potential for extended runtime and continuous separation.
Below, we discuss the two separation mechanisms in detail and describe different microfluidic devices that were used in this investigation. Metrics to evaluate the separation ability are also defined. Devices were fabricated and tested with a suspension of rigid spheres and polydisperse suspensions of vesicles produced via electroformation. A discussion of the efficacy of the two approaches is given below.
Separation metrics
A variety of measures are reported in the literature to evaluate separation devices. The metrics used depend heavily on the suspension that is being separated and the target component. Gossett et al. summarized the metrics for separation devices that sorted cells as follows: throughput, recovery, separation resolution, enrichment, and purity or efficiency.3 Definitions of these metrics can vary between different groups of researchers, but the most commonly reported values are some form of throughput, enrichment, separation efficiency, and purity. Throughput () can be reported in terms of the volumetric flow rate, often multiplied by a volume fraction or cell density to include the effects of dilution.
| (1) |
For the following separation metrics, it should be noted that recovered suspensions (after separation) from a fraction of the device outlets are recombined before analysis; this is done to maximize the recovery volume and evaluate the device's ability to separate the initial suspension into two groups: a large vesicle suspension and a small vesicle suspension. These recombined suspension outlet streams are denoted as the subscript chosen fraction; they may consist either of the fraction that contains more of the large vesicles or the fraction that contains more of the smaller vesicles.
Enrichment () entails dividing the ratio of the target particle count () to contaminant particle count () in a specific fraction of outlets by the ratio of the target count to contaminant count at the inlet
| (2) |
The separation efficiency () can be defined as the number of target particles in a separated fraction divided by the total number of target particles recovered
| (3) |
Here, purity () is defined as the number of target particles in a chosen fraction divided by the total number of particles (both the target and contaminants) recovered from that fraction.
| (4) |
These separation metrics, in one form or another, have typically been used by groups that tested their devices on suspensions with clearly differentiated components (e.g., suspensions of rigid spherical particles of well-separated sizes,26–28 suspensions of blood containing platelets, RBCs, and white blood cells,29–32 bacteria,33 and tumor cells34,35).5,36
Many suspensions, however, are composed of particles that are not as easily segregated into categories but are instead characterized by a continuous distribution of sizes. These suspensions include emulsion droplets, vesicles, and some cell populations with a highly polydisperse distribution of sizes for a single component. Because these suspensions consist of one component, the target population is identified using a size cutoff,4,25,37 where the target population is either above or below this cutoff and the contaminant population consists of the remaining sizes. The size cutoff value depends on the end application for the suspension of interest and can be attained by adjusting different design or runtime parameters of the separation device. Establishing a size cutoff allows for the previously defined separation metrics to be calculated for vesicle suspensions and provides a way to compare the separation of vesicles to the separation of rigid spheres or cell suspensions.
The polydispersity index (PDI) is commonly used in describing the breadth of the molecular weight distribution in polymers for which the synthesis creates a broad, smooth distribution of molecular weights. The size (i.e., diameter) histograms produced through vesicle analysis provide analogous data which can also be characterized by a mean vesicle diameter and a PDI.38,39 The PDI is simply related to the mean and standard deviation of the distribution by
| (5) |
Note that corresponds to a monodisperse population, where all particles are of identical size; larger values of the PDI correspond to broader distributions. The mean and PDI are related to the first and second moments of the distribution and provide meaningful separation metrics as long as the distributions remain close to normal distributions. However, for highly asymmetric or skewed distributions (such as the bidisperse suspensions of spheres considered below), these metrics are less useful. For our vesicle suspensions, the means and PDIs for different devices averaged over several experiments are reported in the supplementary material. In addition to this information, the difference between the mean diameter of vesicles in the collected suspension fraction that contains more particles that are larger than the cutoff size (this separated suspension fraction is denoted as ) and the mean diameter of particles in the collected suspension fraction that contains predominantly particles below the cutoff size (known as ) is reported as . The difference in the polydispersity index () between the PDI of the initial suspension () and the PDI of the large particle fraction is also reported.
MATERIALS AND METHODS
Separation mechanisms and device design
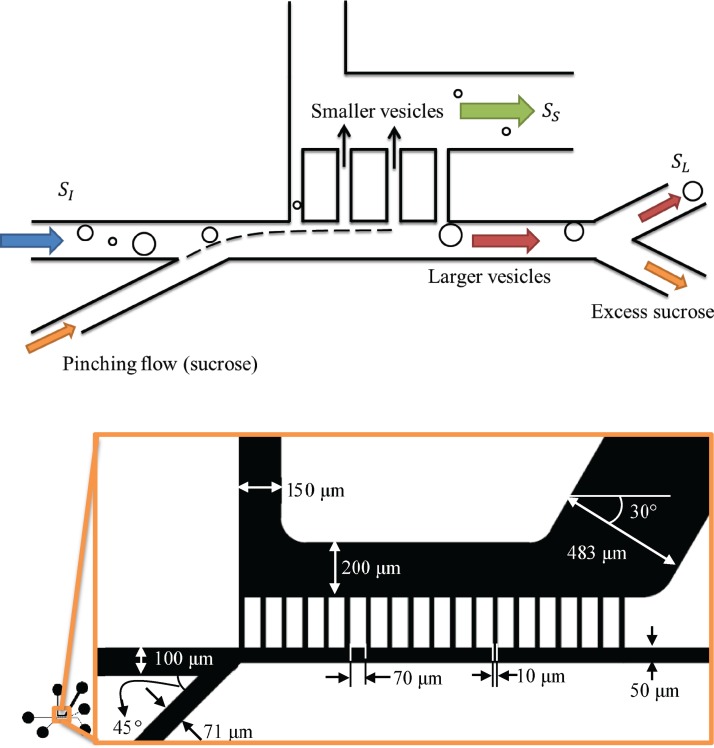
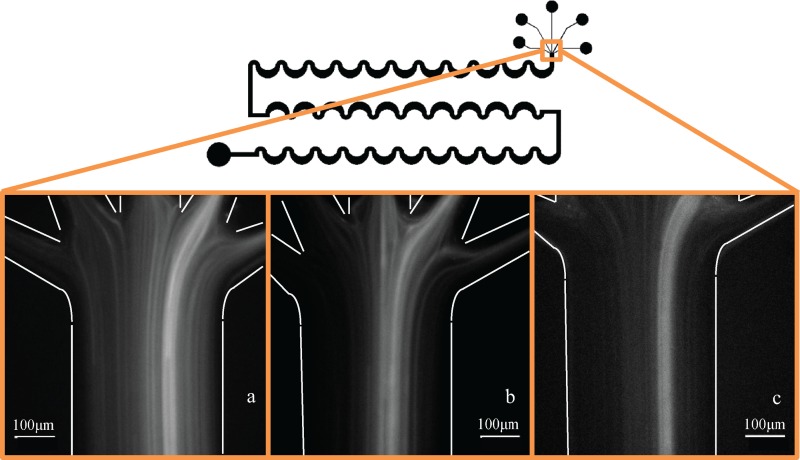
Two separation mechanisms are investigated: filtration via a size exclusion mechanism and inertial focusing. The size exclusion filter was adapted from the study by Woo et al.25 (Fig. 2); it utilizes 19 filter channels that are 10 μm wide to remove vesicles below this size from the rest of the suspension. A pinching flow, introduced at the start of the filter section, along with wide outlet channels downstream of the filter (150 μm or larger), facilitates the flow of the suspension through the filter channels. The volumetric flow rate of the pinching flow was kept at one third that of the suspension volumetric flow rate; the total flow rate through the device was 667 μl/h, chosen after consideration of the work done by Woo et al.25 The smaller filter channels offer more resistance to or exclude the larger vesicles, while allowing the smaller vesicles to flow through. Outlets placed downstream of the filter section collect a suspension of mostly small vesicles, while outlets along the main channel collect fluid that bypasses the filter and collect mostly large vesicles. The height of the device was either 30 μm or 60 μm for the vesicle experiments and was 50 μm for the sphere experiments to mitigate clogging of the filter channels. 30 μm was chosen as a minimum height since the vesicle size of interest was around 10–20 μm. A bifurcation is introduced in the main channel after the filter section to skim off the excess sucrose that was introduced by the pinching flow. Three different bifurcation designs were used. These are illustrated schematically in Fig. 3. One has the large vesicles pulled off the main channel first [Fig. 3(a)], another has the skimmed sucrose pulled off of the main channel first [Fig. 3(b)], and the third design has the bifurcation as a Y-shape, where the vesicles and excess sucrose diverge from the main channel at the same location [Fig. 3(c)].
FIG. 2.
Schematic of filter design. (Top) Size exclusion mechanism. (Bottom) Design parameters.
FIG. 3.
(a) Filter1 bifurcation design. (b) Filter2 bifurcation. (c) Filter3 bifurcation.
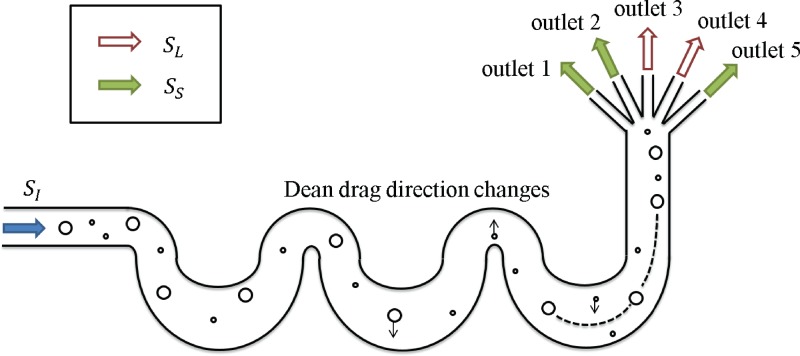
The inertial separator is based on a design proposed and discussed by Di Carlo et al.4 (Fig. 4). The inertial separator is run at higher flow rates so that fluid inertia affects the particle behavior. The inertial flow regime falls in a Reynolds (Re) number range of 10–200. Re is defined here as
| (6) |
where is the fluid density, is the fluid viscosity, is the hydraulic diameter of the channel, and is the average flow velocity in the channel. Inertial lift forces and Dean drag forces introduced by the curving channels compete; both of these hydrodynamic forces depend on particle size. If the particle diameter is above a certain size cutoff, the inertial lift forces dominate and the particles will focus to a narrow band of streamlines by the end of the channel. If the particles are small, the Dean flow dominates and induces mixing in the channel as the direction of the drag changes with the curvature of the serpentine walls; thus, smaller particles remain unfocused by the end of the channel. The larger particles will leave via one or two of the multiple outlets and can be collected and used for other studies.
FIG. 4.
Schematic of inertial separator design.
Deformability of vesicles introduces a lift force40 in addition to the inertial lift and Dean drag that rigid particles experience in these channels. In general, the lift force due to deformability directs the particle towards the channel center,41 although an investigation by Hur et al.42 reported observations of deformable droplets migrating to equilibrium positions that were closer than expected to the channel wall when the ratio of internal to external viscosity fell below a threshold value. While deformability may affect the final equilibrium positions of migrating particles, inertial focusing and Dean drag mixing are still observed in this system and others.4,43,44 Thus, the focusing behavior and separation behavior of vesicles in this device are expected to be similar to those of rigid spheres.
The device height for the inertial separator was modified to work with different suspensions of interest. Changing the height of the device allowed for different size cutoffs during the separation; a device height of 145 μm was chosen for the following vesicle and sphere experiments based on particle cutoff size calculations proposed by Di Carlo et al.4 The empirical relation for the hydraulic diameter () and cut-off diameter () is described by Di Carlo as follows:
| (7) |
where and are the cutoff diameter and the hydraulic diameter, respectively, found in the results of Di Carlo's work (at Re = 115, = 4 μm, and = 90 μm), and and are the hydraulic diameter and particle cutoff size for a new device and can be used to predict the proper device dimensions for a desired cutoff diameter. Due to interest in obtaining two suspensions of large unilamellar vesicles with average diameters of either 10 μm (as a model for red blood cell suspensions) or 20 μm (as a rough approximation for leukocytes or other cells), a cutoff size between 10 and 20 μm is desired. These devices were prepared with the dry film photoresist protocol (described below) that utilizes a photoresist film of predefined thickness. A channel height of 145 μm is accessible, and an inertial separation device with these dimensions has an expected size cutoff of 13 μm, which falls between 10 and 20 μm as desired.
Microfabrication
Microfluidic devices were fabricated using standard soft lithography techniques. Designs were drawn using AutoCAD (Autodesk), and masks were printed on mylar by Fine Line Imaging (Colorado Springs, CO). Device masters were fabricated with either SU-8 2050 photoresist from MicroChem on silicon wafers or by using a dry film photoresist (Riston GoldMaster GM130 photoresist, DuPont) that was laminated in multiple layers onto stainless steel wafers. Following exposure, this dry film photoresist can be developed away with a 1% K2CO3 solution, a much quicker and more benign process relative to the SU-8 development. The development of the unexposed dry film photoresist must be performed meticulously, as high aspect ratio (AR) channels (channel height/channel width >1) are prone to overdevelopment and subsequent delamination from the substrate. For the inertial device, development of channels resulting in an AR of about 4 was obtained. Additional details of the dry film photoresist process can be found in the study by Khalkhal et al.45
The Sylgard® 184 Silicon Elastomer Kit (Dow Corning) was used to make polydimethylsiloxane (PDMS) devices from the fabricated masters. The elastomer base was thoroughly mixed with the elastomer curing agent in a 10:1 ratio. This mixture was left to degas under vacuum for 30 min to an hour at room temperature. The degassed PDMS was poured over the master mold and degassed for another 30 min to an hour under vacuum. After all air bubbles are removed, the PDMS is cured at 60 °C for 4 h. Inlet holes and outlet holes in the PDMS devices were punched with a 16 G blunt tip needle (McMaster-Carr). PDMS devices were bonded to glass coverslips (Fisherbrand, cover glass #1) using a handheld laboratory corona treater (BD-20AC, Electro-Technic Products). Syringes were threaded using a 23 G needle (BRICO Products) and were connected to the devices with Tygon® tubing (ID 0.020" Saint-Gobain PPL Corp.).
Materials
Suspensions of rigid spheres consisted of 0.025% v/v total sphere concentration of fluorescent polystyrene spheres. 0.02% v/v were 15 μm in diameter (FluoSpheres® yellow-green, ex/em 505/515 nm, Life Technologies) and 0.005% v/v were 2 μm in diameter (Fluoro-MaxTM green, Thermo Scientific). To prevent particle aggregation, suspensions also contained 1% v/v Tween-20 (Sigma-Aldrich). To ensure that spheres were neutrally buoyant, the suspension was 7% NaCl by mass.
Vesicles were prepared via electroformation22 from 2 mg ml−1 total lipid mixtures that are 20% (0.4 mg ml−1) 1-oleoyl-2-{6-[(7-nitro-2-1,3-benzoxadiazol-4-yl)amino]hexanoyl}-sn-glycero-3-phosphocholine (NBD PC, ex/em 460/534 nm, Avanti Lipids) and 80% (1.6 mg ml−1) 1,2-dioleoyl-sn-glycero-3-phosphocholine (DOPC, Avanti Lipids). Lipids were dissolved in a 95% chloroform, 5% acetonitrile solvent. 15 μl was deposited and spread onto indium tin oxide (ITO) coated glass slides (Delta Technologies, Limited) with a Hamilton gas-tight syringe. The solvents were then evaporated under vacuum for 30 min. A 1.6 mm rubber gasket trimmed to fit the ITO slide (leaving a small gap along one edge) was placed between two lipid-coated ITO slides. Copper tape is used to connect the ITO electrodes to a function generator (Agilent 33220A). This electroformation cell was held together using small binder clips; a small gap is left through which 100 mM aqueous sucrose can be deposited. The gap was closed with a bit of polymer clay (Sculpey). The electroformation protocol utilized a 10 Hz sine wave that was linearly ramped from 0.05 V to 1.41 V over 30 min; a 10 Hz, 1.41 V sine wave was then applied for the next two hours. Finally, a square wave with an amplitude of 2.12 V and a frequency of 4.5 Hz was applied for 30 min.46 Vesicles are sensitive to high shear and must be handled gently with 18 G syringe needles and wide pipette tips.
Vesicle volume fractions in the starting suspensions were determined using phase contrast microscopy at the CNR Biological Imaging Facility at UC Berkeley. Images of vesicles in a hemocytometer counting chamber (Bright-Line Phase, Hausser Scientific Co.) were taken using a Zeiss AxioImager M1 microscope with a 20× phase objective and a Qimaging Micropublisher camera. This apparatus included a Sutter Instruments Lambda LS Light Source.
Vesicle deformability is characterized by a capillary number (Ca). The capillary number is defined47 as
| (8) |
where is the fluid viscosity, is the vesicle radius, is the bending modulus, and is the characteristic shear rate in a rectangular channel, defined as . Dahl et al. measured the bending modulus for this system and found 48 The capillary numbers experienced by the vesicles in the separation devices range from 102 to 105. These large capillary numbers are due to the high flow rates and consequently high shear rates in the microchannels. Extensional flows of vesicles at capillary numbers of order 102 to 103 were explored in the study by Dahl et al.;48 under these conditions, the vesicles did not rupture as long as the initial vesicle shape was close to spherical. In the present work, our flows are shear dominated. We estimate the capillary numbers in the shear flow experiments on vesicles of Coupier et al.,9 where no vesicle rupture was reported, as being of order 103. However, we anticipate some vesicle loss through breakage at the highest flow rates and Ca in the present experiments.
Separation experiments
Separation experiments with both vesicles and spheres were conducted using fluorescence microscopy. A Leica DMIRE2 inverted microscope was used with an external light source (Leica EL6000). A dual-band excitation/emission filter (Chroma 51004v2, 460–500/510–560 nm) was appropriate for our system. Objectives used include 10× (Olympus), 20× (Leica), and water-immersion 63× (Leica). Images and videos were taken by using a monochromatic Photometrics Cascade 512b CCD camera. The analysis was performed with ImageJ (NIH) and Matlab (Mathworks).
To prepare separation devices for experiments, 50% isopropyl alcohol (IPA) solutions, filtered using 0.2–0.4 μm filters, were injected to facilitate the removal of air bubbles from the device. For the sphere experiments, sphere solutions were introduced at this point and kept running until the IPA solution was flushed from the system before recording data. For experiments with vesicles, filtered de-ionized water was flowed through to remove the IPA solution. Next, a solution of filtered 2 mg ml−1 Bovine Serum Albumin (Thermo Scientific Pierce) was injected and left to sit in the device for at least 5 min. Filtered 100 mM sucrose was then flowed through the device to wash away the BSA solution. Finally, the vesicle suspension was introduced. The flow in all experiments was controlled with a syringe pump (Harvard Apparatus PHD 2000).
RESULTS
Device notation
Several devices were used to test the separation mechanisms and strategies for vesicles. The individual designs are outlined in Table I. Devices are named according to the separation mechanism (Filter or Inertial) and the device height in microns (e.g., H30 denotes a device that is 30 microns deep). For the filter devices, three exit configurations were tested, these are indicated by a number (e.g., Filter1), and the corresponding exit configuration is shown schematically in Fig. 3 and in column 4 of Table I. Different exit bifurcations were tested in filter devices that were 30 μm in height. 60 μm high filter devices were tested later to examine the design's ability to handle increased throughput. For the inertial separation device, only one height of 145 μm was tested; this height was studied based on considerations of the optimal hydraulic diameter needed to effect the separation of vesicles that were 15 μm or larger.
TABLE I.
Device notation.
| Name | Separation mechanism | Device height (μm) | Bifurcation design |
|---|---|---|---|
| Filter1 H30 | Size exclusion | 30 |  |
| Filter2 H30 | Size exclusion | 30 |  |
| Filter3 H30 | Size exclusion | 30 | 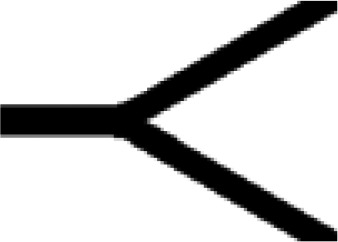 |
| Filter1 H50 | Size exclusion | 50 |  |
| Filter1 H60 | Size exclusion | 60 |  |
| Inertial H145 | Inertial focusing | 145 | Not applicable |
Consistency of initial vesicle suspensions
Many electroformation cycles were performed to generate enough vesicles for all of the experiments. The mean vesicle diameter of the starting suspension was 17.6 2.1 μm. The mean of the initial suspension's polydispersity index (PDI) was 1.29 0.05. Measurements of the volume fraction of vesicle suspensions can be difficult to obtain. Standard quantification techniques (e.g., flow cytometry) use flow rates and focusing solutions that can lead to vesicle breakup; in addition, a lack of reference solutions for vesicles (used for instrument calibration) contributes to this difficulty in interpreting data for vesicles from cytometry and other methods. Therefore, volume fraction measurements were attempted with a hemocytometer. As a first validation of this technique, a suspension of 10 and 20 μm diameter rigid spheres was analyzed. The measured volume fractions ranged from 0.035% v/v to 0.048% v/v when the expected volume fraction was 0.025% v/v. For vesicles, a much broader variation was observed in the volume fraction measurements of three suspensions from 15% v/v to 47% v/v. A significant fraction of this variation can be attributed to concentration gradients that develop due to sample evaporation. Very small volumes (10 μl) are used in the hemocytometer, and the settling time required for the vesicles to sink to the plane with the counting grid is of the same order as the time for the effects of evaporation to become noticeable. We acknowledge this as a limitation of this quantification method, but note that efforts to better quantify the volume fraction for vesicles are beyond the scope of the current study.
Separation metrics
As noted above, sphere experiments used a bidisperse suspension of 2 and 15 μm diameter particles. To calculate the enrichment, separation efficiency, and purity for the experiments using this suspension, the target particles were the 15 μm spheres, and the contaminant particles were the 2 μm spheres. Vesicle experiments utilize a size cutoff to differentiate between the target and contaminant particles. A size cutoff of 14 μm was established in order to compare the separation abilities of the filter and the inertial devices. This particular value is the average of the means of and for the two different devices. Note that is the collected suspension fraction that contains most of the large vesicles and is the collected suspension fraction that contains primarily small vesicles. Determining the distribution of vesicle diameters in and for all separation devices allows for a comparison of the separation ability and quality. Because applications for both and exist, the enrichment, separation efficiency, and purity are calculated for each separated vesicle suspension obtained from all separation devices. Metrics calculated for are denoted as the subscript ; with these calculations, the target particles are vesicles with diameters above the size cutoff. Metrics for use the subscript , and target particles consist of vesicles with diameters below the size cutoff.
For the filter separation devices, is the suspension collected from the outlet that bypasses the filter. is the suspension collected downstream of the filter section containing mostly small vesicles. The filter schematic (Fig. 2) illustrates which outlets correspond to each fraction. For the inertial separation device, the suspensions collected from outlets 3 and 4 were combined and used as , while the suspensions collected from outlets 1, 2, and 5 were combined to form (see Fig. 4). Two outlets in the inertial device were used for as the band of streamlines the rigid particles and vesicles focused to spanned more than one outlet channel.
Rigid sphere separation
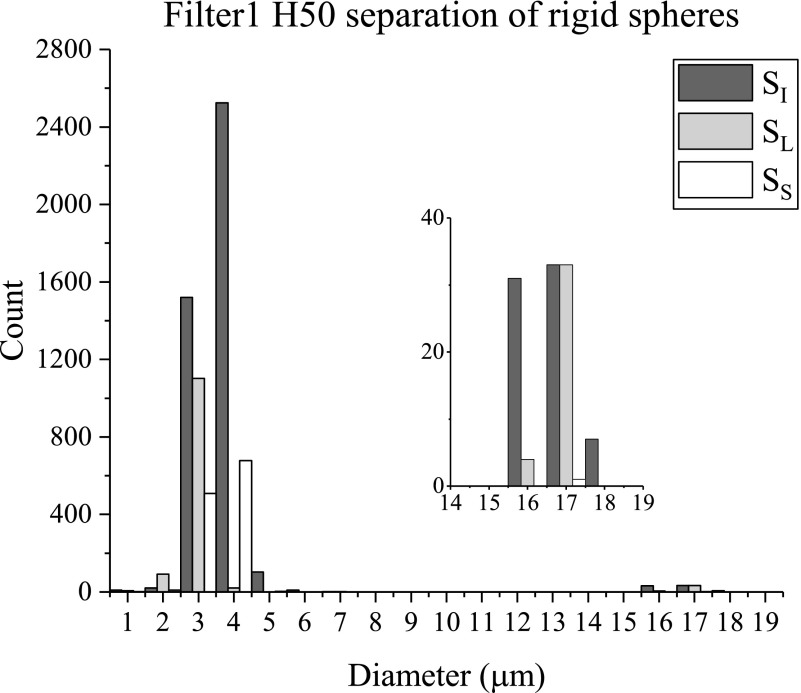
The separation results from the bidisperse suspension of 2 and 15 μm spheres in the 50 μm high filter device Filter1 H50 are shown in Fig. 5. This and the following histograms compare the distributions of particle sizes in a suspension before and after separation; these histograms are generated by counting the number of differently sized particles in a fixed volume of the initial and separated suspensions. These experiments were run at Re = 2.6, calculated with the hydraulic diameter of the main channel that bypasses the filter section. Note that although the volume fraction of 15 μm spheres is much higher than that of the 2 μm spheres, the number fraction of the large spheres is much smaller. Thus, the portion of the initial suspension of spheres, , that was included for size analysis has a large number of small spheres and about 60 total larger spheres (see inset). consists of a number of larger spheres but has lower numbers of both small and large spheres relative to the initial suspension. has even fewer spheres; notably, there are almost no large spheres in this fraction. The overall loss of spheres in this device was expected due to 15 μm spheres being immediately trapped in the filter channels and causing blockage build up over the device run time. Images of the device, captured over the course of the experiment, initially show the large spheres being trapped in the filter channels; eventually, the small spheres are trapped throughout the device as well. The enrichment (), separation efficiency (), and purity () for this device are reported in Table II. There is some enrichment of the large spheres by the device as = 1.8; this indicates that has a number concentration of large spheres that is 1.8 times that of . This device also showed good separation efficiency, as 97% of the total collected large spheres were collected in . However, there was low purity (3%) of large spheres in . This means a large quantity of small spheres remained in the main channel instead of passing through the filter. It is possible the 15 μm spheres blocking the filter channels contributed to the large number of small spheres in the large separated fraction, even though small spheres were still able to bypass these obstructions.
FIG. 5.
Filter1 H50 size distributions of initial and separated suspensions of 15 and 2 μm rigid spheres. Inset: Sphere counts of 15 μm spheres.
TABLE II.
Comparison of sphere separation results. Note: Throughput is calculated for undiluted sphere suspension.
| Device | (%) | (%) | (μl/min) | |
|---|---|---|---|---|
| Filter1 H50 | 1.8 | 97 | 3 | |
| Inertial H145 | 1.7 | 90 | 3 | 550 |
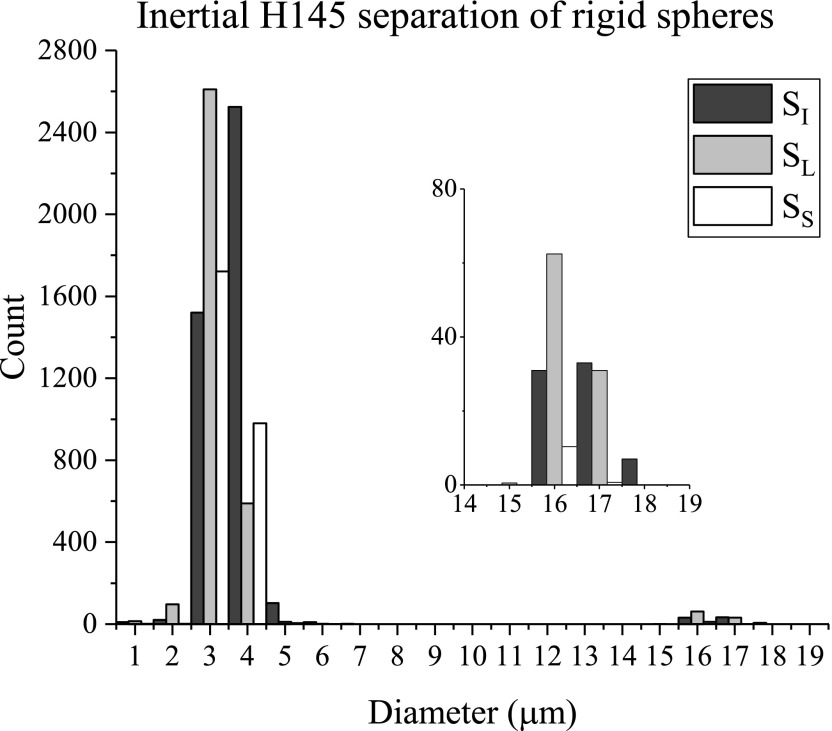
The bidisperse suspension of spheres was also used with the 145 μm high inertial separation device; these results are shown in Fig. 6. The inertial device was run at Re = 77, well within the flow regime that is influenced by the inertia of the fluid. (Note that this Re was calculated with the of the repeating serpentine unit.) Again, while the volume fraction of large spheres is higher than that of the small spheres, the number fraction of large spheres is much smaller; changes in the numbers of large spheres are best examined in the inset of the figure. Clearly, the large spheres are more concentrated in relative to ; indeed, since we are comparing fixed volumes from the inlets and outlets, the histogram reflects a larger total number of large spheres in than in . Similar to the filter results, captured the lowest number of large spheres. The enrichment, separation efficiency, and purity are reported in Table II. For this device, is 1.7; this shows that the inertial device is similarly effective at concentrating the large spheres to a particular fraction as the filter device. The separation efficiency () is high at 90%; that is, 90% of the collected large spheres are isolated to . Despite the high separation efficiency, the purity () is low at only 3% of the total spheres collected from actually being large spheres. For this device, a low purity is not unexpected. While the large spheres focus to a narrow streamline or band of streamlines, the smaller spheres remain equally distributed throughout the main channel, and thus, all of the outlets should have a fairly large number of small spheres, as observed in Fig. 6.
FIG. 6.
Inertial H145 size distributions of initial and separated suspensions of 15 and 2 μm spheres. Inset: Sphere counts of 15 μm spheres.
Vesicle separation
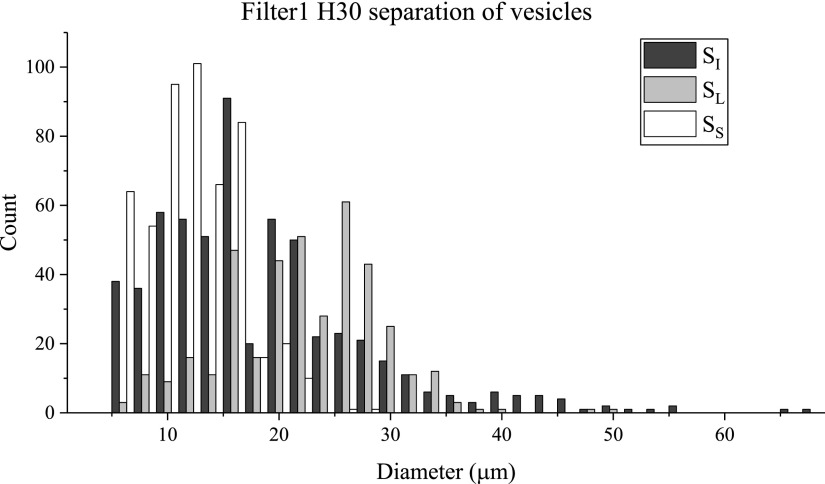
Several different filter devices were tested with vesicle suspensions. The three bifurcation schemes were tested with the 30 μm high filtration devices at a fairly low Reynolds number (Re = 4.3; Q = 667 μl/h) to minimize the vesicle breakup due to high shear in the device. The ability to run the device for long times depended heavily on controlling device clogging and the prevalence of the vesicle breakup in the filter channels. Several experiments were averaged to obtain the separation results' histogram for Filter1 H30 in Fig. 7. Good separation between the mean diameter of and the mean of was observed, as shown through a large (14 μm). is clearly differentiated from . At the same time, there is a noticeable decrease in the polydispersity of the separated suspensions, and , relative to . A value of = 0.23 between and represents a large polydispersity reduction. The separation histograms for Filter2 H30 and Filter3 H30 are shown in the supplementary material; these devices produced reasonable separation but did not show as high or (see Table III), which are indicators of separation ability. Interestingly, there was a noticeable difference in the separation results when the only physical difference between the three devices was the bifurcation in the main channel that is placed after the filter section. Possible explanations for this observation are discussed in the following section, “Discussion: Channel resistance in filter devices affects separation ability.” The previously defined separation metrics, as calculated with a cutoff size of 14 μm, are reported in Table IV for Filter1 H30. For this device, significant enrichment of the larger vesicles was observed in ( = 4.3). The purity of the large vesicles was also high at 90%. The separation efficiency of the large vesicles was calculated to be 64%, implying that a significant portion of the available large vesicles was not captured in . Still, this device shows promise in its ability to collect a majority of the large vesicles with high purity in .
FIG. 7.
Filter1 H30 size distributions of initial and separated suspensions of vesicles.
TABLE III.
Comparison of vesicle separation results with the mean size difference () and polydispersity reduction (). Note: Throughput is calculated for undiluted suspensions.
| Separation design | (μm) | (μl/min) | |
|---|---|---|---|
| Filter1 H30 | 14.0 | 0.23 | |
| Filter2 H30 | 9.7 | 0.17 | |
| Filter3 H30 | 8.8 | 0.17 | |
| Inertial H145 | 5.8 | 0.11 | |
| Filter1 H60 | 13.9 | 0.20 |
TABLE IV.
Comparison of vesicle separation results in terms of enrichment, separation efficiency, and purity.
| Device | Filter1 H30 | Filter1 H60 | Inertial |
|---|---|---|---|
| 4.3 | 2.9 | 1.3 | |
| 3.4 | 6.2 | 5.9 | |
| 64% | 66% | 86% | |
| 89% | 90% | 56% | |
| 90% | 91% | 63% | |
| 61% | 65% | 82% |
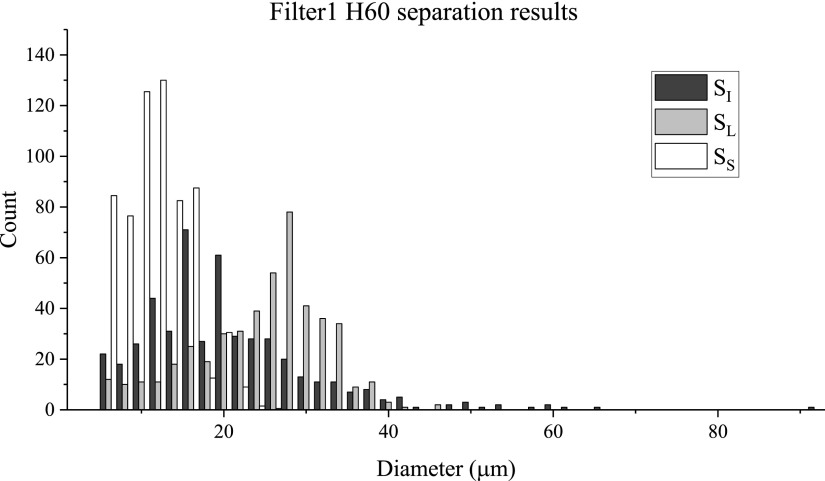
A filter device with deeper channels (so that the vesicles are less confined) was also tested with vesicles at moderate Re (Re = 43; Q = 6920 μl/h); the resulting size histogram for Filter1 H60 is shown in Fig. 8. These results are comparable to those for the Filter1 H30 device when looking at and , with = 13.9 μm and = 0.20 (see Table III). These values indicate that this device exhibits good separation ability and is able to reduce the polydispersity well. Because the vesicles were less confined, the throughput of the filter device could be increased with less clogging over equivalent run time. Table IV displays the enrichment, separation efficiency, and purity results for this device. This device showed greater enrichment of the small vesicles relative to the 30 μm high filter device ( = 6.2 compared to 3.4) and reduced enrichment of the large vesicles ( = 2.9 versus 4.3). In separation efficiency and purity, the two filters produced similar results.
FIG. 8.
Filter1 H60 size distributions of initial and separated suspensions of vesicles.
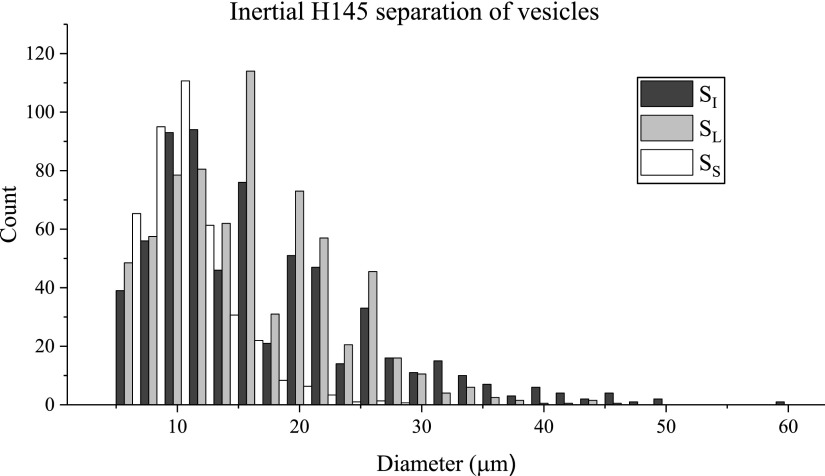
After showing good separation ability with the suspension of rigid spheres, the inertial separation scheme was tested with vesicles at the same Re as used for the spheres, Re = 77 (Q = 33 000 μl/h). It was observed that the degree of dilution affected the separation ability of the device, with the more dilute suspensions showing better inertial focusing and separation. Figure 9 shows how the vesicles focus to a narrower band of streamlines when the volume fraction () is reduced from about 10% to about 2%. Different concentrations of vesicle suspensions were tested, and the results for the most dilute suspension (1:15 dilution of the original electroformed suspension, corresponding to ) are shown in Fig. 10. This size distribution histogram shows a smaller separation between and relative to the filter devices, which is reflected in the value of 5.8 μm (Table III). The inertial device also generated a more modest of 0.11, suggesting that its ability to reduce the polydispersity is limited relative to the filter device. Table IV contains more separation metrics for the inertial device. The separation results for the more concentrated suspensions ( and ), and a preliminary quantification of the dependence of the focusing on the volume fraction, are reported in the supplementary material. The PDIs of the less dilute separated suspensions were effectively unchanged relative to the initial suspension polydispersity, indicating that this separation device was more effective when the suspension concentration was dilute. Of note is the separation efficiency , which is reported to be 86%, the highest separation efficiency of the three devices. While this device was adept at collecting a significant majority of the large vesicles, the purity suffered somewhat, as was shown to be 63%. In the case of the purity of the small vesicles () in the small separated fraction, the inertial device displayed the highest value at 82%.
FIG. 9.
Dilution of vesicle suspension changes how well the suspension focuses. The least focused suspension has a volume fraction and (b) . (c) The best focusing behavior observed with .
FIG. 10.
Inertial H145 size distributions of initial and separated suspensions of vesicles.
DISCUSSION
Rigid sphere suspensions as a first estimation of separation ability
The inertial separator is an example of how using rigid spheres to optimize a separation device can be very useful. The device needed modifications for higher cutoff sizes, which were predicted through the empirical relationship of Di Carlo.4 The optimal device height and focusing behavior can be confirmed by using suspensions of rigid particles before testing the device with more valuable suspensions of vesicles or cells. In this device, the clogging issues were nearly non-existent due to the large channel widths and heights.
When the filter devices were being tested with suspensions of rigid spherical particles, however, the filter channels became blocked by the larger spheres almost immediately. Persistent clogging of the device to this extent was not observed with vesicles in so short of a time window. The advantage of using rigid spheres as a first estimation on how a separation device will function is that these suspensions are easy to obtain; however, spheres may not always offer the best representation of a device's separation ability, especially if the end application involves a suspension of deformable components. The deformability of the suspended particles appears to play a significant role in the filter device operation, and using rigid sphere suspensions does not provide an accurate validation of the separation capabilities of the filter device. This comparison also suggests that fundamentally different designs may be optimal for separating deformable particles and rigid particles, showing the value in testing devices with deformable suspensions.
Evaluation of filtration as a separation strategy for vesicles
The filtration device showed good separation capability in the high , , and purity values, although these came at the cost of low throughput and severe clogging issues. The 30 μm high devices in particular were especially prone to clogging from debris or lipid residue. While the reduced vesicle confinement of the 60 μm high device helped to mitigate the clogging issues, both the 30 μm and 60 μm high devices could be used only once. An advantage of these devices is that they were able to separate concentrated vesicle suspensions and required no dilution of the initial vesicle suspension. The 60 μm high filter devices allowed for increased throughput, while maintaining the separation and PDI reduction capability. The similar separation results for the two different device heights indicate that—as expected—the smallest dimension (here, the width of the filter channels) is what controls the size cutoff. The separation results for this device design also appear relatively insensitive to the Reynolds number, at least over the range probed (4.3 < Re < 43).
The filtration device was adapted from the work by Woo et al.25 who reported a 80%; the filter devices designed here obtained = 91%. Other separation metrics such as enrichment or separation efficiency were not reported in the earlier study.
Channel resistance in filter devices affects separation ability
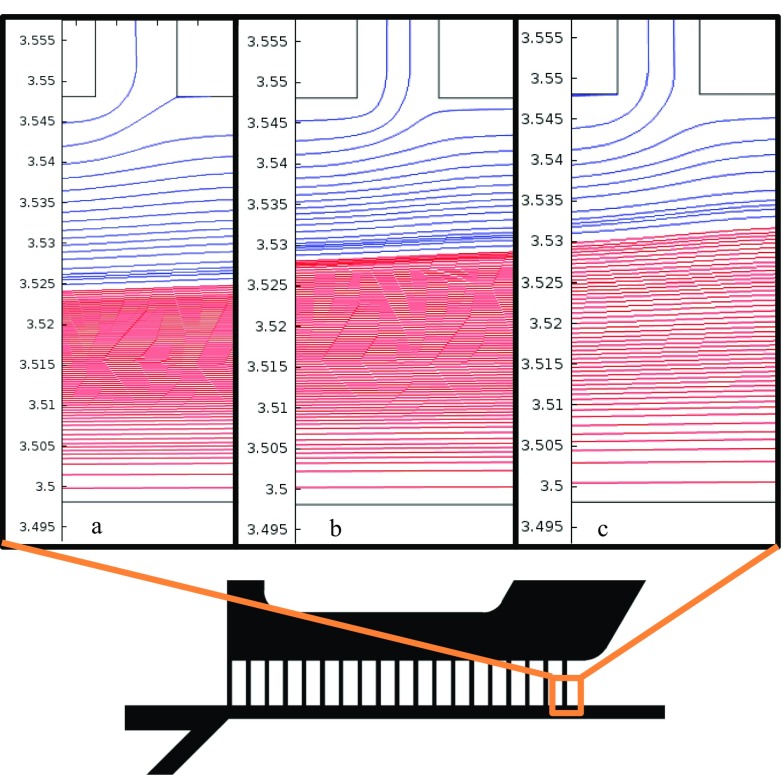
Three different configurations of the bifurcation after the filter section were tested. There was a noticeable difference in the separation ability of the three designs, as several experimental replicates yielded different and values. To investigate the effect of bifurcation geometry on the flow, a 2D approximation of the channel flow in different designs was simulated with COMSOL (see Fig. 11), where the flow rates of the sample inlet and the pinching flow were constant across the device designs. These streamline plots show the distribution of streamlines in the main channel at the last filtration channel of the filter section. The red streamlines are from the pinching flow inlet introduced before the filter, and the blue streamlines are from the inlet where the vesicles are introduced. It is clear that more blue streamlines from the vesicle inlet remain in the main channel in the Filter1 design relative to the other two, indicating that more large vesicles were able to exit to form in this design. Filter2 and Filter3 had slightly longer outlet channels, and thus, higher channel resistances, than the outlet channels in Filter1. This higher channel resistance was likely pushing a greater quantity of large vesicles through the filter sections of these two devices. Forcing more of the large vesicles through the filter leads to faster filter clogging and higher numbers of large vesicles in . As the filter clogs, more of the small vesicles will bypass the filter and end up in . In both of these cases, and will be reduced. These filter devices appear to be quite sensitive to the outlet channel resistance; optimizing the channel resistance may be one way to tune the separation ability.
FIG. 11.
COMSOL generated streamlines: blue represents the vesicle inlet and red represents pinch flow inlet. (a) Filter1, (b) Filter2, and (c) Filter3.
Evaluation of inertial focusing as a separation strategy for vesicles
The inertial device showed higher and than the filter devices. Depending on what suspension parameters are valued, this device shows promise. The greatest advantage of the inertial device was the reduced run time. This device also experienced minimal clogging, and when pieces of debris did enter the device, they were easy to remove. This quality allowed the devices to be reusable. While the H60 filter has the highest throughput rate after taking the dilution factor into account, the inertial device is still likely to have a shorter overall run time when including the time required to remove air and debris from the devices before introducing the vesicles. The inertial devices exhibited acceptable separation and modest PDI reduction with diluted vesicle suspensions but worked best with dilute suspensions of rigid spherical particles. If the target particles are the smaller suspension components, and the larger contaminants are very dilute, this device offers an efficient way to filter out the contaminants from the targets after optimizing the cutoff size. However, the device is not optimal when the smaller component is the contaminant.
This device was modified from the work presented by Di Carlo et al. who reported results for a polydisperse suspension of PDMS spheres as 4 and 1.4 The modified device presented in this work had = 1.3 and = 5.9 when run with vesicles. Other separation metrics were not reported by the Di Carlo group.
Inertial separation requires dilute suspensions
When the suspended particles are being inertially focused to a narrow band of streamlines, if the vesicle suspension is too concentrated, the vesicles will interact and prevent focusing from occurring. To facilitate focusing in the inertial separator, vesicle suspensions were diluted significantly (1/15 of the initial concentration); this makes the throughput of the initial suspension more moderate, at about 40 μl/min. This volumetric flow rate is still higher than that used with the H30 filter devices, and the use of this device may be more appealing when the time required to prepare the inertial devices relative to the filter devices is taken into consideration or when dilute vesicle suspensions are appropriate for post-separation use.
Separation dependence on the device height
The separation ability of the filter device appears to depend solely on the width of the filter channels instead of the height. This may be used to greatly increase the throughput while maintaining the same size cutoff capability. This is in contrast to the inertial device, where changing the device height directly affects the size cutoff for particles that will be focused. This feature of the inertial separator allows a single mask design to be used for different separation applications. One mask can be used to fabricate masters with varying channel heights, each tailored to the desired size cutoff.
CONCLUSIONS
As interest in the development of microfluidic diagnostic tools grows, the separation of various components of deformable particle suspensions becomes increasingly important. Using vesicles to test the separation ability of these microfluidic devices provides valuable insights into how deformability affects the suspension behavior and can illuminate separation aspects that are inaccessible if using a suspension of rigid spheres to test the devices' separation abilities. Vesicles also serve as a model suspension for cell populations and offer a first order estimation of cell behavior in these devices.
The size exclusion filter exhibited good size separation, as well as an ability to significantly reduce the suspension polydispersity. These devices can obtain higher throughputs while maintaining similar separation capability by increasing the channel height. They can be used with undiluted initial suspensions but are subject to device clogging issues which render the devices as single use.
The inertial focusing separator had reasonable size separation and modest polydispersity reduction abilities. It was relatively high throughput, although good separation required dilute suspensions. These devices had few to no clogging issues, allowing them to be reusable.
If the goal is high purity of a large target particle, the H60 Filter1 device appears to be the best device to use. If high separation efficiency of the large target particles is desired, the inertial separation device showed the most promising results. The performance of the filter device is affected by downstream bifurcations in the channel; this should be kept in mind when designing these devices. The inertial device better lends itself to continuous separation since there is a low incidence of clogging with these devices. These separation devices may be cascaded to increase the purity or separation efficiency and reduce the polydispersity of the separated fractions. These separated vesicles can be used in further experiments to better understand the flow behavior of vesicle suspensions and compare with simulations.
SUPPLEMENTARY MATERIAL
See supplementary material for the mean vesicle size and PDI from different separation devices. The supplementary material also contains a detailed list of separation metric equations used in this work and the separation histograms for Filter2 H30 and Filter3 H30.
ACKNOWLEDGMENTS
The authors gratefully acknowledge the support of NSF through Award No. CBET-1066334.
References
- 1. Shields C. W. IV Ohiri , K. A., Szott L. M., and López G. P., Cytometry 92B, 115 (2017). 10.1002/cyto.b.21388 [DOI] [PMC free article] [PubMed] [Google Scholar]
- 2. Bhagat A. A. S., Bow H., Hou H. W., Tan S. J., Han J., and Lim C. T., Med. Biol. Eng. Comput. 48, 999 (2010). 10.1007/s11517-010-0611-4 [DOI] [PubMed] [Google Scholar]
- 3. Gossett D. R., Weaver W. M., Mach A. J., Hur S. C., Tse H. T. K., Lee W., Amini H., and Di Carlo D., Anal. Bioanal. Chem. 397, 3249 (2010). 10.1007/s00216-010-3721-9 [DOI] [PMC free article] [PubMed] [Google Scholar]
- 4. Di Carlo D., Edd J., Irimia D., Tompkins R., and Toner M., Anal. Chem. 80, 2204 (2008). 10.1021/ac702283m [DOI] [PubMed] [Google Scholar]
- 5. Kuntaegowdanahalli S. S., Bhagat A. A. S., Kumar G., and Papautsky I., Lab Chip 9, 2973 (2009). 10.1039/b908271a [DOI] [PubMed] [Google Scholar]
- 6. Geislinger T. M. and Franke T., Adv. Colloid Interface Sci. 208, 161 (2014). 10.1016/j.cis.2014.03.002 [DOI] [PubMed] [Google Scholar]
- 7. Vlahovska P. M., Podgorski T., and Misbah C., C. R. Phys. 10, 775 (2009). 10.1016/j.crhy.2009.10.001 [DOI] [Google Scholar]
- 8. Uchegbu I. F. and Vyas S. P., Int. J. Pharm. 172, 33 (1998). 10.1016/S0378-5173(98)00169-0 [DOI] [Google Scholar]
- 9. Coupier G., Kaoui B., Podgorski T., and Misbah C., Phys. Fluids 20, 111702 (2008). 10.1063/1.3023159 [DOI] [Google Scholar]
- 10. Danker G., Vlahovska P. M., and Misbah C., Phys. Rev. Lett. 102, 148102 (2009). 10.1103/PhysRevLett.102.148102 [DOI] [PubMed] [Google Scholar]
- 11. Farutin A., Piasecki T., Słowika A. M., Misbah C., Wajnryb E., and Ekiel-Jeżweska M. L., Soft Matter 12, 7307 (2016). 10.1039/C6SM00819D [DOI] [PubMed] [Google Scholar]
- 12. Gires P.-Y., Srivastav A., Misbah C., Podgorski T., and Coupier G., Phys. Fluids 26, 013304 (2014). 10.1063/1.4861900 [DOI] [Google Scholar]
- 13. Farutin A. and Misbah C., Phys. Rev. Lett. 110, 108104 (2013). 10.1103/PhysRevLett.110.108104 [DOI] [PubMed] [Google Scholar]
- 14. Misbah C., J. Phys.: Conf. Ser. 392, 012005 (2012). 10.1088/1742-6596/392/1/012005 [DOI] [Google Scholar]
- 15. Abkarian M. and Viallat A., Biophys. J. 89, 1055 (2005). 10.1529/biophysj.104.056036 [DOI] [PMC free article] [PubMed] [Google Scholar]
- 16. Lamura A. and Gompper G., Europhys. Lett. 102, 28004 (2013). 10.1209/0295-5075/102/28004 [DOI] [Google Scholar]
- 17. Noguchi H., Gompper G., Schmid L., Wixforth A., and Franke T., Europhys. Lett. 89, 28002 (2010). 10.1209/0295-5075/89/28002 [DOI] [Google Scholar]
- 18. Noguchi H. and Gompper G., J. Phys.: Condens. Matter 17, S3439 (2005). 10.1088/0953-8984/17/45/032 [DOI] [Google Scholar]
- 19. van Swaay D. and deMello A., Lab Chip 13, 752 (2013). 10.1039/c2lc41121k [DOI] [PubMed] [Google Scholar]
- 20. Teh S.-Y., Khnouf R., Fan H., and Lee A. P., Biomicrofluidics 5, 044113 (2011). 10.1063/1.3665221 [DOI] [PMC free article] [PubMed] [Google Scholar]
- 21. Arriaga L. R., Datta S. S., Kim S.-H., Amstad E., Kodger T. E., Monroy F., and Weitz D. A., Small 10, 950 (2014). 10.1002/smll.201301904 [DOI] [PubMed] [Google Scholar]
- 22. Angelova M. I., Soléau S., Méléard P., Faucon J. F., and Bothorel P., Prog. Colloid Polym. Sci. 89, 127 (1992). 10.1007/BFb0116266 [DOI] [Google Scholar]
- 23. Hope M. J., Bally M. B., Mayer L. D., Janoff A. S., and Cullis P. R., Chem. Phys. Lipids 40, 89 (1986). 10.1016/0009-3084(86)90065-4 [DOI] [PubMed] [Google Scholar]
- 24. Walde P., Cosentino K., Engel H., and Stano P., ChemBioChem 11, 848 (2010). 10.1002/cbic.201000010 [DOI] [PubMed] [Google Scholar]
- 25. Woo Y., Heo Y., Shin K., and Yi G.-R., J. Biomed. Nanotechnol. 9, 610 (2013). 10.1166/jbn.2013.1543 [DOI] [PubMed] [Google Scholar]
- 26. Choi S. and Park J.-K., Lab Chip 7, 890 (2007). 10.1039/b701227f [DOI] [PubMed] [Google Scholar]
- 27. Takagi J., Yamada M., Yasuda M., and Seki M., Lab Chip 5, 778 (2005). 10.1039/b501885d [DOI] [PubMed] [Google Scholar]
- 28. Yamada M., Nakashima M., and Seki M., Anal. Chem. 76, 5465 (2004). 10.1021/ac049863r [DOI] [PubMed] [Google Scholar]
- 29. Yang S., Ündar A., and Zahn J. D., Lab Chip 6, 871 (2006). 10.1039/B516401J [DOI] [PubMed] [Google Scholar]
- 30. Yamada M. and Seki M., Lab Chip 5, 1233 (2005). 10.1039/b509386d [DOI] [PubMed] [Google Scholar]
- 31. Choi S., Song S., Choi C., and Park J., Lab Chip 7, 1532 (2007). 10.1039/b705203k [DOI] [PubMed] [Google Scholar]
- 32. Shevkoplyas S. S., Yoshida T., Munn L. L., and Bitensky M. W., Anal. Chem. 77, 933 (2005). 10.1021/ac049037i [DOI] [PMC free article] [PubMed] [Google Scholar]
- 33. Wu Z., Willing B., Bjerketorp J., Jansson J. K., and Hjort K., Lab Chip 9, 1193 (2009). 10.1039/b817611f [DOI] [PubMed] [Google Scholar]
- 34. Geislinger T. and Franke T., Biomicrofluidics 7, 044120 (2013). 10.1063/1.4818907 [DOI] [PMC free article] [PubMed] [Google Scholar]
- 35. Zheng S., Liu H., Liu J.-Q., Balic M., Datar R., Cote R. J., and Tai T.-C., J. Chromatogr. A 1162, 154 (2007). 10.1016/j.chroma.2007.05.064 [DOI] [PubMed] [Google Scholar]
- 36. Huang R., Barber T. A., Schmidt M. A., Tompkins R. G., Toner M., Bianchi D. W., Kapur R., and Flejter W. L., Prenatal Diagn. 28, 892 (2008). 10.1002/pd.2079 [DOI] [PMC free article] [PubMed] [Google Scholar]
- 37. Huh O., Bahng J. H., Ling Y., Wei H.-H., Kripfgans O. D., Fowlkes J. B., Grotberg J. B., and Takayama S., Anal. Chem. 79, 1369 (2007). 10.1021/ac061542n [DOI] [PMC free article] [PubMed] [Google Scholar]
- 38. Hiemenz P. C., Polymer Chemistry: The Basic Concepts ( M. Dekker, New York, 1984). [Google Scholar]
- 39. Rodriguez F., Principles of Polymer Systems ( Hemispheres Publishing Corporation, New York, 1989). [Google Scholar]
- 40. Tam C. K. W. and Hyman W. A., J. Fluid Mech. 59, 177 (1973). 10.1017/S0022112073001497 [DOI] [Google Scholar]
- 41. Leal L. G., Ann. Rev. Fluid Mech. 12, 435 (1980). 10.1146/annurev.fl.12.010180.002251 [DOI] [Google Scholar]
- 42. Hur S. C., Henderson-MacLennan N. K., McCabe E. R. B., and Di Carlo D., Lab Chip 11, 912 (2011). 10.1039/c0lc00595a [DOI] [PubMed] [Google Scholar]
- 43. Di Carlo D., Irimia D., Tompkins R. G., and Toner M., Proc. Natl. Acad. Sci. U.S.A. 104, 18892 (2007). 10.1073/pnas.0704958104 [DOI] [PMC free article] [PubMed] [Google Scholar]
- 44. Jimenez M., Miller B., and Bridle H. L., Chem. Eng. Sci. 157, 247 (2017). 10.1016/j.ces.2015.08.042 [DOI] [Google Scholar]
- 45. Khalkhal F., Chaney K. H., and Muller S. J., Microfluid. Nanofluid. 20, 153 (2016). 10.1007/s10404-016-1817-z [DOI] [Google Scholar]
- 46. Spjut J. E. and Spjut J. E., “ Trapping, deformation, and dynamics of phospholipid vesicles,” M.S. thesis ( University of California, Berkeley, 2010). [Google Scholar]
- 47. Kaoui B., Farutin A., and Misbah C., Phys. Rev. E 80, 061905 (2009). 10.1103/PhysRevE.80.061905 [DOI] [PubMed] [Google Scholar]
- 48. Dahl J. B., Narsimhan V., Gouveia B., Kumar S., Shaqfeh E. S. G., and Muller S. J., Soft Matter 12, 3787 (2016). 10.1039/C5SM03004H [DOI] [PMC free article] [PubMed] [Google Scholar]
Associated Data
This section collects any data citations, data availability statements, or supplementary materials included in this article.
Supplementary Materials
See supplementary material for the mean vesicle size and PDI from different separation devices. The supplementary material also contains a detailed list of separation metric equations used in this work and the separation histograms for Filter2 H30 and Filter3 H30.


