

Abstract
Royal jelly (RJ) triggers the development of female honeybee larvae into queens. This effect has been attributed to the presence of major royal jelly protein 1 (MRJP1) in RJ. MRJP1 isolated from royal jelly is tightly associated with apisimin, a 54-residue α-helical peptide that promotes the noncovalent assembly of MRJP1 into multimers. No high-resolution structural data are available for these complexes, and their binding stoichiometry remains uncertain. We examined MRJP1/apisimin using a range of biophysical techniques. We also investigated the behavior of deglycosylated samples, as well as samples with reduced apisimin content. Our mass spectrometry (MS) data demonstrate that the native complexes predominantly exist in a (MRJP14 apisimin4) stoichiometry. Hydrogen/deuterium exchange MS reveals that MRJP1 within these complexes is extensively disordered in the range of residues 20–265. Marginally stable secondary structure (likely antiparallel β-sheet) exists around residues 266–432. These weakly structured regions interchange with conformers that are extensively unfolded, giving rise to bimodal (EX1) isotope distributions. We propose that the native complexes have a “dimer of dimers” quaternary structure in which MRJP1 chains are bridged by apisimin. Specifically, our data suggest that apisimin acts as a linker that forms hydrophobic contacts involving the MRJP1 segment 316VLFFGLV322. Deglycosylation produces large soluble aggregates, highlighting the role of glycans as aggregation inhibitors. Samples with reduced apisimin content form dimeric complexes with a (MRJP12 apisimin1) stoichiometry. The information uncovered in this work will help pave the way toward a better understanding of the unique physiological role played by MRJP1 during queen differentiation.
Graphical Abstract
Adult honeybees (Apis mellifera) form three castes. Females can develop into queen or worker bees, while males are known as drones.1,2 Each colony has only a single queen that mates with drones and lays eggs. Worker bees are sterile but perform numerous tasks, including foraging for food and feeding of larvae.3 The dimorphism of female bees is governed by the nutritional environment experienced by the larvae.4–7 Future queens are fed royal jelly (RJ) throughout their development. Worker larvae receive RJ only for an initial period of 3 days, after which their food is switched to worker jelly.1,4 Male larvae receive drone jelly. The various jellies differ in their protein composition, as well as their fructose:glucose ratio and vitamin content.8–10
RJ is secreted by the hypopharyngeal and mandibular glands of worker bees at an early stage of their life cycle, during which they are members of the nurse subcaste.10 RJ contains proteins, carbohydrates, lipids, vitamins, salts, and free amino acids.11 The so-called major royal jelly proteins (MRJPs) constitute roughly 90% of the total RJ protein.9 This family comprises nine homologous members, designated MRJP1–9.10,12,13 The high percentage of essential amino acids in MRJPs underscores their nutritional role in bee larvae.9,14
The ability of RJ to modulate the development of female larvae may be partially related to the presence of histone deacetylase inhibitors,4 microRNAs,3 and other factors.10 However, the key ingredient that drives queen development appears to be MRJP1, the most abundant protein in RJ.15 Although the exact role of MRJP1 remains under dispute,16 there is strong evidence that this protein triggers queen differentiation via an epidermal growth factor receptor (EGFR)-mediated signaling pathway.15,17 MRJP1 also exhibits antibacterial effects,18 as well as antihypertension19 and growth factor-like activity in mammalian cells.10
MRJP1 is expressed as a chain consisting of 432 amino acids. Subsequent cleavage by a signal peptidase removes an N-terminal 19-residue segment,9 resulting in a chain with an expected molecular weight (MW) of 46861 Da. During maturation, MRJP1 undergoes additional post-translational modifications.20 Isoelectric focusing reveals the presence of nine MRJP1 isoforms that share a similar MW but have slightly different pIs between 4.7 and 5.2.21,22 Differences in the nature and extent of post-translational modifications are thought to be chiefly responsible for this heterogeneity.9
Mature MRJP1 is a glycoprotein, and its glycans have been analyzed in great detail.23,24 Sugars are bound mainly at N144 and N177, although other attachment sites also exist.24 The glycans were shown to include a unique Galβ1–3GalNAc unit.23 Deglycosylation by PNGase F causes a mass shift on sodium dodecyl sulfate (SDS) gels from an apparent MW of 56 kDa to an apparent MW of 47 kDa,25 the latter being consistent with the amino acid sequence of the mature protein.9
When isolated from royal jelly, MRJP1 is copurified with the 54-residue (5.54 kDa) α-helical peptide apisimin.26 Apisimin promotes the association of MRJP1 into higher-order structures,11,26 producing MRJP1/apisimin complexes that exhibit considerable thermal stability.22,27 The composition of these complexes remains uncertain.10 Electrophoretic densitometry suggested a 5:1 MRJP1:apisimin stoichiometry,11 but other binding ratios could not be ruled out. Chromatographic, electrophoretic, and light scattering studies yielded size estimates of 280–420 kDa for these MRJP1/apisimin assemblies.11,22,26 Binding is mediated solely by noncovalant interactions, as intermolecular disulfide bridges are absent.28
Structural investigations of MRJP1/apisimin complexes are a prerequisite for gaining a better understanding of the unique role that MRJP1 plays during queen development.15 Unfortunately, it has not been possible thus far to generate high-resolution conformational data for this system.10 In the work described here, we applied different mass spectrometry (MS) techniques and various other biophysical tools to close some of the existing knowledge gaps. Our primary goal was to elucidate aspects of the MRJP1/apisimin structure and dynamics under native conditions. In addition, we examined how the formation of higher-order complexes depends on the presence of apisimin (A) and glycan chains (G). We compared the behavior of native MRJP1 in the presence of apisimin (“A+”) and with glycans attached (“G+”) to that of samples that had undergone deglycosylation (“G−”) as well as partial apisimin removal (denoted as “A−”). The four types of samples generated in this way are denoted A+G+, A−G+, A−G−, and A+G−. Our data allow us to propose simple structural models for the complexes encountered under these different conditions.
MATERIALS AND METHODS
Sample Preparation
Protein samples were prepared in 50 mM HEPES (pH 7.5), unless otherwise noted. The MRJP1/apisimin complex was purified as described previously,22 resulting in stock solutions containing 50 μM protein. A subset of these A+G+ samples was subjected to apisimin depletion. Size exclusion and ion exchange methods have previously been shown to be ineffective for separating apisimin from MRJP1, pointing to high-affinity noncovalent interactions.26 The presence of intermolecular disulfide bonds can be ruled out because apisimin does not contain Cys residues.26 We thus attempted to separate apisimin from MRJP1 by dialysis. Initial tests during which the MRJP1/apisimin complex was dialyzed against native buffer or 7 M urea solutions did not result in any appreciable change in the apisimin:MRJP1 ratio, as judged by ESI-MS signal intensities after separation on a reversed phase column (BEH300 C4, 1.7 μm, 2.1 mm × 50 mm, Waters, Milford, MA). A more effective strategy for apisimin depletion was dialysis against dilute aqueous formic acid solutions at pH 2 for 14 days on ice [using molecular weight cutoff (MWCO) 20000 cassettes from Thermo, Waltham, MA]. This procedure reduced the apisimin:MRJP1 ratio by approximately 50% relative to that of the original A+G+ samples. The apisimin-depleted protein was exchanged back into nondenaturing HEPES at pH 7.5 and equilibrated for 24 h on ice prior to further analyses. The samples obtained in this way are denoted “A−G+”. MRJP1 deglycosylation (with or without apisimin depletion) was performed using PNGase F (Promega, Madison, WI),25 producing deglycosylated samples A−G− and A+G−. Quantitative glycan removal was confirmed using SDS–polyacrylamide gel electrophoresis (PAGE).25
Optical Spectroscopy
CD data were recorded on a Jasco (Easton, MD) J-810 spectropolarimeter using a 1 mm optical path length. Protein-free blanks were subtracted from the reported data. Secondary structure analysis was performed using the Spectra Manager software package supplied by the instrument’s manufacturer. Fluorescence data were acquired using a Jasco FP-6500 spectrofluorimeter with an excitation wavelength of 285 nm.
Blue Native Polyacrylamide Gel Electrophoresis (BN-PAGE)
For BN-PAGE,29,30 protein samples were transferred into 50 mM bis-Tris-HCl buffer containing 15% (w/v) glycerol. Separation was performed on 5 to 18% (w/v) polyacrylamide gradient gels that were run at 15 mA and 4 °C for 4 h in an SE 600 electrophoresis system (Hoefer, San Francisco, CA). The anode buffer consisted of 50 mM bis-Tris HCl, while the cathode buffer consisted of 50 mM Tricine, 15 mM bis-Tris, and 0.02% (w/v) Coomassie brilliant blue G-250 (Bio-Rad, Hercules, CA). Thyroglobulin (669 kDa), ferritin (440 kDa), catalase (232 kDa), lactate dehydrogenase (158 kDa), and bovine serum albumin (66 kDa) were used as calibrants. Apparent molecular weights (MWapp) were determined from using distance of migration versus log(MW) plots.29
Native Top-Down Mass Spectrometry
Native ESI-MS was performed as described previously31 using a modified Orbitrap Q-Exactive instrument (Thermo Fisher, Bremen, Germany). Fragment ion spectra were calibrated internally and matched manually with a tolerance of 10 ppm using mMass.32 MRJP1 samples were washed three times in a 100 mM neutral ammonium acetate solution, using Amicon filters with a MWCO 30000 membrane (Millipore, Darmstadt, Germany) prior to infusion. ESI was performed using a sheath-flow capillary electrophoresis device operated at a sprayer voltage of 1.5 kV.31,33 Prosight PC 3.0 (Thermo Fisher) and Prosight Lite were used for data analysis.
Hydrogen/Deuterium Exchange Mass Spectrometry
MRJP1 samples (5 μM) were mixed with D2O-based labeling buffer in a 1:9 volume ratio at 22 °C. Aliquots of 200 μL were removed after 10 s, 1 min, 10 min, and 100 min and reactions quenched by adding an equal volume of an ice-cold solution containing 0.675 M guanidinium chloride, 1% formic acid, and 15 μL of a 3 mg mL−1 pepsin solution (final pH of 2.5). Offine pepsin digestion took place on ice for 1 min. The samples were flash-frozen in liquid nitrogen and stored at −80 °C prior to analysis. The aliquots were then rapidly thawed to ~0 °C and manually injected into a nanoACQUITY UPLC instrument with HDX technology (Waters). Desalting and peptide separation were performed at 0 °C within 25 min on an equilibrated reversed phase column (BEH C8, 1.7 μm particle size, 1 mm × 100 mm) using a water/acetonitrile gradient with 0.1% formic acid at a rate of 40 μL min−1. Analysis was performed on a Waters Synapt G2 mass spectrometer. Zero-time controls (m0) for the correction of in-exchange were performed by exposing MRJP1 to quenching buffer, followed by D2O exposure, resulting in the same final solution composition that was seen for all other samples. Controls for fully exchanged MRJP1 (m100, for the correction of back exchange) were prepared by incubating 5 μM MRJP1 in a labeling solution at pH 2.0 and 70 °C for 12 h. Normalized deuteration levels are reported as (mt − m0)/(m100 − m0) × 100%, where mt represents the centroid mass of the peptide of interest after HDX for time t. Extensive washing and blank injections were used between individual runs to prevent carryover, thereby eliminating false EX1 artifacts.34 Peptide identification was performed using MSE and PLGS version 2.5.3 (Waters). HDX data were analyzed using DynamX version 3.0 (Waters). All experiments were conducted in triplicate
Thirty-four peptic peptides could be consistently observed with adequate signal/noise (S/N) ratios across all four types of samples. The HDX/MS peptic digestion map is depicted in Figure S1, using the standard residue numbering of full-length MRJP1.9 Only peptides that were observed under all four conditions are shown, providing a sequence coverage of 55%. This relatively low coverage is partially attributed to the presence of glycans in G+ samples, which precluded the detection of peptides in the vicinity of glycosylation sites N144 and N177.24 Control experiments using trypsin yielded a sequence coverage of 64%, only slightly higher than that for pepsin (Figure S2). The sequence stretches covered by trypsin mapping resemble those detected after pepsin digestion. The limited sequence coverage seen with both proteases is consistent with the fact that MRJP1 experiences various post-translational modifications9,20 in addition to glycosylation.24 Any such covalent modifications will interfere with peptide matching, which relies on comparisons with the cDNA-derived MRJP1 sequence.9 Analyses of the apisimin HDX behavior were not possible because of the low signal intensity of the corresponding peptides.
RESULTS AND DISCUSSION
Stoichiometry of Native MRJP1/Apisimin Complexes
As a first step toward a comprehensive characterization of the MRJP1/apisimin system, we determined the composition of unmodified (A+G+) samples. Native ESI-MS35–38 of A+G+ yielded a series of peaks, corresponding to MRJP1/apisimin complex ions with an average mass of 231.88 kDa and charge states of 27+ to 32+ (Figure 1a). Collisional activation of 30+ precursor ions released monomeric species with an average mass of 51.97 kDa and charge states of 12+ to 20+ (Figure 1b). This dissociation behavior is similar to asymmetric charge partitioning events seen for other complexes.35 The spectrum in Figure 1b also shows an intense apisimin2+ signal, consistent with the expected 5.54 kDa mass of the peptide. Activation of the intact complex (m/z 7000–8000) in the HCD39 cell yielded a remarkably clean spectrum with three dominant peaks corresponding to apisimin 1+ to 3+ (Figure 1b, inset). Pseudo-MS3 was implemented by subjecting monomeric MRJP112+ to HCD, generating fragment ions that were matched to the expected sequence9 (Figure 1c). The matched fragments correspond to cleavages within the 35 N-terminal and 16 C-terminal residues, consistent with reports that glycosylation24 and other post-translational modifications9 affect only residues closer to the center of the sequence.
Figure 1.

(a) Native ESI mass spectrum of the MRJP1/apisimin complex isolated from RJ (A+G+ sample). (b) Collisional activation of 30+ precursor ions releases highly charged MRJP monomers and apisimin. The peak marked with an asterisk corresponds to apisimin2+ with an unidentified 222.15 Da adduct. The inset in panel b shows apisimin ions in charge states of 1+ to 3+, generated by collisional activation of the intact complex. (c) Deconvoluted top-down fragmentation spectrum of MRJP112+ precursor ions. The inset in panel c shows the graphical fragment map, with cleavage sites corresponding to N-terminal (b-type) ions and C-terminal (y-type) ions that could be matched to the protein sequence with a mass accuracy of <5 ppm. The fragmentation map of apisimin is included in the inset of panel b.
The data depicted in Figure 1 unambiguously reveal the binding stoichiometry of the MRJP1/apisimin complexes in A +G+ samples. The measured mass (231.88 kDa) represents 4 times the measured MRJP1 mass plus 4 times the mass of apisimin (4 × 51.97 kDa + 4 × 5.54 kDa = 230.04 kDa). The slight difference between the two values (231.88 kDa vs 230.04 kDa) likely reflects the loss of weakly bound nonspecific adducts during collisional activation, as previously reported for other protein complexes.35 Overall, we conclude that native A +G+ samples contain a substantial fraction of complexes with a (MRJP14 apisimin4) stoichiometry. The ESI-MS-derived mass is in reasonable agreement with estimates of ~290 kDa that had been obtained using light scattering.22 We do not rule out the possibility that larger aggregates may form under mildly denaturing conditions (e.g., at pH 9), as reported previously.22,26
The measured monomer mass (51.97 kDa) significantly exceeds that expected from the MRJP1 amino acid sequence (46.86 kDa).9 This 5.11 kDa difference is attributed largely to MRJP1 glycosylation.23–25 Glycosylation usually causes mass heterogeneity,40,41 consistent with the substantial width (full width at half-maximum of ≈1 kDa) of the spectral signals in Figure 1b. Other post-translational modifications may contribute to MRJP1 mass heterogeneity, as well.9,20
In addition to (MRJP14 apisimin4), native ESI-MS reveals the presence of monomeric MRJP1 in A+G+ samples (Figure S3). Unfortunately, detection biases and differences in ionization efficiency make it difficult to estimate the molar ratio of monomeric MRJP1 to (MRJP14 apisimin4) in solution from these ESI-MS data.38,42
Effects of Glycan and Apisimin on the Quaternary Structure of MRJP1
BN-PAGE is a complementary approach for monitoring biomolecular interactions. The association with Coomassie dye imparts negative charge to quasi-native proteins within the gel, allowing their electrophoretic separation while preserving interactions with binding partners.29,30 BN-PAGE was particularly useful for interrogating the properties of MRJP1 samples after apisimin depletion (A−) and after glycosylation (G−), because it was difficult to generate high-quality native ESI mass spectra (not shown) under those conditions. Hence, we applied BN-PAGE to MRJP1 samples of the type A+G+, A−G+, A−G−, as well as A+G− (Figure 2).
Figure 2.

BN-PAGE analyses of protein–protein interactions. Lane 1 contained MW markers. Lanes 2–5 show data for MRJP1 samples A+G+, AG+, A−G−, and A+G−, respectively.
A+G+ samples exhibit an intense band at a MWapp of ≈287 kDa corresponding to the native (MRJP14 apisimin4) complex. In addition, these samples show monomeric protein at a MWapp of ≈55 kDa. These data are in agreement with the native ESI-MS data depicted in Figure 1.
A−G+ and A−G− samples both exhibit BN-PAGE bands at a MWapp of ≈86 kDa. To interpret these bands, we recall two points that became apparent during sample preparation (as noted above). (i) Apisimin exhibits a a very high binding affinity for MRJP1.26 (ii) As a result of this high affinity, apisimin depletion in our “A−” samples was incomplete. The apisimin:MRJP1 ratio of these preparations was reduced by ~50% compared to that of the the original A+G+ samples. Accordingly, it seems likely that the MWapp ≈ 86 kDa bands predominantly correspond to (MRJP12 apisimin1) assemblies. The measured MWapp is lower than expected for such 2:1 complexes (theoretical MWs of 109.5 kDa for A−G+ and 99.3 kDa for A−G−). However, such deviations are quite common in BN-PAGE, where exposed hydrophobic areas can favor excessive Coomassie binding. Such conditions cause elevated electrophoretic mobilities that give rise to abnormally low MWapp values.43 A+G− samples form large assemblies that cannot migrate into the gel (last lane in Figure 2).
In summary, the combination of native ESI-MS and BN-PAGE yields a consistent picture of the binding stoichiometries for the different types of samples studied here. A+G+ samples contain (MRJP14 apisimin4) complexes, as well as MRJP1 monomers. A−G+ and A−G− conditions give rise to the formation of (MRJP12 apisimin1) complexes. The prevalence of dimeric MRJP1 assemblies in these perturbed samples suggests that native (MRJP14 apisimin4) possesses a “dimer of dimers” architecture. A similar situation is encountered for many other tetrameric proteins, where two pairs of tightly bound chains come together to form the overall complex.44–46 Large assemblies of the type (MRJP1m apisiminn), where m ≫ 4 and n ≫ 4, are encountered for A+G− samples.
Our data support the view11,26 that apisimin promotes the noncovalent association of MRJP1. Apisimin depletion shifts the binding stoichiometry from species containing four MRJP1 chains to assemblies that contain only two MRJP1 chains (Figure 2). After deglycosylation, the presence of apisimin triggers the formation of large aggregates [A+G− (Figure 2)]. The fact that these large assemblies form only after glycan removal points to the role of glycans as aggregation inhibitors, in line with reports for other proteins.47–49
Characterization by Optical Spectroscopy
Far-UV CD spectra provide insights into secondary structure50 (Figure 3a). A+G+ samples exhibited a main minimum at 208 nm. Deconvolution of this spectrum suggests 47% antiparallel β-sheet and 28% random coil, with the remainder being due to α-helices, parallel β-sheet, and β-turns. Apisimin depletion and/or deglycosylation caused only minor changes in the CD spectra. A+G− samples displayed a small shift in the position of the CD minimum from 208 to 207 nm, suggesting a 5% reduction in antiparallel β-sheet content and a subtle (2%) increase in random coil character. While these percentages represent only semiquantitative estimates,51,52 Figure 3a nonetheless indicates that MRJP1 exhibits a relatively high degree of disorder under all conditions studied.
Figure 3.

(a) Far-UV CD spectra and (b) Trp fluorescence emission spectra of the four types of MRJP1 samples.
MRJP1 possesses five Trp residues. The Trp emission maximum for A+G+ was at 335 nm (Figure 3b). The other three types of samples showed spectra that were slightly red-shifted, with maxima of 338 nm (A−G+), 341 nm (A−G−), and 340 nm (A+G−). These UV emission properties report on the environment of Trp side chains.53 The observed spectral shifts relative to A+G+ indicate structural changes from a hydrophobically buried environment to a conformation in which Trp side chains become slightly more solvent accessible.54,55 Thus, some hydrophobic contacts that exist in native MRJP1 (A+G+) become disrupted after apisimin depletion and/or deglycosylation.
The spectroscopic data of Figure 3 also provide insights into the nature of the large (MRJP1m apisiminn) assemblies formed under A+G− conditions. The CD and fluorescence signatures of these species remain quite similar to those seen for the other sample types. This behavior reflects the fact that the A+G− assemblies do not precipitate. Insoluble precipitates would show spectra with greatly reduced signal amplitudes and diminished S/N ratios.56,57 In other words, our data imply that A+G− conditions produce soluble aggregates, resembling the behavior seen for several other proteins under mildly denaturing conditions.58,59
Hydrogen/Deuterium Exchange
HDX/MS is a sensitive tool for examining how protein structure and dynamics respond to changes in biomolecular interactions or other external factors.45,60–62 HDX/MS measures the mass increase that results from the deuteration of backbone NH groups in D2O-based labeling buffer. At near-neutral pH, disordered segments undergo exchange with rate constants (kch) on the order of ≈1 s−1.63–65 HDX rates are greatly reduced in well-structured regions that are stabilized by backbone hydrogen bonds. These folded regions usually undergo deuteration in the EX2 regime, which is characterized by isotope envelopes that gradually shift toward higher masses. EX2 behavior is indicative of opening/closing transitions that take place on a time scale much faster than 1 s−1.63 Conversely, correlated opening/closing events much slower than 1 s−1 give rise to bimodal isotope distributions (commonly termed EX1 exchange).61,66,67
Representative HDX kinetic plots are depicted in Figure 4 (see Figure S4 for the complete data set). Most peptides exhibit deuteration levels greater than 50% already at the earliest labeling time point of 10 s. After 100 min, all peptides approach complete deuteration. This is in contrast to the behavior of many other proteins, which possess well-folded regions that are highly protected against HDX.45,68,69 The across-the-board rapid deuteration seen here for MRJP1 under the various experimental conditions is reminiscent of data previously reported for intrinsically disordered proteins.64,65,70,71
Figure 4.
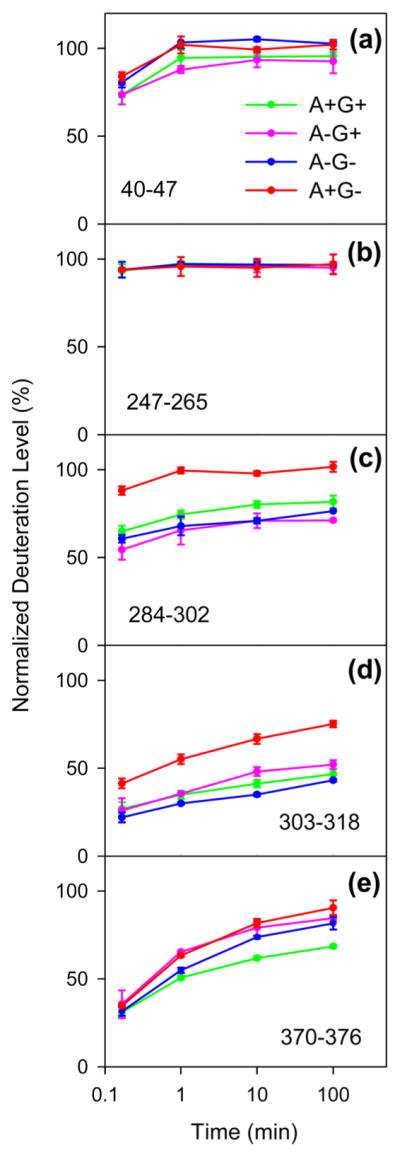
Kinetics of deuteration measured for various representative segments for the four types of MRJP1 samples. Each data point is the average of three independent measurements; error bars represent standard deviations.
To compare the properties of A+G+, A−G+, A−G−, and A +G− in a comprehensive fashion, we will focus on deuteration levels for t = 1 min (Figure 5a–d). The deuteration patterns of the four samples show many similarities. With a fully deuterated N-terminal region as a starting point, the HDX levels decline to values of ~60% for segment 69–77, suggesting some weak hydrogen bonding in this region, possibly in combination with sequestration of NH groups in the protein interior. Between residues 91 and 265, MRJP1 is highly disordered with deuteration values close to 100% for A+G+, A−G−, and A +G−, while slight protection is seen in this range for A−G+ (Figure 5b). Protection is most pronounced for all four samples beyond residue 265, with many deuteration values between 25 and 75%. We conclude that the C-terminal region comprising residues 266–432, while still being quite dynamic, is the most structured part of MRJP1.
Figure 5.

Deuteration levels measured for MRJP1 peptides after HDX for 1 min. Data for the four different conditions are indicated in panels a–d. Panels on the right-hand side show difference plots relative to the A+G+ data: (e) A−G+ minus A+G+, (f) A−G− minus A+G+, and (g) A+G−minus A+G+.
The subtle HDX changes caused by apisimin depletion and deglycosylation are best visualized by resorting to difference plots, using the A+G+ data as a reference. Negative values for A−G+ in the range of residues 202–302 reveal that A−G+ is slightly more protected in this region than A+G+ is (Figure 5e). The HDX properties of A−G− are quite similar to those of A+G+, which is evident from difference values close to zero throughout the entire sequence range (Figure 5f). The largest changes are seen for A+G−, where the C-terminal region of residues 266–369 exhibits deuteration levels significantly elevated compared to those of A+G+ (Figure 5g).
To gain additional insights into the weak HDX protection observed under the four conditions, it is instructive to look at unprocessed mass spectra. Remarkably, all MRJP1 regions that showed incomplete deuteration exhibited bimodal isotope distributions, implying that HDX proceeds in the EX1 regime for all four conditions (Figure 6).61,66,67 Already after 10 s, the EX1 distributions showed a well-developed high-mass component, with an amplitude on the order of 30–60% for most peptides. This behavior reveals that all of the MRJP1/apisimin samples exist as partially structured species that are in equilibrium with conformers that are more unfolded. In addition, the reversible dissociation of higher-order structures into smaller building blocks (e.g., tetramer ↔ monomer transitions in the case of A+G+) could contribute to the observed EX1 behavior. The level of EX1 low-mass components diminished over time but remained detectable even after 100 min. These slow kinetics imply that the interconversion of partially structured species with more unfolded conformers takes place on a time scale of several hours.61,66,67
Figure 6.

Measured isotope distributions of MRJP1 segment 276–287 after deuteration for 10 s (a–d), and 100 min (e–h). The four columns of this figure are for the different types of samples, as indicated along the top. Also shown in each panel are Gaussian decompositions of the bimodal isotope distributions. Additional peptide data are shown in Figure S5.
Hydropathy Analysis
Most water-soluble proteins fold into structures in which nonpolar side chains are buried in the core, while hydrophilic residues remain solvent accessible.72,73 Our data demonstrate that MRJP1/apisimin complexes are quite disordered, without a well-developed core. However, it is known that even for such disordered proteins some clustering of nonpolar residues can take place, specifically in regions that are involved in intermolecular contacts.74,75
To identify possible MRJP1 regions that might show nonpolar clustering, we conducted a Kyte–Doolittle analysis,76 using the standard scale that ranges from −4.5 for Arg as the most hydrophilic residue to +4.5 for Ile as the most hydrophobic. The average hydropathy of MRJP1 is −0.44 ± 1, reflecting the low percentage of nonpolar residues in this protein. The 316VLFFGLV322 segment stands out as the most hydrophobic region, which is evident from the prominent spike centered at residue 319 in Figure 7a. Interestingly, this region is most protected against deuteration in unmodified MRJP1 (Figures 4d and 5a). As in the case of other disordered proteins,74,75 MRJP1 therefore contains at least one hydrophobic region that is relatively structured.
Figure 7.

Kyte–Doolittle hydropathy analyses of (a) MRJP1 and (b) apisimin, generated using http://web.expasy.org/protscale with a seven-residue averaging window and linear weighting. Key hydrophobic segments proposed to be involved in intermolecular contacts are highlighted.
In contrast to MRJP1, apisimin is quite hydrophobic with an average hydropathy of 0.95 ± 0.9 (Figure 7b). This nonpolar character is particularly pronounced for the C-terminal half of the peptide (25IVS…VFA54) that has a hydropathy of 1.4 ± 0.5.
Implications for the Native MRJP1/Apisimin Complex
The establishment of nonpolar contacts generally represents the dominant driving force for the formation of protein–protein interactions.77,78 This is particularly the case for intrinsically disordered proteins, in which the corresponding nonpolar regions tend to be among the most structured elements.74,75 Accordingly, the MRJP1 316VLFFGLV322 region is a prime candidate for the formation of intermolecular contacts because this segment exhibits the highest hydrophobicity (Figure 7a). The 316VLFFGLV322 region was not completely covered in our HDX experiments. However, the partially overlapping segment 303–318 showed the strongest protection in MRJP1 (Figures 4d and 5a), supporting the view that this region is a key binding element.
Our data (Figure 2) as well as earlier work11,26 demonstrate that the association of MRJP1 complexes is mediated by apisimin. The native ESI-MS data of Figure 1 uncovered the fact that these complexes possess a (MRJP14 apisimin4) stoichiometry, suggesting that apisimin acts as linker that binds MRJP1 monomers together. The hydrophobic nature of apisimin (Figure 7b) implies that these linkages are dominated by nonpolar contacts. It seems likely that linkages within the native (MRJP14 apisimin4) complex involve nonpolar contacts between the C-terminal half of apisimin (25IVS…VFA54) and the MRJP1 316VLFFGLV322 segment (Figure 7).
CONCLUSIONS
Previous efforts to generate high-resolution structural data for MRJP1 were unsuccessful. In the study presented here, we applied a range of biophysical techniques, each of which provides insights into specific aspects of protein conformations and interactions. The information obtained allows us to propose simple structural models of MRJP1/apisimin complexes that are encountered for the four types of samples studied here. All of the species (A+G+, A−G+, A−G−, and A+G−) are relatively disordered, and they undergo slow (EX1) interconversion with coexisting species that are even more unfolded.
Native A+G+ conditions favor the presence of (MRJP14 apisimin4) complexes (Figure 8a). The MRJP1 chains within these complexes are largely unstructured in the range of residues 20–265; this includes glycan attachment sites N144 and N177. Residues 266–432 adopt a marginally stable fold that may be organized in an antiparallel β-sheet conformation, as suggested by the CD data of Figure 3. The 316VLFFGLV322 hydrophobic segment is among the most structured segments. Apisimin acts as an α-helical linker that binds the MRJP1 chains together. A key element of these interactions are nonpolar contacts between 316VLFFGLV322 and the hydrophobic C-terminal portion of apisimin (25IVS…VFA54). In addition, direct contacts between adjacent MRJP1 chains cannot be ruled out. The four MRJP1 molecules are assembled in a “dimer of dimers” architecture, implying the presence of two tight subunit–subunit interfaces and two loose interfaces (corresponding to the horizontal and vertical contacts in Figure 8a, respectively). The relatively low ESI charge states formed in the native solution (Figure 1a) indicate that despite their disorder, the overall structure of the (MRJP14 apisimin4) complexes is quite compact.79
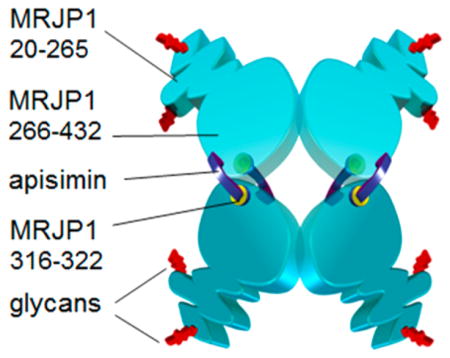
Figure 8.

Cartoon models of MRJP1/apisimin complexes. (a) A+G+ conditions favor (MRJP14 apisimin4) assemblies; apisimin acts as a hydrophobic linker that connects the relatively structured MRJP1 C-terminal regions. The N-terminal regions are disordered. Apisimin-depleted samples (b) A−G+ and (c) A−G− form (MRJP12 apisimin1) complexes. (d) A+G− samples undergo apisimin-mediated formation of soluble aggregates. MRJP1 is colored light blue. Apisimin is colored dark purple. Glycans at N144 and N177 are colored red. The hydrophobic MRJP1 segment of residues 316–322 is colored yellow.
In A−G+ and A−G− samples, the apisimin concentration is reduced by roughly 50% relative to those of the A+G+ preparations. Linker depletion causes dissociation of (MRJP14 apisimin4) into (MRJP12 apisimin1) subcomplexes, as indicated in panels b and c of Figure 8. This dissociation causes only minor changes in the overall conformational properties of the MRJP1 chains. However, Trp side chains become more solvent accessible, and newly exposed interfaces cause excessive Coomassie dye binding, consistent with the disruption of protein–protein contacts.
The glycan chains at residues N144 and N177 play a role in controlling the degree to which apisimin can cause association of MRJP1 into larger aggregates. For other proteins, it has been demonstrated that glycans can inhibit aggregation, because steric clashes of the heavily hydrated sugar chains interfere with self-association of the protein.47–49 In the case of MRJP1, deglycosylation results in apisimin-mediated association into large soluble assemblies of the type (MRJP1m apisiminn) where m ≫ 4 and n ≫ 4. These A+G− conditions destabilize previously existing backbone hydrogen bonds in the range of residues 266–432 (Figure 8d).
From the proposed structural models of Figure 8, uncovering the exact mechanism by which MRJP1 might tap into EGFR-mediated events that trigger the development of bee larvae into queens still requires a great deal of work.15–17 With the nutritional role of MRJP1 in mind,9,14 the semiunfolded nature of (MRJP14 apisimin4) complexes in RJ may be important for ensuring efficient hydrolysis by proteases in the larval digestive tract.80 Interestingly, proteomic analyses have uncovered significant differences in the makeup of the gastrointestinal enzymes of queens relative to that of worker bees and drones.81 It seems likely that queen development is not triggered by the intact (MRJP14 apisimin4) complexes per se, but by proteolytic products that are generated in the digestive tract and absorbed into the hemolymph.
Considering the disordered nature of native MRJP1/apisimin complexes, it is not surprising that crystallization efforts (in M.V.d.S.’s laboratory, unpublished observations) were unsuccessful. In previous work on other proteins, HDX/MS was applied to pinpoint regions of disorder, thereby allowing the design of “disorder-depleted” constructs that then yielded high-quality crystals.82 Our HDX/MS experiments identify residues 20–265 as the most disordered region within native MRJP1/apisimin assemblies. In future studies, it will be interesting to perform crystallization trials on constructs where this N-terminal part of MRJP1 has been deleted. Our data predict that such constructs should still be able to form tetrameric assemblies with apisimin (Figure 8a), because we believe the apisimin binding site to be in the vicinity of residue 320.
Supplementary Material
Acknowledgments
Funding
Funding was provided by Grants 479260/2010-9, 483191/2013-2, and 309338/2013-1 from the Brazilian Research Council and 0439/11 CT-INFRA-PROINFRA 02/2010 from Finaciadora de Estudos e Projetos to M.V.d.S. Additional funding was provided by the Natural Sciences and Engineering Research Council of Canada (DG 217080-2013 to L.K.) and by the National Institute on Drug Abuse (P30-DA018310 to N.L.K.). S.C.M. is recipient of a stipend from CAPES (99999.004417/2014-03). L.H.F.d.V. was supported by CNPq Research Grant 400301/2014-8 from the Brazilian government. O.S.S. was funded by National Science Foundation Graduate Research Fellowship 2014171659.
ABBREVIATIONS
- BN-PAGE
blue native polyacrylamide gel electrophoresis
- CD
circular dichroism
- EGFR
epidermal growth factor receptor
- ESI
electrospray ionization
- HDX
hydrogen/deuterium (H1/H2) exchange
- MS
mass spectrometry
- MWapp
apparent molecular weight from gel electrophoresis
- PNGase F, peptide
N-glycosidase F
Footnotes
Notes
The authors declare no competing financial interest.
The Supporting Information is available free of charge on the ACS Publications website at DOI: 10.1021/acs.bio-chem.7b00020.
Peptic digestion map of MRJP1 (Figure S1), tryptic digestion map of MRJP1 (Figure S2), full native MS spectrum of the MRJP1/apisimin complex (Figure S3), summary of MRJP1 HDX/MS kinetics (Figure S4), and EX1 isotope distributions of selected peptides (Figure S5) (PDF)
References
- 1.Haydak MH. Honey Bee Nutrition. Annu Rev Entomol. 1970;15:143–156. [Google Scholar]
- 2.Patel NG, Haydak MH, Gochnauer TA. Electrophoretic components of the proteins in honeybee larval food. Nature. 1960;186:633–634. doi: 10.1038/186633a0. [DOI] [PubMed] [Google Scholar]
- 3.Guo XQ, Su SK, Skogerboe G, Dai SAJ, Li WF, Li ZG, Liu F, Ni RF, Guo Y, Chen SL, Zhang SW, Chen RS. Recipe for a Busy Bee: MicroRNAs in Honey Bee Caste Determination. PLoS One. 2013;8:e81661. doi: 10.1371/journal.pone.0081661. [DOI] [PMC free article] [PubMed] [Google Scholar]
- 4.Spannhoff A, Kim YK, Raynal NJM, Gharibyan V, Su MB, Zhou YY, Li J, Castellano S, Sbardella G, Issa JPJ, Bedford MT. Histone deacetylase inhibitor activity in royal jelly might facilitate caste switching in bees. EMBO Rep. 2011;12:238–243. doi: 10.1038/embor.2011.9. [DOI] [PMC free article] [PubMed] [Google Scholar]
- 5.Weinstock GM, et al. Insights into social insects from the genome of the honeybee Apis mellifera. Nature. 2006;443:931–949. doi: 10.1038/nature05260. [DOI] [PMC free article] [PubMed] [Google Scholar]
- 6.Shuel RW, Dixon SE. The early establishment of dimorphism in the female honeybee, Apis mellifera L. Insectes Soc. 1960;7:265–282. [Google Scholar]
- 7.Wang Y, Li-Byarlay H. Physiological and Molecular Mechanisms of Nutrition in Honey Bees. In: Jurenka R, editor. Advances in Insect Physiology. Academic Press Ltd.-Elsevier Science Ltd; London: 2015. pp. 25–58. [Google Scholar]
- 8.Brouwers EVM, Ebert R, Beetsma J. Behavioral and physiological aspects of nurse bees in relation to the composition of larval food during caste differentiation in the honeybee. J Apic Res. 1987;26(26):11–23. [Google Scholar]
- 9.Schmitzova J, Klaudiny J, Albert S, Schroder W, Schreckengost W, Hanes J, Judova J, Simuth J. A family of major royal jelly proteins of the honeybee Apis mellifera L. Cell Mol Life Sci. 1998;54:1020–1030. doi: 10.1007/s000180050229. [DOI] [PMC free article] [PubMed] [Google Scholar]
- 10.Buttstedt A, Moritz RFA, Erler S. Origin and function of the major royal jelly proteins of the honeybee (Apis mellifera) as members of the yellow gene family. Biological Reviews. 2014;89:255–269. doi: 10.1111/brv.12052. [DOI] [PubMed] [Google Scholar]
- 11.Tamura S, Amano S, Kono T, Kondoh J, Yamaguchi K, Kobayashi S, Ayabe T, Moriyama T. Molecular characteristics and physiological functions of major royal jelly protein 1 oligomer. Proteomics. 2009;9:5534–5543. doi: 10.1002/pmic.200900541. [DOI] [PubMed] [Google Scholar]
- 12.Albert T, Klaudiny J. The MRJP/YELLOW protein family of Apis mellifera: Identification of new members in the EST library. J Insect Physiol. 2004;50:51–59. doi: 10.1016/j.jinsphys.2003.09.008. [DOI] [PubMed] [Google Scholar]
- 13.Schonleben S, Sickmann A, Mueller MJ, Reinders J. Proteome analysis of Apis mellifera royal jelly. Anal Bioanal Chem. 2007;389:1087–1093. doi: 10.1007/s00216-007-1498-2. [DOI] [PubMed] [Google Scholar]
- 14.Furusawa T, Rakwal R, Nam HW, Shibato J, Agrawal GK, Kim YS, Ogawa Y, Yoshida Y, Kouzuma Y, Masuo Y, Yonekura M. Comprehensive royal jelly (RJ) proteomics using one- and two-dimensional proteomics platforms reveals novel RJ proteins and potential phospho/glycoproteins. J Proteome Res. 2008;7:3194–3229. doi: 10.1021/pr800061j. [DOI] [PubMed] [Google Scholar]
- 15.Kamakura M. Royalactin induces queen differentiation in honeybees. Nature. 2011;473:478–483. doi: 10.1038/nature10093. [DOI] [PubMed] [Google Scholar]
- 16.Buttstedt A, Ihling CH, Pietzsch M, Moritz RFA. Royalactin is not a royal making of a queen. Nature. 2016;537:E10–E12. doi: 10.1038/nature19349. [DOI] [PubMed] [Google Scholar]
- 17.Kamakura M. Royalactin is not a royal making of a queen Reply. Nature. 2016;537:E13–E13. doi: 10.1038/nature19349. [DOI] [PubMed] [Google Scholar]
- 18.Brudzynski K, Sjaarda C, Lannigan R. MRJP1-containing glycoproteins isolated from honey, a novel antibacterial drug candidate with broad spectrum activity against multi-drug resistant clinical isolates. Front Microbiol. 2015;6:711. doi: 10.3389/fmicb.2015.00711. [DOI] [PMC free article] [PubMed] [Google Scholar]
- 19.Fan P, Han B, Feng M, Fang Y, Zhang L, Hu H, Hao Y, Qi YP, Zhang XZ, Li JK. Functional and Proteomic Investigations Reveal Major Royal Jelly Protein 1 Associated with Anti-hypertension Activity in Mouse Vascular Smooth Muscle Cells. Sci Rep. 2016;6:30230. doi: 10.1038/srep30230. [DOI] [PMC free article] [PubMed] [Google Scholar]
- 20.Han B, Fang Y, Feng M, Lu XS, Huo XM, Meng LF, Wu B, Li JK. In-Depth Phosphoproteomic Analysis of Royal Jelly Derived from Western and Eastern Honeybee Species. J Proteome Res. 2014;13:5928–5943. doi: 10.1021/pr500843j. [DOI] [PubMed] [Google Scholar]
- 21.Hanes J, Simuth J. Identification and partial characterization of the major royal jelly protein of the honey-bee (Apis-mellifera L) J Apic Res. 1992;31:22–26. [Google Scholar]
- 22.Cruz GCN, Garcia L, Silva AJ, Barbosa J, Ricart CAO, Freitas SM, Sousa MV. Calcium effect and pH-dependence on self-association and structural stability of the Apis mellifera major royal jelly protein 1. Apidologie. 2011;42:252–269. [Google Scholar]
- 23.Kimura Y, Nagai H, Miyamoto M, Kimura M, Yonekura M. Identification of a Royal Jelly Glycoprotein That Carries Unique Complex-Type N-Glycans Harboring the T-Antigen (Gal beta 1–3GalNAc) Unit. Biosci, Biotechnol, Biochem. 2010;74:2148–2150. doi: 10.1271/bbb.100472. [DOI] [PubMed] [Google Scholar]
- 24.Feng M, Fang Y, Han B, Xu X, Fan P, Hao Y, Qi YP, Hu H, Huo XM, Meng LF, Wu B, Li JK. In-Depth N-Glycosylation Reveals Species-Specific Modifications and Functions of the Royal Jelly Protein from Western (Apis mellifera) and Eastern Honeybees (Apis cerana) J Proteome Res. 2015;14:5327–5340. doi: 10.1021/acs.jproteome.5b00829. [DOI] [PubMed] [Google Scholar]
- 25.Ohashi K, Natori S, Kubo T. Change in the mode of gene expression of the hypopharyngeal gland cells with an age-dependent role change of the worker honeybee Apis mellifera L. Eur J Biochem. 1997;249:797–802. doi: 10.1111/j.1432-1033.1997.t01-1-00797.x. [DOI] [PubMed] [Google Scholar]
- 26.Bilikova K, Hanes J, Nordhoff E, Saenger W, Klaudiny J, Simuth J. Apisimin, a new serine-valine-rich peptide from honeybee (Apis mellifera L.) royal jelly: purification and molecular characterization. FEBS Lett. 2002;528:125–129. doi: 10.1016/s0014-5793(02)03272-6. [DOI] [PubMed] [Google Scholar]
- 27.Moriyama T, Ito A, Omote S, Miura Y, Tsumoto H. Heat Resistant Characteristics of Major Royal Jelly Protein 1 (MRJP1) Oligomer. PLoS One. 2015;10:e0119169. doi: 10.1371/journal.pone.0119169. [DOI] [PMC free article] [PubMed] [Google Scholar]
- 28.Tamura S, Kono T, Harada C, Yamaguchi K, Moriyama T. Estimation and characterisation of major royal jelly proteins obtained from the honeybee Apis merifera. Food Chem. 2009;114:1491–1497. [Google Scholar]
- 29.Schagger H, Cramer WA, Vonjagow G. Analysis of Molecular Masses and Oligomeric States of Protein Complexes by Blue Native Electrophoresis and Isolation of Membrane Protein Complexes by Two-Dimensional Native Electrophoresis. Anal Biochem. 1994;217:220–230. doi: 10.1006/abio.1994.1112. [DOI] [PubMed] [Google Scholar]
- 30.Wittig I, Braun HP, Schagger H. Blue native PAGE. Nat Protoc. 2006;1:418–428. doi: 10.1038/nprot.2006.62. [DOI] [PubMed] [Google Scholar]
- 31.Skinner OS, Do Vale LHF, Catherman AD, Havugimana PC, Sousa MVd, Compton PD, Kelleher NL. Native GELFrEE: A New Separation Technique for Biomolecular Assemblies. Anal Chem. 2015;87:3032–3038. doi: 10.1021/ac504678d. [DOI] [PubMed] [Google Scholar]
- 32.Strohalm M, Kavan D, Novak P, Volny M, Havlicek V. mMass 3: A Cross-Platform Software Environment for Precise Analysis of Mass Spectrometric Data. Anal Chem. 2010;82:4648–4651. doi: 10.1021/ac100818g. [DOI] [PubMed] [Google Scholar]
- 33.Wojcik R, Dada OO, Sadilek M, Dovichi NJ. Simplified capillary electrophoresis nanospray sheath-flow interface for high efficiency and sensitive peptide analysis. Rapid Commun Mass Spectrom. 2010;24:2554–2560. doi: 10.1002/rcm.4672. [DOI] [PubMed] [Google Scholar]
- 34.Fang J, Rand KD, Beuning PJ, Engen JR. False EX1 signatures caused by sample carryover during HX MS analyses. Int J Mass Spectrom. 2011;302:19–25. doi: 10.1016/j.ijms.2010.06.039. [DOI] [PMC free article] [PubMed] [Google Scholar]
- 35.Benesch JLP, Ruotolo BT, Simmons DA, Robinson CV. Protein Complexes in the Gas Phase: Technology for Structural Genomics and Proteomics. Chem Rev. 2007;107:3544–3567. doi: 10.1021/cr068289b. [DOI] [PubMed] [Google Scholar]
- 36.Kaddis CS, Loo JA. Native Protein MS and Ion Mobility: Large Flying Proteins with ESI. Anal Chem. 2007;79:1778–1784. doi: 10.1021/ac071878c. [DOI] [PubMed] [Google Scholar]
- 37.Snijder J, Heck AJR. Analytical Approaches for Size and Mass Analysis of Large Protein Assemblies. Annu Rev Anal Chem. 2014;7:43–64. doi: 10.1146/annurev-anchem-071213-020015. [DOI] [PubMed] [Google Scholar]
- 38.Kitova EN, El-Hawiet A, Schnier PD, Klassen JS. Reliable Determinations of Protein–Ligand Interactions by Direct ESI-MS Measurements. Are We There Yet? J Am Soc Mass Spectrom. 2012;23:431–441. doi: 10.1007/s13361-011-0311-9. [DOI] [PubMed] [Google Scholar]
- 39.Olsen JV, Macek B, Lange O, Makarov A, Horning S, Mann M. Higher-energy C-trap dissociation for peptide modification analysis. Nat Methods. 2007;4:709–712. doi: 10.1038/nmeth1060. [DOI] [PubMed] [Google Scholar]
- 40.Nicolardi S, Deelder AM, Palmblad M, van der Burgt YEM. Structural Analysis of an Intact Monoclonal Antibody by Online Electrochemical Reduction of Disulfide Bonds and Fourier Transform Ion Cyclotron Resonance Mass Spectrometry. Anal Chem. 2014;86:5376–5382. doi: 10.1021/ac500383c. [DOI] [PubMed] [Google Scholar]
- 41.Shaw JB, Lin TY, Leach FE, III, Tolmachev AV, Tolić N, Robinson EW, Koppenaal DW, Paša-Tolić L. 21 T Fourier Transform Ion Cyclotron Resonance Mass Spectrometer Greatly Expands Mass Spectrometry Toolbox. J Am Soc Mass Spectrom. 2016;27:1929–1936. doi: 10.1007/s13361-016-1507-9. [DOI] [PubMed] [Google Scholar]
- 42.Kuprowski MC, Konermann L. Signal Response of Co-Existing Protein Conformers in Electrospray Mass Spectrometry. Anal Chem. 2007;79:2499–2506. doi: 10.1021/ac0620056. [DOI] [PubMed] [Google Scholar]
- 43.Crichton PG, Harding M, Ruprecht JJ, Lee Y, Kunji ERS. Lipid, Detergent, and Coomassie Blue G-250 Affect the Migration of Small Membrane Proteins in Blue Native Gels. J Biol Chem. 2013;288:22163–22173. doi: 10.1074/jbc.M113.484329. [DOI] [PMC free article] [PubMed] [Google Scholar]
- 44.Griffith WP, Kaltashov IA. Highly asymmetric interactions between globin chains during hemoglobin assembly revealed by electrospray ionization mass spectrometry. Biochemistry. 2003;42:10024–10033. doi: 10.1021/bi034035y. [DOI] [PubMed] [Google Scholar]
- 45.Sowole MA, Simpson SA, Skovpen YV, Palmer DRJ, Konermann L. Evidence of Allosteric Enzyme Regulation via Changes in Conformational Dynamics: A Hydrogen/Deuterium Exchange Investigation of Dihydrodipicolinate Synthase. Biochemistry. 2016;55:5413–5422. doi: 10.1021/acs.biochem.6b00764. [DOI] [PubMed] [Google Scholar]
- 46.Andreas LB, Reese M, Eddy MT, Gelev V, Ni QZ, Miller EA, Emsley L, Pintacuda G, Chou JJ, Griffin RG. Structure and Mechanism of the Influenza A M2(18–60) Dimer of Dimers. J Am Chem Soc. 2015;137:14877–14886. doi: 10.1021/jacs.5b04802. [DOI] [PMC free article] [PubMed] [Google Scholar]
- 47.Rajan RS, Li TS, Aras M, Sloey C, Sutherland W, Arai H, Briddell R, Kinstler O, Lueras AMK, Zhang Y, Yeghnazar H, Treuheit M, Brems DN. Modulation of protein aggregation by polyethylene glycol conjugation: GCSF as a case study. Protein Sci. 2006;15:1063–1075. doi: 10.1110/ps.052004006. [DOI] [PMC free article] [PubMed] [Google Scholar]
- 48.Caramelo JJ, Parodi AJ. A sweet code for glycoprotein folding. FEBS Lett. 2015;589:3379–3387. doi: 10.1016/j.febslet.2015.07.021. [DOI] [PubMed] [Google Scholar]
- 49.Banks DD. The Effect of Glycosylation on the Folding Kinetics of Erythropoietin. J Mol Biol. 2011;412:536–550. doi: 10.1016/j.jmb.2011.07.061. [DOI] [PubMed] [Google Scholar]
- 50.Chou PY, Fasman GD. Empirical Predictions of Protein Conformation. Annu Rev Biochem. 1978;47:251–276. doi: 10.1146/annurev.bi.47.070178.001343. [DOI] [PubMed] [Google Scholar]
- 51.Matsuo K, Yonehara R, Gekko K. Improved estimation of the secondary structures of proteins by vacuum-ultraviolet circular dichroism spectroscopy. J Biochem. 2005;138:79–88. doi: 10.1093/jb/mvi101. [DOI] [PubMed] [Google Scholar]
- 52.Van Stokkum IHM, Spoelder HJW, Bloemendal M, Van Grondelle R, Groen FCA. Estimation of protein secondary structure and error analysis from circular dichroism spectra. Anal Biochem. 1990;191:110–118. doi: 10.1016/0003-2697(90)90396-q. [DOI] [PubMed] [Google Scholar]
- 53.Chen Y, Barkley MD. Toward Understanding Tryptophan Fluorescence in Proteins. Biochemistry. 1998;37:9976–9982. doi: 10.1021/bi980274n. [DOI] [PubMed] [Google Scholar]
- 54.Nölting B, Golbik R, Fersht AR. Submillisecond events in protein folding. Proc Natl Acad Sci U S A. 1995;92:10668–10672. doi: 10.1073/pnas.92.23.10668. [DOI] [PMC free article] [PubMed] [Google Scholar]
- 55.van Holde K, Johnson W, Shing HP. Principles of Physical Biochemistry. 2. Pearson Prentice Hall; Upper Saddle River, NJ: 2006. [Google Scholar]
- 56.Kelly SW, Jess TJ, Price NC. How to Study Protein by Circular Dichroism. Biochim Biophys Acta, Proteins Proteomics. 2005;1751:119–139. doi: 10.1016/j.bbapap.2005.06.005. [DOI] [PubMed] [Google Scholar]
- 57.Xu Q, Keiderling TA. Effect of Sodium Dodecyl Surfate on Folding and Thermal Stability of Acid-denatured Cytochrome c: A Spectroscopic approach. Protein Sci. 2004;13:2949–2959. doi: 10.1110/ps.04827604. [DOI] [PMC free article] [PubMed] [Google Scholar]
- 58.Fink AL. Protein aggregation: folding aggregates, inclusion bodies and amyloid. Folding Des. 1998;3:R9–R23. doi: 10.1016/S1359-0278(98)00002-9. [DOI] [PubMed] [Google Scholar]
- 59.Zhang Y, Rempel DL, Zhang J, Sharma AK, Mirica LM, Gross ML. Pulsed hydrogen-deuterium exchange mass spectrometry probes conformational changes in amyloid beta (A beta) peptide aggregation. Proc Natl Acad Sci U S A. 2013;110:14604–14609. doi: 10.1073/pnas.1309175110. [DOI] [PMC free article] [PubMed] [Google Scholar]
- 60.Wales TE, Engen JR. Hydrogen Exchange Mass Spectrometry for the Analysis of Protein Dynamics. Mass Spectrom Rev. 2006;25:158–170. doi: 10.1002/mas.20064. [DOI] [PubMed] [Google Scholar]
- 61.Percy AJ, Rey M, Burns KM, Schriemer DC. Probing protein interactions with hydrogen/deuterium exchange and mass spectrometry-A review. Anal Chim Acta. 2012;721:7–21. doi: 10.1016/j.aca.2012.01.037. [DOI] [PubMed] [Google Scholar]
- 62.Marciano DP, Dharmarajan V, Griffin PR. HDX-MS guided drug discovery: small molecules and biopharmaceuticals. Curr Opin Struct Biol. 2014;28:105–111. doi: 10.1016/j.sbi.2014.08.007. [DOI] [PMC free article] [PubMed] [Google Scholar]
- 63.Bai Y, Milne JS, Mayne L, Englander SW. Primary Structure Effects on Peptide Group Hydrogen Exchange. Proteins: Struct, Funct, Genet. 1993;17:75–86. doi: 10.1002/prot.340170110. [DOI] [PMC free article] [PubMed] [Google Scholar]
- 64.Keppel TR, Weis DD. Analysis of disordered proteins using a simple apparatus for millisecond quench-flow H/D exchange. Anal Chem. 2013;85:5161–5168. doi: 10.1021/ac4004979. [DOI] [PubMed] [Google Scholar]
- 65.Rob T, Liuni P, Gill PK, Zhu SL, Balachandran N, Berti PJ, Wilson DJ. Measuring Dynamics in Weakly Structured Regions of Proteins Using Microfluidics-Enabled Sub-second H/D Exchange Mass Spectrometry. Anal Chem. 2012;84:3771–3779. doi: 10.1021/ac300365u. [DOI] [PubMed] [Google Scholar]
- 66.Konermann L, Tong X, Pan Y. Protein Structure and Dynamics Studied by Mass Spectrometry: H/D exchange, hydroxyl radical labeling, and related approaches. J Mass Spectrom. 2008;43:1021–1036. doi: 10.1002/jms.1435. [DOI] [PubMed] [Google Scholar]
- 67.Xiao H, Hoerner JK, Eyles SJ, Dobo A, Voigtman E, Mel’Cuk AI, Kaltashov IA. Mapping protein energy landscapes with amide hydrogen exchange and mass spectrometry: I. A generalized model for a two-state protein and comparison with experiment. Protein Sci. 2005;14:543–557. doi: 10.1110/ps.041001705. [DOI] [PMC free article] [PubMed] [Google Scholar]
- 68.Pan Y, Briggs MS. Hydrogen Exchange in Native and Alcohol Forms of Ubiquitin. Biochemistry. 1992;31:11405–11412. doi: 10.1021/bi00161a019. [DOI] [PubMed] [Google Scholar]
- 69.Johnson RS, Walsh KA. Mass spectrometric measurement of protein amide hydrogen exchange rates of apo- and holo-myoglobin. Protein Sci. 1994;3:2411–2418. doi: 10.1002/pro.5560031224. [DOI] [PMC free article] [PubMed] [Google Scholar]
- 70.Beveridge R, Chappuis Q, MacPhee CE, Barran P. Mass spectrometry methods for intrinsically disordered proteins. Analyst. 2013;138:32–42. doi: 10.1039/c2an35665a. [DOI] [PubMed] [Google Scholar]
- 71.Killoran RC, Sowole MA, Halim MA, Konermann L, Choy WY. Conformational characterization of the intrinsically disordered protein Chibby: Interplay between structural elements in target recognition. Protein Sci. 2016;25:1420–1429. doi: 10.1002/pro.2936. [DOI] [PMC free article] [PubMed] [Google Scholar]
- 72.Southall NT, Dill KA, Haymet ADJ. A View of the Hydrophobic Effect. J Phys Chem B. 2002;106:521–533. [Google Scholar]
- 73.Fersht AR. Structure and Mechanism in Protein Science. W. H. Freeman & Co; New York: 1999. [Google Scholar]
- 74.Dyson HJ, Wright PE. Intrinsically Unstructured Proteins and Their Function. Nat Rev Mol Cell Biol. 2005;6:197–208. doi: 10.1038/nrm1589. [DOI] [PubMed] [Google Scholar]
- 75.Forman-Kay JD, Mittag T. From Sequence and Forces to Structure, Function, and Evolution of Intrinsically Disordered Proteins. Structure. 2013;21:1492–1499. doi: 10.1016/j.str.2013.08.001. [DOI] [PMC free article] [PubMed] [Google Scholar]
- 76.Kyte J, Doolittle R. A simple method for displaying the hydropathic character of a protein. J Mol Biol. 1982;157:105–132. doi: 10.1016/0022-2836(82)90515-0. [DOI] [PubMed] [Google Scholar]
- 77.Bissantz C, Kuhn B, Stahl M. A Medicinal Chemist’s Guide to Molecular Interactions. J Med Chem. 2010;53:5061–5084. doi: 10.1021/jm100112j. [DOI] [PMC free article] [PubMed] [Google Scholar]
- 78.Vallone B, Miele AE, Vecchini P, Chiancone E, Brunori M. Free energy of burying hydrophobic residues in the interface between protein subunits. Proc Natl Acad Sci U S A. 1998;95:6103–6107. doi: 10.1073/pnas.95.11.6103. [DOI] [PMC free article] [PubMed] [Google Scholar]
- 79.Dobo A, Kaltashov IA. Detection of Multiple Protein Conformational Ensembles in Solution via Deconvolution of Charge-State Distributions in ESI MS. Anal Chem. 2001;73:4763–4773. doi: 10.1021/ac010713f. [DOI] [PubMed] [Google Scholar]
- 80.Burgess EPJ, Malone LA, Christeller JT. Effects of two proteinase inhibitors on the digestive enzymes and survival of honey bees (Apis mellifera) J Insect Physiol. 1996;42:823–828. [Google Scholar]
- 81.Chan QWT, Chan MY, Logan M, Fang Y, Higo H, Foster LJ. Honey bee protein atlas at organ-level resolution. Genome Res. 2013;23:1951–1960. doi: 10.1101/gr.155994.113. [DOI] [PMC free article] [PubMed] [Google Scholar]
- 82.Pantazatos D, Kim JS, Klock HE, Stevens RC, Wilson IA, Lesley SA, Woods VL. Rapid refinement of crystallographic protein construct definition employing enhanced hydrogen/deuterium exchange MS. Proc Natl Acad Sci U S A. 2004;101:751–756. doi: 10.1073/pnas.0307204101. [DOI] [PMC free article] [PubMed] [Google Scholar]
Associated Data
This section collects any data citations, data availability statements, or supplementary materials included in this article.