Modeling contrast material propagation through multicompartmental flow analysis offers validated contrast material dynamics in a population of patients, enabling systematic optimization of CT for image quality, radiation dose, and contrast material load.
Abstract
Purpose
To develop a method to incorporate the propagation of contrast material into computational anthropomorphic phantoms for estimation of organ dose at computed tomography (CT).
Materials and Methods
A patient-specific physiologically based pharmacokinetic (PBPK) model of the human cardiovascular system was incorporated into 58 extended cardiac-torso (XCAT) patient phantoms. The PBPK model comprised compartmental models of vessels and organs unique to each XCAT model. For typical injection protocols, the dynamics of the contrast material in the body were described according to a series of patient-specific iodine mass–balance differential equations, the solutions to which provided the contrast material concentration time curves for each compartment. Each organ was assigned to a corresponding time-varying iodinated contrast agent to create the contrast material–enhanced five-dimensional XCAT models, in which the fifth dimension represents the dynamics of contrast material. To validate the accuracy of the models, simulated aortic and hepatic contrast-enhancement results throughout the models were compared with previously published clinical data by using the percentage of discrepancy in the mean, time to 90% peak, peak value, and slope of enhancement in a paired t test at the 95% significance level.
Results
The PBPK model allowed effective prediction of the time-varying concentration curves of various contrast material administrations in each organ for different patient models. The contrast-enhancement results were in agreement with results of previously published clinical data, with mean percentage, time to 90% peak, peak value, and slope of less than 10% (P > .74), 4%, 7%, and 14% for uniphasic and 12% (P > .56), 4%, 12%, and 14% for biphasic injection protocols, respectively. The exception was hepatic enhancement results calculated for a uniphasic injection protocol for which the discrepancy was less than 25%.
Conclusion
A technique to model the propagation of contrast material in XCAT human models was developed. The models with added contrast material propagation can be applied to simulate contrast-enhanced CT examinations.
© RSNA, 2017
Introduction
Dramatic improvements in medical image quality and diagnosis have been introduced during the past 2 decades. Such advancements, particularly in computed tomography (CT), have resulted in improvements in patient diagnosis and treatment. To promise the most effective and safest use of imaging technology, optimization in the use of medical systems is more essential than ever. Clinical trials offer the most representative reflection of the performance of a system (1–3); however, clinical trials are cumbersome, costly, and impractical for many options for optimization. Virtual clinical trials, which involve the use of computational phantoms and models of the imaging process, can offer a more efficient means to evaluate current and emerging imaging systems and methods. Such trials are being explored increasingly for imaging research (4–7).
Virtual clinical trials require a realistic computerized patient population to serve as the known truth. Myriad computerized human phantoms have been developed that can be used for virtual clinical trials (8–11). However, most of these phantoms are limited by their oversimplified stylized structures or representation of a small number of patient body sizes (12,13). To address these limitations, we have developed a large library of computerized four-dimensional extended cardiac-torso (XCAT) human models on the basis of real CT images encompassing diverse patient anatomy and body sizes (14). While effective for a wide range of medical imaging studies (15–18), the current XCAT models have a major drawback, which is the lack of modeling of the vascular and parenchymal enhancement that occurs during contrast material–enhanced CT. This severely limits the use of XCAT in virtual studies to evaluate and optimize current CT imaging technology.
In clinical practice, contrast material is used widely to improve image quality and diagnostic sensitivity and specificity. More than 60% of cross-sectional body imaging (CT and magnetic resonance imaging) performed in the United States involves the use of contrast material. Contrast material affects not only image quality (thus the reason for its use) but also radiation dose because of increased x-ray absorption (19). Therefore, the incorporation of contrast material to optimize CT continues to be a major need, particularly in light of the results of some published articles (20–22) that highlight the increased frequency of double-strand DNA breaks in the presence of iodinated contrast material in the blood during CT. In this article, we aim to develop a platform to incorporate the propagation of contrast material and to build toward the first generation of contrast-enhanced human models. The second article in this series will then extend the work in calculating patient-specific organ and effective doses of contrast material.
Materials and Methods
Pharmacokinetic Model
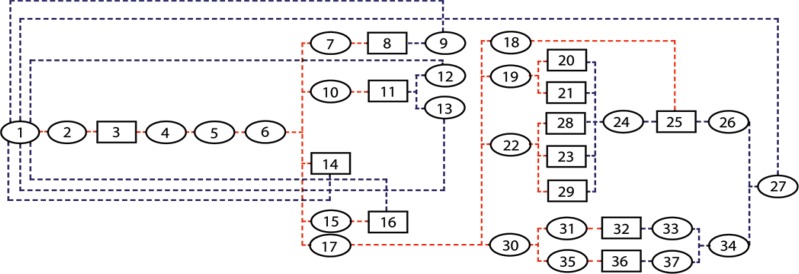
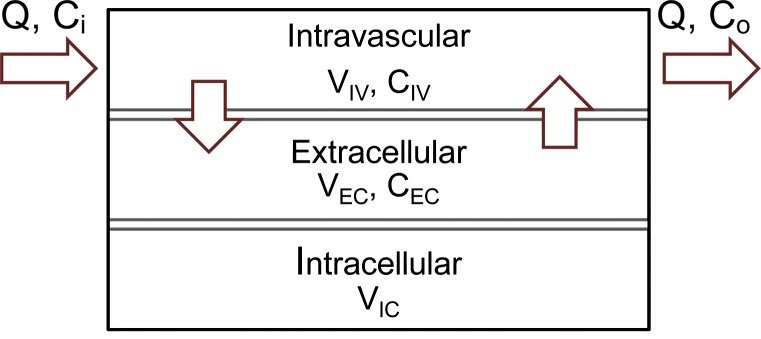
Authors of many studies (23–27) have attempted to simplify the inherent complexity of simulating the propagation of contrast material throughout the cardiovascular system, which can be substantial. In this work, we adopted a previously published physiologically based pharmacokinetic (PBPK) model of the cardiovascular system for the prediction of vascular and parenchymal contrast-enhancement rates (27–31). The model consisted of a network of compartments representing the key organs and vessels shown in Figure 1. Each organ compartment was further modeled into three subcompartments: intravascular, extracellular, and intracellular compartments (Fig 2). In this model, the contrast medium was injected into the injection vessel in the antecubital site, mixed in the right side of the heart, passed to the lung through the pulmonary artery, returned to the left side of the heart through the pulmonary vein, and finally, distributed throughout the body through the artery.
Figure 1:
Diagram shows PBPK compartmental model used for simulating pharmacokinetics of contrast medium through the cardiovascular system. Model includes 37 compartments: Each ellipse represents a vessel compartment and each box represents an organ, with numbers corresponding to compartment numbers in Table 1. Red dashed lines show first path of contrast material, while blue dashed lines show return path of contrast material from organs to heart.
Figure 2a:
(a) Organ and (b) vessel compartments. Each organ is modeled with three subcompartments: Intravascular (IV), extracellular (EC), and intracellular (IC). CIV and CEC are intravascular and extracellular concentrations, and VIV and VEC are intravascular and extracellular volumes. Note that input and output blood flow rates (Q) are assumed to be equal.
Figure 2b:

(a) Organ and (b) vessel compartments. Each organ is modeled with three subcompartments: Intravascular (IV), extracellular (EC), and intracellular (IC). CIV and CEC are intravascular and extracellular concentrations, and VIV and VEC are intravascular and extracellular volumes. Note that input and output blood flow rates (Q) are assumed to be equal.
To construct the PBPK model for each XCAT phantom, a set of initial adjustments was required. This primary model with initial estimated and collected values is referred to as the standard contrast material model. The average blood volume of 5 L (3 L of plasma and 2 L of red blood cells [30]) and cardiac output of 6 L/min were used in this standard model. Each individual’s tissue volume, blood flow rate, and blood distribution at different regions as well as the intravascular, extracellular, and intracellular distribution of body fluid were determined from available physiologic data. For a 70-kg adult patient, the total body fluid was assumed to be 40 L (33,34). Depending on the contrast material injected, the extracellular fluid volume ranged from 9 L to 22 L. The extracellular fluid volume decreased as the molecular weight of the contrast material increased. The total extracellular fluid volume (including 3 L of plasma) used in this model was 18.9 L (calculated by using 0.27 as the apparent volume value of distribution of iohexol), or 15.9 L without plasma (34). For a typical adult patient with blood volume of approximately 5 L, the total intracellular fluid volume (19.1 L) was calculated as the difference in the total body fluid (40 L) and total extracellular fluid volume (18.9 L). In the absence of information about extracellular and intracellular fluid volume for individual organs, an assumption was made to estimate the fluid volume of individual organs by using the total fixed ratio of 0.83, which is the ratio of the total extracellular fluid volume and intracellular fluid volume (ie, 15.9/19.1 = 0.83). Finally, the capillary volume and regional blood flow rates (3) were assigned on the basis of available physiologic data (32,36). The regional blood flow data of the standard model, including the estimated blood flow rate and intravascular and extracellular volume, are listed in Table 1. Knowing the design of the PBPK model of the cardiovascular system, we applied an analytical technique to model the dynamics of contrast material in the human body (Appendix E1 [online]).
Table 1.
Estimated Blood Distribution in the Vascular System, Blood Flow Rate, and Capillary Volumes Used in PBPK Standard Model
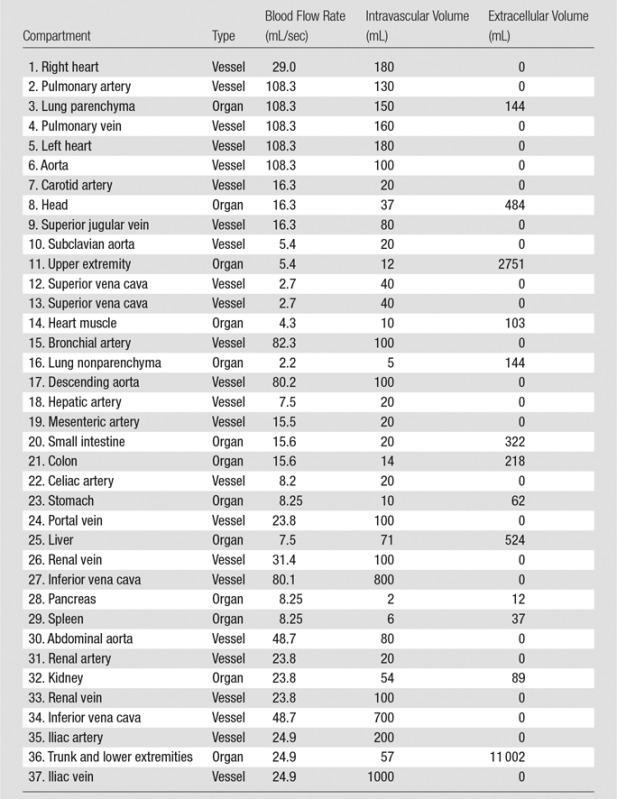
Note.—The compartments are numbered in the order in which they appear in Figure 1. In our compartmental model, the heart was constructed of three separate compartments: the left heart, right heart, and heart muscle. Note that because of the negligible amount of perfusion occurring in left and right heart, they were assumed to be vessel compartments. The table only includes the organs’ names (except aorta), and the vessels are named with their compartment numbers (except aorta).
Incorporation of the PBPK Model into the XCAT Phantoms
In this study, we used XCAT models of 58 adult patients from our library (Fig E1 [online]), with a mean age of 52 years (range, 18–78 years), mean weight of 80.2 kg (range, 52–117 kg); including 35 men (age range, 18–78 years; weight range, 60–117 kg) and 23 women (age range, 27–75 years; weight range, 52–106 kg). W.P.S. is the developer of the XCAT phantoms and software licensed through the Office of Licensing and Ventures at Duke University. To create a population of five-dimensional XCAT phantoms, including contrast material dynamics, patient-specific PBPK contrast material models were implemented into previously developed XCAT models (14). The following two steps summarize this process.
First, the PBPK contrast material model was personalized for an individual XCAT model on the basis of the given patient-specific information including organ volume and patient height, weight, sex, and age. First, the total blood volume was estimated for each XCAT model by using one of the two following equations chosen on the basis of patient sex:
and
where BV, H, and W are blood volume, height, and weight of male and female patients (32,36). Second, the total organ volume data were extracted from each specific XCAT patient model. Third, for an individual XCAT model, the ratio of the estimated blood volume to the total blood volume of the standard model (BV ratio) was computed. The BV ratio was then applied to adjust the vessel volumes and the organ subspace volumes, including intravascular, extracellular, and intracellular spaces (ie, vessels and subspace volumes of the standard model were multiplied by the BV ratio). Finally, the cardiac output of each model was further adjusted on the basis of the height and weight of the patient by using the following equations:
and
where CO≤30 and CO>30 are cardiac outputs of patients aged 30 years or younger and those older 30 than years (27,37,38). Second, the personalized PBPK contrast material model was incorporated into our models to create contrast-enhanced XCAT models. Each XCAT patient model was defined according to a pair of voxelized three-dimensional matrices, one of which represents a map of the organs (ie, an xcat.org file), and the other one represents a map of corresponding organ materials (ie, an xcat.mat file). First, the .mat files of the unenhanced XCAT models were modified to include and reflect the time-varying iodine concentration profile in different organs. Then, for each xcat*.org file representing an individual XCAT model, a time series of xcat_*.mat files (eg, xcat_5.mat, xcat_20.mat files2) corresponding to different time points after the injection was generated.
Comparison of Simulated Results to Clinical Data
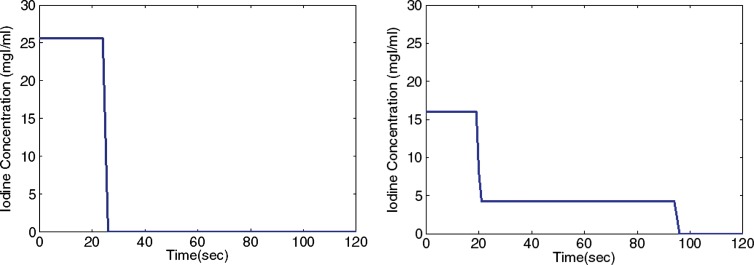
Aortic and hepatic CT contrast-enhancement time results were modeled for a library of 58 adult XCAT models, subjected to two commonly used intravenous injection protocols: a uniphasic injection of 125 mL of contrast material (320 mg of iodine per milliliter) at 5 mL/sec and a biphasic injection of 50 mL of the same contrast agent at 2.5 mL/sec followed by 75 mL at 1 mL/sec (Fig 3) (39). The simulated results were then compared with clinical data. The clinical data were obtained from a prior study by Heiken et al (39). The data reflected the hepatic and aortic mean contrast-enhancement values acquired from a group of 27 and 28 patients receiving the same uniphasic and biphasic injection protocols.
Figure 3:
Graphs show uniphasic (left) and biphasic (right) intravenous contrast agent injection protocols. Uniphasic injection was of 125 mL of contrast material (320 mg of iodine per milliliter [mgI/ml]) at 5 mL/sec and biphasic injection was of 50 mL of the same contrast agent at 2.5 mL/sec followed by 75 mL at 1 mL/sec.
The results were compared by using four simple semiquantitative comparison metrics that have been used frequently in diagnostic practice, particularly in breast cancer studies (40–42): (a) the mean percentage of discrepancy (MP), defined as:
where n is the number of time points, CE(i)sim is the simulated contrast enhancement at the ith time point, and CE(i)clin is the clinical simulated contrast enhancement at the ith time point. The other metrics were percentage of discrepancy of (b) the time to 90% peak enhancement, (c) the peak values, and (d) the slope (also called gradient) of enhancement with the following general equation:
where Xdis, Xsim, and Xclin are the percentage of difference (discrepancy) in X and the simulated or clinical value of the X metric, respectively. These metrics were calculated for the mean value of simulated and clinical aortic and hepatic contrast enhancement. Furthermore, a statistical comparison of the simulated and clinical mean data was performed with a paired t test at the 95% significance level, with the null hypothesis that there was no difference in simulated and clinical data. Such a statistical test is justified because the compared quantities were averaged throughout a different population of patients and were assumed to follow normal distribution.
The output of the mass balance differential equations described in Equations (2) and (3) are in the form of contrast material concentration value. Therefore, to calculate the contrast enhancement, we applied the previously derived proportionality between the iodine concentration and contrast enhancement (37). For a scanner operating at 120 kVp, the most commonly used tube voltage in adult patients, there was a linear correlation between concentration and contrast enhancement at a constant slope of 25–30 HU/mg of iodine. The proportionality constant used in this work was 26.18 HU/mg of iodine.
Results
Advent of Contrast-enhanced XCAT Models
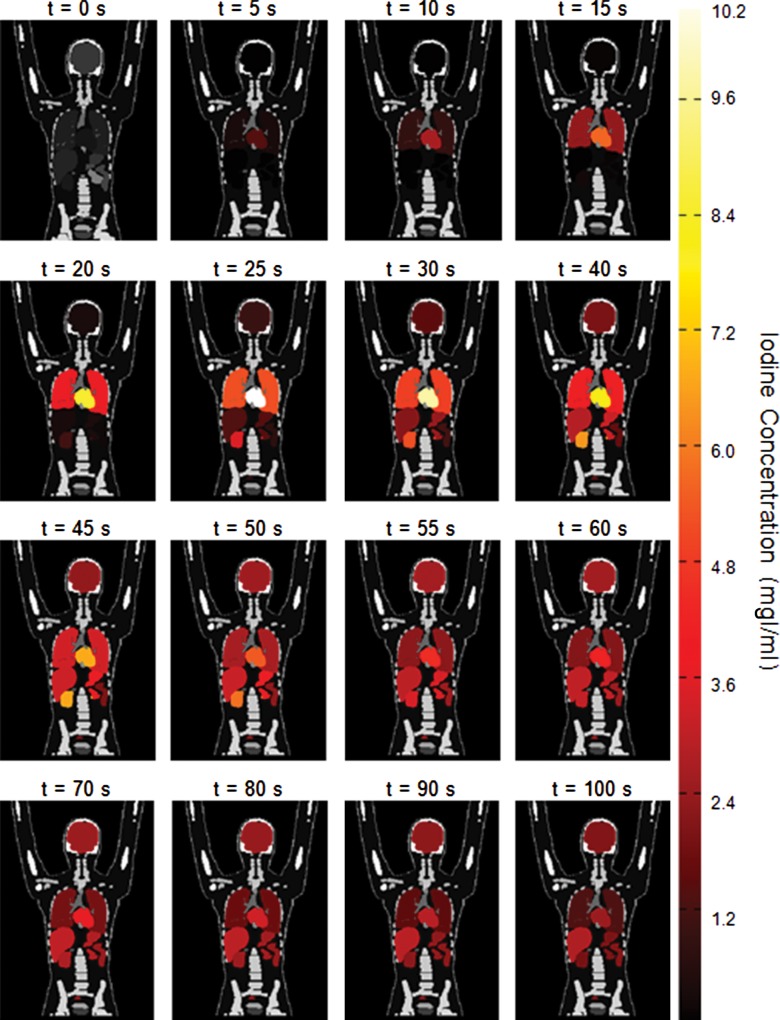
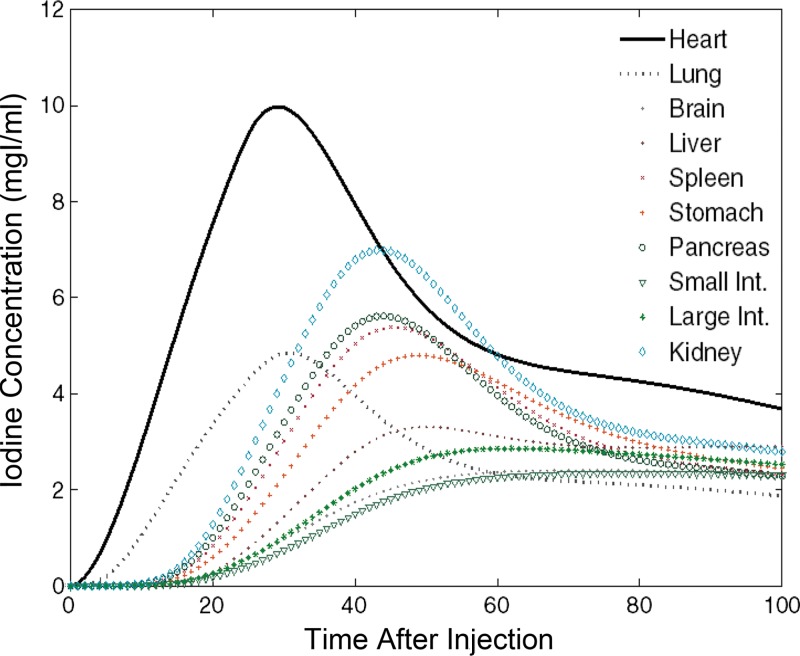
The XCAT series of phantoms were successfully modified to enable simulation of contrast-enhanced CT scans. Figure 4 is an illustration of a five-dimensional XCAT model at discrete times after administration of contrast material. The organ voxel values (color bar) in the figure reflect the iodine concentration at different time points from our PBPK model personalized to a selective male XCAT model (weight, 70.5 kg; height, 168 cm). The iodine concentration time results obtained from the brain, heart, lung, liver, stomach, spleen, pancreas, small intestine, large intestine, and kidney are illustrated in Figure 5. The contrast-enhancement time curves for different organs throughout our library of XCAT phantoms subjected to uniphasic and biphasic injections are shown in Figures E2 and E3 (online).
Figure 4:
Coronal images show distribution of contrast material throughout five-dimensional XCAT model subjected to uniphasic injection protocol of 125 mL of contrast agent (320 mg of iodine per milliliter [mgI/ml]) at 5 mL/sec in the first 100 seconds after injection.
Figure 5:
Graph shows iodine concentration curves for different organs used to update the particular organ’s material as a function of time in male XCAT model. mgI/ml = milligrams of iodine per milliliter.
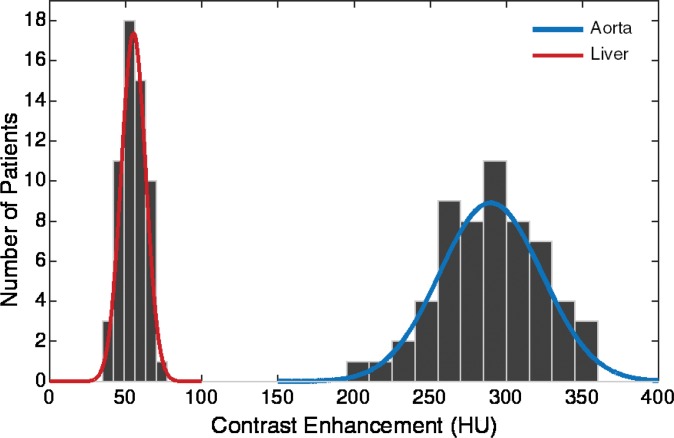
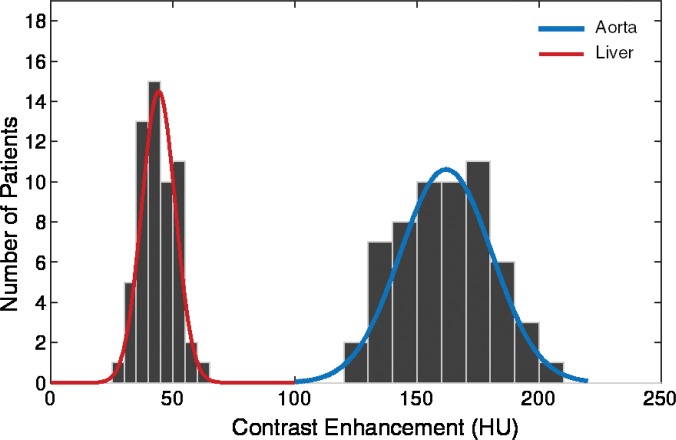
The simulated results showed a wide range of peak value dispersion (up to 37%; Table 2) around the mean enhancement values that followed a normal distribution pattern, which reflects the inherent anatomic and physiologic variability throughout a population of patients (Fig 6). Table 3 is a summary of estimated dispersion of the peak values of simulated aortic and hepatic contrast-enhancement curves for the population of XCAT models subjected to the uniphasic and biphasic injections.
Table 2.
Dispersion of Peak Values of Simulated Contrast-enhancement Curves
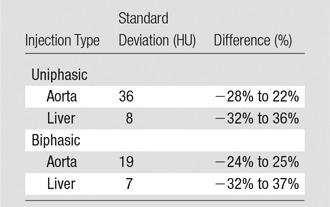
Note.—Simulated contrast-enhancement curves were derived from 58 XCAT models.
Figure 6a:
Graphs show distribution of peak value of simulated arterial and hepatic contrast-enhancement curves from 58 XCAT models for (a) uniphasic and (b) biphasic injection protocols.
Table 3.
Simulated Contrast-enhancement Measures

Figure 6b:
Graphs show distribution of peak value of simulated arterial and hepatic contrast-enhancement curves from 58 XCAT models for (a) uniphasic and (b) biphasic injection protocols.
Comparison of Simulated Results to Clinical Data
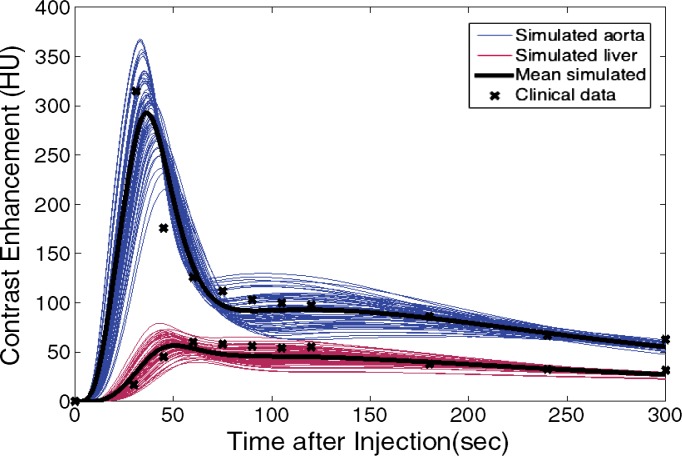
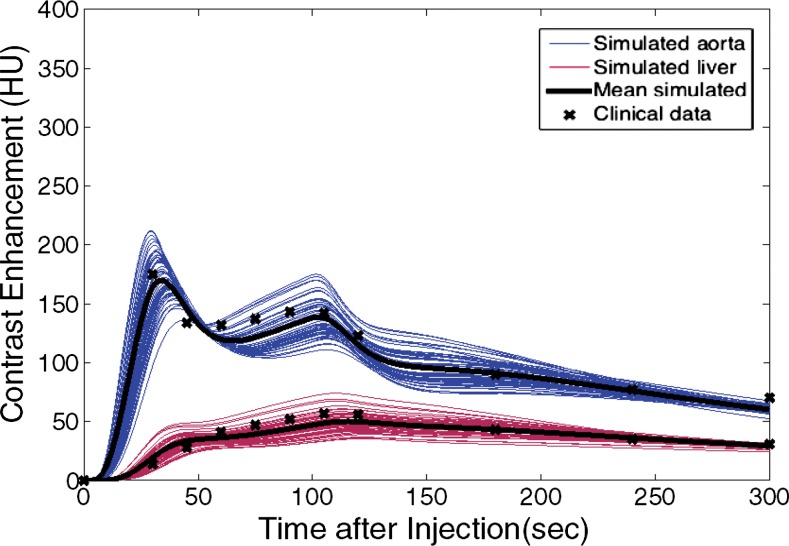
The simulated contrast-enhancement time results from our five-dimensional XCAT models demonstrated encouraging concordance with the clinical data. Figure 7 shows the simulated aortic and hepatic contrast-enhancement time results from individual XCAT models and also the mean value throughout all the models compared with the mean clinical contrast-enhancement data. Since the patients were randomly selected and had a wide range of body weights, the experimental data (indicated with × symbols in Fig 7) represent the average of a wide range of enhancement values at each time point. For the uniphasic injection protocol, the maximum simulated aortic and hepatic contrast-enhancement results averaged throughout XCAT models (shown with solid black curve in Fig 7) were 293 HU and 57 HU, versus 315 HU and 60 HU from clinical data. For the biphasic protocol, the simulated maximum aortic and hepatic results were 163 HU and 50 HU versus 175 HU and 57 HU from clinical data.
Figure 7a:
Graphs show simulated and clinical aortic and hepatic contrast-enhancement time curves with (a) uniphasic and (b) biphasic injections. Simulated results are shown with thin solid curves for the aorta (blue) and liver (red). Thicker black curves represent mean value of simulation data for each data set.
Figure 7b:
Graphs show simulated and clinical aortic and hepatic contrast-enhancement time curves with (a) uniphasic and (b) biphasic injections. Simulated results are shown with thin solid curves for the aorta (blue) and liver (red). Thicker black curves represent mean value of simulation data for each data set.
The simulated aortic and hepatic contrast-enhancement results were in good agreement with clinical data. The results of the comparison metrics (mean percentage, time to 90% peak, peak value, and slope) calculated by comparing the mean values of simulated and clinical contrast-enhancement data of the patients who underwent the uniphasic injection protocol were less than 10%, 4%, 7%, and 14%, and for patients who underwent the biphasic injection protocol, the comparison results were less than 12%, 4%, 12%, and 12%, respectively. The exception was hepatic enhancement results calculated for the uniphasic injection protocol, which showed that the discrepancy was as much as 16% and 25% for mean enhancement and time to peak. The discrepancy results calculated from the aorta and liver throughout two injection protocols are shown in Table 3.
Discussion
Human models are gaining widespread utility in imaging research and imaging technique optimization and sometimes are characterized in virtual clinical trials. Given the widespread use of contrast-enhanced imaging, these phantoms also must allow the modeling of contrast material dynamics. With the goal of developing patient-specific computational phantoms with a sufficient level of realism to enable virtual clinical trials, we created a new generation of computational patient phantoms, five-dimensional XCAT phantoms, by incorporating a previously validated PBPK model into our patient models. These new models provide the ability to simulate personalized contrast-enhanced CT procedures with potential applications beyond CT.
The simulated aortic and hepatic contrast-enhancement time values from the enhanced five-dimensional XCAT models were in close agreement with clinical data for time-to-peak and peak values. The higher discrepancy values (time to peak value of 25% and slope of 18%) calculated for the hepatic enhancement after a uniphasic injection may be due to the lack of clinical imaging data at 45–60 seconds (ie, the missed data points at exact enhancement peak may result in large discrepancy between the simulation and clinical data). The difference between the simulation results and clinical data should not be considered as an error, in that the data compared are from a different group of patients.
Despite the fact that the simulated contrast-enhancement curves from different organs were different, they all shared a generic pattern, in which the contrast enhancement started from zero, followed by a relatively rapid peak, with subsequent slow decline. In some organs, the enhancement peak time was affected also by recirculation of the contrast material, which, depending on the injection duration, organ diffusion rate, and location of the organ in the circulatory system with respect to the heart, can increase the enhancement. This was partially evident for the liver. These generic behaviors can serve as a basis for personalizing contrast material injection protocols for individual patients based on their unique attributes.
This wide range of variability in cardiac output can have a profound effect, ranging up to 30%, on the contrast-enhancement results (37). In this work, we assumed that the cardiac output (range, 3975–7972 mL/min) of the models was related to the height, weight, and age by using a regression model. A single XCAT model cannot be expected to represent generically individual patients with similar characteristics: patients with similar height, weight, and age do have varying cardiac outputs. However, the model can be parameterized to represent the mean and range of variability of the propagation of contrast material throughout a subset of patients. To do so, a particular XCAT model can be developed to represent contrast material propagation that matches a mean throughout the represented patient group or in individual patients in that group.
Because of the lack of specific data regarding the volumes of the extracellular and intracellular body fluids, we assumed that the ratio of the extracellular and intracellular fluid volumes was fixed throughout all the organs and was equal to the total ratio (0.83) calculated for the whole body. In reality, this ratio varies from patient to patient. We made this assumption because there was insufficient information for specific patients. However, as described in the Materials and Methods, although the ratio between the extracellular and intracellular fluid is constant throughout different patients, the extracellular and intracellular fluid values vary on the basis of the total blood volume of the patients (range, 3.54–6.27 L). The extracellular and intracellular fluid levels in this study were 12.3–21.2 L and 14.8–25.4 L, respectively, throughout our XCAT population. In the future, a series of sensitivity analyses will be required to evaluate the effect of change in the individual (or multiple) parameter values. Also, it might be possible to revise this assumption on the basis of the inherent vascular structure by considering further the organ tissue heterogeneity (43).
Another limitation was that the model developed in this study did not take into account the cardiac pathologic states. The cardiac output was strongly affected by age (44). Authors of some studies (25,37,45) have reported a negative correlation between age and cardiac output for healthy patients, as implemented in this study. Itoh et al (46) reported a stronger correlation in patients more than 60 years old than in younger patients. In this study, we aimed to develop healthy adult patient models that included contrast material distribution and also to validate the contrast model against data from a group of patients with no cardiac disease, and hence, normal cardiac outputs (39). However, the effect of cardiac disease should be evaluated in future studies.
Another limitation of this work is that the saline flush application was not incorporated in our PBPK model. However, it has been shown that a given amount of contrast media followed by the injection of a saline flush results in a slight increase (5%–10%) in peak arterial enhancement, and the time to peak of enhancement (47,48).
Another limitation of the implemented PBPK model was its validation against clinical mean liver and aorta data from two small groups of adult patients. Moreover, since the standard deviation of the clinical measurements was not reported by Heiken et al (39), we were not able to compare the variabilities between the two studies, and hence, no statistical hypothesis test for the discrepancy metrics was defined in this study except the mean percentage value of simulation and clinical data. Also, with a small sample size of patients, the assumed independence of the errors and reliability of the independent paired t test used in this study was controversial. However, the conducted validation and statistical test gave us confidence in the first-order approximation of our models. A more comprehensive future study with a larger group of patients and organs is warranted.
In summary, most medical imaging systems take advantage of contrast medium administration for better image quality, the effect of which has not been investigated in previous optimization studies. We developed a method to incorporate the dynamics of contrast material into computational anthropomorphic phantoms to create five-dimensional XCAT models. The method incorporated a PBPK model and the anatomic parameters of the XCAT phantoms including height, weight, and organ volumes. Modeling contrast material propagation through multicompartmental flow analysis offered validated contrast material dynamics in a population of patients, enabling systematic optimization of CT for image quality, radiation dose, and contrast material load.
Advances in Knowledge
■ The physiologically based pharmacokinetics model developed in this study allowed prediction of the time-varying concentration behavior of contrast material in organs throughout different patient models.
■ Contrast enhancement as a function of time in patients shows a wide range of variability (up to 37% for peak value), which reflects the inherent anatomic and physiologic variability throughout a population of healthy patients.
■ Incorporation of the dynamics of blood circulation and contrast medium perfusion into various computational patient phantoms helps to pave the way toward virtual imaging studies and comprehensive optimization of administration of contrast material.
Implications for Patient Care
■ The resources developed in this study may be adopted as virtual tools for optimization of timing and magnitude of administration to achieve targeted contrast-enhanced CT.
■ The contrast-enhanced computational models developed in this study enable development of clinical trials for new contrast agents and of optimized clinical imaging protocols for patient care.
APPENDIX
SUPPLEMENTAL FIGURES
Received January 8, 2016; revision requested February 26; revision received September 6; accepted October 10; final version accepted October 25.
Study supported by the Foundation for the National Institutes of Health (2R01EB001838-09A1).
From the 2014 RSNA Annual Meeting.
See also the article by Sahbaee et al and the editorial by Boone and Hernandez in this issue.
Disclosures of Conflicts of Interest: P.S. disclosed no relevant relationships. W.P.S. Activities related to the present article: disclosed no relevant relationships. Activities not related to the present article: Consultancy for CFD Research and royalties from Duke University Licensing for software. Other relationships: disclosed no relevant relationships. D.M. disclosed no relevant relationships. R.C.N. disclosed no relevant relationships. E.S. Activities related to the present article: disclosed no relevant relationships. Activities not related to the present article: grants from Siemens Medical solutions and GE Healthcare. Other relationships: disclosed no relevant relationships.
Abbreviations:
- PBPK
- physiologically based pharmacokinetic
- XCAT
- extended cardiac torso
References
- 1.Ho LM, Nelson RC, Delong DM. Determining contrast medium dose and rate on basis of lean body weight: does this strategy improve patient-to-patient uniformity of hepatic enhancement during multi-detector row CT? Radiology 2007;243(2):431–437. [DOI] [PubMed] [Google Scholar]
- 2.Small WC, Nelson RC, Bernardino ME, Brummer LT. Contrast-enhanced spiral CT of the liver: effect of different amounts and injection rates of contrast material on early contrast enhancement. AJR Am J Roentgenol 1994;163(1):87–92. [DOI] [PubMed] [Google Scholar]
- 3.Kondo H, Kanematsu M, Goshima S, et al. Body size indexes for optimizing iodine dose for aortic and hepatic enhancement at multidetector CT: comparison of total body weight, lean body weight, and blood volume. Radiology 2010;254(1):163–169. [DOI] [PubMed] [Google Scholar]
- 4.Young S, Bakic PR, Myers KJ, Jennings RJ, Park S. A virtual trial framework for quantifying the detectability of masses in breast tomosynthesis projection data. Med Phys 2013;40(5):051914. [DOI] [PMC free article] [PubMed] [Google Scholar]
- 5.Sechopoulos I, Ghetti C. Optimization of the acquisition geometry in digital tomosynthesis of the breast. Med Phys 2009;36(4):1199–1207. [DOI] [PubMed] [Google Scholar]
- 6.Reiser I, Nishikawa RM. Task-based assessment of breast tomosynthesis: effect of acquisition parameters and quantum noise. Med Phys 2010;37(4):1591–1600. [DOI] [PMC free article] [PubMed] [Google Scholar]
- 7.Gong X, Glick SJ, Liu B, Vedula AA, Thacker S. A computer simulation study comparing lesion detection accuracy with digital mammography, breast tomosynthesis, and cone-beam CT breast imaging. Med Phys 2006;33(4):1041–1052. [DOI] [PubMed] [Google Scholar]
- 8.Christ A, Kainz W, Hahn EG, et al. The Virtual Family--development of surface-based anatomical models of two adults and two children for dosimetric simulations. Phys Med Biol 2010;55(2):N23–N38. [DOI] [PubMed] [Google Scholar]
- 9.Cassola VF, Lima VJ, Kramer R, Khoury HJ. FASH and MASH: female and male adult human phantoms based on polygon mesh surfaces: I. Development of the anatomy. Phys Med Biol 2010;55(1):133–162. [DOI] [PubMed] [Google Scholar]
- 10.Lee C, Lee C, Williams JL, Bolch WE. Whole-body voxel phantoms of paediatric patients–UF Series B. Phys Med Biol 2006;51(18):4649–4661. [DOI] [PubMed] [Google Scholar]
- 11.Petoussi-Henss N, Zanki M, Fill U, Regulla D. The GSF family of voxel phantoms. Phys Med Biol 2002;47(1):89–106. [DOI] [PubMed] [Google Scholar]
- 12.Turner AC, Zhang D, Khatonabadi M, et al. The feasibility of patient size-corrected, scanner-independent organ dose estimates for abdominal CT exams. Med Phys 2011;38(2):820–829. [DOI] [PMC free article] [PubMed] [Google Scholar]
- 13.Ding A, Mille MM, Liu T, Caracappa PF, Xu XG. Extension of RPI-adult male and female computational phantoms to obese patients and a Monte Carlo study of the effect on CT imaging dose. Phys Med Biol 2012;57(9):2441–2459. [DOI] [PMC free article] [PubMed] [Google Scholar]
- 14.Segars WP, Bond J, Frush J, et al. Population of anatomically variable 4D XCAT adult phantoms for imaging research and optimization. Med Phys 2013;40(4):043701. [DOI] [PMC free article] [PubMed] [Google Scholar]
- 15.Tian X, Li X, Segars WP, Frush DP, Paulson EK, Samei E. Dose coefficients in pediatric and adult abdominopelvic CT based on 100 patient models. Phys Med Biol 2013;58(24):8755–8768. [DOI] [PubMed] [Google Scholar]
- 16.Li X, Samei E, Segars WP, et al. Patient-specific radiation dose and cancer risk estimation in CT: part II. Application to patients. Med Phys 2011;38(1):408–419. [DOI] [PMC free article] [PubMed] [Google Scholar]
- 17.Sahbaee P, Segars WP, Samei E. Patient-based estimation of organ dose for a population of 58 adult patients across 13 protocol categories. Med Phys 2014;41(7):072104. [DOI] [PMC free article] [PubMed] [Google Scholar]
- 18.Li X, Samei E, Segars WP, Sturgeon GM, Colsher JG, Frush DP. Patient-specific radiation dose and cancer risk for pediatric chest CT. Radiology 2011;259(3):862–874. [DOI] [PMC free article] [PubMed] [Google Scholar]
- 19.Amato E, Salamone I, Naso S, Bottari A, Gaeta M, Blandino A. Can contrast media increase organ doses in CT examinations? A clinical study. AJR Am J Roentgenol 2013;200(6):1288–1293. [DOI] [PubMed] [Google Scholar]
- 20.Piechowiak EI, Peter JF, Kleb B, Klose KJ, Heverhagen JT. Intravenous iodinated contrast agents amplify DNA radiation damage at CT. Radiology 2015;275(3):692–697. [DOI] [PubMed] [Google Scholar]
- 21.Grudzenski S, Kuefner MA, Heckmann MB, Uder M, Löbrich M. Contrast medium-enhanced radiation damage caused by CT examinations. Radiology 2009;253(3):706–714. [DOI] [PubMed] [Google Scholar]
- 22.Pathe C, Eble K, Schmitz-Beuting D, et al. The presence of iodinated contrast agents amplifies DNA radiation damage in computed tomography. Contrast Media Mol Imaging 2011;6(6):507–513. [DOI] [PubMed] [Google Scholar]
- 23.Walkey MM. Dynamic hepatic CT: how many years will it take ‘til we learn? Radiology 1991;181(1):17–18. [DOI] [PubMed] [Google Scholar]
- 24.Gerlowski LE, Jain RK. Physiologically based pharmacokinetic modeling: principles and applications. J Pharm Sci 1983;72(10):1103–1127. [DOI] [PubMed] [Google Scholar]
- 25.Bae KT, Heiken JP, Brink JA. Aortic and hepatic contrast medium enhancement at CT. Part II. Effect of reduced cardiac output in a porcine model. Radiology 1998;207(3):657–662. [DOI] [PubMed] [Google Scholar]
- 26.Andersen ME, Clewell HJ, 3rd, Frederick CB. Applying simulation modeling to problems in toxicology and risk assessment–a short perspective. Toxicol Appl Pharmacol 1995;133(2):181–187. [DOI] [PubMed] [Google Scholar]
- 27.Bae KT, Heiken JP, Brink JA. Aortic and hepatic contrast medium enhancement at CT. Part I. Prediction with a computer model. Radiology 1998;207(3):647–655. [DOI] [PubMed] [Google Scholar]
- 28.Schindera ST, Nelson RC, Howle L, Nichols E, DeLong DM, Merkle EM. Effect of varying injection rates of a saline chaser on aortic enhancement in CT angiography: phantom study. Eur Radiol 2008;18(8):1683–1689. [DOI] [PubMed] [Google Scholar]
- 29.Awai K, Nakayama Y, Nakaura T, et al. Prediction of aortic peak enhancement in monophasic contrast injection protocols at multidetector CT: phantom and patient studies. Radiat Med 2007;25(1):14–21 [DOI] [PubMed] [Google Scholar]
- 30.Hayes AW, ed. Principles and methods of toxicology. 5th ed. Boca Raton, Fla: CRC Press, 2007. [Google Scholar]
- 31.Jacquez JA, Bellman R, Kalaba R. Some mathematical aspects of chemotherapy—II: The distribution of a drug in the body. Bull Math Biophys 1960;22(3):309–322. [Google Scholar]
- 32.Guyton AC. Circulatory physiology: cardiac output and its regulation. Philadelphia, Pa: Saunders, 1963. [Google Scholar]
- 33.Guyton AC, Hall JE. Textbook of medical physiology. 11th ed. Philadelphia, Pa: Elsevier Saunders, 2006. [Google Scholar]
- 34.Olsson B, Aulie A, Sveen K, Andrew E. Human pharmacokinetics of iohexol. A new nonionic contrast medium. Invest Radiol 1983;18(2):177–182. [DOI] [PubMed] [Google Scholar]
- 35.Iatridis PG. Best and Taylor’s physiological basis of medical practice. JAMA 1991;266(1):130. [Google Scholar]
- 36.Milnor WR. Cardiovascular physiology. Oxford, England: Oxford University Press, 1990. [Google Scholar]
- 37.Bae KT. Intravenous contrast medium administration and scan timing at CT: considerations and approaches. Radiology 2010;256(1):32–61. [DOI] [PubMed] [Google Scholar]
- 38.Bae KT. Method of and apparatus for predicting computed tomography contrast enhancement. Google Patents. https://www.google.com/patents/US5687208; Published November 11, 1997; accessed December 6, 2016. [Google Scholar]
- 39.Heiken JP, Brink JA, McClennan BL, Sagel SS, Crowe TM, Gaines MV. Dynamic incremental CT: effect of volume and concentration of contrast material and patient weight on hepatic enhancement. Radiology 1995;195(2):353–357. [DOI] [PubMed] [Google Scholar]
- 40.O’Connor JP, Tofts PS, Miles KA, Parkes LM, Thompson G, Jackson A. Dynamic contrast-enhanced imaging techniques: CT and MRI. Br J Radiol 2011;84(Spec No 2):S112–S120. [DOI] [PMC free article] [PubMed] [Google Scholar]
- 41.Marin D, Nelson RC, Guerrisi A, et al. 64-section multidetector CT of the upper abdomen: optimization of a saline chaser injection protocol for improved vascular and parenchymal contrast enhancement. Eur Radiol 2011;21(9):1938–1947. [DOI] [PubMed] [Google Scholar]
- 42.Leach MO, Brindle KM, Evelhoch JL, et al. The assessment of antiangiogenic and antivascular therapies in early-stage clinical trials using magnetic resonance imaging: issues and recommendations. Br J Cancer 2005;92(9):1599–1610. [DOI] [PMC free article] [PubMed] [Google Scholar]
- 43.Lin YP, Yu WC, Hsu TL, Ding PY, Yang WC, Chen CH. The extracellular fluid-to-intracellular fluid volume ratio is associated with large-artery structure and function in hemodialysis patients. Am J Kidney Dis 2003;42(5):990–999. [DOI] [PubMed] [Google Scholar]
- 44.Nakajima Y, Yoshimine T, Yoshida H, et al. Computerized tomography angiography of ruptured cerebral aneurysms: factors affecting time to maximum contrast concentration. J Neurosurg 1998;88(4):663–669. [DOI] [PubMed] [Google Scholar]
- 45.Katori R. Normal cardiac output in relation to age and body size. Tohoku J Exp Med 1979;128(4):377–387. [DOI] [PubMed] [Google Scholar]
- 46.Itoh S, Ikeda M, Satake H, Ota T, Ishigaki T. The effect of patient age on contrast enhancement during CT of the pancreatobiliary region. AJR Am J Roentgenol 2006;187(2):505–510. [DOI] [PubMed] [Google Scholar]
- 47.Yamaguchi I, Kidoya E, Suzuki M, Kimura H. Evaluation of required saline volume in dynamic contrast-enhanced computed tomography using saline flush technique. Comput Med Imaging Graph 2009;33(1):23–28. [DOI] [PubMed] [Google Scholar]
- 48.Irie T, Kajitani M, Yamaguchi M, Itai Y. Contrast-enhanced CT with saline flush technique using two automated injectors: how much contrast medium does it save? J Comput Assist Tomogr 2002;26(2):287–291. [DOI] [PubMed] [Google Scholar]
Associated Data
This section collects any data citations, data availability statements, or supplementary materials included in this article.


