Shear wave elastography is a rapidly evolving US imaging technique that allows quantification of mechanical and elastic tissue properties and serves as an adjunct to conventional US techniques, aiding in initial characterization and treatment follow-up of various traumatic and pathologic conditions of the musculoskeletal system.
Abstract
In the past 2 decades, sonoelastography has been progressively used as a tool to help evaluate soft-tissue elasticity and add to information obtained with conventional gray-scale and Doppler ultrasonographic techniques. Recently introduced on clinical scanners, shear-wave elastography (SWE) is considered to be more objective, quantitative, and reproducible than compression sonoelastography with increasing applications to the musculoskeletal system. SWE uses an acoustic radiation force pulse sequence to generate shear waves, which propagate perpendicular to the ultrasound beam, causing transient displacements. The distribution of shear-wave velocities at each pixel is directly related to the shear modulus, an absolute measure of the tissue’s elastic properties. Shear-wave images are automatically coregistered with standard B-mode images to provide quantitative color elastograms with anatomic specificity. Shear waves propagate faster through stiffer contracted tissue, as well as along the long axis of tendon and muscle. SWE has a promising role in determining the severity of disease and treatment follow-up of various musculoskeletal tissues including tendons, muscles, nerves, and ligaments. This article describes the basic ultrasound physics of SWE and its applications in the evaluation of various traumatic and pathologic conditions of the musculoskeletal system.
©RSNA, 2017
SA-CME LEARNING OBJECTIVES
After completing this journal-based SA-CME activity, participants will be able to:
■ Describe the basic physics of SWE.
■ Recognize the SWE findings (tissue elasticity) of the normal musculoskeletal soft tissues and of various musculoskeletal soft-tissue injuries and diseases.
■ Discuss the added value and limitations of SWE in diagnosis of musculoskeletal conditions.
Introduction
For the past few decades, conventional gray-scale and Doppler ultrasonographic (US) techniques have been routinely used in daily radiology practices in the evaluation of various traumatic and pathologic conditions of several musculoskeletal tissues, with results comparable to those of magnetic resonance (MR) imaging (1). However, sometimes pathologic and healthy tissues may display similar echogenicities at conventional US, particularly in early-stage and preclinical disease. Recently developed and rapidly evolving sonoelastographic techniques provide additional information related to tissue properties by evaluating tissue elasticity, which may contribute to diagnosis (2,3). There are four main types of sonoelastography techniques: compression sonoelastography (2), transient elastography (2), tension elastography (4), and shear-wave elastography (SWE) (2), each with advantages and disadvantages.
Promising results have been published in the recent literature on the utility of SWE in the evaluation of several traumatic and pathologic conditions of various musculoskeletal soft tissues, including tendons (5–17), muscles (18–29), nerves (30–32), and ligaments (33–35).
In addition to several ongoing research projects, SWE elastography is frequently used in the authors’ institutions as an adjunct to conventional US techniques in the routine clinical evaluation of tissue elasticity of various traumatic and pathologic conditions of the musculoskeletal system. Quantitative measurements of tissue elasticity allow valuable assessment of intrinsic tissue properties, which may be of particular value in diagnosing early disease when no abnormality can be depicted at conventional US, and with tissue healing. Furthermore, we believe that SWE may help in predicting impending tendon failure, and in that way may help the clinician in making decisions in early initiation of treatment. Currently, SWE was of the greatest help in the evaluation of tendons, followed by muscles and peripheral nerves. We are expanding use of SWE in the evaluation of ligaments and joints, with encouraging results. We also use SWE in the evaluation of musculoskeletal tumors, but at this time it is too early to draw conclusions as to whether this imaging method can help distinguish malignant from benign musculoskeletal soft-tissue masses.
We explore the basic physics and musculoskeletal applications of sonoelastography, transient elastography, and tension elastography, and then focus on expanding on SWE (Fig 1) for the remainder of the article, including a summary of the relevant literature and advantages and limitations of this quantitative imaging technology. We show several SWE imaging findings of the normal and various traumatic and pathologic conditions of the tendons (Figs 2–7), muscles (Figs 6, 8, 9), peripheral nerves (Figs 10, 11), ligaments and joints (Figs 12, 13), as well as a few soft-tissue and bone masses or masslike conditions (Figs 14–20) from our routine clinical practice. The Table summarizes some of the current potential clinical applications of SWE in the evaluation of the musculoskeletal tissues and expected shear-wave velocity and G values.
Figure 1a.
(a) Basic physics of SWE. In step 1, shear waves are generated using acoustic radiation force; they propagate perpendicularly to the primary US wave at a lower velocity. In step 2, fast plane wave excitation is used to track displacement and velocity as shear waves propagate, and tissue displacement is calculated using a speckle tracking algorithm. In step 3, tissue displacements are used to calculate shear-wave velocity (cs) and shear modulus (G). (b) Relationship between shear velocity and shear modulus expressed as a color bar, which assumes, in this case, a density equal to that of water (1 g/cm3). Actual density estimates will vary for different types of soft tissue and can also be found using values published in the literature.
Figure 2a.
Normal fourth extensor compartment tendon of the wrist in a 21-year-old asymptomatic man. (a) Long-axis gray-scale US image of the dorsal aspect of the wrist shows a normal echogenic fibrillar appearance of the fourth extensor compartment tendon (arrow). L = lunate, R = radius. (b) SWE image (color elastogram) of the same region shows predominantly intermediate shear-wave velocity (6.66 m/sec) in the same tendon (arrow). Red = hard consistency (≤15 m/sec), blue = soft consistency (≥0.5 m/sec), and green and yellow = intermediate consistency. SWE data were collected using an Acuson S3000 US scanner (Siemens Healthineers, Erlangen, Germany) with a L9–4-MHz linear transducer.
Figure 7a.
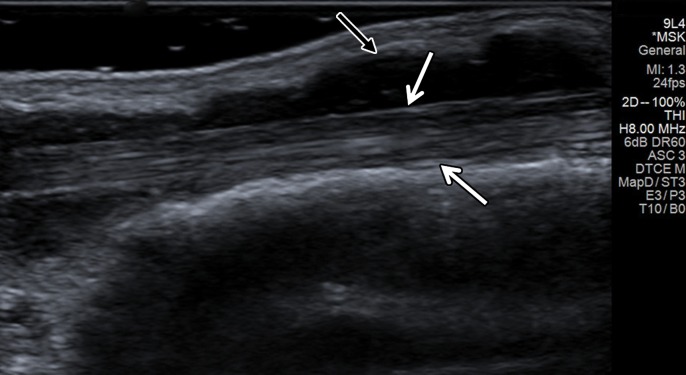
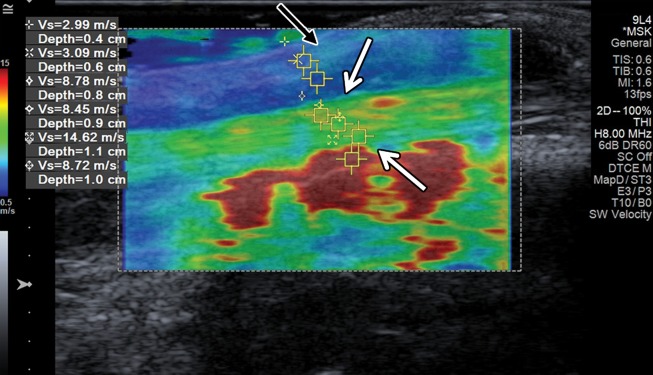
Tenosynovitis of the first extensor compartment tendons of the wrist in a 59-year-old woman with a history of rheumatoid arthritis. (a) Long-axis gray-scale US image shows mild hypoechogenicity of the extensor pollicis brevis (EPB) tendon fibers (white arrows) and a mildly heterogeneous synovial-fluid complex in the massively distended tendon sheath (black arrow). (b) Color elastogram of the same region shows predominantly intermediate shear-wave velocities (arrows) in the EPB tendon (mean, 8.65 m/sec) and low shear-wave velocities (mean, 3.04 m/sec) in the region of synovitis (black arrow) within the tendon sheath. SWE data were collected using an Acuson S3000 US scanner with an L9–4-MHz linear transducer. The right side of the images is proximal.
Figure 6a.
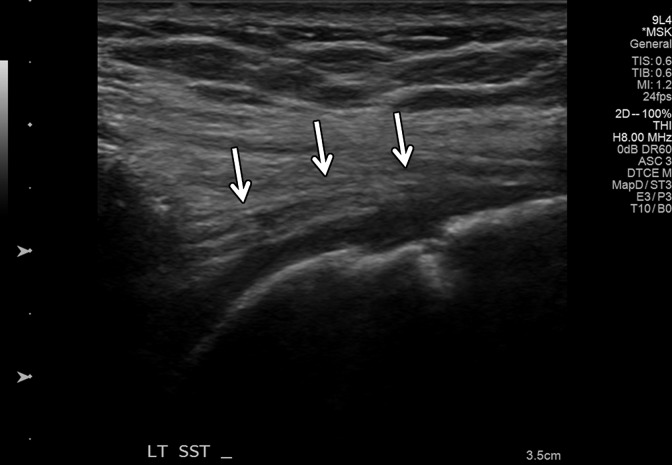
Massive supraspinatus tendon (SST) tear in a 73-year-old man. (a) Long-axis gray-scale US image of the expected SST region shows the deltoid muscle abutting the humeral head, related to a massive SST tear (arrows), with SST fibers not seen. (b) Color elastogram of the same region shows low shear-wave velocities (arrows) (mean, 3.15 m/sec) in the deltoid muscle. SWE data were collected using an Acuson S3000 US scanner with an L9–4-MHz linear transducer.
Figure 8a.
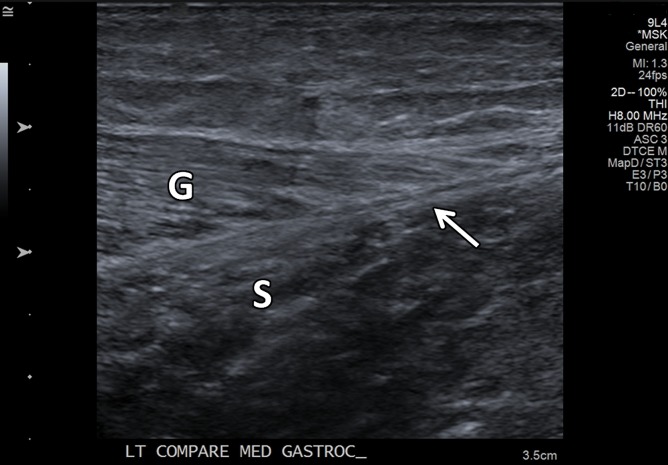
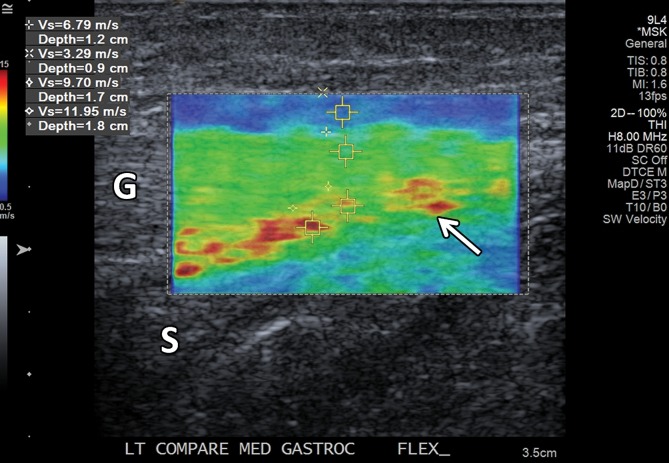
Normal medial head of gastrocnemius and soleus aponeurosis in the relaxed and contracted (maximal dorsiflexion of the ankle) states in an asymptomatic 48-year-old woman. (a) Long-axis gray-scale US image shows normal echotexture of the relaxed gastrocnemius (G) and soleus (S) muscles and of the aponeurosis (arrow). (b) Color elastogram of the same region shows low shear-wave velocities in the gastrocnemius muscle (mean, 2.89 m/sec) and intermediate velocities at the aponeurosis (arrow) (mean, 4.915 m/sec). (c) Long-axis gray-scale US image of the same region with maximal dorsiflexion of the ankle shows normal echotexture of the gastrocnemius (G) and soleus (S) muscles and of the aponeurosis (arrow). (d) Color elastogram of the same region shows increased shear-wave velocity of the contracted gastrocnemius muscle (6.79 m/sec) and at the aponeurosis (arrow) (mean, 10.83 m/sec). SWE data were collected using an Acuson S3000 US scanner with an L9–4-MHz linear transducer.
Figure 9a.
Acute tennis leg injury in a 51-year-old man. (a) Long-axis gray-scale US image shows partial avulsion of the medial head of the gastrocnemius muscle (G) from the soleus (S) aponeurosis (arrow). (b) Color elastogram of the same region shows low velocities in the injured avulsed soleus muscle (mean, 1.79 m/sec) with thickening and somewhat higher shear-wave velocities (mean, 2.32 m/sec) in the injured aponeurosis (arrow). Note that the shear-wave velocities in both the gastrocnemius muscle and at the aponeurosis are lower than in the healthy tissues in the same region in the patient in Figure 8. SWE data were collected using an Acuson S3000 US scanner with an L9–4-MHz linear transducer.
Figure 10a.
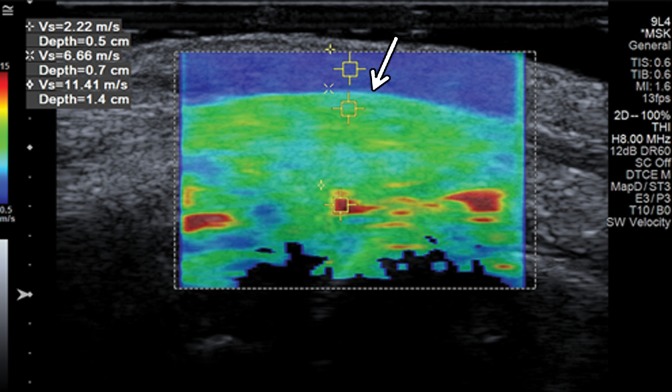
Normal ulnar nerve in the cubital tunnel in an asymptomatic 58-year-old woman. (a) Long-axis gray-scale US image shows a normal relatively hypoechoic ulnar nerve (arrows) in the cubital tunnel. (b) Color elastogram of the same region shows low shear-wave velocities (mean, 2.22 m/sec) in the ulnar nerve (arrows). SWE data were collected using an Acuson S3000 US scanner with an L9–4-MHz linear transducer. The right side of the image is distal.
Figure 11a.
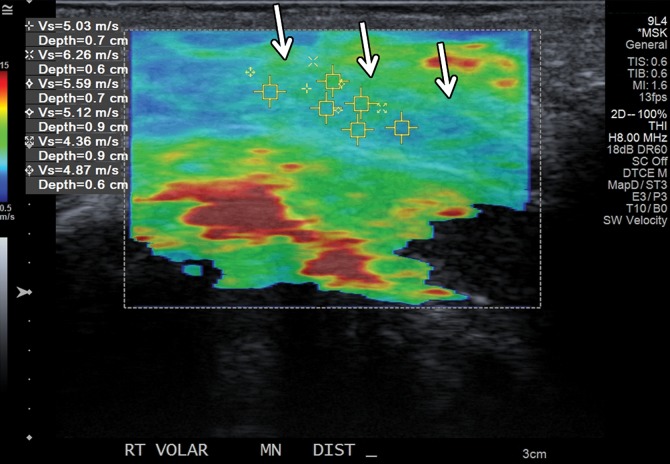
Abnormal median nerve in the carpal tunnel in a 34-year-old woman with suspected psoriatic arthritis and median neuropathy. (a) Long-axis gray-scale US image shows an enlarged relatively hypoechoic median nerve (arrows) in the carpal tunnel. (b) Color elastogram of the same region shows intermediate shear-wave velocities (mean, 5.21 m/sec) in the median nerve (arrows). SWE data were collected using an Acuson S3000 US scanner with an L9–4-MHz linear transducer. The right side of the image is distal.
Figure 12a.
Normal anterior band of the medial ulnar collateral ligament (MUCL) of the elbow in a 21-year-old man. (a) Long-axis gray-scale US image shows a normal echogenic anterior band of the MUCL at the medial aspect of the elbow (arrows). (b) Color elastogram of the same region shows intermediate to high shear-wave velocities (mean, 8.69 m/sec) in the MUCL (arrows). SWE data were collected using an L9–4-MHz linear transducer.
Figure 13a.
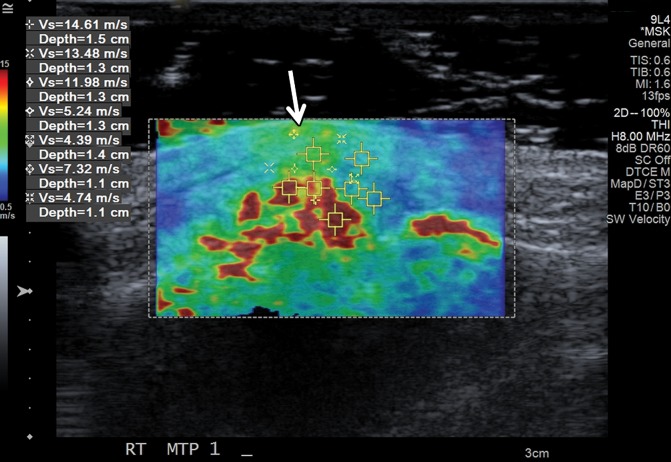
Tophaceous gout at the first metatarsophalangeal joint in a 49-year-old man. (a) Long-axis gray-scale US image along the medial aspect of the first metatarsophalangeal joint shows echogenic intra-articular gouty tophus (arrow) abutting the metatarsal head (MT). PP = proximal phalanx. (b) Color elastogram of the same region shows intermediate shear-wave velocity (arrow) (mean, 7.32 m/sec) in the gouty tophus. SWE data were collected using an Acuson S3000 US scanner with an L9–4-MHz linear transducer.
Figure 14a.

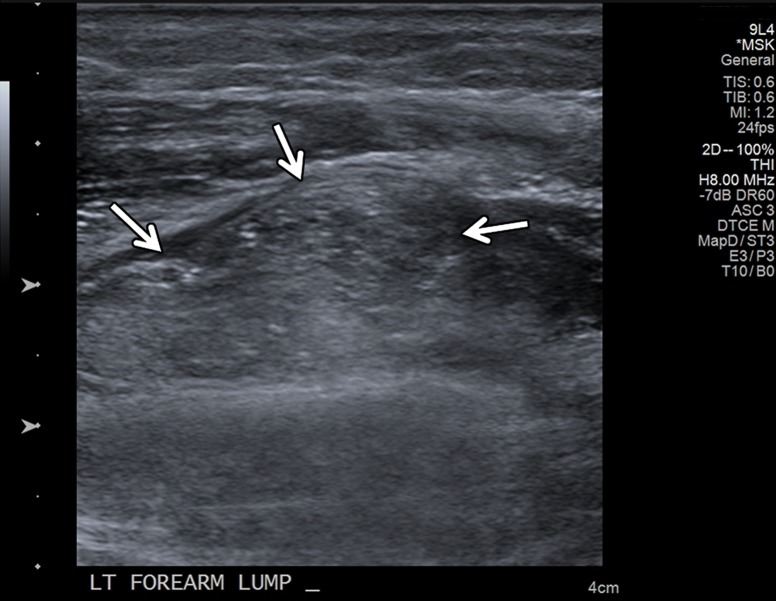
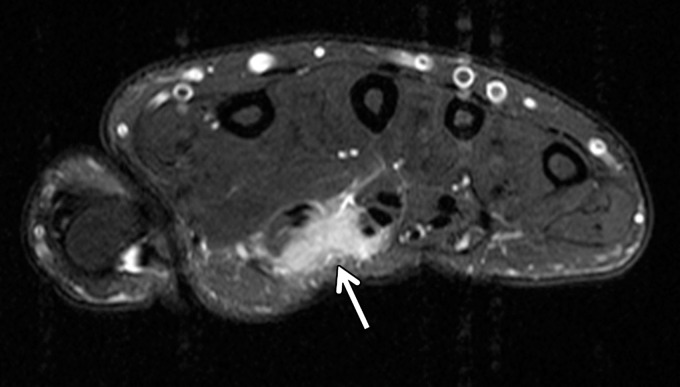
Intramuscular lipoma in a 48-year-old woman with a palpable painless lump in her forearm. (a) Sagittal T1-weighted magnetic resonance (MR) image shows a well-defined high-signal-intensity mass (arrow) in the distal aspect of the supinator muscle, consistent with an intramuscular lipoma. (b) Long-axis gray-scale US image in the region of palpable abnormality shows a nonspecific echogenic solid intramuscular mass (arrows) in the distal supinator muscle. (c) Color elastogram of the same region shows lower shear-wave velocities (mean, 1.74 m/sec) in the mass (arrows) than in the region of the pseudocapsule, which shows intermediate velocities (mean, 5.52 m/sec). SWE data were collected using an Acuson S3000 US scanner with an L9–4-MHz linear transducer.
Figure 20a.

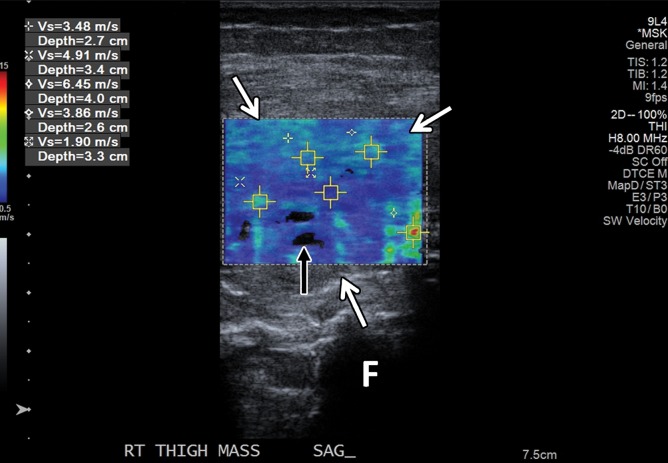
Pathologically proven telangiectatic osteosarcoma of the distal femur in a 20-year-old woman. F = femur. (a) Lateral radiograph of the knee shows a large, expansile osseous matrix lesion in the distal femur with associated aggressive periosteal reaction and a large soft-tissue mass (arrows). (b) Axial T2-weighted fat-saturated MR image of the distal femur shows an expansile heterogeneous osseous matrix tumor with associated cortical breakthrough and a large soft-tissue component (white arrows), with a secondary aneurysmal bone cyst containing multiple fluid levels (black arrows). (c) Short-axis gray-scale US image of the soft-tissue component of the lesion shows a heterogeneous relatively echogenic lesion (white arrows) with multiple fluid levels (black arrow), consistent with an aneurysmal bone cyst containing blood products. (d) Color elastogram of the same region shows low-to-intermediate shear cs (mean, 4.12 m/sec) within the soft-tissue component of the lesion (white arrows) with signal voids in the fluid components of the aneurysmal bone cyst (black arrow).
Current Potential Clinical Applications of SWE in the Evaluation of Musculoskeletal Tissues and Expected Findings for Shear-Wave Velocity and Shear Modulus
Figure 1b.

(a) Basic physics of SWE. In step 1, shear waves are generated using acoustic radiation force; they propagate perpendicularly to the primary US wave at a lower velocity. In step 2, fast plane wave excitation is used to track displacement and velocity as shear waves propagate, and tissue displacement is calculated using a speckle tracking algorithm. In step 3, tissue displacements are used to calculate shear-wave velocity (cs) and shear modulus (G). (b) Relationship between shear velocity and shear modulus expressed as a color bar, which assumes, in this case, a density equal to that of water (1 g/cm3). Actual density estimates will vary for different types of soft tissue and can also be found using values published in the literature.
Figure 2b.
Normal fourth extensor compartment tendon of the wrist in a 21-year-old asymptomatic man. (a) Long-axis gray-scale US image of the dorsal aspect of the wrist shows a normal echogenic fibrillar appearance of the fourth extensor compartment tendon (arrow). L = lunate, R = radius. (b) SWE image (color elastogram) of the same region shows predominantly intermediate shear-wave velocity (6.66 m/sec) in the same tendon (arrow). Red = hard consistency (≤15 m/sec), blue = soft consistency (≥0.5 m/sec), and green and yellow = intermediate consistency. SWE data were collected using an Acuson S3000 US scanner (Siemens Healthineers, Erlangen, Germany) with a L9–4-MHz linear transducer.
Figure 5b.
Normal subscapularis tendon in a 31-year-old woman with a history of seronegative polyarthritis. (a) Long-axis gray-scale US image of the subscapularis tendon shows a normal echogenic appearance (arrows). (b) Color elastogram of the same region shows predominantly intermediate shear-wave velocities (arrows) (mean, 7.50 m/sec) in the subscapularis tendon. SWE data were collected using an Acuson S3000 US scanner with an L9–4-MHz linear transducer.
Figure 6b.
Massive supraspinatus tendon (SST) tear in a 73-year-old man. (a) Long-axis gray-scale US image of the expected SST region shows the deltoid muscle abutting the humeral head, related to a massive SST tear (arrows), with SST fibers not seen. (b) Color elastogram of the same region shows low shear-wave velocities (arrows) (mean, 3.15 m/sec) in the deltoid muscle. SWE data were collected using an Acuson S3000 US scanner with an L9–4-MHz linear transducer.
Figure 7b.
Tenosynovitis of the first extensor compartment tendons of the wrist in a 59-year-old woman with a history of rheumatoid arthritis. (a) Long-axis gray-scale US image shows mild hypoechogenicity of the extensor pollicis brevis (EPB) tendon fibers (white arrows) and a mildly heterogeneous synovial-fluid complex in the massively distended tendon sheath (black arrow). (b) Color elastogram of the same region shows predominantly intermediate shear-wave velocities (arrows) in the EPB tendon (mean, 8.65 m/sec) and low shear-wave velocities (mean, 3.04 m/sec) in the region of synovitis (black arrow) within the tendon sheath. SWE data were collected using an Acuson S3000 US scanner with an L9–4-MHz linear transducer. The right side of the images is proximal.
Figure 8b.
Normal medial head of gastrocnemius and soleus aponeurosis in the relaxed and contracted (maximal dorsiflexion of the ankle) states in an asymptomatic 48-year-old woman. (a) Long-axis gray-scale US image shows normal echotexture of the relaxed gastrocnemius (G) and soleus (S) muscles and of the aponeurosis (arrow). (b) Color elastogram of the same region shows low shear-wave velocities in the gastrocnemius muscle (mean, 2.89 m/sec) and intermediate velocities at the aponeurosis (arrow) (mean, 4.915 m/sec). (c) Long-axis gray-scale US image of the same region with maximal dorsiflexion of the ankle shows normal echotexture of the gastrocnemius (G) and soleus (S) muscles and of the aponeurosis (arrow). (d) Color elastogram of the same region shows increased shear-wave velocity of the contracted gastrocnemius muscle (6.79 m/sec) and at the aponeurosis (arrow) (mean, 10.83 m/sec). SWE data were collected using an Acuson S3000 US scanner with an L9–4-MHz linear transducer.
Figure 8c.
Normal medial head of gastrocnemius and soleus aponeurosis in the relaxed and contracted (maximal dorsiflexion of the ankle) states in an asymptomatic 48-year-old woman. (a) Long-axis gray-scale US image shows normal echotexture of the relaxed gastrocnemius (G) and soleus (S) muscles and of the aponeurosis (arrow). (b) Color elastogram of the same region shows low shear-wave velocities in the gastrocnemius muscle (mean, 2.89 m/sec) and intermediate velocities at the aponeurosis (arrow) (mean, 4.915 m/sec). (c) Long-axis gray-scale US image of the same region with maximal dorsiflexion of the ankle shows normal echotexture of the gastrocnemius (G) and soleus (S) muscles and of the aponeurosis (arrow). (d) Color elastogram of the same region shows increased shear-wave velocity of the contracted gastrocnemius muscle (6.79 m/sec) and at the aponeurosis (arrow) (mean, 10.83 m/sec). SWE data were collected using an Acuson S3000 US scanner with an L9–4-MHz linear transducer.
Figure 8d.
Normal medial head of gastrocnemius and soleus aponeurosis in the relaxed and contracted (maximal dorsiflexion of the ankle) states in an asymptomatic 48-year-old woman. (a) Long-axis gray-scale US image shows normal echotexture of the relaxed gastrocnemius (G) and soleus (S) muscles and of the aponeurosis (arrow). (b) Color elastogram of the same region shows low shear-wave velocities in the gastrocnemius muscle (mean, 2.89 m/sec) and intermediate velocities at the aponeurosis (arrow) (mean, 4.915 m/sec). (c) Long-axis gray-scale US image of the same region with maximal dorsiflexion of the ankle shows normal echotexture of the gastrocnemius (G) and soleus (S) muscles and of the aponeurosis (arrow). (d) Color elastogram of the same region shows increased shear-wave velocity of the contracted gastrocnemius muscle (6.79 m/sec) and at the aponeurosis (arrow) (mean, 10.83 m/sec). SWE data were collected using an Acuson S3000 US scanner with an L9–4-MHz linear transducer.
Figure 9b.
Acute tennis leg injury in a 51-year-old man. (a) Long-axis gray-scale US image shows partial avulsion of the medial head of the gastrocnemius muscle (G) from the soleus (S) aponeurosis (arrow). (b) Color elastogram of the same region shows low velocities in the injured avulsed soleus muscle (mean, 1.79 m/sec) with thickening and somewhat higher shear-wave velocities (mean, 2.32 m/sec) in the injured aponeurosis (arrow). Note that the shear-wave velocities in both the gastrocnemius muscle and at the aponeurosis are lower than in the healthy tissues in the same region in the patient in Figure 8. SWE data were collected using an Acuson S3000 US scanner with an L9–4-MHz linear transducer.
Figure 10b.
Normal ulnar nerve in the cubital tunnel in an asymptomatic 58-year-old woman. (a) Long-axis gray-scale US image shows a normal relatively hypoechoic ulnar nerve (arrows) in the cubital tunnel. (b) Color elastogram of the same region shows low shear-wave velocities (mean, 2.22 m/sec) in the ulnar nerve (arrows). SWE data were collected using an Acuson S3000 US scanner with an L9–4-MHz linear transducer. The right side of the image is distal.
Figure 11b.
Abnormal median nerve in the carpal tunnel in a 34-year-old woman with suspected psoriatic arthritis and median neuropathy. (a) Long-axis gray-scale US image shows an enlarged relatively hypoechoic median nerve (arrows) in the carpal tunnel. (b) Color elastogram of the same region shows intermediate shear-wave velocities (mean, 5.21 m/sec) in the median nerve (arrows). SWE data were collected using an Acuson S3000 US scanner with an L9–4-MHz linear transducer. The right side of the image is distal.
Figure 12b.
Normal anterior band of the medial ulnar collateral ligament (MUCL) of the elbow in a 21-year-old man. (a) Long-axis gray-scale US image shows a normal echogenic anterior band of the MUCL at the medial aspect of the elbow (arrows). (b) Color elastogram of the same region shows intermediate to high shear-wave velocities (mean, 8.69 m/sec) in the MUCL (arrows). SWE data were collected using an L9–4-MHz linear transducer.
Figure 13b.
Tophaceous gout at the first metatarsophalangeal joint in a 49-year-old man. (a) Long-axis gray-scale US image along the medial aspect of the first metatarsophalangeal joint shows echogenic intra-articular gouty tophus (arrow) abutting the metatarsal head (MT). PP = proximal phalanx. (b) Color elastogram of the same region shows intermediate shear-wave velocity (arrow) (mean, 7.32 m/sec) in the gouty tophus. SWE data were collected using an Acuson S3000 US scanner with an L9–4-MHz linear transducer.
Figure 14b.
Intramuscular lipoma in a 48-year-old woman with a palpable painless lump in her forearm. (a) Sagittal T1-weighted magnetic resonance (MR) image shows a well-defined high-signal-intensity mass (arrow) in the distal aspect of the supinator muscle, consistent with an intramuscular lipoma. (b) Long-axis gray-scale US image in the region of palpable abnormality shows a nonspecific echogenic solid intramuscular mass (arrows) in the distal supinator muscle. (c) Color elastogram of the same region shows lower shear-wave velocities (mean, 1.74 m/sec) in the mass (arrows) than in the region of the pseudocapsule, which shows intermediate velocities (mean, 5.52 m/sec). SWE data were collected using an Acuson S3000 US scanner with an L9–4-MHz linear transducer.
Figure 14c.
Intramuscular lipoma in a 48-year-old woman with a palpable painless lump in her forearm. (a) Sagittal T1-weighted magnetic resonance (MR) image shows a well-defined high-signal-intensity mass (arrow) in the distal aspect of the supinator muscle, consistent with an intramuscular lipoma. (b) Long-axis gray-scale US image in the region of palpable abnormality shows a nonspecific echogenic solid intramuscular mass (arrows) in the distal supinator muscle. (c) Color elastogram of the same region shows lower shear-wave velocities (mean, 1.74 m/sec) in the mass (arrows) than in the region of the pseudocapsule, which shows intermediate velocities (mean, 5.52 m/sec). SWE data were collected using an Acuson S3000 US scanner with an L9–4-MHz linear transducer.
Figure 15b.
Intramuscular lipoma in the left upper back of a 55-year-old woman with spuriously high shear-wave velocities. (a) Long-axis gray-scale US image in the region of palpable abnormality shows a relatively hypoechoic subcutaneous soft-tissue mass consistent with a lipoma (arrows). (b) Color elastogram of the same region shows spuriously high shear-wave velocities within the mass (arrows), which were due to an incorrect highest velocity setting at only 6.5 m/sec. SWE data were collected using an Acuson S3000 US scanner with an L9–4-MHz linear transducer.
Figure 16b.
Tender palpable palmar mass at the level of the mid-metacarpals centered at the ulnar aspect of the second digit flexor tendons in an 18-year-old man, consistent with a pathologically proven fibroma of the tendon sheath. (a) Short-axis power Doppler US image of the palmar aspect of the hand in the region of the palpable lump shows a hypoechoic mass (arrows) with associated moderate hyperemia. (b) Color elastogram of the same region shows intermediate shear-wave velocities (mean, 5.93 m/sec) within the mass (arrows). (c) Axial T2-weighted fat-saturated MR image of the same hand shows a high-signal-intensity mass centered at the ulnar aspect of the second digit flexor tendons (arrow). SWE data were collected using an Acuson S3000 US scanner with an L9–4-MHz linear transducer.
Figure 16c.
Tender palpable palmar mass at the level of the mid-metacarpals centered at the ulnar aspect of the second digit flexor tendons in an 18-year-old man, consistent with a pathologically proven fibroma of the tendon sheath. (a) Short-axis power Doppler US image of the palmar aspect of the hand in the region of the palpable lump shows a hypoechoic mass (arrows) with associated moderate hyperemia. (b) Color elastogram of the same region shows intermediate shear-wave velocities (mean, 5.93 m/sec) within the mass (arrows). (c) Axial T2-weighted fat-saturated MR image of the same hand shows a high-signal-intensity mass centered at the ulnar aspect of the second digit flexor tendons (arrow). SWE data were collected using an Acuson S3000 US scanner with an L9–4-MHz linear transducer.
Figure 17b.
Pathologically proven, painless, palpable, epidermoid inclusion cyst at the anterior aspect of the proximal tibia in an 18-year-old woman. (a) Long-axis gray-scale US image in the region of palpable abnormality shows a homogeneously hypoechoic circumscribed oval subcutaneous mass (arrow) with increased through transmission. (b) Color elastogram of the same region shows low shear-wave velocities (mean, 2.76 m/sec) within the mass (arrows). SWE data were collected using an Acuson S3000 US scanner with an L9–4-MHz linear transducer.
Figure 18b.
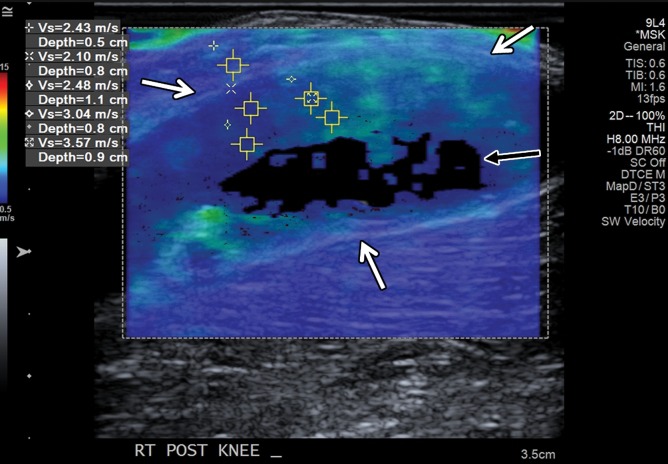
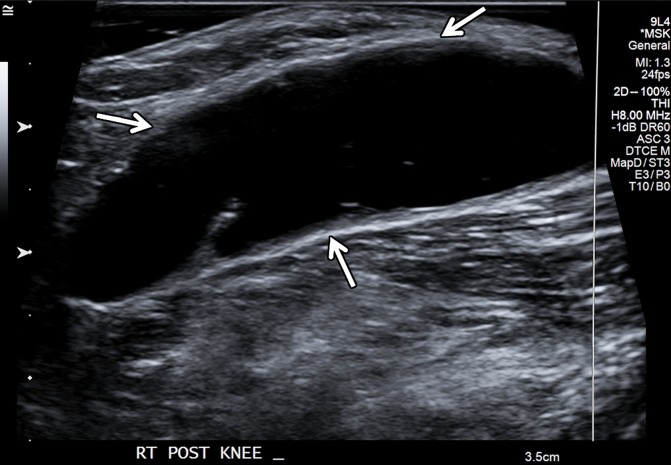
Large popliteal (Baker) cyst in a 66-year-old woman. (a) Long-axis gray-scale US image in the region of a palpable mass at the posterior aspect of the knee shows a large anechoic popliteal cyst (arrows). (b) Color elastogram of the same region shows low shear-wave velocities (white arrows) (mean, 2.8 m/sec) in the region of synovial proliferation at the periphery of the popliteal cyst, with a signal void centrally (black arrow) because the shear waves do not propagate though the fluid. SWE data were collected using an Acuson S3000 US scanner with an L9–4-MHz linear transducer.
Figure 19b.
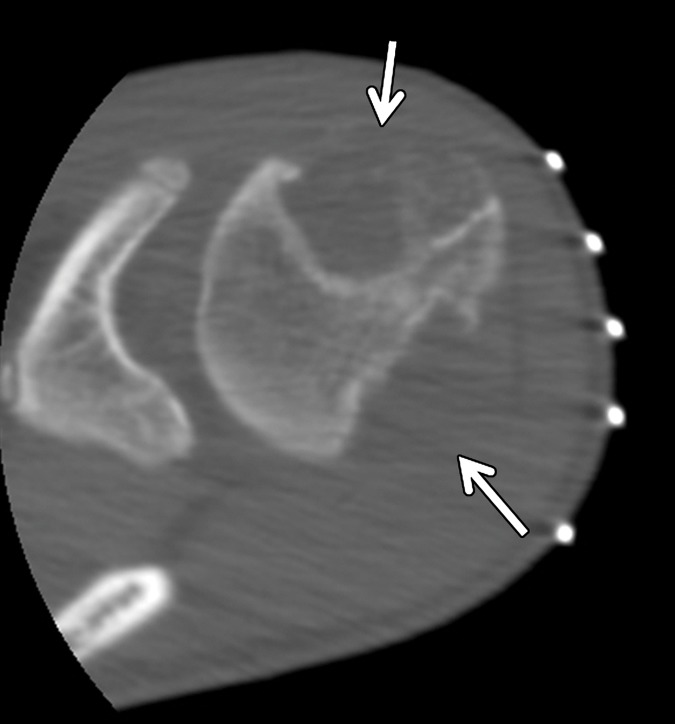
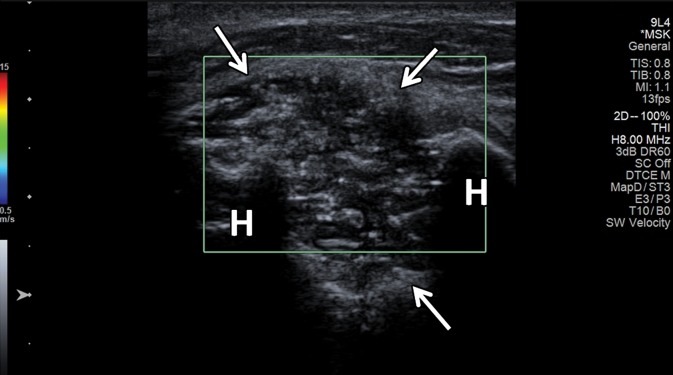
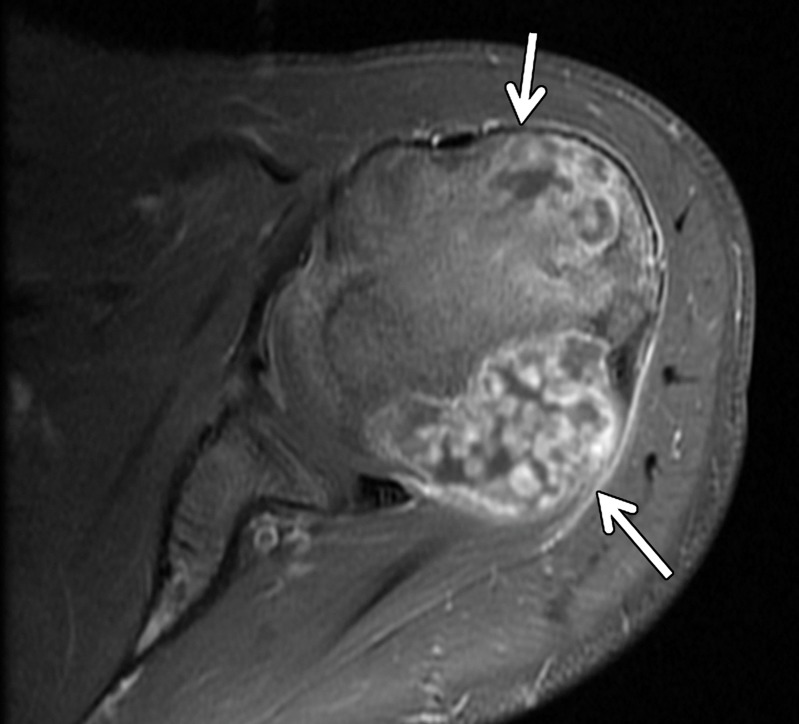
Enchondroma in a 13-year-old boy with Ollier disease and two large chondroid matrix lesions in the proximal humerus. The lesion at the anterior aspect of the humeral head was pathologically proven to be an enchondroma. (a) Axial contrast-enhanced T1-weighted fat-saturated MR image of the proximal humerus shows two heterogeneously enhancing chondroid matrix lesions at the anterior and posterior aspects of the humeral head (arrows). (b) Axial computed tomographic (CT) image of the same region obtained during biopsy of the anterior lesion shows two large expansile osteolytic lesions, centered at the anterior and posterior aspects of the humeral head, with inner sclerotic margins and subtle chondroid matrix in the anterior lesion (arrows). (c) Short-axis gray-scale US image at the anterior aspect of the humeral head (H) shows a heterogeneous relatively hypoechoic mass with multiple internal calcifications (arrows) and irregular margins with the underlying bone. (d) Color elastogram of the same region shows high shear-wave velocities (range, 9.21–15 m/sec or more) within the anterior humeral head (H) mass (arrows), indicating hard consistency. SWE data were collected using an Acuson S3000 US scanner with an L9–4-MHz linear transducer.
Figure 19c.
Enchondroma in a 13-year-old boy with Ollier disease and two large chondroid matrix lesions in the proximal humerus. The lesion at the anterior aspect of the humeral head was pathologically proven to be an enchondroma. (a) Axial contrast-enhanced T1-weighted fat-saturated MR image of the proximal humerus shows two heterogeneously enhancing chondroid matrix lesions at the anterior and posterior aspects of the humeral head (arrows). (b) Axial computed tomographic (CT) image of the same region obtained during biopsy of the anterior lesion shows two large expansile osteolytic lesions, centered at the anterior and posterior aspects of the humeral head, with inner sclerotic margins and subtle chondroid matrix in the anterior lesion (arrows). (c) Short-axis gray-scale US image at the anterior aspect of the humeral head (H) shows a heterogeneous relatively hypoechoic mass with multiple internal calcifications (arrows) and irregular margins with the underlying bone. (d) Color elastogram of the same region shows high shear-wave velocities (range, 9.21–15 m/sec or more) within the anterior humeral head (H) mass (arrows), indicating hard consistency. SWE data were collected using an Acuson S3000 US scanner with an L9–4-MHz linear transducer.
Figure 19d.
Enchondroma in a 13-year-old boy with Ollier disease and two large chondroid matrix lesions in the proximal humerus. The lesion at the anterior aspect of the humeral head was pathologically proven to be an enchondroma. (a) Axial contrast-enhanced T1-weighted fat-saturated MR image of the proximal humerus shows two heterogeneously enhancing chondroid matrix lesions at the anterior and posterior aspects of the humeral head (arrows). (b) Axial computed tomographic (CT) image of the same region obtained during biopsy of the anterior lesion shows two large expansile osteolytic lesions, centered at the anterior and posterior aspects of the humeral head, with inner sclerotic margins and subtle chondroid matrix in the anterior lesion (arrows). (c) Short-axis gray-scale US image at the anterior aspect of the humeral head (H) shows a heterogeneous relatively hypoechoic mass with multiple internal calcifications (arrows) and irregular margins with the underlying bone. (d) Color elastogram of the same region shows high shear-wave velocities (range, 9.21–15 m/sec or more) within the anterior humeral head (H) mass (arrows), indicating hard consistency. SWE data were collected using an Acuson S3000 US scanner with an L9–4-MHz linear transducer.
Figure 20b.
Pathologically proven telangiectatic osteosarcoma of the distal femur in a 20-year-old woman. F = femur. (a) Lateral radiograph of the knee shows a large, expansile osseous matrix lesion in the distal femur with associated aggressive periosteal reaction and a large soft-tissue mass (arrows). (b) Axial T2-weighted fat-saturated MR image of the distal femur shows an expansile heterogeneous osseous matrix tumor with associated cortical breakthrough and a large soft-tissue component (white arrows), with a secondary aneurysmal bone cyst containing multiple fluid levels (black arrows). (c) Short-axis gray-scale US image of the soft-tissue component of the lesion shows a heterogeneous relatively echogenic lesion (white arrows) with multiple fluid levels (black arrow), consistent with an aneurysmal bone cyst containing blood products. (d) Color elastogram of the same region shows low-to-intermediate shear cs (mean, 4.12 m/sec) within the soft-tissue component of the lesion (white arrows) with signal voids in the fluid components of the aneurysmal bone cyst (black arrow).
Figure 20c.
Pathologically proven telangiectatic osteosarcoma of the distal femur in a 20-year-old woman. F = femur. (a) Lateral radiograph of the knee shows a large, expansile osseous matrix lesion in the distal femur with associated aggressive periosteal reaction and a large soft-tissue mass (arrows). (b) Axial T2-weighted fat-saturated MR image of the distal femur shows an expansile heterogeneous osseous matrix tumor with associated cortical breakthrough and a large soft-tissue component (white arrows), with a secondary aneurysmal bone cyst containing multiple fluid levels (black arrows). (c) Short-axis gray-scale US image of the soft-tissue component of the lesion shows a heterogeneous relatively echogenic lesion (white arrows) with multiple fluid levels (black arrow), consistent with an aneurysmal bone cyst containing blood products. (d) Color elastogram of the same region shows low-to-intermediate shear cs (mean, 4.12 m/sec) within the soft-tissue component of the lesion (white arrows) with signal voids in the fluid components of the aneurysmal bone cyst (black arrow).
Figure 20d.
Pathologically proven telangiectatic osteosarcoma of the distal femur in a 20-year-old woman. F = femur. (a) Lateral radiograph of the knee shows a large, expansile osseous matrix lesion in the distal femur with associated aggressive periosteal reaction and a large soft-tissue mass (arrows). (b) Axial T2-weighted fat-saturated MR image of the distal femur shows an expansile heterogeneous osseous matrix tumor with associated cortical breakthrough and a large soft-tissue component (white arrows), with a secondary aneurysmal bone cyst containing multiple fluid levels (black arrows). (c) Short-axis gray-scale US image of the soft-tissue component of the lesion shows a heterogeneous relatively echogenic lesion (white arrows) with multiple fluid levels (black arrow), consistent with an aneurysmal bone cyst containing blood products. (d) Color elastogram of the same region shows low-to-intermediate shear cs (mean, 4.12 m/sec) within the soft-tissue component of the lesion (white arrows) with signal voids in the fluid components of the aneurysmal bone cyst (black arrow).
Compression, Transient, and Tension Sonoelastography
Compression sonoelastography, which is commercially available on most US machines, provides visualization of different tissue displacements (ie, strain) by comparing US images before and after light freehand transducer compression (ie, stress). With this technique, compressive strain is lower in harder tissues. On most modern US scanners, compression sonoelastography provides a semiquantitative measurement of the strain ratio, which represents an index of the relative elasticity between a chosen region of interest (ROI) in the examined tissue and a reference ROI, which is usually in the adjacent subcutaneous tissues. However, compression sonoelastography is operator dependent and provides only a qualitative measure of tissue elasticity. As a result, it has limitations with reproducibility and often suffers from the eggshell effect, in which harder tissues on the boundary of a lesion cannot be deformed, limiting the determination of internal strain (2).
Transient elastography uses low-frequency excitation pulses to generate shear waves and measures only regional tissue elasticity with limited depth. Whereas SWE provides an absolute measure of the shear modulus from just the tissue displacements, transient elastography requires computing tissue strain (ie, the spatial gradient of displacements), which is a noisy mathematical operation and provides only a relative measure of stiffness (soft vs hard). However, transient elastography is easy to perform during real-time imaging of dynamic tissue motion (2).
Tension elastography is a variation of compression elastography, with tissue strain measured in response to an internally generated tensile stress, which has been validated recently ex vivo (4). Tensile force is created by voluntary isometric muscle contraction, whereas the generated force is measured externally using a dynamometer and data acquisition system. When compared with compression sonoelastography, tension elastography provides quantitative information related to tissue elasticity (elastic modulus), which is relevant as the primary function of tendons is to transmit tensile force from muscle to bone. Although this technique is not yet commercially available, it holds great promise as a new functional imaging test, which may guide treatment for tendinopathies and other chronic tendon disorders (4).
Basic Physics of SWE
During the past decade, SWE, which is also called dynamic elastography, is being gradually but increasingly used in the evaluation of various musculoskeletal tissues (Figs 2–20) in research and clinical settings, allowing both qualitative and quantitative measurement of tissue elasticity. Shear-wave imaging is now Food and Drug Administration–approved on most state-of-the-art US scanners (including those offered by Philips, GE Healthcare, Siemens Healthineers, Ultrasonix, and Supersonic Imagine) for diagnostic imaging of the musculoskeletal system. This technique is rapidly evolving for new applications and clinical utility in musculoskeletal imaging. 2,3By quantifying mechanical and elastic tissue properties, SWE complements the diagnosis obtained at gray-scale (B-mode) US and power and color Doppler US (2,3).
To simplify the explanation of the basic physics, the shear wave is a transverse wave that occurs in an elastic medium that is subject to a periodic shear force. Shear is defined as change in the shape of a substance layer without volume change, produced by a pair of equal forces working in opposite directions along the two opposed sides of the layer. After the shear interaction, the initial layer (tissue) will resume its original shape, while the adjacent layers undergo shear, and there will be further shifting of the shear wave, which propagates as a transverse shear wave (36).
For a better understanding of SWE (37,38), we will describe it in three simple steps, illustrated in Figure 1. In step 1, shear waves are generated using focused acoustic radiation force from a linear US array, which by itself provides a local stress and generates local displacement in the tissue.
Generated shear waves then propagate through the adjacent tissues in the transverse plane, perpendicular to the primary wave that produces the acoustic radiation force, at a much slower velocity, causing shear displacements in tissue.
In step 2, fast plane wave excitation is used to track the tissue displacement and shear wave velocities as the shear waves propagate. Tissue displacement is calculated using a speckle tracking algorithm. In step 3, tissue displacement maps are used to calculate shear-wave velocity (cs), frequently expressed in meters per second. The distribution of shear-wave velocities at each pixel is directly related to the shear modulus G, which is calculated by a simple mathematical equation and expresses the tissue stiffness and elasticity in units of pressure—normally kilopascals. The shear modulus is defined as the ratio of stress to strain that is given by G = ρcs2, where ρ is the material density. The Young modulus (E [or λ]) is defined to be E = 3G for isotropic media. The material density for soft tissue is typically estimated on the basis of values published in the literature for the type of tissue being examined, or approximated to be close to that of water (1 g/cm3) (36,37). Note that there is a direct relationship between the shear and the Young moduli, reported in some studies to be E = 2G(1+ υ), where υ is the Poisson ratio. Because soft tissues with small deformations (ie, quasi-static displacements) are usually assumed to be incompressible (ie, υ = 0.5), G is sometimes converted to E by the simple equation E = 3G for incompressible media (39). Therefore, although some studies refer to shear-wave values or to G, others report E on the basis of this relationship.
Figs 2520On the US screen, quantitative shear modulus maps are represented in a color-coded elastogram displaying shear-wave velocities in meters per second (Figs 2, 5–20) or tissue elasticity in kilopascals (Figs 3, 4) (38). For the color elastograms, red is usually defined for encoding hard consistency, blue indicates soft consistency, and green and yellow encode intermediate stiffness. Understanding and interpreting color elastograms and shear-wave velocities requires knowledge of the basic ultrasound physics of SWE. In comparison with compression sonoelastography, SWE is considered to be more objective and reproducible and allows direct assessment of tissue elasticity, with the possibility to obtain quantitative measurements without the need for manual compression.
Figure 5a.
Normal subscapularis tendon in a 31-year-old woman with a history of seronegative polyarthritis. (a) Long-axis gray-scale US image of the subscapularis tendon shows a normal echogenic appearance (arrows). (b) Color elastogram of the same region shows predominantly intermediate shear-wave velocities (arrows) (mean, 7.50 m/sec) in the subscapularis tendon. SWE data were collected using an Acuson S3000 US scanner with an L9–4-MHz linear transducer.
Figure 3.
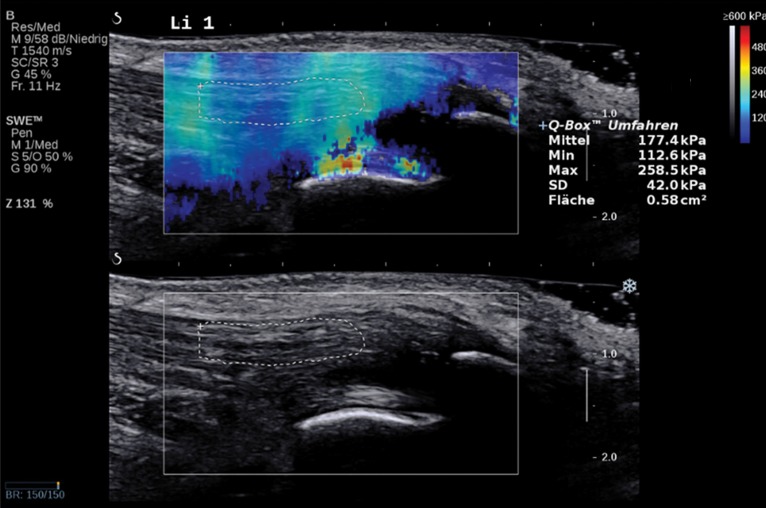
Normal Achilles tendon in a 69-year-old asymptomatic woman. Bottom image: Long-axis gray-scale US image shows normal echogenic fibrillar appearance of the Achilles tendon with an outlined region of interest (ROI). Top image: Color elastogram of the same region shows normal G of the examined tendon (177.4 kPa ± 42). SWE data were collected using an Aixplorer US scanner (Supersonic Imagine, Aix-en-Provence, France) with an L15–4-MHz linear transducer.
Figure 4.
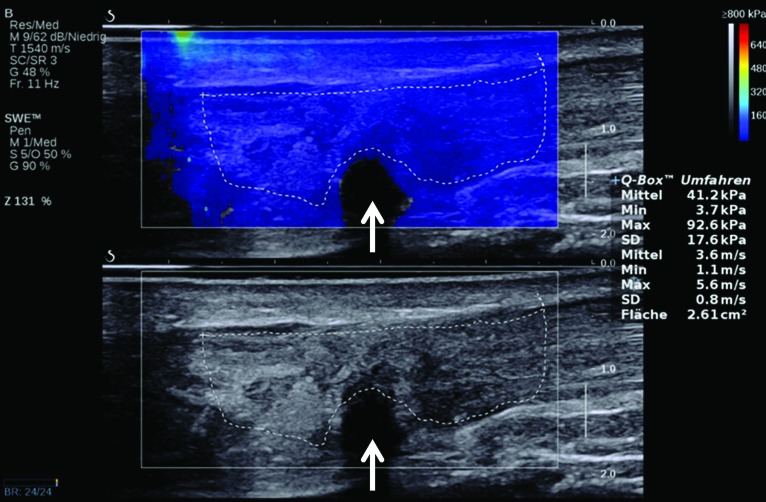
Tendinopathy and partial-thickness Achilles tendon tear in a 45-year-old man. Bottom image: Long-axis gray-scale US image shows thickening, heterogeneous echogenicity, and disorganized echotexture of the Achilles tendon fibers, with an outlined ROI. Note the partial-thickness tear (arrow) at the deep aspect of the tendon. Top image: Color elastogram of the same region shows a lower G, 41.2 kPa ± 17.6, for the tendon. Note the signal void (arrow) in the region of the partial-thickness tear. SWE data were collected using an Aixplorer US scanner with an L15–4-MHz linear transducer.
Shear waves travel through soft tissues approximately 1000 times slower and attenuate approximately 10 000 times faster than longitudinal conventional ultrasound waves. Their passage, including their speed, can be observed on US images as long as the ultrasound echoes can be generated frequently enough (2,37,38). Frame rates for tracking shear waves are typically between 2 kHz and 10 kHz. A quality index is often displayed to the sonographer as a measure of confidence of the shear wave estimate. The quality index is related to the correlation coefficient for tracking the shear displacements. If the frame rate is too low or there is no developed speckle in the region (eg, from fluid), the quality index is low (below a user-defined threshold of about 0.9) and the shear-wave elastogram displays a signal void (no estimate for shear-wave velocities at that region). A signal void in superficial structures is usually due to the presence of fluid (eg, edema, blood) and may provide additional diagnostic information.
In an echo-time study on 80 healthy individuals, Aubry and collaborators (40) confirmed that Achilles tendon stiffness increases with stretching and that cs values are higher when measured parallel (along the long axis) to the tendon fibers, as opposed to perpendicular (along the short axis), as a result of tendon anisotropy. To summarize, shear waves propagate faster in stiffer and contracted tissues and along the long axis of the tendon. During this process, several thousand images per second are generated, which convey information about local elastic and viscoelastic tissue properties (2,3,36–38).
A primary limitation of SWE is depth of penetration. Shallow depths may be accommodated by applying a 5-mm layer of coupling US gel as standoff. The shape and size of the ROI for postanalysis is also limited on some scanners. Most scanners require a timeout of a few seconds before the next acquisition, which prevents real-time dynamic imaging of structures in motion. Additionally, SWE is sensitive to transducer pressure and angle, and the shear modulus depends on the orientation of the probe relative to the examined structures (36).
SWE of Tendons and Muscles
During the past few years, several studies have been published on SWE of human tendons (5–17) and muscles (18–29), with promising results. The majority of these studies are experimental (5,6,9–14,16–24,27,29,31–33) with a smaller number of clinical studies (7,8,15,26,28,30,34,35). Additionally, several studies evaluated viscoelastic properties of the Achilles tendon (5–14). The current literature suggests that shear waves propagate faster in healthy tendons than in those that are tendinopathic, and faster in contracted tendons and muscles than in those that are relaxed. Additionally, shear waves propagate faster along the long axis of healthy tendons than along the short axis.
In 2011, Arda and collaborators (5) performed a study of SWE that included the gastrocnemius and masseter muscles and the supraspinatus and Achilles tendons, in 127 healthy volunteers of both sexes in both the longitudinal and transverse planes, to determine the normal measurement values of different healthy tissues. SWE data were collected on an Aixplorer US scanner. The mean elasticity values in both the longitudinal and transverse planes were 11.1 kPa ± 4.1 (range, 2–28 kPa) for the gastrocnemius muscle in men and 11.1 kPa ± 4.0 (range, 4–26 kPa) in women, 10.8 kPa ± 3.9 (range, 4–20 kPa) for the masseter muscle in men and 10.3 kPa ± 3.6 (range, 2–23 kPa) in women, 36.0 kPa ± 13.0 (range, 11–77 kPa) for the supraspinatus tendon in men and 29.1 kPa ± 12.4 (range, 6–90 kPa) in women. The measurements for the Achilles tendon were 98.8 kPa ± 47.1 (range, 8–242 kPa) for the longitudinal plane in men and 62.5 kPa ± 40.1 (range, 6–176) in women, and 51.1 kPa ± 23.8 (range, 15–98 kPa) for the transverse plane of the Achilles tendon in men and 51.7 kPa ± 25.7 (range, 10–111 kPa) in women. The mean elasticity values for the examined musculature and the Achilles tendon were greater in men than in women in the longitudinal plane, but there was no statistically significant difference for the elasticities of the Achilles tendon in the transverse plane between sexes. There was also no statistically significant correlation between the elasticity of the examined muscles or the Achilles tendon with age, for the examined volunteers.
Several authors used SWE to evaluate the elasticity of normal and tendinopathic Achilles tendons in different postures (resting position, plantar flexion, dorsiflexion) and emphasized the importance of both spatial location and ankle posture with SWE for evaluation of viscoelastic properties of the Achilles tendon (6,7,10,17).
In a study by DeWall and collaborators (6), with fixed posture, shear-wave velocities decreased significantly from the free Achilles tendon to the gastrocnemius myotendinous junction, whereas slightly higher velocities were measured on the medial side than on the lateral side. Additionally, shear-wave velocities correlated only weakly with the thickness and depth of the Achilles tendon. In their study on 180 asymptomatic Achilles and 30 tendinopathic Achilles tendons, Aubry and collaborators (7) reported that the Achilles tendon in subjects with tendinopathy was significantly softer than normal tendons, in two different postures. The mean cs thresholds at which an assumption of Achilles tendon softening could be made in the short axis were ≤4.06 m/sec with 0° flexion (relaxed state) and ≤4.86 m/sec with stretched tendons (maximal plantar flexion), whereas in the long axis, the shear-wave velocities were ≤5.70 m/sec in the relaxed state and ≤14.58 m/sec in the stretched tendons. All six partial-thickness tears had an appearance of signal void at SWE.
In a study by Chen and collaborators (8) in 36 normal and 14 ruptured Achilles tendons, the mean G for the normal Achilles tendons was 291.91 kPa ± 4.38 and for the ruptured Achilles tendons was 56.48 kPa ± 68.59. In the healthy Achilles tendons, the high shear-wave velocities saturated the imaging system with values exceeding 300 kPa. A recent SWE study of Achilles tendons revealed higher stiffness in frequent exercisers than in infrequent exercisers of the nondominant ankle but not of the dominant ankle (9). Another study revealed increasing shear-wave velocities of the Achilles tendon in both the relaxed and tension states with increasing age, but no significant differences between men and women within any group in the same posture or between different postures in subjects aged 46–55 and 56–65 years (10).
Three recent studies compared the results of conventional with continuous SWE (11–13). In a study by Helfenstein-Didier and collaborators (11), the conventional SWE method consistently underestimated phase velocity, more so with ankle dorsiflexion. This suggested possible bias for SWE of tendon when using standard assumptions. Another SWE study by Cortes and collaborators (12) in seven subjects with healthy Achilles tendons revealed an advantage of continuous SWE. Imaging parameters, such as excitation frequency and upper range of the shear modulus, were adjusted in real time for one subject with unilateral Achilles tendinopathy and in one with a unilateral healing semitendinosus tendon to accommodate higher shear-wave values, which helped evaluate tissues with higher stiffness.
A few studies evaluated the patellar tendon with SWE. A study by Zhang and collaborators (15) in 33 male athletes on 20 asymptomatic patellar tendons and 13 patellar tendons with proximal tendinopathy revealed a higher shear modulus associated with stiffer and larger tendons on the painful side than on the asymptomatic side, as well as on the dominant side of healthy athletes. There were no significant differences in patellar tendon morphology and elastic properties between the dominant and nondominant knees in healthy controls. Hsiao and collaborators (16) examined the healthy patellar tendons in three different age groups and noted significantly decreased shear-wave velocities, with increased side-to-side differences in the oldest of the three groups. This study suggested that SWE may be valuable in detecting aging tendons before visible abnormalities are depicted by conventional US techniques.
Several SWE studies revealed greater stiffness of contracted skeletal muscles than of those in the relaxed state (18,19). Wang and collaborators (19) reported no significant difference in the mean G of the vastus intermedius between elderly and young women in the relaxed state, but there was greater stiffness of the contracted vastus intermedius muscle in younger women, particularly with higher levels of contraction. Eby and collaborators (29) conducted an SWE study using an Aixplorer US scanner to quantify biceps brachii stiffness at 90° elbow flexion and full extension in 133 healthy adults (47 men and 86 women; ages, 21–94 years). This study also revealed that the shear modulus G increased with advancing age, and the values for women tended to be higher than those for men.
In an SWE study on neck muscle elasticity in the normal population by Kuo and collaborators (25), shear-wave velocities differed significantly among different muscles, with shear-wave velocity values of 2.09 ± 0.45, 1.21 ± 0.30, 1.12 ± 0.17 and 0.97 ± 0.10 m/sec for the trapezius, levator scapulae, scalene anterior, and sternocleidomastoid muscles, respectively. The cs values for the trapezius muscle correlated with body mass indexes, and individuals with chronic neck pain symptoms had significantly stiffer trapezius muscles.
Lacourpaille and collaborators (20) used SWE to evaluate the stiffnesses of six different relaxed and contracted skeletal muscles—the tibialis anterior, vastus lateralis, biceps brachii, triceps brachii, abductor digiti minimi, and medial head of the gastrocnemius—in 14 patients with Duchenne muscular dystrophy and 13 healthy control subjects. SWE was performed using an Aixplorer US scanner. The stiffness of all examined skeletal muscles was significantly higher in patients with Duchenne muscular dystrophy than in healthy controls, except for the abductor digiti minimi, in which there was little change.
Carpenter and collaborators (26) conducted a SWE study on eight patients with genetically and biopsy-proven GNE-related myopathy and five healthy volunteers to assess for quantitative differences in shear-wave velocities between the skeletal muscles in these two groups. The mean cs was significantly lower in patients with GNE-related myopathy than in the healthy control group, with diminished muscle anisotropy in GNE-related myopathy. This study suggested that serial evaluation of GNE-related myopathy may be possible by using cs values to assess the temporal change of muscle bulk and weakness.
There are a few studies on SWE of the supraspinatus muscle (27,28). Itoigawa and collaborators (27) evaluated supraspinatus muscle stiffness in six shoulders of three young healthy volunteers using an Aixplorer US scanner to explore the potential feasibility of SWE in combination with B-mode US to measure the stiffness of the supraspinatus muscle along the long axis of the muscle fibers and obtain key information about muscle extensibility, which is an important factor for rotator cuff repair treatment planning.
In another recent study, Rosskopf and collaborators (28) performed SWE of the supraspinatus muscle in 22 healthy volunteers and 44 patients, the majority of whom had various degrees of supraspinatus tendinopathy or tendon tear. Shear-wave data were collected for two upper and two lower quadrants of the supraspinatus muscle in the short axis and transverse plane. Findings for cs were compared with supraspinatus tendon integrity and tendon retraction, which is evaluated using the Patte classification (41), fatty muscle infiltration (Goutallier stages 0–IV) (42), and muscle volume atrophy on MR images (tangent sign) (43). The mean normal cs of the healthy supraspinatus muscle was 3.0 m/sec ± 0.5, which was significantly higher than in affected patients (2.5 m/sec ± 0.5). Shear-wave velocities decreased with increasing fat content (Goutallier stages 0–III) and increased in the final stage of fatty infiltration (Goutallier stage IV). The authors concluded that SWE is reproducible for assessment of the supraspinatus muscle, and that shear-wave velocity values greater than 3.0 m/sec in this muscle can be considered normal (28).
Figures 2–7 demonstrate, from the authors’ clinical practice, SWE of normal and abnormal tendons, and Figures 8 and 9 of normal and abnormal muscles, with findings concordant with the current literature. In the authors’ experience, normal tendons display predominantly intermediate shear-wave velocities as measured along their long axes, acquired on the Acuson S3000 US scanner (Figs 2 and 5). The invaginated deltoid muscle that abuts the humeral head in the region of a tissue void related to a full-thickness supraspinatus tendon tear displays low-shear wave velocities (Fig 6). Likewise, normal tendons have a higher shear modulus (Fig 3) than do tendinopathic tendons with associated partial-thickness tears (Fig 4), which display signal voids on color elastograms along their long axes, acquired on an Aixplorer US scanner. Proliferation of the synovial tissue within the bursa can be differentiated from simple fluid, as the shear waves do not travel through the fluid, leading to a signal void seen on the color elastograms (Fig 18). Normal healthy muscles in the relaxed state typically display lower shear-wave velocities than do intervening fasciae (aponeuroses), which show intermediate shear-wave velocities. In the contracted state, the same normal muscles show increased, typically intermediate, shear-wave velocities with higher shear-wave velocities along the intervening fascial planes (Fig 8). Compared with normal muscle and fascia (Fig 8), acute muscle and fascial tears in the same anatomic location show lower shear-wave velocities (Fig 9).
Figure 18a.
Large popliteal (Baker) cyst in a 66-year-old woman. (a) Long-axis gray-scale US image in the region of a palpable mass at the posterior aspect of the knee shows a large anechoic popliteal cyst (arrows). (b) Color elastogram of the same region shows low shear-wave velocities (white arrows) (mean, 2.8 m/sec) in the region of synovial proliferation at the periphery of the popliteal cyst, with a signal void centrally (black arrow) because the shear waves do not propagate though the fluid. SWE data were collected using an Acuson S3000 US scanner with an L9–4-MHz linear transducer.
SWE of Nerves
There are few studies evaluating the peripheral nerves (30–32). In our experience, nerves in patients with neuropathies show higher shear-wave velocities than normal nerves. Figure 10 shows SWE of the normal ulnar nerve in the cubital tunnel in an asymptomatic volunteer, and Figure 11 shows the abnormal median nerve in a patient with carpal tunnel syndrome from our clinical practice, with intermediate-to-higher shear-wave velocities in the abnormal median nerve versus the low velocities in the normal ulnar nerve.
In a SWE study by Kantarci and collaborators (30) on 37 consecutive patients (60 wrists) with a definitive diagnosis of carpal tunnel syndrome and 18 healthy volunteers (36 wrists), the median nerve stiffness at the carpal tunnel inlet was significantly higher in patients with carpal tunnel syndrome (66.7 kPa) than in normal subjects (32.0 kPa). It was also higher in the severe or extreme severity group (101.4 kPa) than in the mild or moderate severity group (55.1 kPa). A 40.4-kPa cutoff value at SWE revealed sensitivity, specificity, positive predictive value, negative predictive value, and accuracy of 93.3%, 88.9%, 93.3%, 88.9%, and 91.7%, respectively. SWE data were collected using an Aixplorer US scanner. Interobserver agreement was excellent for SWE measurements. The authors concluded that SWE could become useful in diagnosing carpal tunnel syndrome.
In an experimental study by Palmeri and collaborators (31) on fresh cadavers and two normal volunteers, SWE enabled improved visualization of several peripheral nerves, including the sciatic nerve and brachial plexus, with potential utility in regional anesthesia procedures.
Andrade and collaborators (32) evaluated the effect of 90° knee flexion and 180° extension with ankle dorsiflexion on shear-wave velocities of the sciatic nerve in nine healthy subjects using an Aixplorer US scanner. In this study, shear-wave velocities of the sciatic nerve significantly increased during ankle dorsiflexion with the knee in maximal extension, but no changes were noted at 90° of knee flexion. There was a tendency for the sciatic nerve shear-wave velocity to progressively decrease during the repeated five ankle dorsiflexions; however, this did not reach statistical significance. The results of this study indicate that the elastic properties of the sciatic nerve can be noninvasively assessed during passive motion.
SWE of Joints and Ligaments
Although US is widely used in evaluation of rheumatologic disease, to our knowledge there are no studies on the utility of SWE in evaluating arthritides. There are also few studies on SWE of ligaments (33–35). In our experience, normal ligaments in the relaxed state display intermediate shear-wave velocities, whereas the velocities increase in the contracted state. The velocities within the gouty tophi depend on their consistency, with harder tophi displaying higher velocities than soft tophi and thickened synovium. SWE of the normal medial ulnar collateral ligament (MUCL) of the elbow is demonstrated in Figure 12, and tophaceous gout in a patient from our clinical practice is shown in Figure 13.
Mhanna and collaborators (34) investigated mechanical properties and in vivo adaptation of the transverse carpal ligaments in 10 female pianists and 10 female nonpianists, because progressive stiffening of these ligaments may constrain the carpal tunnel and lead to median nerve compression. SWE data were collected using an Acuson S2000 US scanner (Siemens Healthineers). The study revealed significantly stiffer transverse carpal ligaments in pianists than in nonpianists, with shear-wave velocities being 10.2% greater for the pianist group than for the control group (5.52 m/sec ± 0.46 and 5.01 m/sec ± 0.58, respectively). In both groups, the transverse carpal ligament was stiffer at the radial aspect.
In their recent SWE study, Wu and collaborators (35) evaluated the thickness and elasticity of the coracohumeral ligament (CHL) in 30 healthy subjects and 20 patients with a clinical diagnosis of unilateral adhesive capsulitis in the neutral position and maximal external rotation of the shoulder. Images were obtained along the long axis of the CHL using an Aixplorer US scanner. This article reported increased thickness and stiffness of the CHL in the symptomatic shoulder than in the unaffected contralateral side. With both shoulders at the same degree of external rotation, the shear modulus was greater in the affected shoulder. The authors suggested that the stiffening of the CHL in patients with adhesive capsulitis may be associated with a limited range of motion during external rotation of the glenohumeral joint.
SWE of Soft-Tissue Musculoskeletal Masses
SWE shows promise in characterization (44–46) and treatment follow-up of breast masses (46). Athanasiou and collaborators (45) studied both conventional US and SWE of 28 benign and 20 malignant breast lesions in 46 patients, with all lesions detected at SWE. SWE was performed using a modified clinical US scanner. The malignant lesions exhibited G = 146.6 kPa ± 40.1, whereas the benign lesions showed G = 45.3 kPa ± 41.1. The authors were able to clearly differentiate complex cysts from solid lesions due to shear-wave signal dropout because shear waves do not propagate through fluids. In a more recent study of 33 patients with breast cancer, Athanasiou and collaborators (46) reported good correlation between three-dimensional (3D) SWE and dynamic contrast-enhanced MR imaging in tumor volume measurements and, in a selected subgroup of 10 patients who were good responders, diminished stiffness and elasticity heterogeneity. SWE also allowed characterization of thyroid nodules (with the majority of malignant lesions being stiffer than benign nodules [47]) and various benign and malignant liver lesions (48,49). To our knowledge, currently there are two studies on the utility of SWE in evaluation of musculoskeletal soft-tissue masses (50,51). In one, Pass and collaborators (50) conducted a B-mode and SWE study of 105 biopsy-proven musculoskeletal soft-tissue tumors, 39 of which were malignant and 66 benign. In this study, there was no significant quantitative or qualitative association between shear-wave velocity and malignancy.
The authors concluded that although there may be some evidence of an association between lower shear-wave velocity and soft-tissue malignancy, particularly in the transverse plane, this did not result in a substantive improvement in the ability to detect malignancy over B-mode consensus classification (50). Another similar SWE study from the same institution on 50 soft-tissue tumors, 15 of which were malignant and 35 benign, showed more encouraging results. In that study, the longitudinal shear-wave velocities of malignant masses were on average 30% slower than those of benign masses, and the longitudinal and transverse shear-wave velocity measurements were moderately associated with each other (51). However, it would be premature to draw definite conclusions on the utility of SWE in the evaluation of soft-tissue tumors on the basis of the results of these two studies. Further prospective studies are needed.
In our practice, in addition to conventional US, we frequently perform SWE of musculoskeletal tumors during routine diagnostic examinations or at the time of biopsy. Lipomas comprise the majority of the soft-tissue masses that we see in our routine practice, with the majority of them showing low or low-to-intermediate velocities. We include a few SWE images of biopsy-proven (Figs 16, 17, 19, 20) or MR imaging–confirmed (Fig 14) musculoskeletal tumors. Figure 15 demonstrates spuriously elevated shear-wave velocities in a subcutaneous lipoma, which saturated the maximum setting for the shear-wave velocity of 6.5 m/sec. Figure 18 displays a central signal void (due to a low quality index) in a large popliteal cyst, indicating the presence of fluid.
Figure 16a.
Tender palpable palmar mass at the level of the mid-metacarpals centered at the ulnar aspect of the second digit flexor tendons in an 18-year-old man, consistent with a pathologically proven fibroma of the tendon sheath. (a) Short-axis power Doppler US image of the palmar aspect of the hand in the region of the palpable lump shows a hypoechoic mass (arrows) with associated moderate hyperemia. (b) Color elastogram of the same region shows intermediate shear-wave velocities (mean, 5.93 m/sec) within the mass (arrows). (c) Axial T2-weighted fat-saturated MR image of the same hand shows a high-signal-intensity mass centered at the ulnar aspect of the second digit flexor tendons (arrow). SWE data were collected using an Acuson S3000 US scanner with an L9–4-MHz linear transducer.
Figure 17a.
Pathologically proven, painless, palpable, epidermoid inclusion cyst at the anterior aspect of the proximal tibia in an 18-year-old woman. (a) Long-axis gray-scale US image in the region of palpable abnormality shows a homogeneously hypoechoic circumscribed oval subcutaneous mass (arrow) with increased through transmission. (b) Color elastogram of the same region shows low shear-wave velocities (mean, 2.76 m/sec) within the mass (arrows). SWE data were collected using an Acuson S3000 US scanner with an L9–4-MHz linear transducer.
Figure 19a.
Enchondroma in a 13-year-old boy with Ollier disease and two large chondroid matrix lesions in the proximal humerus. The lesion at the anterior aspect of the humeral head was pathologically proven to be an enchondroma. (a) Axial contrast-enhanced T1-weighted fat-saturated MR image of the proximal humerus shows two heterogeneously enhancing chondroid matrix lesions at the anterior and posterior aspects of the humeral head (arrows). (b) Axial computed tomographic (CT) image of the same region obtained during biopsy of the anterior lesion shows two large expansile osteolytic lesions, centered at the anterior and posterior aspects of the humeral head, with inner sclerotic margins and subtle chondroid matrix in the anterior lesion (arrows). (c) Short-axis gray-scale US image at the anterior aspect of the humeral head (H) shows a heterogeneous relatively hypoechoic mass with multiple internal calcifications (arrows) and irregular margins with the underlying bone. (d) Color elastogram of the same region shows high shear-wave velocities (range, 9.21–15 m/sec or more) within the anterior humeral head (H) mass (arrows), indicating hard consistency. SWE data were collected using an Acuson S3000 US scanner with an L9–4-MHz linear transducer.
Figure 15a.
Intramuscular lipoma in the left upper back of a 55-year-old woman with spuriously high shear-wave velocities. (a) Long-axis gray-scale US image in the region of palpable abnormality shows a relatively hypoechoic subcutaneous soft-tissue mass consistent with a lipoma (arrows). (b) Color elastogram of the same region shows spuriously high shear-wave velocities within the mass (arrows), which were due to an incorrect highest velocity setting at only 6.5 m/sec. SWE data were collected using an Acuson S3000 US scanner with an L9–4-MHz linear transducer.
Conclusion
SWE is an exciting and rapidly evolving US technique that allows quantification of mechanical and elastic tissue properties. It can be used to complement conventional US in the initial characterization and posttreatment follow-up of various traumatic and pathologic conditions of the musculoskeletal system. This may be of great importance in early disease when an abnormality of the musculoskeletal soft tissues cannot be detected or characterized with conventional US methods. It may also prove useful for staging chronic diseases, determining therapeutic response, and monitoring age-related changes, including sarcopenia and clinical frailty syndrome. New methods in SWE, such as continuous-wave and 3D SWE, may add new information not provided by conventional two-dimensional SWE. Finally, future SWE studies that characterize musculoskeletal soft-tissue masses may reveal yet another application of this evolving technology, which offers much promise as an adjunct to conventional US.
R.S.W. supported by the National Institutes of Health. L.D.L. supported by the University of Arizona.
Presented as an education exhibit at the 2015 RSNA Annual Meeting.
For this journal-based SA-CME activity, the authors M.S.T., L.H.G., G.W.B., L.D.L., D.M.M., L.G., and R.S.W. have provided disclosures (see “Disclosures of Conflicts of Interest”); the other author, the editor, and the reviewers have disclosed no relevant relationships.
Disclosures of Conflicts of Interest.—: M.S.T., L.H.G., G.W.B., L.D.L., D.M.M., L.G., R.S.W. Activities related to the present article: Institution has a cooperative research agreement with Siemens Healthineers. Activities not related to the present article: disclosed no relevant relationships. Other activities: disclosed no relevant relationships.
Abbreviations:
- ROI
- region of interest
- SWE
- shear-wave elastography
References
- 1.Jacobson JA. Musculoskeletal ultrasound: focused impact on MRI. AJR Am J Roentgenol 2009;193(3):619–627. [DOI] [PubMed] [Google Scholar]
- 2.Klauser AS, Miyamoto H, Bellmann-Weiler R, Feuchtner GM, Wick MC, Jaschke WR. Sonoelastography: musculoskeletal applications. Radiology 2014;272(3):622–633. [DOI] [PubMed] [Google Scholar]
- 3.Drakonaki EE, Allen GM, Wilson DJ. Ultrasound elastography for musculoskeletal applications. Br J Radiol 2012;85(1019):1435–1445. [DOI] [PMC free article] [PubMed] [Google Scholar]
- 4.Gao L, Yuan JS, Heden GJ, et al. Ultrasound elasticity imaging for determining the mechanical properties of human posterior tibial tendon: a cadaveric study. IEEE Trans Biomed Eng 2015;62(4):1179–1184. [DOI] [PMC free article] [PubMed] [Google Scholar]
- 5.Arda K, Ciledag N, Aktas E, Aribas BK, Köse K. Quantitative assessment of normal soft-tissue elasticity using shear-wave ultrasound elastography. AJR Am J Roentgenol 2011;197(3):532–536. [DOI] [PubMed] [Google Scholar]
- 6.DeWall RJ, Slane LC, Lee KS, Thelen DG. Spatial variations in Achilles tendon shear wave speed. J Biomech 2014;47(11):2685–2692. [DOI] [PMC free article] [PubMed] [Google Scholar]
- 7.Aubry S, Nueffer JP, Tanter M, Becce F, Vidal C, Michel F. Viscoelasticity in Achilles tendonopathy: quantitative assessment by using real-time shear-wave elastography. Radiology 2015;274(3):821–829. [DOI] [PubMed] [Google Scholar]
- 8.Chen XM, Cui LG, He P, Shen WW, Qian YJ, Wang JR. Shear wave elastographic characterization of normal and torn Achilles tendons: a pilot study. J Ultrasound Med 2013;32(3):449–455. [DOI] [PubMed] [Google Scholar]
- 9.Siu WL, Chan CH, Lam CH, Lee CM, Ying M. Sonographic evaluation of the effect of long-term exercise on Achilles tendon stiffness using shear wave elastography. J Sci Med Sport 2016;19(11):883–887. [DOI] [PubMed] [Google Scholar]
- 10.Ruan Z, Zhao B, Qi H, et al. Elasticity of healthy Achilles tendon decreases with the increase of age as determined by acoustic radiation force impulse imaging. Int J Clin Exp Med 2015;8(1):1043–1050. [PMC free article] [PubMed] [Google Scholar]
- 11.Helfenstein-Didier C, Andrade RJ, Brum J, et al. In vivo quantification of the shear modulus of the human Achilles tendon during passive loading using shear wave dispersion analysis. Phys Med Biol 2016;61(6):2485–2496. [DOI] [PubMed] [Google Scholar]
- 12.Cortes DH, Suydam SM, Silbernagel KG, Buchanan TS, Elliott DM. Continuous shear wave elastography: a new method to measure viscoelastic properties of tendons in vivo. Ultrasound Med Biol 2015;41(6):1518–1529. [DOI] [PMC free article] [PubMed] [Google Scholar]
- 13.Suydam SM, Soulas EM, Elliott DM, Silbernagel KG, Buchanan TS, Cortes DH. Viscoelastic properties of healthy Achilles tendon are independent of isometric plantar flexion strength and cross-sectional area. J Orthop Res 2015;33(6):926–931. [DOI] [PMC free article] [PubMed] [Google Scholar]
- 14.Chino K, Takahashi H. The association of muscle and tendon elasticity with passive joint stiffness: in vivo measurements using ultrasound shear wave elastography. Clin Biomech (Bristol, Avon) 2015;30(10):1230–1235. [DOI] [PubMed] [Google Scholar]
- 15.Zhang ZJ, Ng GY, Lee WC, Fu SN. Changes in morphological and elastic properties of patellar tendon in athletes with unilateral patellar tendinopathy and their relationships with pain and functional disability. PLoS One 2014;9(10):e108337. [DOI] [PMC free article] [PubMed] [Google Scholar]
- 16.Hsiao MY, Chen YC, Lin CY, Chen WS, Wang TG. Reduced patellar tendon elasticity with aging: in vivo assessment by shear wave elastography. Ultrasound Med Biol 2015;41(11):2899–2905. [DOI] [PubMed] [Google Scholar]
- 17.Slane LC, Martin J, DeWall R, Thelen D, Lee K. Quantitative ultrasound mapping of regional variations in shear wave speeds of the aging Achilles tendon. Eur Radiol 2017;27(2):474–482. [DOI] [PMC free article] [PubMed] [Google Scholar]
- 18.Shinohara M, Sabra K, Gennisson JL, Fink M, Tanter M. Real-time visualization of muscle stiffness distribution with ultrasound shear wave imaging during muscle contraction. Muscle Nerve 2010;42(3):438–441. [DOI] [PubMed] [Google Scholar]
- 19.Wang CZ, Li TJ, Zheng YP. Shear modulus estimation on vastus intermedius of elderly and young females over the entire range of isometric contraction. PLoS One 2014;9(7):e101769. [DOI] [PMC free article] [PubMed] [Google Scholar]
- 20.Lacourpaille L, Hug F, Guével A, et al. Non-invasive assessment of muscle stiffness in patients with Duchenne muscular dystrophy. Muscle Nerve 2015;51(2):284–286. [DOI] [PubMed] [Google Scholar]
- 21.Brandenburg JE, Eby SF, Song P, et al. Feasibility and reliability of quantifying passive muscle stiffness in young children by using shear wave ultrasound elastography. J Ultrasound Med 2015;34(4):663–670. [DOI] [PMC free article] [PubMed] [Google Scholar]
- 22.Le Sant G, Ates F, Brasseur JL, Nordez A. Elastography study of hamstring behaviors during passive stretching. PLoS One 2015;10(9): e0139272. [DOI] [PMC free article] [PubMed] [Google Scholar]
- 23.Hirata K, Miyamoto-Mikami E, Kanehisa H, Miyamoto N. Muscle-specific acute changes in passive stiffness of human triceps surae after stretching. Eur J Appl Physiol 2016;116(5):911–918. [DOI] [PubMed] [Google Scholar]
- 24.Guilhem G, Doguet V, Hauraix H, et al. Muscle force loss and soreness subsequent to maximal eccentric contractions depend on the amount of fascicle strain in vivo. Acta Physiol (Oxf) 2016;217(2):152–163. [DOI] [PubMed] [Google Scholar]
- 25.Kuo WH, Jian DW, Wang TG, Wang YC. Neck muscle stiffness quantified by sonoelastography is correlated with body mass index and chronic neck pain symptoms. Ultrasound Med Biol 2013;39(8): 1356–1361. [DOI] [PubMed] [Google Scholar]
- 26.Carpenter EL, Lau HA, Kolodny EH, Adler RS. Skeletal muscle in healthy subjects versus those with GNE-related myopathy: evaluation with shear-wave US—a pilot study. Radiology 2015;277(2):546–554. [DOI] [PubMed] [Google Scholar]
- 27.Itoigawa Y, Sperling JW, Steinmann SP, et al. Feasibility assessment of shear wave elastography to rotator cuff muscle. Clin Anat 2015;28(2):213–218. [DOI] [PMC free article] [PubMed] [Google Scholar]
- 28.Rosskopf AB, Ehrmann C, Buck FM, Gerber C, Flück M, Pfirrmann CW. Quantitative shear-wave US elastography of the supraspinatus muscle: reliability of the method and relation to tendon integrity and muscle quality. Radiology 2016;278(2):465–474. [DOI] [PubMed] [Google Scholar]
- 29.Eby SF, Cloud BA, Brandenburg JE, et al. Shear wave elastography of passive skeletal muscle stiffness: influences of sex and age throughout adulthood. Clin Biomech (Bristol, Avon) 2015;30(1):22–27. [DOI] [PMC free article] [PubMed] [Google Scholar]
- 30.Kantarci F, Ustabasioglu FE, Delil S, et al. Median nerve stiffness measurement by shear wave elastography: a potential sonographic method in the diagnosis of carpal tunnel syndrome. Eur Radiol 2014; 24(2):434–440. [DOI] [PubMed] [Google Scholar]
- 31.Palmeri ML, Dahl JJ, MacLeod DB, Grant SA, Nightingale KR. On the feasibility of imaging peripheral nerves using acoustic radiation force impulse imaging. Ultrason Imaging 2009;31(3):172–182. [DOI] [PMC free article] [PubMed] [Google Scholar]
- 32.Andrade RJ, Nordez A, Hug F, et al. Non-invasive assessment of sciatic nerve stiffness during human ankle motion using ultrasound shear wave elastography. J Biomech 2016;49(3):326–331. [DOI] [PubMed] [Google Scholar]
- 33.Shen ZL, Vince DG, Li ZM. In vivo study of transverse carpal ligament stiffness using acoustic radiation force impulse (ARFI) imaging. PLoS One 2013;8(7):e68569. [DOI] [PMC free article] [PubMed] [Google Scholar]
- 34.Mhanna C, Marquardt TL, Li ZM. Adaptation of the transverse carpal ligament associated with repetitive hand use in pianists. PLoS One 2016;11(3): e0150174. [DOI] [PMC free article] [PubMed] [Google Scholar]
- 35.Wu CH, Chen WS, Wang TG. Elasticity of the coracohumeral ligament in patients with adhesive capsulitis of the shoulder. Radiology 2016;278(2):458–464. [DOI] [PubMed] [Google Scholar]
- 36.Taljanovic MS, Melville DM, Klauser AS, et al. Advances in lower extremity ultrasound. Curr Radiol Rep 2015;3(6):19. [Google Scholar]
- 37.Bercoff J, Tanter M, Fink M. Supersonic shear imaging: a new technique for soft tissue elasticity mapping. IEEE Trans Ultrason Ferroelectr Freq Control 2004;51(4):396–409. [DOI] [PubMed] [Google Scholar]
- 38.Li Y, Snedeker JG. Elastography: modality-specific approaches, clinical applications, and research horizons. Skeletal Radiol 2011;40(4): 389–397. [DOI] [PubMed] [Google Scholar]
- 39.Wells PN, Liang HD. Medical ultrasound: imaging of soft tissue strain and elasticity J R Soc Interface 2011;8(64):1521–1549. [DOI] [PMC free article] [PubMed] [Google Scholar]
- 40.Aubry S, Risson JR, Kastler A, et al. Biomechanical properties of the calcaneal tendon in vivo assessed by transient shear wave elastography. Skeletal Radiol 2013;42(8):1143–1150. [DOI] [PubMed] [Google Scholar]
- 41.Patte D. Classification of rotator cuff lesions. Clin Orthop Relat Res 1990;(254):81–86. [PubMed] [Google Scholar]
- 42.Goutallier D, Postel JM, Bernageau J, Lavau L, Voisin MC. Fatty muscle degeneration in cuff ruptures: pre- and postoperative evaluation by CT scan. Clin Orthop Relat Res 1994;(304):78–83. [PubMed] [Google Scholar]
- 43.Zanetti M, Gerber C, Hodler J. Quantitative assessment of the muscles of the rotator cuff with magnetic resonance imaging. Invest Radiol 1998;33(3):163–170. [DOI] [PubMed] [Google Scholar]
- 44.Tanter M, Bercoff J, Athanasiou A, et al. Quantitative assessment of breast lesion viscoelasticity: initial clinical results using supersonic shear imaging. Ultrasound Med Biol 2008;34(9):1373–1386. [DOI] [PubMed] [Google Scholar]
- 45.Athanasiou A, Tardivon A, Tanter M, et al. Breast lesions: quantitative elastography with supersonic shear imaging—preliminary results. Radiology 2010;256(1):297–303. [DOI] [PubMed] [Google Scholar]
- 46.Athanasiou A, Latorre-Ossa H, Criton A, Tardivon A, Gennisson JL, Tanter M. Feasibility of imaging and treatment monitoring of breast lesions with three-dimensional shear wave elastography. Ultraschall Med 2015 Mar 5. [Epub ahead of print] [DOI] [PubMed]
- 47.Duan SB, Yu J, Li X, Han ZY, Zhai HY, Liang P. Diagnostic value of two-dimensional shear wave elastography in papillary thyroid microcarcinoma. Onco Targets Ther 2016;9(9):1311–1317. [DOI] [PMC free article] [PubMed] [Google Scholar]
- 48.Park HS, Kim YJ, Yu MH, Jung SI, Jeon HJ. Shear wave elastography of focal liver lesion: intraobserver reproducibility and elasticity characterization. Ultrasound Q 2015;31(4):262–271. [DOI] [PubMed] [Google Scholar]
- 49.Zhang P, Zhou P, Tian SM, Qian Y, Deng J, Zhang L. Application of acoustic radiation force impulse imaging for the evaluation of focal liver lesion elasticity. Hepatobiliary Pancreat Dis Int 2013;12(2):165–170. [DOI] [PubMed] [Google Scholar]
- 50.Pass B, Jafari M, Rowbotham E, Hensor EM, Gupta H, Robinson P. Do quantitative and qualitative shear wave elastography have a role in evaluating musculoskeletal soft tissue masses? Eur Radiol 2017;27(2):723–731. [DOI] [PMC free article] [PubMed] [Google Scholar]
- 51.Pass B, Johnson M, Hensor EM, Gupta H, Robinson P. Sonoelastography of musculoskeletal soft tissue masses: a pilot study of quantitative evaluation. J Ultrasound Med 2016;35(10):2209–2216. [DOI] [PubMed] [Google Scholar]


