Abstract
Histotripsy is an ultrasound ablation method that depends on the initiation of a cavitation bubble cloud to fractionate soft tissue. Although previous work has provided significant insight into the process of intrinsic threshold histotripsy, the majority of these studies have used highly focused (i.e. f-number<0.6) transducers. In this study, we investigate the effects of f-number on the histotripsy intrinsic threshold and cavitation bubble cloud behavior using a 500 kHz array transducer, with the effective f-number of the transducer varied from 0.51 to 0.89. The intrinsic threshold did not significantly change with f-number, with the threshold remaining ~27–30 MPa for all conditions. The predictability of intrinsic threshold histotripsy was further demonstrated by experiments comparing the predicted and experimentally measured bubble cloud dimensions, with results showing close agreement for all f-numbers. Finally, the effects of f-number on “bubble density” and tissue fractionation efficiency were investigated, with results supporting the hypothesis that the density of the bubbles within the bubble cloud significantly decreases at higher f-numbers, resulting in decreased fractionation efficiency. Overall, this study provides significant insight into the effects of f-number on intrinsic threshold histotripsy that will help to guide the development of intrinsic threshold histotripsy for specific clinical applications.
Keywords: Histotripsy, F-Number, Cavitation, Intrinsic Threshold, Bubble Behavior
Introduction
Histotripsy is a noninvasive tissue ablation method that controllably fractionates soft tissue through cavitation generated by high pressure (>10 MPa), short duration (<20μs) ultrasound pulses at low duty cycles (<1 %) (Parsons et al., 2006a; Roberts et al., 2006; Xu et al., 2004). Histotripsy depends on the initiation and maintenance of a cavitation bubble cloud to produce mechanical tissue fractionation (Parsons et al., 2006a; Xu et al., 2005; Xu et al., 2004). With sufficiently high pressure and dose, histotripsy can completely fractionate soft tissues into an acellular liquid homogenate by inducing very large strains to the adjacent tissue structures (Parsons et al., 2006a; Vlaisavljevich et al., 2014a; Xu et al., 2005; Vlaisavljevich et al., 2016d). Histotripsy is currently being studied for many clinical applications where noninvasive tissue removal is desired including benign prostatic hyperplasia (Hempel et al., 2011; Roberts et al., 2014), kidney stones (Duryea et al., 2011), deep vein thrombosis (Maxwell et al., 2011a; Zhang et al., 2015), congenital heart disease(Owens et al., 2011; Xu et al., 2010), and cancer (Styn et al., 2010; Vlaisavljevich et al., 2016c; Vlaisavljevich et al., 2013b).
Histotripsy bubble clouds can be generated by three mechanisms, termed shock scattering histotripsy, boiling histotripsy, and intrinsic threshold histotripsy. In shock scattering histotripsy, a multi-cycle histotripsy pulse (~3–20 cycles) at high pressure (p- = 10–28 MPa) is used to form a bubble cloud through shock scattering from single or sparse initial bubbles expanded during the initial cycles of the pulse (Maxwell et al., 2010a; Maxwell et al., 2011b; Vlaisavljevich et al., 2014b). In boiling histotripsy, much longer pulses (>5,000 cycles) at moderate intensity (p- = 8–14 MPa) are used to generate a histotripsy bubble cloud through shock wave induced boiling (Simon et al., 2012; Wang et al., 2013). In intrinsic threshold histotripsy, a single pulse (≤2 cycles) with a single dominant negative pressure phase at very high pressure is used to form a bubble cloud directly from the negative pressure of the incident wave (Lin et al., 2014; Maxwell et al., 2013; Vlaisavljevich et al., 2015b). Using the short pulses for intrinsic threshold histotripsy, cavitation initiation depends on the amplitude and duration of the applied negative pressure as well as the properties of the media (Vlaisavljevich et al., 2015a; Vlaisavljevich et al., 2016a; Vlaisavljevich et al., 2016b; Vlaisavljevich et al., 2015b; Maxwell et al., 2013; Vlaisavljevich et al., 2013a). Previous work has measured the intrinsic threshold of water-based soft tissues and tissue phantoms to be ~25–30 MPa at ultrasound frequencies ranging from 345 kHz to 3 MHz (Maxwell et al., 2013; Vlaisavljevich et al., 2015b). When the peak negative pressure exceeds this intrinsic threshold, it results in a bubble cloud matching the portion of the focal region above the intrinsic threshold, allowing for precise control of the size of the resulting histotripsy lesion (Lin et al., 2014; Vlaisavljevich et al., 2015b; Vlaisavljevich et al., 2015c; Zhang et al., 2015). However, although the size of the bubble cloud increases at higher pressure, individual bubbles throughout the cloud appear to be of uniform size, approximately matching the size of bubbles formed directly above the intrinsic threshold, likely due to a process of bubble-induced pressure saturation which occurs as each bubble is generated (Vlaisavljevich et al., 2015c).
Although previous work has provided significant insight into the process of generating cavitation using the intrinsic threshold method, the majority of these studies have used highly focused (i.e. f-number<0.6) transducers. Understanding the effects of f-number on the histotripsy intrinsic threshold and cavitation bubble cloud behavior is essential to the development of histotripsy for different clinical applications. While the intrinsic threshold is not expected to significantly change with f-number, we hypothesize that the size and shape of the bubble clouds will match the size and shape of the focal zone exceeding the intrinsic threshold, which are expected to change with f-number. Based on the process of bubble-induced pressure saturation described in our previous study (Vlaisavljevich et al., 2015c), we further hypothesize that lower f-numbers will generate denser bubble clouds (i.e. greater number of bubbles per area) than higher f-numbers and that the size of the individual bubbles within the cloud will remain uniform. Finally, we hypothesize that lower f-numbers will be more efficient at fractionating tissue than higher f-numbers due to the aforementioned decrease in bubble density at higher f-number.
To test these hypotheses, this work investigates the effects of f-number on the histotripsy intrinsic threshold and cavitation bubble cloud behavior using a 235-element 500 kHz array transducer, with the effective f-number of the transducer varied by changing the active elements in the array. Using this single array transducer, we are able to investigate the effects of f-number without changing any other properties (i.e. acoustic frequency, element type, element spacing, transducer design/construction, etc.), which allows for the effects of f-number to be investigated in a well-controlled study. The effective f-number of the transducer was varied from 0.51 to 0.89 for cavitation experiments, and the resulting cavitation activity was monitored using passive cavitation detection and high speed optical imaging. This f-number range was chosen to cover the general range for histotripsy transducers currently being developed for clinical applications using intrinsic threshold histotripsy. While f-numbers>0.89 were not investigated due to lack of pressure output (i.e. intrinsic threshold couldn’t be reached), the trends observed in this study are expected to be representative of the entire range of f-numbers that may be used in histotripsy. Overall, the results of this study will provide significant insight into the effects of f-number on intrinsic threshold histotripsy and will be essential to guide the design of histotripsy transducers for specific clinical applications.
Methods
Sample Preparation
Agarose phantoms were used to provide a well-controlled viscoelastic medium for this study. Tissue phantoms containing 1% agarose w/v were prepared by slowly mixing agarose powder (Agarose Type VII, Sigma-Aldrich, St. Louis, MO, USA) into a saline solution (0.9% sodium chloride, Hospira, Lake Forest, Illinois, USA) heated to above 70°C while stirring until the gel became completely transparent. Agarose solutions were degassed under a partial vacuum (~20 kPa, absolute) for 30 minutes before the agarose mixtures were poured into rectangular polycarbonate holders and placed in a refrigerator at 4°C to allow the solution to solidify. The acoustic and mechanical properties of the agarose tissue phantom have been characterized in our previous work (Maxwell et al., 2010b, Vlaisavljevich et al., 2015c), with the results closely matching those seen in tissue. For example, the Young’s modulus of the 1% agarose tissue phantom has previously been measured to be 21.7 kPa (Vlaisavljevich et al., 2015c), which is close to the Young’s moduli of soft tissues such as liver, kidney, heart, muscle, skin, and tongue which range from ~6–25 kPa (Duck, 1990; Yamada, 1973).
For cell fractionation experiments, tissue phantoms with a red blood cell (RBC) layer were prepared using bovine RBCs in a 0.9% isotonic saline and 1% agarose solution (Maxwell et al., 2010b). Fresh bovine blood was obtained from a local slaughter house and added to an anticoagulant solution of citratephosphate-dextrose (CPD) (Sigma-Aldrich Co., St. Louis, MO, USA) with a CPD-to-blood ratio of 1:9 mL. Whole blood was separated in a centrifuge at 3000 rpm for 10 min. The plasma and white buffy coat were removed, and the RBCs were saved for addition to the phantom. To prepare the RBC phantom, an initial layer of 1% agarose mixture was poured into a rectangular polycarbonate housing to fill half of it at 37°C. The housing was placed in a refrigerator at 4°C to allow the agarose to cool and solidify. The remaining solution was kept at 37°C. A small amount of agarose solution was mixed with the RBCs (5% RBCs v/v). The frame with solidified agarose was removed from refrigeration, and a thin layer of the RBC-agarose solution was poured onto the gel surface to allow the entire surface to coat in a thin layer. After 5 min, the RBC-agarose layer was solidified, and the remaining agarose solution without RBCs was poured to completely fill the frame. This procedure created a thin layer of RBCs suspended in the center of the agarose phantom.
Ultrasound Pulse Generation
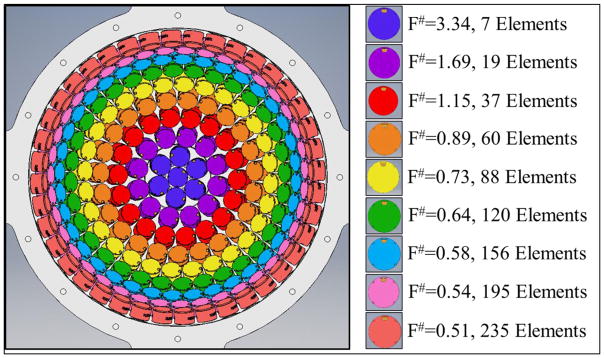
Histotripsy pulses were generated using a 235 element, 500 kHz hemispherical array transducer submerged inside of a water tank filled with degassed water at room temperature. The array transducer had a total aperture diameter of 30 cm and a focal distance of 15 cm. The transducer elements populating the array were 20 mm diameter flat, stacked piezo ceramic discs with center frequencies of 500 kHz. The transducer was constructed in our lab using a 3D rapid prototyping method as described in a previous study (Kim et al., 2014). The elements were driven using a custom 235-channel high-voltage pulser developed in-house, capable of delivering short (≤2 acoustic cycles) high amplitude ultrasound pulses during treatment. The high-voltage pulser was controlled using a custom digital pulse generator which allowed for the independent triggering of each channel of the array. For cavitation experiments, the effective f-number was varied from 0.51–0.89 by changing the active rings in the array as shown in Figure 1. The f-numbers higher than 0.89 shown in Figure 1 (i.e. 1.15–3.34) were not used for cavitation experiments due to the inability to generate high enough pressures. However, these higher f-numbers were used for pressure calibration comparisons as discussed in the next section.
Figure 1. 235-element 500 kHz Array Transducer.
F-number was varied by changing the active rings in the 235 element histotripsy array transducer. For cavitation experiments, the f-number was varied from 0.51–0.89.
Focal Pressure Calibration
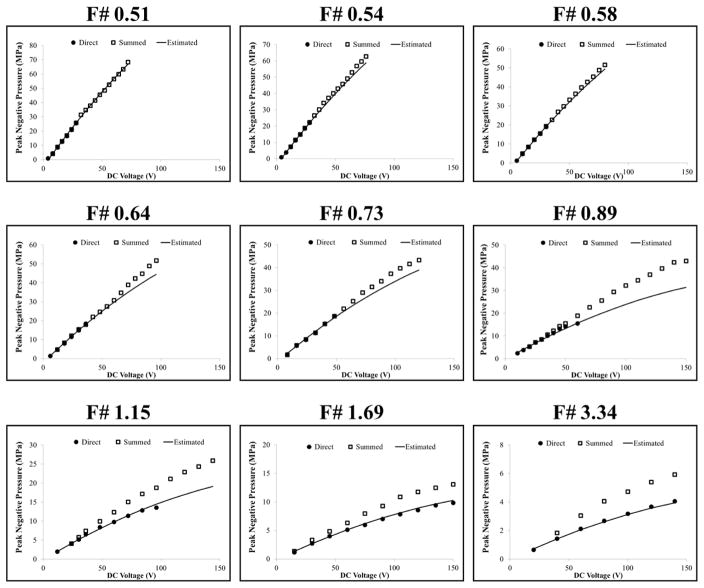
The acoustic output pressure at the focus of the transducer for each f-number condition was measured in degassed water using a fiber optic probe hydrophone (FOPH) built in-house (Parsons et al., 2006b). At peak negative pressures higher than ~17 MPa, the acoustic output couldn’t be directly measured due to cavitation generation at the fiber tip. The higher pressures were estimated using two methods. First, the transducer was split into four sub-apertures (i.e. four quadrants), and the pressures generated by the entire array were estimated by a summation of the pressures from the four sub-aperture measurements. Figure 2 shows example summed acoustic waveforms for the f-numbers used in the cavitation experiments at summed peak negative pressures, pSUM, of ~25 MPa. As the f-number was increased, the ratio of peak positive pressure to peak negative pressure was observed to increase due to nonlinear propagation effects, resulting in more shocked waveforms at higher f-numbers (Fig. 2). The peak negative pressure as a function of driving voltage for each f-number was compared for the direct pressure measurements (all elements), pDIR, and the summed sub-aperture pressure measurements, pSUM, with results shown in Figure 3. At higher driving voltages, pSUM significantly overestimated the pressure compared to pDIR, with these effects being most evident for the highest f-number conditions where pDIR could be measured even at the highest driving voltages (Fig. 3). The overestimation of pSUM at higher driving voltages suggests that the summation approach did not accurately measure the acoustic pressure, likely due to the inability of the summation approach to capture for the effects of nonlinear propagation. As a result, a second pressure estimation method was used to account for the effects of nonlinear propagation, pEST. In this approach, a polynomial trend line was fit to the pDIR data points measured at an f-number of 1.69. This trend line was then rescaled using a simple multiplicative scalar for all other f-numbers to account for the different number of elements used in each condition (Fig. 1), with results showing close agreement between pEST and pDIR measurements at all f-numbers (Fig. 3). This pressure estimation method was further validated by the cavitation experiments which showed close agreement between the predicted and measured results when using pEST. All reported pressure values used in cavitation experiments were taken using pEST.
Figure 2. Acoustic Waveforms.
Example summed acoustic waveforms produced by the 500 kHz histotripsy transducer for f-numbers ranging from 0.51 to 0.89 at summed peak negative pressures, pSUM, of ~25 MPa.
Figure 3. Pressure Calibration Comparison.
Plots show comparison of the acoustic pressures measured for each f-number as a function of driving voltage for direct pressure measurements (pDIR), summed sub-aperture pressure measurements (pSUM), and the estimated pressure levels predicted to account for the effects of nonlinear propagation (pEST). Pressure values reported for cavitation experiments were taken using pEST.
Cavitation Detection using Optical Imaging
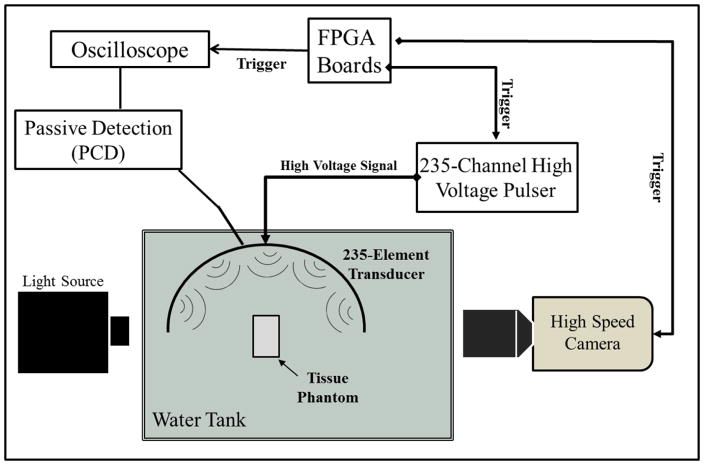
High speed optical imaging was used as a method to detect and visualize the cavitation bubble cloud for cavitation threshold experiments and bubble cloud comparison experiments (Fig. 4). A high-speed, 1 megapixel CCD camera (Phantom V210, Vision Research, Wayne, NJ, USA) was aligned with the transducer focus through an optical window in the side of the transducer. The camera was backlit by a continuous white-light source. The camera was focused using a macro-bellows lens (Tominon 1:4.5, F=105 mm; Kyocera, Kyoto, Japan), giving the captured images a resolution of approximately 8.9 μm per pixel. The camera was triggered to record one image for each applied pulse, at a time point 10 μs after the pulse reached the focal center. This time delay was chosen to allow for the pressure pulse to pass over the entire focal zone and allow any cavitation bubbles to be formed prior to capturing the image without interference from the Schlieren effect caused by histotripsy pulse passing through the focal region. The camera exposure time was 5 μs for each recorded image. After acquisition, shadowgraph images were converted from grayscale to binary by an intensity threshold determined by the background intensity using image processing software (MATLAB; The Mathworks, Natick, MA, USA). Bubbles were indicated as any black regions >5 pixels. For threshold experiments, the number of frames that contained cavitation bubbles was recorded, and the fraction of total frames (out of 100) for which any cavitation was detected was determined as the cavitation probability.
Figure 4. General Experimental Setup Schematic.
Histotripsy pulses were applied to tissue phantoms using 500 kHz histotripsy transducer. Cavitation was monitored using high speed optical imaging and passive cavitation detection using one of the therapy transducer elements.
Passive Cavitation Detection (PCD)
In addition to high-speed imaging, an acoustic method was also used to identify cavitation in the focal zone for threshold experiments, following a previously established method (Maxwell et al., 2013; Vlaisavljevich et al., 2015b). Since relying upon an image of the bubbles taken at a single time point is a limitation, the PCD method allowed cavitation to be monitored over a much longer time period following the passage of the pulse. For each experiment, one of the transducer’s therapy elements was also used to receive acoustic emission signals for PCD to detect the presence of cavitation in the focal region (Fig. 4). The surface area of the element used for PCD was 3.14 cm2. The PCD signal was connected to an oscilloscope (LT372; Lecroy, Chestnut Ridge, NY, USA) with the time window selected to record the backscattering of the therapy pulse from cavitation bubbles, which corresponded to approximately two times the time of flight for the focal length of the transducer. The PCD acquisition lasted for 100 μs to allow for the detection of the backscatter signal of the therapy pulse from the cavitation bubbles. To determine whether cavitation occurred during a pulse, the signal generated by backscattering of the incident pulse from the focus was analyzed following the method used in a previous study, with the integrated frequency power spectrum (SPCD) of the backscatter signal used as a measure of whether cavitation occurred (Maxwell et al., 2013). This method allowed a quantitative definition of whether a signal was above the threshold for cavitation, based on a comparison with baseline signals measured at low pressure amplitudes where cavitation did not occur.
Intrinsic Threshold Calculation and Comparison
To compare the effects of f-number on the histotripsy intrinsic threshold, histotripsy pulses with a single dominant negative pressure phase (Fig. 2) were applied to agarose tissue phantoms (1% w/v) placed at the geometric focus of the 235-element array transducer. Histotripsy pulses were applied at a pulse repetition frequency (PRF) of 0.5 Hz. The PRF was kept low to minimize the possibility that cavitation from one pulse would change the probability of cavitation on a subsequent pulse (Maxwell et al., 2013). In addition, the focus was translated for each pulse by 1 mm transverse to the acoustic propagation direction in a 10 × 10 grid for each pressure level in order to minimize the effects of cavitation damage to the solid sample altering the probability of cavitation. At each pressure level tested, 100 pulses were applied to the sample for each set of experiments.
The probability of observing cavitation, Pcav, followed a sigmoid function, given by
| (E1) |
where erf is the error function, pHIT is the negative pressure at which Pcav=0.5, σ is a variable related to the width of the transition between Pcav=0 and Pcav=1, with ± σ giving the difference in pressure from about Pcav=0.15 to Pcav=0.85 for the fit. The intrinsic threshold for each condition, PHIT, is defined as the p- corresponding to Pcav=0.5 as calculated by the curve fit. Curve fitting for all data sets was performed using an OriginLab curve fitting program (OriginPro 9.1; OriginLab Corporation, Northampton, MA, USA). The fit curves for all conditions were analyzed statistically to determine whether the differences in the values of pHIT were significantly different from each other. The standard errors for pHIT were estimated by a covariance matrix using the delta method (Hosmer and Lemeshow, 1992). The curves were compared using a two-sample t-test with statistic at a 95% confidence interval. Results were considered statistically significant for p<0.05. Note that the standard error does not include the uncertainty in absolute pressure from the hydrophone measurement or the calibration estimates, only the uncertainty in the fit.
Bubble Cloud Density and Bubble Size Comparison
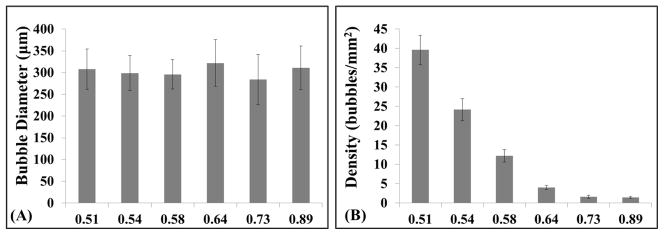
The effect f-number on the “bubble density” and individual bubble size were compared for bubble clouds generated by f-numbers of 0.51, 0.54, 0.58, 0.64, 0.73, and 0.89 using optical images of the bubble clouds taken by the high-speed CCD camera. The diameter of individual bubbles generated by each f-number was measured for each condition at a pressure level directly above the intrinsic threshold and a time delay of 10 μs after the pulse reached the focal center, which allowed for better measuring of individual bubble size. It should be noted that the 10 μs time delay does not correspond to maximum bubble radius, but is rather a relative comparison between bubble size for all f-number conditions at a set time point after the pulse arrival. The effect of f-number on “bubble density” inside the bubble cloud was compared by measuring the number of bubbles per unit area inside bubble clouds generated using different f-numbers. It is worth noting that it became more difficult to identify individual bubbles inside the bubble clouds formed at lower f-numbers due to the extremely high “bubble density” in these cases, so it is possible that these measures may underestimate the actual bubble density in these cases. For both bubble size and “bubble density” comparisons, a sample size of 10 was used for each condition. Results were plotted as the average ± standard deviation and compared using a Student’s t-test with a Bonferroni correction. P-values<0.05 were considered statistically significant.
Bubble Cloud Dimensions: Predicted vs. Measured
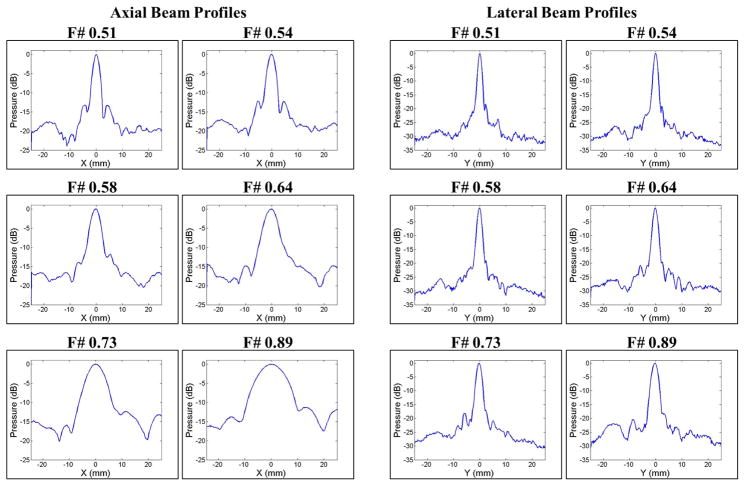
The expected bubble cloud size was predicted for each f-number condition using the 1D beam profiles and experimentally measured intrinsic thresholds, pHIT. The 1D beam profiles for each f-number were measured using a high-sensitivity bullet hydrophone (Model HGL-200, Onda Corp., Sunnyvale, CA, USA). The 1D beam profiles in in the lateral, elevational, and axial directions were measured by scanning the hydrophone over a range of 50 mm with steps of 0.25 mm. For a given f-number, the voltage of the array was chosen such that the peak negative focal pressure was approximately 1 MPa. Figure 5 shows the axial and lateral 1D beam profiles for each f-number used in the cavitation experiments. The 1D beam profiles for the elevational direction (not shown) were similar to those shown for the lateral direction. In all directions, a significant increase in the -6dB beamwidths was observed with increasing f-number (Fig. 5). For example, the -6dB beamwidths in the lateral direction were 1.55 mm, 1.80 mm, 1.95 mm, 2.20 mm, 2.45 mm, and 2.95 mm for f-numbers of 0.51, 0.54, 0.58, 0.64, 0.73, and 0.89, respectively. Similarly, the -6dB beamwidths in the axial direction were 3.3 mm, 4.15 mm, 5.05 mm, 6.75 mm, 10.1 mm, and 15.0 mm for f-numbers of 0.51, 0.54, 0.58, 0.64, 0.73, and 0.89, respectively
Figure 5. 1D Beam Profiles.
Axial (left) and lateral (right) 1D beam profiles for each f-number used in cavitation experiments. Results showed a significant increase in the -6dB beamwidths with increasing f-number.
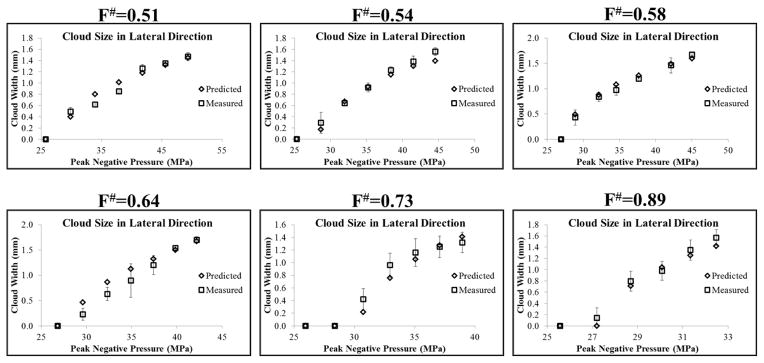
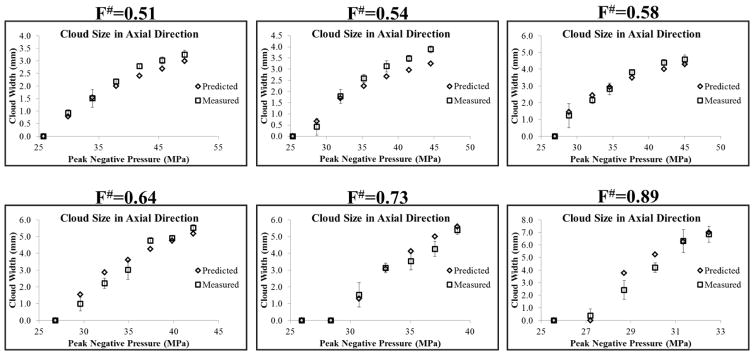
To predict the bubble cloud size for each set of experimental parameters (i.e. f-number, pEST), the 1D beam profiles were normalized to the peak pressure at the focus (Fig. 6A) and an estimated beam profile was then obtained by multiplying the normalized 1D beam profile with the pEST (Fig. 6B). The estimated beam profile was used to predict the expected bubble cloud size using the intrinsic threshold, pHIT, measured experimentally for each f-number (Fig. 6C), with the region above pHIT recorded as the predicted cloud size. The predicted bubble cloud size was calculated in the axial and lateral directions for all experimental conditions and compared to the cloud dimensions measured experimentally using optical imaging. A sample size of 10 bubble clouds was used to measure the cloud dimensions in the axial and lateral directions for each set of experimental conditions, with the results reported as the average ± the standard deviation.
Figure 6. Cloud Size Prediction.
Bubble cloud size was predicted using the 1D beam profiles. (A) The 1D beam profile was normalized to the pressure at the focus. (B) An estimated beam profile was then obtained by multiplying the normalized beam profile with the pEST for a given set of experimental conditions. (C) The cloud size was predicted using the intrinsic threshold, pHIT, measured experimentally for each f-number, with the region above pHIT recorded as the predicted cloud size.
RBC Phantom Ablation
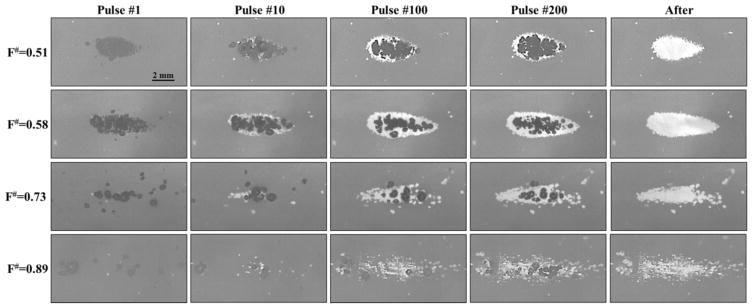
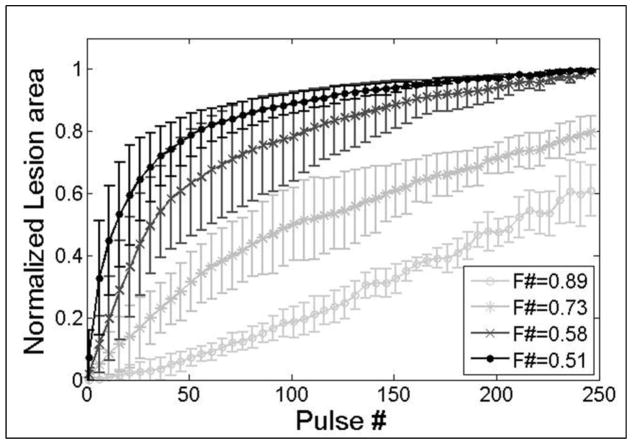
Agarose gel phantoms with an embedded RBC layer were used to characterize cell fractionation induced by histotripsy for various f-number conditions. Fractionation of the RBCs turns the color of the embedded cell layer from opaque red to translucent as the RBCs are lysed, which allows direct visualization of the histotripsy-induced fractionation process (Maxwell et al., 2010b; Lin et al., 2014; Vlaisavljevich et al., 2016a; Vlaisavljevich et al., 2013a; Wang et al., 2012). Previous studies have also shown that the lesion visualized in RBC phantoms is similar to the lesion generated in tissue identified by histology (Maxwell et al., 2010b; Lin et al., 2014; Wang et al., 2012). The focus of the 500 kHz array transducer was aligned with the center of the red blood cell phantom layer and 250 histotripsy pulses were applied at a PRF of 0.5 Hz. The bubble cloud and resulting cell fractionation were recorded by high-speed optical imaging after each pulse (Figure 4). The high-speed camera was focused to the red blood cell layer and backlit by a continuous light source. The camera was triggered to record two images for each applied pulse, one 10 μs after the pulse reached the focus to visualize the bubble activity and another frame between pulses, 1 s after each pulse, to assess tissue damage. The camera exposure time was 20 μs. The bubbles appeared as black regions in the shadowgraphic image and RBC fractionation was visualized as RBCs turn transparent after fractionation. RBC fraction was compared between phantoms treated using f-numbers of 0.51, 0.58, 0.73, and 0.89. Shadowgraph images were converted from grayscale to binary by an intensity threshold using image processing software (MATLAB; The Mathworks, Natick, MA, USA) and the lesion area after each pulse was calculated by summing the pixels within the fractionated region. The lesion area was further normalized to the total area of the treatment zone (i.e. total bubble cloud area measured in the previous section), resulting in the normalized lesion area. For each experimental condition, the normalized lesion area was plotted as a function of pulse number. A sample size of 4 tissue phantoms was used for each condition, with results plotted as the average ± standard deviation.
Results
Intrinsic Threshold vs. F-Number
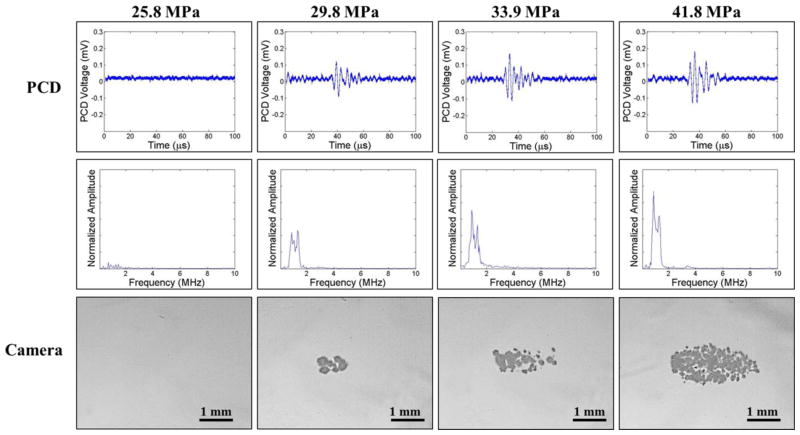
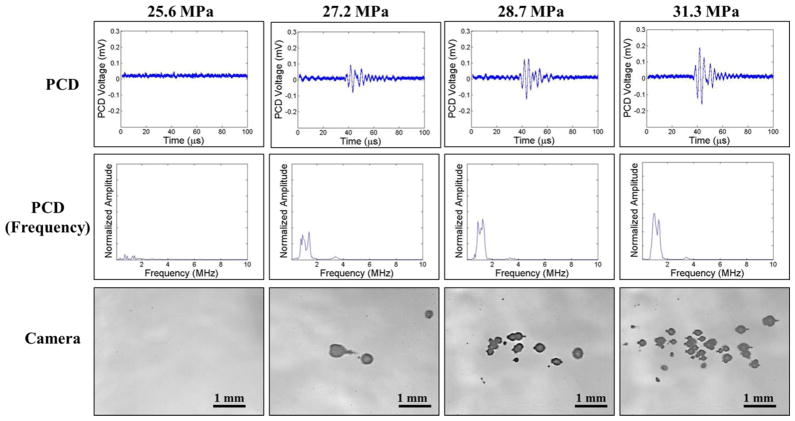
The intrinsic threshold was compared for six f-numbers ranging from 0.51–0.89. For each experimental condition, cavitation bubbles were observed on the high-speed camera when a certain negative pressure was exceeded (Fig. 7, Fig. 8). As the pressure was further increased, the bubbles were visualized in an increasingly larger area with a greater number of bubbles present in the focal region (Fig. 7, Fig. 8), similar to the behavior of intrinsic threshold bubble clouds observed in previously studies (Lin et al., 2014; Maxwell et al., 2013; Vlaisavljevich et al., 2015b; Vlaisavljevich et al., 2015c). In addition to high speed imaging, cavitation was also monitored using one of the therapy transducer elements for PCD following a previously established method, with results showing close agreement between optical imaging and PCD detection methods. For example, Figures 7 and 8 show example optical images and PCD signals taken for f-numbers of 0.51 and 0.89, respectively. When cavitation occurred on high-speed images, the PCD signal was a multi-cycle burst of significantly increased amplitude with a center frequency near the therapy transducer frequency. When no cavitation was observed on the camera, the PCD signal amplitude was small.
Figure 7. Cavitation Detection: f-number=0.51.
Images show sample PCD and optical imaging results for pulses applied using an f-number of 0.51 at pEST ranging from 25.8MPa to 41.8 MPa. PCD temporal (top) and frequency (middle) signals showed good agreement with high speed optical images of cavitation (bottom).
Figure 8. Cavitation Detection: f-number=0.89.
Images show sample PCD and optical imaging results for pulses applied using an f-number of 0.89 at pEST ranging from 25.6 MPa to 31.3 MPa. PCD temporal (top) and frequency (middle) signals showed good agreement with high speed optical images of cavitation (bottom).
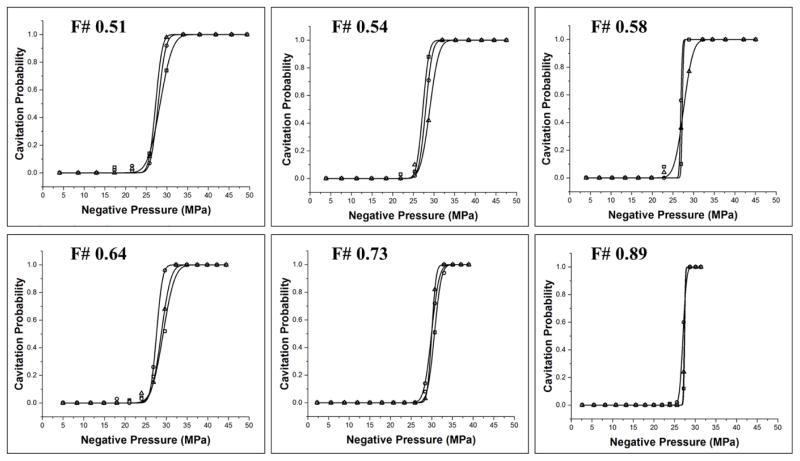
The intrinsic threshold, pHIT, for all experimental conditions was compared using the curve fitting method and statistical analysis described above. Comparing the effect of f-number on pHIT demonstrated a similar function of cavitation probability versus pressure for conditions, with no noticeable trend in pHIT observed with increasing f-number (Fig. 9). The full cavitation threshold results are shown in Table 1. The pHIT measured for all conditions ranged from 27.2±0.3 MPa (f-number: 0.58) to 30.2±0.4 MPa (f-number: 0.73). Statistical analysis showed no significant differences in pHIT at different f-numbers (p>0.05), with the exception being the pHIT for an f-number of 0.73, which was significantly higher (p<0.05) than the pHIT measured at all other f-numbers. It is also worth noting that that distinct threshold behavior was observed for all experimental conditions, with no noticeable trend in σmean observed with increasing f-number. The values of σmean ranged from 0.4–1.8 (Table 1).
Figure 9. Cavitation threshold curves.
Probability curves (n=3) for all f-numbers. Results show distinct threshold behavior for all conditions with no noticeable trends in pHIT observed with increasing f-number.
Table 1. Threshold Results.
Table shows the values for the histotripsy intrinsic threshold, pHIT, calculated by the fitted curves for each sample, as well as the mean values for pHIT and σ. All values are pressure in MPa.
| F-Number | PHIT (1) | PHIT (2) | PHIT (3) | PHIT (mean) | σ (mean) |
|---|---|---|---|---|---|
| 0.51 | 28.34 | 28.87 | 27.26 | 28.2 | 1.7 |
| 0.54 | 27.29 | 27.97 | 28.95 | 28.1 | 1.4 |
| 0.58 | 27.25 | 26.89 | 27.56 | 27.2 | 0.8 |
| 0.64 | 29.18 | 27.60 | 28.73 | 28.5 | 1.8 |
| 0.73 | 30.64 | 29.92 | 29.96 | 30.2 | 1.2 |
| 0.89 | 27.43 | 27.02 | 27.35 | 27.3 | 0.4 |
Bubble Cloud Density and Bubble Size
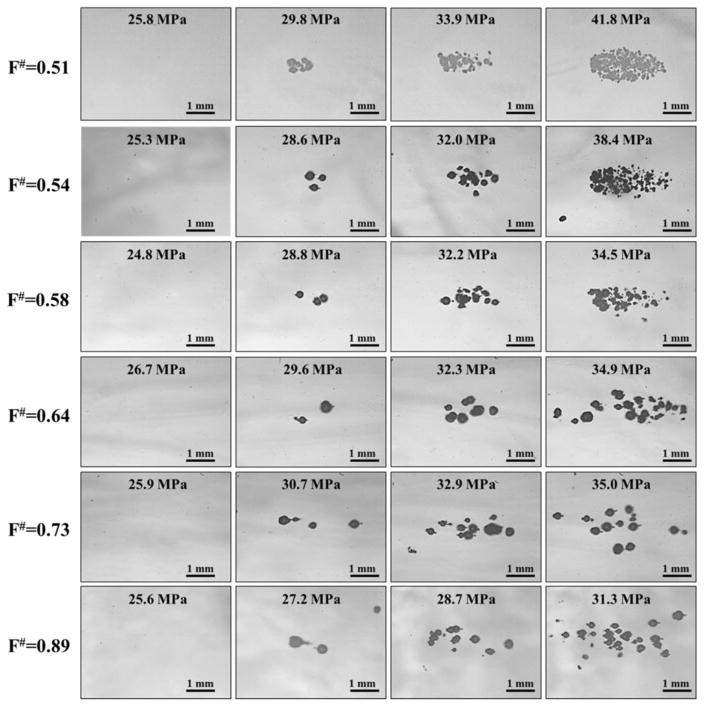
For all f-numbers, cavitation bubble clouds were only observed at pressures near and above the histotripsy intrinsic threshold, pHIT, with no cavitation clouds observed at lower amplitudes (Fig. 10). Quantifying the size of individual bubbles formed directly above the intrinsic threshold at different f-numbers (i.e. second column in Figure 10) showed no significant change (p>0.05) in bubble size with f-number (Fig. 11A), with the average bubble diameter measured to be 308±46 μm, 299±40 μm, 296±34 μm, 322±54 μm, 284±58 μm, and 311±50 μm for f-numbers of 0.51, 0.54, 0.58, 0.64, 0.73, and 0.89, respectively. As pEST was increased above pHIT for a given f-number, bubble clouds were visualized in an increasingly larger area with a greater number of bubbles present in the focal region, similar to previous studies (Maxwell et al., 2013; Vlaisavljevich et al., 2015b; Vlaisavljevich et al., 2015c). Comparing the appearance of bubble clouds formed at different f-numbers showed a significant reduction in the “bubble density” within the cloud (i.e. number of bubbles within a given area) for higher f-numbers (Fig. 10). At the lowest f-numbers, dense bubble clouds with highly demarcated boundaries were generated (Fig. 10, top rows). In comparison, more diffuse bubble clouds with less demarcated boundaries were observed at the highest f-numbers (Fig. 10, bottom rows). Quantifying the “bubble density” observed at different f-numbers showed a significant decrease in “bubble density” with increasing f-number (Fig. 11B), with the densities measured to be 39.6±3.8 bubbles/mm2, 24.2±2.9 bubbles/mm2, 12.2±1.6 bubbles/mm2, 4.0±0.6 bubbles/mm2, 1.6±0.4 bubbles/mm2, and 1.5±0.3 bubbles/mm2 for f-numbers of 0.51, 0.54, 0.58, 0.64, 0.73, and 0.89, respectively. All differences in “bubble density” between f-numbers were significant (P<0.05) except the difference between f-numbers of 0.73 and 0.89 (p=0.18). The finding that higher f-numbers result in bubble clouds with a lower “bubble density” supports our hypothesis and is likely explained by the process of bubble-induced pressure saturation involved in intrinsic threshold histotripsy nucleation (Vlaisavljevich et al., 2015c), which predicts that denser bubble clouds are formed at lower f-numbers due to the higher rate of pressure increase in the focal region (Fig. 5). This explanation is further supported by the observation that the differences in the “bubble density” at different f-numbers appeared to be most significant in the axial direction, with the bubble cloud being more spread out (i.e. less dense) in the axial direction compared to the lateral direction (Fig. 10), as would be expected based on the 1D beam profiles (Fig. 5).
Figure 10. Bubble Cloud Optical Images: All f-numbers.
Images show representative bubble clouds generated at all f-numbers for selective pEST.
Figure 11. Bubble size and “bubble density” comparisons.
(A) Comparisons individual bubble diameter measured directly above pHIT for each f-number showed no significant difference in bubble size. (B) Comparing the “bubble density” within bubble clouds generated with various f-numbers showed a significant decrease in “bubble density” with increasing f-number.
Bubble Cloud Size: Predicted vs. Measured
To test the hypothesis that intrinsic threshold histotripsy bubble clouds are formed matching the region of the focus above the intrinsic threshold, pHIT, the bubble cloud size in the axial and lateral directions was predicted for each f-number using the 1D axial beam profiles (Fig. 5) and the pHIT measured at different f-numbers (Table 1), as described in the Methods and shown in Figure 6. For all f-numbers, the predicted bubble cloud size in the lateral (Fig. 12) and axial (Fig. 13) directions increased with increasing pEST, matching experimental trends which showed larger bubble clouds generated with increasing pEST (Fig. 10). A quantitative comparison of the predicted and measured bubble cloud sizes showed close agreement in both the lateral (Fig. 12) and axial (Fig. 13) directions for all f-numbers, supporting the hypothesis that intrinsic threshold bubble clouds are formed matching the region of the focus above the intrinsic threshold. For the majority of cases, the average bubble cloud size measured in experiments deviated from predicted bubble cloud size by <25%, with the exceptions to this primarily occurring for bubble clouds generated close to pHIT where the size of the individual bubbles was large compared to the size of the focal region above the intrinsic threshold. It is worth noting that the standard deviations in the bubble cloud sizes measured experimentally were larger at higher f-numbers compared to the lower f-numbers which more reproducibly generated well-defined bubble clouds with sharply demarcated boundaries that matched the entire region above the intrinsic threshold.
Figure 12. Predicted vs. Measured Cloud Size: Lateral Direction.
Plots show the bubble cloud size in the lateral direction compared with the predicted bubble cloud size measured using the 1D lateral beam profiles. Results show close agreement between the predicted and measured bubble cloud size for all f-numbers.
Figure 13. Predicted vs. Measured Cloud Size: Axial Direction.
Plots show the bubble cloud size in the axial direction compared with the predicted bubble cloud size measured using the 1D axial beam profiles. Results show close agreement between the predicted and measured bubble cloud size for all f-numbers.
RBC Phantom Ablation
Agarose tissue phantoms embedded with RBC layers were used to compare histotripsy ablation for f-numbers of 0.51, 0.58, 0.73, and 0.89. For all f-numbers, damaged areas were detected after each pulse, with the extent of the damaged area increasing with increasing pulse number (Fig. 14). At the lowest f-numbers (i.e. 0.51 and 0.58), dense bubble clouds were generated inside the RBC phantoms on every pulse, resulting in lesions that appeared to be homogeneously treated and possessed a smooth, well-defined boundary between the fractionated lesion and intact RBCs with no residual intact areas inside the treatment zone (Fig. 14). At the higher f-numbers (0.73 and 0.89), less dense bubble clouds were generated inside the RBC phantoms, resulting in lesions with a ragged boundary and residual intact areas inside the treatment zone after 250 pulses (Fig. 14). This effect was most pronounced for the highest f-number tested, 0.89, in which the lesion was not completely fractionated after 250 pulses (Fig. 14).
Figure 14. Optical images of histotripsy RBC fractionation.
Images show the cavitation bubble cloud (dark) and histotripsy lesions (white) generated in RBC phantoms (grey) using f-numbers of 0.51, 0.58, 0.73, and 0.89.
Comparing the efficiency of histotripsy ablation for different f-numbers demonstrated a significant increase in treatment efficiency for lower f-numbers. Figure 15 shows a quantitative comparison of the normalized lesion area as a function of pulse number for RBC phantoms (n=4) treated using f-numbers of 0.51, 0.58, 0.73, and 0.89. The normalized lesion area increased more rapidly with each pulse for lower f-numbers (Fig. 15). For example, the number of pulses required to fractionate 50% of the treatment zone was 14.5±9.5, 37.5±19.9, 101.0±30.9, and 209.3±17.4 for f-numbers of 0.51, 0.58, 0.73, and 0.89, respectively. This difference corresponds to a >14-fold increase in treatment efficiency between the lowest (0.51) and highest (0.89) f-number tested. After 250 pulses, complete fractionation of the treatment zone was achieved only for the lower f-number conditions (i.e. 0.51 and 0.58), while the higher f-numbers resulted in 79.9±5.5% (f-number: 0.73) and 63.9±3.7% (f-number: 0.89) of the treatment zone being fractionated after 250 pulses, suggesting that >250 pulses are required to completely fractionate the entire treatment zone for these cases. This hypothesis was validated in a separate study (not shown) which demonstrated that a homogeneously treated lesion with well-defined boundaries was generated after ~500–1000 pulses using an f-number of 0.89.
Figure 15. RBC Ablation Comparison.
Plot shows the normalized lesion area for histotripsy treatments using f-numbers of 0.51, 0.58, 0.73, and 0.89. Lesions produced by lower f-numbers developed significantly faster with each pulse than those produced with higher f-numbers. Complete disruption of the treatment zone after 250 pulses was only achieved for the lower f-number cases (0.51 and 0.58).
Discussion
In this study, the effect of f-number on the histotripsy intrinsic threshold, pHIT, were investigated using a 235-element 500 kHz array transducer, with the effective f-number varied from 0.51 to 0.89 by changing the active elements in the array. Results supported the hypothesis that pHIT does not significantly change with f-number, since it is only dependent on the properties of the media and the applied negative pressure. No trend in pHIT was observed as the f-number was increased from 0.51 to 0.89, with pHIT ranging from 27.2±0.34 MPa (f-number: 0.58) to 30.2±0.41 MPa (f-number: 0.73). These results support the findings of previous studies which concluded that the intrinsic threshold is determined by the applied negative pressure, while being independent of positive pressure (Maxwell et al., 2013; Vlaisavljevich et al., 2016b; Vlaisavljevich et al., 2015b). For instance, although the ratio of peak positive to peak negative pressure increased at higher f-numbers (Fig. 2) due to nonlinear propagation effects (i.e. more shocked waveforms at higher f-numbers), this did not result in a significant change in pHIT (Fig. 9, Table 1).
The finding that the intrinsic threshold is independent of f-number provides further evidence that cloud initiation in intrinsic threshold histotripsy is more predictable than generating a bubble cloud in shock scattering histotripsy, which depends upon multiple factors including the shock rise time and positive pressure amplitude, both of which are dependent on the f-number of the transducer (Maxwell et al., 2010a; Maxwell et al., 2011b; Vlaisavljevich et al., 2014b). The predictability of intrinsic threshold histotripsy was further demonstrated by experiments comparing the predicted and experimentally measured bubble cloud dimensions, with results showing close agreement for all f-numbers. At higher f-numbers, the bubble clouds became more elongated in the axial direction (i.e. more cigar shaped), directly matching the changes in the beam profiles measured prior to the cavitation experiments. The ability to predictably generate bubble clouds matching the portion of the beam profile above the intrinsic threshold is one of the key benefits of intrinsic threshold histotripsy. This approach makes it possible to precisely determine the location and dimensions of the histotripsy bubble cloud prior to treatment, which is essential to the clinical translation of histotripsy and the development of regulatory standards for histotripsy therapies. In addition, this feature of intrinsic threshold histotripsy will help to improve the design and development of histotripsy transducers for specific clinical applications.
The effects of f-number on “bubble density” and tissue fractionation were also investigated, with results supporting our hypothesis that “bubble density” decreases with increasing f-number, which was predicted based on the process of bubble-induced pressure saturation proposed in our previous study (Vlaisavljevich et al., 2015c). In this process, it is hypothesized that the pressure increases as the acoustic waves propagate towards the focal region and the beams from adjacent elements constructively interfere with one another. Once the intrinsic threshold is reached, a cavitation bubble is generated and the pressure temporarily drops below the intrinsic threshold for a short distance before the intrinsic threshold is once again reached, generating another bubble. This process then repeats throughout the entire focal volume, resulting in a bubble cloud covering the entire focal region in which the intrinsic threshold has been reached (Fig. 16). This process led to the hypothesis that the density of the bubble cloud would decrease at higher f-numbers due to an increased distance between nucleation events, which is dependent upon the rate of pressure increase in focal region. Results from the “bubble density” experiments supported this hypothesis, showing a significant decrease in “bubble density” with increasing f-number. This finding then led to the additional hypothesis that tissue fractionation would be more efficient for lower f-numbers. Results from the RBC phantom experiments supported this hypothesis, with rapid fractionation of the focal region observed within the first 50–100 pulses for the lower f-number conditions, resulting in well-defined lesions with sharp boundaries at the conclusion of the 250 pulse treatment. In contrast, significantly more pulses were required to achieve the same levels of fractionation at higher f-numbers. At the highest f-number (0.89), the RBC phantoms were only partially fractionated after 250 pulses and had not yet formed well-defined lesions matching the entire focal zone covered by the bubble cloud. This result demonstrates that longer treatment times (i.e. more pulses) will be required to completely fractionate a focal volume for clinical histotripsy treatments using higher f-number transducers, which was observed in a separate study that demonstrated a homogeneously treated lesion with well-defined boundaries after ~500–1000 pulses using an f-number of 0.89.
Figure 16. Intrinsic threshold histotripsy: Bubble cloud nucleation schematic.
Schematic shows proposed method of bubble cloud formation in intrinsic threshold histotripsy in which ultrasound beams constructively interfere as they propagate towards the focal region until the peak negative pressure reaches the intrinsic threshold. Once the intrinsic threshold is reached, a cavitation bubble is generated, and the pressure drops below the intrinsic threshold for a short distance. The beams then continue to propagate until intrinsic threshold is reached once again, with this process repeating through the entire focal volume.
Another important finding was that the size of individual bubbles generated near the intrinsic threshold did not significantly change with f-number, which was expected since bubble size is determined by the amplitude and duration of the applied p-. However, the size of bubbles generated within the clouds at higher amplitudes (at the specific time point imaged) appeared to decrease for lower f-numbers. Based on our pressure saturation hypothesis, it seems unlikely that these differences in bubble size were due to differences in pEST, since the local pressure experienced by each individual bubble in the cloud is expected to be at or near the intrinsic threshold. This hypothesis is supported by the fact that smaller bubbles were seen at lower f-numbers even though the pEST was higher. Instead, our hypothesis is that this effect is explained by bubble-bubble interactions which become more significant at lower f-numbers due to the increase in “bubble density” (i.e. bubble growth is impeded by surrounding bubbles). Future work is planned to further investigate this effect.
In general, the results of this study suggest that designing transducers with the lowest possible f-number for a given acoustic window will be beneficial in order to generate dense bubble clouds and improve treatment efficiency. This finding further suggests that longer treatments (i.e. more pulses) will be required to successfully use histotripsy in cases that require higher f-number transducers. However, it is worth noting that higher f-numbers also have larger focal zones, so it is likely that the decrease in efficiency for treating larger volumes will be less than the decrease in efficiency observed for a single focal point since the decrease in efficiency at each point will be compensated by the increased size of the focal zone. The finding that the efficiency of intrinsic threshold histotripsy decreases at higher f-numbers also suggests that it may be preferable to use shock scattering histotripsy to generate denser bubble clouds in these cases, since shock scattering histotripsy allows for a very dense bubble cloud to be formed even at higher f-numbers. In fact, shock scattering histotripsy is more challenging at lower f-numbers since it requires the generation of high shock amplitudes in order to generate a bubble cloud. Therefore, as a general principle, intrinsic threshold histotripsy is likely to be preferable when using lower f-numbers while shock scattering histotripsy is more appropriate for higher f-numbers. However, it is worth noting that, although less efficient at higher f-numbers, intrinsic threshold histotripsy will still result in improved treatment precision and may therefore be preferred to shock scattering when high precision is required even when using higher f-numbers, such as in histotripsy thrombolysis (Maxwell et al., 2011a; Zhang et al., 2015). In general, the advantages of using intrinsic threshold histotripsy, such as high reliability, high accuracy, the ability to treat near interfaces without pre-focal cavitation, and the ability to manipulate bubble cloud behavior likely make it the preferred treatment modality for most applications in which sufficiently high negative pressures can be achieved.
While this work was limited to f-numbers between 0.51–0.89, the trends observed in this study are expected to be relevant for all f-numbers, as long as sufficient pressure can be generated at the focus in order to exceed the intrinsic threshold. Generating the large negative pressures above the intrinsic threshold may be difficult at very high f-numbers due to practical device limitations (i.e. inability to generate high enough surface pressures in order to exceed the intrinsic threshold at the focus) which was the limiting factor in the current study as well as theoretical acoustic limitations (i.e. inability to exceed the intrinsic threshold at the focus due to complete acoustic saturation). It is also worth noting that the trends observed in this study, such as the decreased cloud density at higher f-number, are expected to occur for histotripsy intrinsic threshold treatments at all acoustic frequencies, although the absolute values may change with frequency as shown in our previous work investigating the effects of frequency on the intrinsic threshold and bubble dynamics, which showed a slight decrease in the intrinsic threshold (Vlaisavljevich 2015b) as well as a significant increase in bubble size (Vlaisavljevich 2015c) at lower frequency.
Conclusion
In this study, the effects of f-number on the histotripsy intrinsic threshold and cavitation bubble cloud behavior were investigated using a 235-element 500 kHz array transducer. Results demonstrated that the histotripsy intrinsic threshold did not significantly change with f-number, with the threshold remaining ~27–30 MPa for all conditions. The predictability of intrinsic threshold histotripsy was further demonstrated by experiments comparing the predicted bubble cloud size with the size of the bubble clouds measured experimentally, with results showing close agreement for all f-numbers. Finally, results showed that the tissue fractionation efficiency decreases at higher f-numbers due to a decrease in the “bubble density” within the bubble cloud. Overall, this study provides significant insight into the effects of f-number on intrinsic threshold histotripsy that will help to guide the design of histotripsy transducers for specific clinical applications.
Acknowledgments
This work was supported by grants from National Institute of Biomedical Imaging And Bioengineering (NIBIB) of the National Institutes of Health under Award Number R01EB008998, the National Institute of Neurological Disorder and Stroke (NINDS) of the National Institutes of Health under Award Number R21 NS093121, a Research Scholar Grant from the American Cancer Society (RSG-13-101-01-CCE), The Hartwell Foundation, and Focused Ultrasound Foundation. Disclosure notice: Drs. Eli Vlaisavljevich, Tim Hall, and Zhen Xu have financial interests and/or other relationships with HistoSonics Inc.
References
- Duck FA. Physical properties of tissue: a comprehensive reference book. Academic Press; 1990. [Google Scholar]
- Duryea AP, Hall TL, Maxwell AD, Xu Z, Cain CA, Roberts WW. Histotripsy erosion of model urinary calculi. Journal of Endourology. 2011;25:341–4. doi: 10.1089/end.2010.0407. [DOI] [PMC free article] [PubMed] [Google Scholar]
- Hempel CR, Hall TL, Cain CA, Fowlkes JB, Xu Z, Roberts WW. Histotripsy fractionation of prostate tissue: local effects and systemic response in a canine model. JUrol. 2011;185:1484–9. doi: 10.1016/j.juro.2010.11.044. [DOI] [PMC free article] [PubMed] [Google Scholar]
- Hosmer DW, Lemeshow S. Confidence interval estimation of interaction. Epidemiology. 1992;3:452–6. doi: 10.1097/00001648-199209000-00012. [DOI] [PubMed] [Google Scholar]
- Kim Y, Maxwell AD, Hall TL, Xu Z, Lin KW, Cain CA. Rapid prototyping fabrication of focused ultrasound transducers. IEEETrans Ultrason Ferroelectr Freq Control. 2014;61:1559–74. doi: 10.1109/TUFFC.2014.3070. [DOI] [PubMed] [Google Scholar]
- Lin KW, Kim Y, Maxwell AD, Wang TY, Hall TL, Xu Z, Fowlkes JB, Cain CA. Histotripsy beyond the intrinsic cavitation threshold using very short ultrasound pulses: microtripsy. IEEETrans Ultrason Ferroelectr Freq Control. 2014;61:251–65. doi: 10.1109/TUFFC.2014.6722611. [DOI] [PMC free article] [PubMed] [Google Scholar]
- Maxwell AD, Cain CA, Fowlkes JB, Xu Z. Inception of Cavitation Clouds by Scattered Shockwaves. IEEEUltrasonics Symposium. 2010a;3B-2 [Google Scholar]
- Maxwell AD, Cain CA, Hall TL, Fowlkes JB, Xu Z. Probability of cavitation for single ultrasound pulses applied to tissues and tissue-mimicking materials. Ultrasound Med Biol. 2013;39:449–65. doi: 10.1016/j.ultrasmedbio.2012.09.004. [DOI] [PMC free article] [PubMed] [Google Scholar]
- Maxwell AD, Owens G, Gurm HS, Ives K, Myers DD, Jr, Xu Z. Noninvasive treatment of deep venous thrombosis using pulsed ultrasound cavitation therapy (histotripsy) in a porcine model. JVasc Interv Radiol. 2011a;22:369–77. doi: 10.1016/j.jvir.2010.10.007. [DOI] [PMC free article] [PubMed] [Google Scholar]
- Maxwell AD, Wang TY, Cain CA, Fowlkes JB, Sapozhnikov OA, Bailey MR, Xu Z. Cavitation clouds created by shock scattering from bubbles during histotripsy. JAcoust Soc Am. 2011b;130:1888–98. doi: 10.1121/1.3625239. [DOI] [PMC free article] [PubMed] [Google Scholar]
- Maxwell AD, Wang TY, Yuan L, Duryea AP, Xu Z, Cain CA. A tissue phantom for visualization and measurement of ultrasound-induced cavitation damage. Ultrasound Med Biol. 2010b;36:2132–43. doi: 10.1016/j.ultrasmedbio.2010.08.023. [DOI] [PMC free article] [PubMed] [Google Scholar]
- Owens GE, Miller RM, Ensing G, Ives K, Gordon D, Ludomirsky A, Xu Z. Therapeutic ultrasound to noninvasively create intracardiac communications in an intact animal model. Catheter Cardiovasc Interv. 2011;77:580–8. doi: 10.1002/ccd.22787. [DOI] [PMC free article] [PubMed] [Google Scholar]
- Parsons JE, Cain CA, Abrams GD, Fowlkes JB. Pulsed cavitational ultrasound therapy for controlled tissue homogenization. Ultrasound Med Biol. 2006a;32:115–29. doi: 10.1016/j.ultrasmedbio.2005.09.005. [DOI] [PubMed] [Google Scholar]
- Parsons JE, Cain CA, Fowlkes JB. Cost-effective assembly of a basic fiber-optic hydrophone for measurement of high-amplitude therapeutic ultrasound fields. JAcoust Soc Am. 2006b;119:1432–40. doi: 10.1121/1.2166708. [DOI] [PubMed] [Google Scholar]
- Roberts WW, Hall TL, Ives K, Wolf JS, Jr, Fowlkes JB, Cain CA. Pulsed cavitational ultrasound: a noninvasive technology for controlled tissue ablation (histotripsy) in the rabbit kidney. JUrol. 2006;175:734–8. doi: 10.1016/S0022-5347(05)00141-2. [DOI] [PubMed] [Google Scholar]
- Roberts WW, Teofilovic D, Jahnke RC, Patri J, Risdahl JM, Bertolina JA. Histotripsy of the prostate using a commercial system in a canine model. JUrol. 2014;191:860–5. doi: 10.1016/j.juro.2013.08.077. [DOI] [PubMed] [Google Scholar]
- Simon JC, Sapozhnikov OA, Khokhlova VA, Wang YN, Crum LA, Bailey MR. Ultrasonic atomization of tissue and its role in tissue fractionation by high intensity focused ultrasound. Phys Med Biol. 2012;57:8061–78. doi: 10.1088/0031-9155/57/23/8061. [DOI] [PMC free article] [PubMed] [Google Scholar]
- Styn NR, Wheat JC, Hall TL, Roberts WW. Histotripsy of VX-2 tumor implanted in a renal rabbit model. JEndourol. 2010;24:1145–50. doi: 10.1089/end.2010.0123. [DOI] [PubMed] [Google Scholar]
- Vlaisavljevich E, Aydin O, Durmaz YY, Lin KW, Fowlkes B, ElSayed M, Xu Z. Effects of Ultrasound Frequency on Nanodroplet-Mediated Histotripsy. Ultrasound Med Biol. 2015a doi: 10.1016/j.ultrasmedbio.2015.04.007. [DOI] [PubMed] [Google Scholar]
- Vlaisavljevich E, Aydin O, Durmaz YY, Lin KW, Fowlkes B, Xu Z, ElSayed ME. Effects of Droplet Composition on Nanodroplet-Mediated Histotripsy. Ultrasound Med Biol. 2016a;42:931–46. doi: 10.1016/j.ultrasmedbio.2015.11.027. [DOI] [PubMed] [Google Scholar]
- Vlaisavljevich E, Aydin O, Lin KW, Durmaz YY, Fowlkes B, ElSayed M, Xu Z. The role of positive and negative pressure on cavitation nucleation in nanodroplet-mediated histotripsy. Phys Med Biol. 2016b;61:663–82. doi: 10.1088/0031-9155/61/2/663. [DOI] [PubMed] [Google Scholar]
- Vlaisavljevich E, Durmaz YY, Maxwell A, Elsayed M, Xu Z. Nanodroplet-mediated histotripsy for image-guided targeted ultrasound cell ablation. Theranostics. 2013a;3:851–64. doi: 10.7150/thno.6717. [DOI] [PMC free article] [PubMed] [Google Scholar]
- Vlaisavljevich E, Greve J, Cheng X, Ives K, Shi J, Jin L, Arvidson A, Hall T, Welling TH, Owens G, Roberts W, Xu Z. Non-Invasive Ultrasound Liver Ablation Using Histotripsy: Chronic Study in an In Vivo Rodent Model. Ultrasound Med Biol. 2016c doi: 10.1016/j.ultrasmedbio.2016.03.018. [DOI] [PMC free article] [PubMed] [Google Scholar]
- Vlaisavljevich E, Kim Y, Allen S, Owens G, Pelletier S, Cain C, Ives K, Xu Z. Image-Guided Non-Invasive Ultrasound Liver Ablation using Histotripsy: Feasibility Study in an In Vivo Porcine Model. Ultrasound Med Biol. 2013b doi: 10.1016/j.ultrasmedbio.2013.02.005. [DOI] [PMC free article] [PubMed] [Google Scholar]
- Vlaisavljevich E, Kim Y, Owens G, Roberts W, Cain C, Xu Z. Effects of tissue mechanical properties on susceptibility to histotripsy-induced tissue damage. Phys Med Biol. 2014a;59:253–70. doi: 10.1088/0031-9155/59/2/253. [DOI] [PMC free article] [PubMed] [Google Scholar]
- Vlaisavljevich E, Lin KW, Maxwell A, Warnez M, Mancia L, Singh R, Putnam A, fowlkes JB, Johnsen E, Cain C, Xu Z. Effects of Ultrasound Frequency and Tissue Stiffness on the Histotripsy Intrinsic Threshold for Cavitation. Ultrasound Med Biol. 2015b doi: 10.1016/j.ultrasmedbio.2015.01.028. [DOI] [PMC free article] [PubMed] [Google Scholar]
- Vlaisavljevich E, Lin KW, Warnez M, Singh R, Mancia L, Putnam A, Johnsen E, Cain C, Xu Z. Effects of Tissue Stiffness, Ultrasound Frequency, and Pressure on Histotripsy-induced Cavitation Bubble Behavior. Phys Med Biol. 2015c doi: 10.1088/0031-9155/60/6/2271. [DOI] [PMC free article] [PubMed] [Google Scholar]
- Vlaisavljevich E, Maxwell A, Mancia L, Johnsen E, Cain C, Xu Z. Visualizing the Histotripsy Process: Bubble Cloud-Cancer Cell Interactions in a Tissue-Mimicking Environment. Ultrasound Med Biol. 2016d doi: 10.1016/j.ultrasmedbio.2016.05.018. [DOI] [PMC free article] [PubMed] [Google Scholar]
- Vlaisavljevich E, Maxwell A, Warnez M, Johnsen E, Cain CA, Xu Z. Histotripsy-induced cavitation cloud initiation thresholds in tissues of different mechanical properties. IEEETrans Ultrason Ferroelectr Freq Control. 2014b;61:341–52. doi: 10.1109/TUFFC.2014.6722618. [DOI] [PMC free article] [PubMed] [Google Scholar]
- Wang TY, Xu Z, Hall TL, Fowlkes JB, Cain CA. An efficient treatment strategy for histotripsy by removing cavitation memory. Ultrasound Med Biol. 2012;38:753–66. doi: 10.1016/j.ultrasmedbio.2012.01.013. [DOI] [PMC free article] [PubMed] [Google Scholar]
- Wang YN, Khokhlova T, Bailey M, Hwang JH, Khokhlova V. Histological and Biochemical Analysis of Mechanical and Thermal Bioeffects in Boiling Histotripsy Lesions Induced by High Intensity Focused Ultrasound. Ultrasound Med Biol. 2013;39:424–38. doi: 10.1016/j.ultrasmedbio.2012.10.012. [DOI] [PMC free article] [PubMed] [Google Scholar]
- Xu Z, Fowlkes JB, Rothman ED, Levin AM, Cain CA. Controlled ultrasound tissue erosion: the role of dynamic interaction between insonation and microbubble activity. JAcoust Soc Am. 2005;117:424–35. doi: 10.1121/1.1828551. [DOI] [PMC free article] [PubMed] [Google Scholar]
- Xu Z, Ludomirsky A, Eun LY, Hall TL, Tran BC, Fowlkes JB, Cain CA. Controlled ultrasound tissue erosion. IEEETrans Ultrason Ferroelectr Freq Control. 2004;51:726–36. doi: 10.1109/tuffc.2004.1308731. [DOI] [PMC free article] [PubMed] [Google Scholar]
- Xu Z, Owens G, Gordon D, Cain C, Ludomirsky A. Noninvasive creation of an atrial septal defect by histotripsy in a canine model. Circulation. 2010;121:742–9. doi: 10.1161/CIRCULATIONAHA.109.889071. [DOI] [PMC free article] [PubMed] [Google Scholar]
- Yamada H. Strength of biologic materials. New York: Robert E. Kreiger; 1973. [Google Scholar]
- Zhang X, Owens GE, Gurm HS, Ding Y, Cain CA, Xu Z. Noninvasive thrombolysis using histotripsy beyond the intrinsic threshold (microtripsy) IEEE Trans Ultrason Ferroelectr Freq Control. 2015;62:1342–55. doi: 10.1109/TUFFC.2015.007016. [DOI] [PMC free article] [PubMed] [Google Scholar]


