

Abstract
Soybean seeds contain large amounts of isoflavones or phytoestrogens such as genistein, daidzein, and glycitein that display biological effects when ingested by humans and animals. In seeds, the total amount, and amount of each type, of isoflavone varies by 5 fold between cultivars and locations. Isoflavone content and quality are one key to the biological effects of soy foods, dietary supplements, and nutraceuticals. Previously we had identified 6 loci (QTL) controlling isoflavone content using 150 DNA markers. This study aimed to identify and delimit loci underlying heritable variation in isoflavone content with additional DNA markers. We used a recombinant inbred line (RIL) population () derived from the cross of “Essex” by “Forrest,” two cultivars that contrast for isoflavone content. Seed isoflavone content of each RIL was determined by HPLC and compared against 240 polymorphic microsatellite markers by one-way analysis of variance. Two QTL that underlie seed isoflavone content were newly discovered. The additional markers confirmed and refined the positions of the six QTL already reported. The first new region anchored by the marker BARC_Satt063 was significantly associated with genistein (, ) and daidzein ( , ). The region is located on linkage group B2 and derived the beneficial allele from Essex. The second new region defined by the marker BARC_Satt129 was significantly associated with total glycitein ( , ). The region is located on linkage group D1a+Q and also derived the beneficial allele from Essex. Jointly the eight loci can explain the heritable variation in isoflavone content. The loci may be used to stabilize seed isoflavone content by selection and to isolate the underlying genes.
INTRODUCTION
Soybean seed products contain a wide variety of bioactive phytochemicals (eg, isoflavones, saponins, phytic acids, phytosterols, trypsin inhibitors, phenolic acids, peptides, etc) [1, 2, 3]. Among these, the plant estrogens genistein, daidzein, and glycitein are a major focus of medical research. Isoflavonoids and other phytoestrogenic compounds have been shown to inhibit various processes during carcinogenesis [1] such as mutation [2], proliferation of cancer cell lines [4], viral promotion [5], and angiogenesis [6]. Tumor numbers are reduced in animals after treatment with soy products [7] or after treatment with soy isoflavonoids [8, 9]. Soy phytoestrogens are being implicated in a reduced risk of breast and prostate cancer, cardiovascular disease, and osteoporosis [10, 11, 12, 13, 14, 15, 16, 17]. Phytoestrogens can also be used for low estrogen soybean of benefit to young females (aged 0–6), mammary carcinoma patients, zoological animals on soybean supplement, and human males. Additionally, different phytoestrogens can have opposite effects on animal reproduction and growth [18, 19]. The biological effects of these isoflavones appear to depend on species, genotype, age, purity, dose, and cofactors [20].
All soybean organs can produce isoflavones in response to stress, but the seeds are the major site of synthesis for storage. In inheritance studies with diverse cultivars, heritabilities of seed isoflavone amounts range from 20%–40% [21]. In a recombinant inbred line (RIL) population, the heritability of isoflavones ranged from 22% for genistein to 79% for daidzein and 88% for glycitein [22]. The environmental interactions cause the amount of isoflavones in soybean seed varies five fold among years, environments, and genotypes [21, 22]. However, DNA markers closely linked to the 6 loci controlling isoflavone content can be used to double content and reduce variability in isoflavone content by 2–4 fold [22].
Many genes involved in the production of isoflavones from phenylalanine have been isolated and over-expressed in transgenic plants [23]. A key point enzyme in pathway regulation seems to be isoflavone synthase (P450) involved indirectly in both the genistein and daidzien biosynthesis pathways. The gene was isolated and shown to be differently regulated in seeds and vegetative organs [23, 24]. Transgenic plants overexpressing the enzyme in soybean and Arabidopsis did produce a significant increase in leaf and seed phytoestrogen content [23] but less than the fold increase in protein abundance. Therefore, the loci that control the amount of phytoestrogen produced in nontransgenic plants may also regulate production during transgene-driven synthesis.
The purpose of this study is to identify new genetic markers that are linked to loci conditioning variation in daidzein, genistein, and glycitein. This genetic information would then be used in plant breeding to develop soybean varieties that have high and reliable concentrations of beneficial isoflavones.
MATERIALS AND METHODS
Plant material
The study involved 100 RILs from “Essex × Forrest” [22, 25]. Soybean seeds were planted in two different environments in southern Illinois over two years (1996, 1997) in a randomized complete block (RCB) array as described in [22].
Isoflavone extraction
Isoflavones were extracted from each RIL. Within location, replicates were pooled before extraction. Isoflavone contents were determined by high performance liquid chromatography (HPLC) as described in [22].
DNA isolation
RILs were grown in the greenhouse; 3 g of leaves were collected from 5 to 6, 2-week-old seedlings and immediately frozen in liquid nitrogen. The leaves were ground in liquid nitrogen into a very fine powder and DNA was extracted as described in [22]. DNA concentration was measured by a fluorometer and diluted to 15–30 ng/μL for further use in PCR reactions. The two subpopulations were assayed separately and the results pooled.
Microsatellite amplification
Microsatellite markers from the 20 linkage groups of the soybean genetic map were tested for polymorphism between Essex and Forrest [26]. The primer pairs were purchased from Research Genetics, Inc, (Huntsville, Ala, USA). The PCR amplifications were performed in 96-well microtitre plates using a Perkin Elmer (Foster City, Calif) GeneAmp 9600 as described [22]. Two negative controls (with no template DNA), along with the two parents DNA as positive controls, were included in all the amplification sets. Marker scores were repeated on 3 occasions by 2 operators. Only unequivocal scores were accepted to reduce or eliminate marker scoring errors.
Data analysis
Polymorphic DNA markers were compared against all traits by a one-way analysis of variance (SAS Institute Inc, Cary, NC; see [25]). The probability of association of each marker with each trait was determined and a significant association with an interval was declared if marker(s) in that interval were associated at because we calculated an approximate Bonferroni correction as for the set of independent (unlinked or greater than 10 cM apart) DNA markers. Allowing for the gaps greater than 10 cM in the map, we also accept as a significant association if the interval was flanking a single marker. Precedents with mapping other traits have shown these criteria to be valid [22, 25, 27].
MapMaker-EXP 3.0 was used to estimate map distances (cM, Haldane units) between linked markers [22]. The log10 of the odds ratio (LOD) for grouping markers was set at 2.0 and maximum distance was 30 cM. Trait data and marker map were simultaneously analyzed with MapMaker/QTL 1.1 using the F2-backcross genetic model for trait segregation [22, 25] to identify the approximate position of QTL within intervals. Putative QTL were inferred when the LOD score exceeded 2.0 at some point in each interval. The position of the QTL was inferred from the LOD peaks at individual loci detected by maximum likelihood test at positions every 2 cM between adjacent linked markers.
RESULTS
Polymorphism and linkage
A total of 600 microsatellite markers were tested and 240 were found to be polymorphic within the Essex × Forrest population. Two hundred and one markers formed 22 linkage groups. By assuming all microsatellite markers map to a single locus in all soybean cultivars, the markers could all be anchored to the 20 linkage groups of soybean [26]. The linked markers encompassed about 2990.4 cM with an average distance of 26.4 cM between markers [28]. The remaining 39 markers were not linked but do map to known locations in the soybean genome [26]. This coverage is comparable to the known recombination distances of about 2500–3000 cM within 20 linkage groups [26, 29]. The order of markers was consistent with that reported for the soybean genome [26]. Marker content ranged from three on linkage groups J and A1 to 22 on linkage group G [28].
Genomic regions associated with isoflavone content
To test the effect of seed storage on soybean isoflavone content, seeds from two subpopulations, 40 and 60 RILs, from the same generation were analyzed by HPLC in two consecutive years. All QTL that were detected in any subpopulation are reported because the marker map is sparse in some regions and real QTL may otherwise not be reported [25].
Subpopulation of 40 RILs
Using subpopulation of 40 RILs with data from pooled plot replicates, one new chromosomal region was found to contain a QTL for seed isoflavone content (Table 1 and Figure 1). The new region defined by the marker BARC_Satt129 was significantly associated with total glycitein (, ). The region had an LOD score of 3.6 and explained about 34.3% of the total variation in glycitein content. The region was located on linkage group D1a+Q and derived the beneficial allele from Essex. We also confirmed the positions of the two regions previously reported (Meksem et al [22]) on linkage group B1 but we added a new marker BARC_Satt415 that was significantly (, ) associated with total glycitein content. The region had an LOD score of 5.3 and explained nearly 50.3% of the total variation in glycitein content (Table 2 and Figure 2).
Table 1.
DNA markers and intervals most likely to be associated with QTL for seed isoflavone content across two environments. LG: linkage group. LODa indicates how much more probable the data are to have arisen assuming the presence of a locus than assuming its absence; LOD threshold = 2.0. QTL Varb: amount of variation in the phenotype explained by the DNA marker using MapMaker QTL. Isoflavone amounts for all the aglycones of daidzein (Daid), genistein (Gen), and glycitin (Gly) are given in micrograms per gram dry weight.
| Marker | LG | Trait | P > F | R2 (%) | LODa | QTL Varb | Mean ± SEM | |
|---|---|---|---|---|---|---|---|---|
| Essex | Forrest | |||||||
| BARC_Satt063 | B2 | Gen60 | 0.0090 | 29.5 | 2.9 | 38.0 | 1085.7 ± 13.3 | 950.0 ± 11.2 |
| Daid | 0.0070 | 17.0 | 2.0 | 16.9 | 1427.3 ± 11.6 | 1206.2 ± 11.3 | ||
| BARC_Satt129 | D1a+Q | Gly40 | 0.0005 | 32.0 | 3.6 | 34.3 | 320.0 ± 23 | 180.0 ± 10.5 |
Figure 1.
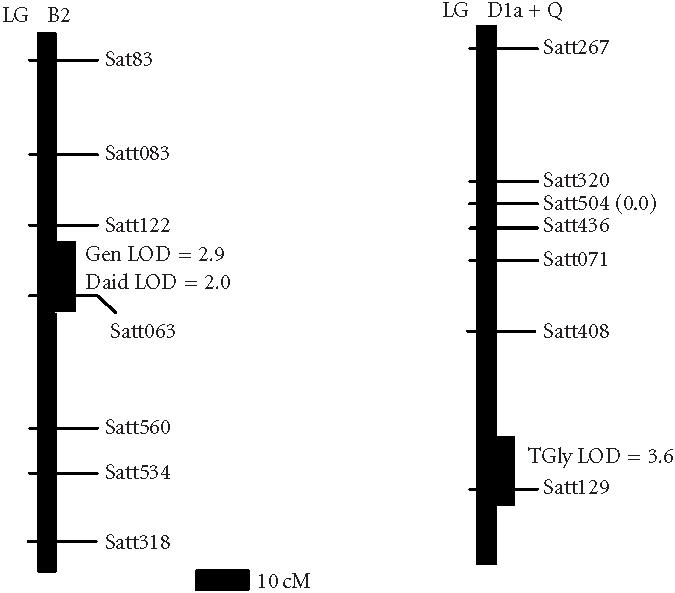
Locations of DNA markers and the two new QTL in regions conditioning soybean seed isoflavone amount. The new QTL were assigned to regions of linkage groups B2 and D1a+Q on the soybean genetic map [26, 30]. Genetic distances were from the recombinant inbred line function of MapMaker/Exp 3.0. The estimated positions of the QTL are shown to be based on interval mapping using MapMaker/QTL1.1. The QTL LOD score is the peak LOD score of the interval showing association with seed isoflavone content. Gen: genistein; Daid: daidzein; TGly: total glycitein.
Table 2.
DNA markers and intervals containing QTL for seed isoflavone content across two environments (Meksem et al [22]). *New markers (BARC_Satt415 and BARC_Sct26) mapped recently on linkage group B1 and associated with the QTL that underlie seed isoflavone content. Isoflavone contents for all the aglycones of daidzein (Daid), Genistein (Gen), and Glycitin (Gly) are given in micrograms per gram dry weight.
| Marker | LG | Trait | P > F | R2 (%) | LODa | QTL Varb | Mean ± SEM | |
|---|---|---|---|---|---|---|---|---|
| Essex | Forrest | |||||||
| BARC_Satt276 | A1 | Daid | 0.008 | 9.6 | 2.7 | 27.1 | 1258 ± 42 | 1280 ± 35 |
| BARC_Satt197 | B1 | Gly | 0.0001 | 41.2 | 8.8 | 38.4 | 237.8 ± 12.3 | 176.4 ± 10.0 |
| Gly40 | 0.0001 | 50.0 | 4.3 | 45.2 | 234.6 ± 11.5 | 166.0 ± 10.8 | ||
| Gly60 | 0.0001 | 35.4 | 4.9 | 37.0 | 239.8 ± 12.1 | 184.7 ± 12.8 | ||
| BARC_Satt251 | B1 | Gly | 0.0001 | 50.2 | 11.8 | 49.0 | 242.0 ± 6.6 | 175.0 ± 4.3 |
| Gly40 | 0.0001 | 50.0 | 5.3 | 53.3 | 236.0 ± 12.4 | 171.0 ± 6.9 | ||
| Gly60 | 0.0001 | 50.0 | 6.8 | 48.0 | 244.6 ± 8.1 | 179.5 ± 5.7 | ||
| BARC_Satt415* | B1 | Gly | 0.0001 | 41.2 | 8.2 | 36.4 | 237.8 ± 10.3 | 176.4 ± 11.0 |
| Gly40 | 0.0001 | 50.0 | 3.9 | 41.0 | 234.6 ± 13.5 | 166.0 ± 12.8 | ||
| Gly60 | 0.0001 | 35.4 | 4.5 | 35.1 | 239.8 ± 12.1 | 184.7 ± 13.8 | ||
| BARC_Sct26* | B1 | Gly | 0.0001 | 21.0 | 2.3 | 21.3 | 240.0 ± 6.4 | 175.4 ± 11.0 |
| BARC_Satt302 | H | Gly | 0.0082 | 9.5 | 2.0 | 11.7 | 219.5 ± 11.4 | 191.5 ± 10.8 |
| Gly60 | 0.0034 | 19.5 | 2.0 | 21.7 | 236.2 ± 12.8 | 194.4 ± 11.4 | ||
| BARC_Satt260/555/178 | K | Daid | 0.008 | 21.3 | 2.1 | 25.3 | 1460 ± 81 | 1197 ± 53 |
| BARC_Satt237 | N | Gly | 0.0033 | 11.1 | 2.3 | 20.0 | 211.0 ± 6.6 | 182.0 ± 5.7 |
| Gly60 | 0.0090 | 14.6 | 2.1 | 31.2 | 219.8 ± 6.8 | 186.1 ± 6.2 | ||
| BARC_Satt080 | N | Daid | 0.0023 | 10.3 | 3.5 | 23.9 | 1230.0 ± 29 | 1381 ± 40 |
Figure 2.

Locations of microsatellite markers and QTL that underlie soybean seed isoflavone amount in regions of the soybean genetic map. The QTL LOD score is the peak LOD score of the interval showing association with seed isoflavone content. LOD scores for the intervals are given. *New microsatellite markers mapped [28] compared to the previous map (Meksem et al [22]). Where marker orders disagree with the Soybase composite map (B1 and K), the most likely map from the Essex × Forrest data was used. Gen: genistein; Daid: daidzein; TGly: total glycitein.
Figure 4.
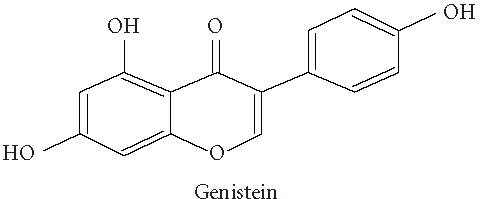
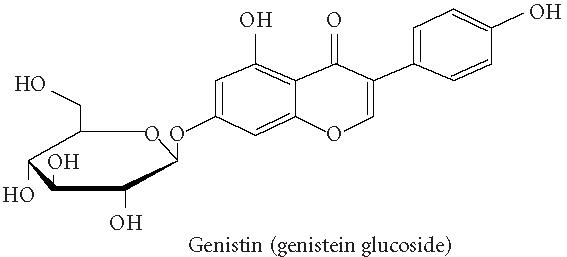
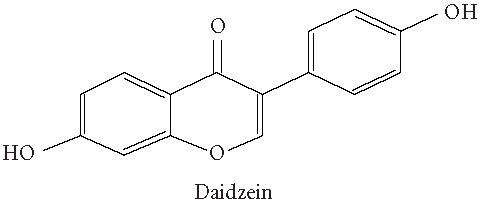
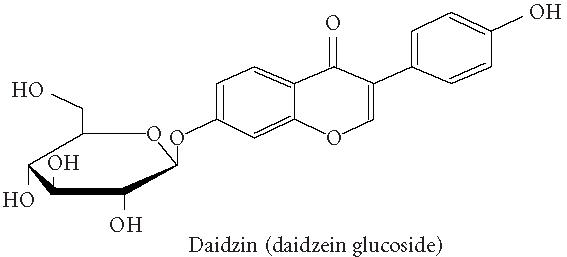
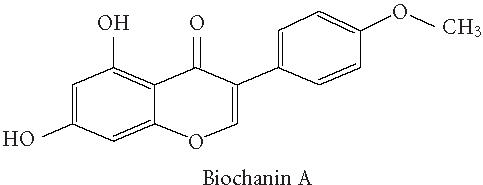
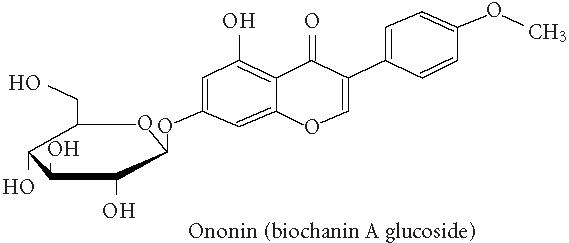
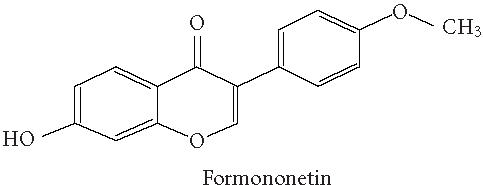
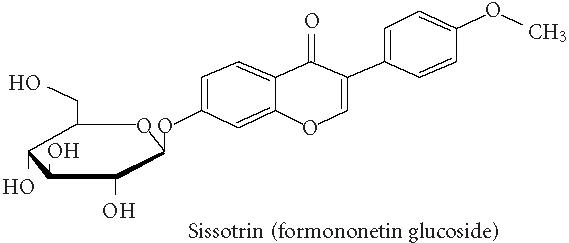
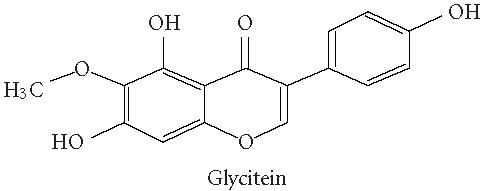
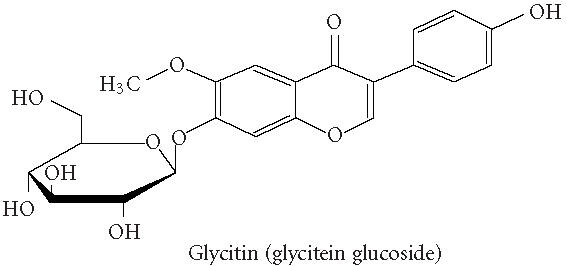
Chemical structures of five phytoestrogens and their common conjugates.
Subpopulation of 60 RILs
Using the subpopulation of 60 RILs, with data from pooled plot replicates, a second new chromosomal region was found to contain QTL for seed isoflavone content (Table 1 and Figure 1). The new second region defined by the marker BARC_Satt063 was significantly associated with genistein (, ) and daidzein (, ). The region had an LOD score of 2.9 and explained about 28.0% of the total variation in genistein content. The same region had an LOD score of 2.0 and explained about 16.9% of the total variation of daidzein content. The region is located on linkage group B2 and derived the beneficial allele from Essex. The positions of the regions previously reported (Meksem et al [22]) on linkage groups B1, H, and N (Table 2 and Figure 2) were confirmed.
The pooled population of 100 RILs
Using the whole population of 100 RILs, with data from pooled plot replicates, one additional chromosomal region was found to contain QTL for seed isoflavone content (Table 1 and Figure 1). This was the same region found using subpopulation of 60 RILs with data from each plot replicate. The region defined by the marker BARC_Satt063 was significantly associated with daidzein (, ) and genistein (, ). The region had an LOD score of 2.0 and explained about 16.9% of the total variation of daidzein content. The region had an LOD score of 2.9 and explained about 28.0% of the total variation in genistein content. The region is located on linkage group B2 and derived the beneficial allele from Essex. The positions of the regions previously reported (Meksem et al [22]) on linkage groups A1, B1, H, K, and N (Table 2 and Figure 2) were confirmed.
DISCUSSION
Testing a larger number of microsatellite markers increased the sampling of the soybean genome. Thereby, two additional chromosomal regions containing QTL for seed isoflavone amount were discovered on linkage groups B2 and D1a+Q. The positions of the regions previously reported [22] on linkage groups A1, B1, H, K, and N were confirmed and delimited. The identification of eight loci controlling the accumulation of specific isoflavone suggests that it is possible to combine a high glycitein amount (Essex trait) with high daidzein and genistein amounts (Forrest traits) in a single cultivar (Table 3).
Table 3.
Table of some selected soybean genotypes from 100 recombinant inbred lines and their phytoestrogen contents showing the QTL associations with beneficial alleles. Essex alleles are indicated A, Forrest alleles are B. Isoflavone contents for all the aglycones of daidzein (Daid), Genistein (Gen), and Glycitin (Gly) are given in micrograms per gram dry weight.
| Linkage group | B1 | N-QTL1 | K | N-QTL2 | A1 | H | B2 | D1a+Q | All | ||||
| Phytoestrogen | Gly | Gly | Gly & Gen | Daid | Daid | Gly | Gen & Daid | Gly | All | Contents as measured | |||
| Beneficial All. | A | A | A | B | B | A | A | A | All | ||||
| Marker | Satt251 | Satt237 | Sat_116 | Satt080 | Satt276 | Satt302 | Satt063 | Satt129 | Total | Daid | Gen | Gly | Total |
| RIL 52 | A | A | A | B | B | A | A | H | 7.5 | 2181 | 1321 | 256 | 3759 |
| RIL 81 | B | A | A | B | B | A | A | B | 6 | 2033 | 1249 | 213 | 3496 |
| RIL 12 | A | A | A | B | B | A | H | B | 6.5 | 1659 | 1329 | 267 | 3255 |
| RIL 23 | B | A | A | B | A | A | H | B | 4.5 | 1827 | 1222 | 167 | 3218 |
| RIL 34 | B | A | B | B | A | B | H | B | 3.5 | 1474 | 1005 | 307 | 2787 |
| RIL 7 | H | B | B | B | B | B | H | H | 2.5 | 1575 | 1009 | 184 | 2769 |
| RIL 5 | A | A | A | H | B | B | H | H | 3.5 | 1339 | 1189 | 222 | 2750 |
| RIL 73 | A | B | A | A | H | B | A | A | 3.5 | 1377 | 1121 | 244 | 2742 |
| RIL 47 | H | B | B | B | A | B | H | B | 2.5 | 912 | 834 | 143 | 1889 |
| RIL 43 | B | B | B | B | A | B | H | H | 2 | 882 | 771 | 209 | 1862 |
| RIL 89 | B | B | B | B | A | A | B | B | 1 | 1002 | 695 | 125 | 1822 |
| RIL 85 | B | B | B | A | B | A | B | H | 1.5 | 874 | 763 | 136 | 1774 |
Seed isoflavone content was reported to be variable among soybean cultivars grown in different locations and crop years [31]. High temperature during the seed filling stage was also linked to the amount of isoflavones in seeds [32]. In order to identify stable QTL that underlie stable isoflavone amounts across environments and crop years, seeds from the Essex × Forrest RIL population were analyzed in two consecutive years; the first year we determined the isoflavone content of a subpopulation of 40 individuals at each of 2 years and locations then produced a mean isoflavone content value. In the second year we analyzed 60 individuals with pooled samples from 2 years and 2 locations. All QTL identified in the subpopulation of 60 individuals were confirmed in the subpopulation of 40, however, the reported QTL on linkage group D1a+Q, identified by BARC_Satt129, failed to show an association with the glycitein amount in the subpopulation of 60. We expect this is caused by sampling error in a small population not by changes in isoflavone amount due to storage.
Five of the eight regions were found to control soybean seed glycitein content, four controlled seed daidzein content, and two controlled genistein. Two loci controlled two traits. The new region defined by the marker BARC_Satt063 and located on linkage group B2 controlled both seed genistein and seed daidzein. The region located on linkage group B1 and defined by the markers BARC_Satt197, Satt251 and Satt415 controlled both seed glycitein and total glycitein contents. These two regions had a consistently strong effect on soybean seed genistein, daidzein, and glycitein contents and could be candidates for positional gene isolation [33].
Considering the possibility of interacting genes and QTL (Figure 3), we examined the Soybase for candidates in the intervals associated with seed isoflavone content. Associations of the loci with other traits were noted. The region located on linkage group N defined by the marker BARC_Satt080, significantly associated with daidzein [22], was also reported to contain a QTL for soybean sudden death syndrome and the pod gene L2 [21]. The region located on linkage group N defined by the marker BARC_Satt237, significantly associated with glycitein [22], was also reported to contain three seed storage protein genes Gy1, Gy2, and Gy6 [3]. The region located on linkage group K, identified by the marker BARC_Satt337, and significantly associated with daidzein, was also found to be associated with high soybean yield [34]. The region located on linkage group H defined by the marker BARC_Satt237, significantly associated with glycitein and genistein [22], was also reported to contain two genes controlling pubescense density and seed hydroperoxide lyase.
Figure 3.

A partial diagram of the phenylpropanoid pathway showing intermediates and enzymes involved in isoflavone synthesis, as well as some branched pathways. The enzymes in bold are encoded by genes expressed as transgenes in Yu et al [46]. Genes encoding the underlined enzymes have been shown to be activated in maize by C1 and R. Dotted arrows represent multiple steps. Enzymes are indicated in italics (adapted from [24, 46]). Glycitein (a glyceollin) is hypothesized to be made from daidzein in a multistep process (hydroxylation, oxidation, and acetylation) see Figure 4.
QTL for resistance to sclerotinia stem rot [35], iron efficiency [36], were identified and mapped 5% cM from the QTL identified by the marker BARC_Satt129 on L.G. D1a+Q. QTL for plant height [37] and lodging [38] were also identified and mapped 20 and 40 cM, respectively, from the same region. At 5 cM around the region, on L.G. B2, a gene for linolenic acid amount in seed, QTL for iron efficiency of plants [39] and oleic acid amount in seed [40] were identified and mapped. No evidence for logical relationships between the QTL for seed isoflavone and the other traits could be inferred (Figure 3) although several seed trait genes and QTL seemed clustered with the isoflavone QTL. No evidence for ESTs that encoded enzymes in the biosynthetic pathways (Figure 3) mapping to the eight intervals was found (in October 2003).
The detection of QTL with large effects for glycitein and daidzein content and fewer QTL with smaller effects for genistein content of soybean may reflect the heritability, environmental stability [22, 36], or the number of loci controlling the traits. Glycitein has been shown to be an active phytoestrogen [41], in some assays exceeding the activity of genistein. Therefore, increased glycitein amounts in seed can have a utility. The ability to stabilize [31] phytoestrogen amount is important to soybean value (Table 3). The ability to manipulate both profile and total isoflavone content of soybean using the eight markers reported here and at the same time manipulate the amounts of other bioactive factors [3, 42, 43, 44] will become increasingly important. Improved soybean varieties that produce high amounts of beneficial chemicals can lead both to new understanding of and new types of nutraceuticals and dietary supplements [45, 46].
ACKNOWLEDGMENT
This research was funded in part by a Grant from the NSF 9872635, ISPOB 02-127-03, and CFAR. The continued support of SIUC, College of Agriculture, and Office of the Vice Chancellor for Research to MJI is highly appreciated. We thank Dr. Patricia Murphy for assistance with the isoflavone analysis. We thank Jeffry Shultz and Kanokporn Triwitayakorn for assistance with marker mapping and data replication and analysis.
References
- 1.Huang M.T, Ferraro T. Phenolic compounds in food and cancer prevention. In: Huang M.T, Ho C.T, Lee C.Y, editors. Phenolic Compounds in Food and Their Effects on Health II. Washington, DC: American Chemical Society Press; 1992. pp. 8–34. [Google Scholar]
- 2.Cassady J.M, Baird W.M, Chang C.J. Natural products as a source of potential cancer chemotherapeutic and chemopreventive agents. J Nat Prod. 1990;53(1):23–41. doi: 10.1021/np50067a003. [DOI] [PubMed] [Google Scholar]
- 3.Bringe N.A. High beta-conglycinin products and their use.US patent 6 171 640. 2001 [Google Scholar]
- 4.Peterson T.G, Barnes S. Genistein and biochanin A inhibit the growth of human prostate cancer cells but not epidermal growth factor receptor tyrosine autophosphorylation. Prostate. 1993;22(4):335–345. doi: 10.1002/pros.2990220408. [DOI] [PubMed] [Google Scholar]
- 5.Konoshima T, Okamoto E, Kozuka M, Nishino H, Tokuda H, Tanabe M. Studies on inhibitors of skin tumor promotion, III. Inhibitory effects of isoflavonoids from Wisteria brachybotrys on Epstein-Barr virus activation. J Nat Prod. 1988;51(6):1266–1270. doi: 10.1021/np50060a038. [DOI] [PubMed] [Google Scholar]
- 6.Fotsis T, Pepper M, Adlercreutz H, et al. Genistein, a dietary-derived inhibitor of in vitro angiogenesis. Proc Natl Acad Sci USA. 1993;90(7):2690–2694. doi: 10.1073/pnas.90.7.2690. [DOI] [PMC free article] [PubMed] [Google Scholar]
- 7.Barnes S, Grubbs C, Setchell K.D.R, Carlson J. Soybeans inhibit mammary tumors in rat models of breast cancer. In: Pariza M.W, Aeschbacher H-U, Fleton J.S, Sato S, editors. Mutagens and Carcinogens in the Diet. New York, NY: Wiley-Liss; 1990. pp. 239–253. [Google Scholar]
- 8.Jing Y, Nakaya K, Han R. Differentiation of promyelocytic leukemia cells HL-60 induced by daidzein in vitro and in vivo. Anticancer Res. 1993;13(4):1049–1054. [PubMed] [Google Scholar]
- 9.Barnes S, Peterson T.G, Grubbs C, Setchell K.D.R. Potential role of dietary isoflavones in the prevention of cancer. In: Jacobs M.M, editor. Diet and Cancer: Markers, Prevention, and Treatment. New York, NY: Plenum Press; 1994. pp. 135–147. [DOI] [PubMed] [Google Scholar]
- 10.Morrissey C, Watson R.W. Phytoestrogens and prostate cancer. Curr Drug Targets. 2003;4(3):231–241. doi: 10.2174/1389450033491154. [DOI] [PubMed] [Google Scholar]
- 11.Munro I.C, Harwood M, Hlywka J.J, et al. Soy isoflavones: a safety review. Nutr Rev. 2003;61(1):1–33. doi: 10.1301/nr.2003.janr.1-33. [DOI] [PubMed] [Google Scholar]
- 12.Adlercreutz H. Phytoestrogens and breast cancer. J Steroid Biochem Mol Biol. 2002;83(1–5):113–118. doi: 10.1016/s0960-0760(02)00273-x. [DOI] [PubMed] [Google Scholar]
- 13.Banz W.J, Williams M.P, Lightfoot D.A, Winters T.A. The effects of soy protein and soy phytoestrogens on symptoms associated with cardiovascular disease in rats. J Med Food. 1999;2(3-4):271–273. doi: 10.1089/jmf.1999.2.271. [DOI] [PubMed] [Google Scholar]
- 14.Cassidy A, Bingham S, Setchell K.D.R. Biological effects of a diet of soy protein rich in isoflavones on the menstrual cycle of premenopausal women. Am J Clin Nutr. 1994;60(3):333–340. doi: 10.1093/ajcn/60.3.333. [DOI] [PubMed] [Google Scholar]
- 15.Anderson J.W, Johnstone B.M, Cook-Newell M.E. Meta-analysis of the effects of soy protein intake on serum lipids. N Engl J Med. 1995;333(5):276–282. doi: 10.1056/NEJM199508033330502. [DOI] [PubMed] [Google Scholar]
- 16.Messina M, Barnes S. The role of soy products in reducing risk of cancer. J Natl Cancer Inst. 1991;83(8):541–546. doi: 10.1093/jnci/83.8.541. [DOI] [PubMed] [Google Scholar]
- 17.Anthony M.S, Clarkson T.B, Hughes C.L. Jr, Morgan T.M, Burke G.L. Soybean isoflavones improve cardiovascular risk factors without affecting the reproductive system of peripubertal rhesus monkeys. J Nutr. 1996;126(1):43–50. doi: 10.1093/jn/126.1.43. [DOI] [PubMed] [Google Scholar]
- 18.Greer-Baney J.A, Banz W.J, Lightfoot D.A, Winters T.A. Dietary soy protein and soy isoflavones: a histological examination of reproductive tissues in rats. J Med Food. 1999;2(3-4):247–249. doi: 10.1089/jmf.1999.2.247. [DOI] [PubMed] [Google Scholar]
- 19.Adams N.R. Detection of the effects of phytoestrogens on sheep and cattle. J Anim Sci. 1995;73(5):1509–1515. doi: 10.2527/1995.7351509x. [DOI] [PubMed] [Google Scholar]
- 20.Knight D.C, Eden J.A. A review of the clinical effects of phytoestrogens. Obstet Gynecol. 1996;87(5):897–904. [PubMed] [Google Scholar]
- 21.Eldridge A.C, Kwolek W.F. Soybean isoflavones: effect of environment and variety on composition. J Agric Food Chem. 1983;31(2):394–396. doi: 10.1021/jf00116a052. [DOI] [PubMed] [Google Scholar]
- 22.Meksem K, Njiti V.N, Banz W.J, et al. Genomic regions that underlie soybean seed isoflavone content. J Biomed Biotechnol. 2001;1(1):38–44. doi: 10.1155/S1110724301000110. [DOI] [PMC free article] [PubMed] [Google Scholar]
- 23.Akashi T, Aoki T, Ayabe S. Cloning and functional expression of a cytochrome P450 cDNA encoding 2-hydroxyisoflavanone synthase involved in biosynthesis of the isoflavonoid skeleton in licorice. Plant Physiol. 1999;121(3):821–828. doi: 10.1104/pp.121.3.821. [DOI] [PMC free article] [PubMed] [Google Scholar]
- 24.Jung W, Yu O, Lau S.M, et al. Identification and expression of isoflavone synthase, the key enzyme for biosynthesis of isoflavones in legumes. Nat Biotechnol. 2000;18(2):208–212. doi: 10.1038/72671. [DOI] [PubMed] [Google Scholar]
- 25.Hnetkovsky N, Chang S.J.C, Doubler T.W, Gibson P.T, Lightfoot D.A. Genetic mapping of loci underlying field resistance to soybean sudden death syndrome (SDS) Crop Sci. 1996;36(2):392–400. [Google Scholar]
- 26.Cregan P.B, Jarvik T, Bush A.L, et al. An integrated genetic linkage map of the soybean genome. Crop Sci. 1999;39:1464–1490. [Google Scholar]
- 27.Lightfoot D.A. Genomic techniques for isolating genes underlying QTL: disease resistance. Agric Biotech Net. 2001;3:1–4. [Google Scholar]
- 28.Kassem My A. A microsatellite marker genetic map in a soybean recombinant inbred line population of Essex × Forrest. Ph.D. thesis. Carbondale, Ill, USA: Southern Illinois University at Carbondale; 2003. [Google Scholar]
- 29.Webb D.M, Baltazar B.M, Rao-Arelli A.P, et al. Genetic mapping of soybean cyst-nematode race-3 resistance loci in soybean PI 437.654. Theor Appl Genet. 1995;91:574–581. doi: 10.1007/BF00223282. [DOI] [PubMed] [Google Scholar]
- 30.Shoemaker R.C, Specht J.E. Integration of the soybean molecular and classical genetic linkage groups. Crop Sci. 1995;35:436–446. [Google Scholar]
- 31.Wang H, Murphy P.A. Isoflavone composition of American and Japanese soybeans in Iowa: effects of variety, crop year, and location. J. Agric Food Chem. 1994;42:1674–1677. [Google Scholar]
- 32.Tsukamoto C, Shimada S, Igita K, et al. Factors affecting isoflavone content in soybean seeds: changes in isoflavones, saponins, and composition of fatty acids at different temperatures during seed development. J Agric Food Chem. 1995;43:1184–1192. [Google Scholar]
- 33.Wu C, Sun S, Nimmakayala P, et al. A BAC- and BIBAC-based physical map of the soybean genome. Genome Research. 2004;14(2):319–326. doi: 10.1101/gr.1405004. [DOI] [PMC free article] [PubMed] [Google Scholar]
- 34.Yuan Z, Njiti V, Meksem K, et al. Identification of yield loci in soybean populations that segregate for disease resistance. Crop Sci. 2002;42(1):271–277. doi: 10.2135/cropsci2002.2710. [DOI] [PubMed] [Google Scholar]
- 35.Arahana V.A, Graef G.L, Specht J.E, Steadman J.R, Eskridge K.M. Identification of QTLs for resistance to Sclerotinia sclerotiorum in soybean. Crop Sci. 2001;41:180–188. [Google Scholar]
- 36.Diers B.W, Cianzio S.R, Shoemaker R.C. Possible identification of quantitative trait loci affecting iron efficiency in soybean. J Plant Nut. 1992;15(10):2127–2136. [Google Scholar]
- 37.Lark K.G, Chase K, Adler F, Mansur L.M, Orf J.H. Interactions between quantitative trait loci in soybean in which trait variation at one locus is conditional upon a specific allele at another. Proc Natl Acad Sci USA. 1995;92(10):4656–4660. doi: 10.1073/pnas.92.10.4656. [DOI] [PMC free article] [PubMed] [Google Scholar]
- 38.Orf J.H, Chase K, Jarvik T, et al. Genetics of soybean agronomic traits: I. comparison of three related recombinant inbred populations. Crop Sci. 1999;39(6):1642–1651. [Google Scholar]
- 39.Lin S.F, Baumer J, Ivers D, Cianzio S, Shoemaker R.C. Nutrient solution screening of Fe chlorosis resistance in soybean evaluated by molecular characterization. J Plant Nut. 2000;23:1915–1928. [Google Scholar]
- 40.Diers B.W, Shoemaker R.C. Restriction fragment length polymorphism analysis of soybean fatty acid content. J Am Oil Chem Soc. 1992;69(12):1242–1244. [Google Scholar]
- 41.Song T.T, Hendrich S, Murphy P.A. Estrogenic activity of glycitein, a soy isoflavone. J Agric Food Chem. 1999;47(4):1607–1610. doi: 10.1021/jf981054j. [DOI] [PubMed] [Google Scholar]
- 42.Cho Y, Njiti V.N, Chen X, et al. Quantitative trait loci associated with foliar trigonelline accumulation in glycine max L. J Biomed Biotechnol. 2002;2(3):151–157. doi: 10.1155/S1110724302204039. [DOI] [PMC free article] [PubMed] [Google Scholar]
- 43.Meijer G.W, Bressers M.A, de Groot W.A, Rudrum M. Effect of structure and form on the ability of plant sterols to inhibit cholesterol absorption in hamsters. Lipids. 2003;38(7):713–721. doi: 10.1007/s11745-003-1119-4. [DOI] [PubMed] [Google Scholar]
- 44.Iqbal J, Afzal J, Yaegashi S, et al. A pyramid of loci for partial resistance to Fusarium solani f. sp. glycines maintains Myo-inositol-1-phosphate synthase expression in soybean roots. Theor Appl Genet. 2002;105(8):1115–1123. doi: 10.1007/s00122-002-0987-0. [DOI] [PubMed] [Google Scholar]
- 45.Iqbal M.J, Yaegashi S, Ahsan R, Lightfoot D.A, Banz W.J. Differentially abundant mRNAs in rat liver in response to diets containing soy protein isolate. Physiol Genomics. 2002;11(3):219–226. doi: 10.1152/physiolgenomics.00078.2002. [DOI] [PubMed] [Google Scholar]
- 46.Yu O, Jung W, Shi J, et al. Production of the isoflavones genistein and daidzein in non-legume dicot and monocot tissues. Plant Physiol. 2000;124(2):781–794. doi: 10.1104/pp.124.2.781. [DOI] [PMC free article] [PubMed] [Google Scholar]