

Abstract
We determined global transcriptional responses of Escherichia coli K-12 to sulfur (S)- or nitrogen (N)-limited growth in adapted batch cultures and cultures subjected to nutrient shifts. Using two limitations helped to distinguish between nutrient-specific changes in mRNA levels and common changes related to the growth rate. Both homeostatic and slow growth responses were amplified upon shifts. This made detection of these responses more reliable and increased the number of genes that were differentially expressed. We analyzed microarray data in several ways: by determining expression changes after use of a statistical normalization algorithm, by hierarchical and k-means clustering, and by visual inspection of aligned genome images. Using these tools, we confirmed known homeostatic responses to global S limitation, which are controlled by the activators CysB and Cbl, and found that S limitation propagated into methionine metabolism, synthesis of FeS clusters, and oxidative stress. In addition, we identified several open reading frames likely to respond specifically to S availability. As predicted from the fact that the ddp operon is activated by NtrC, synthesis of cross-links between diaminopimelate residues in the murein layer was increased under N-limiting conditions, as was the proportion of tripeptides. Both of these effects may allow increased scavenging of N from the dipeptide d-alanine-d-alanine, the substrate of the Ddp system.
In this study, we explored the global transcriptional responses of a robust wild-type strain of Escherichia coli K-12, NCM3722 (44), to nitrogen (N) or sulfur (S) limitation. Previous studies showed that enteric bacteria apparently perceive external N limitation as a decrease in the free pool concentration of glutamine (16). Their first transcriptional response is to increase expression of genes under control of nitrogen regulator C (NtrC, also called GlnG) (32). Global studies of NtrC-mediated responses with appropriate mutant strains indicated that many members of the NtrC regulon allow cells to scavenge for traces of ammonium, the preferred N source, and for alternative sources of N (61). NtrC, which works in conjunction with the σ54 holoenzyme form of RNA polymerase, also activates transcription of the gene for a second regulator, Nac (30). Nac, in turn, stimulates transcription by the σ70 holoenzyme in the absence of a ligand other than DNA (36). These regulators mediate homeostatic responses to N limitation, responses that minimize the slowing of growth.
Perceiving S limitation involves at least three primary metabolites: sulfide, the reduction product of sulfate, which is used for cysteine biosynthesis; N-acetylserine, a signal that is derived nonenzymatically from O-acetylserine, the only (non-S-containing) precursor of cysteine; and adenosine 5′-phosphosulfate (APS), the first intermediate in sulfate assimilation (4, 20). There is evidence that the free pool concentrations of sulfide and APS decline under S-limiting conditions and that the pool concentration of N-acetylserine is elevated. Elegant studies performed in several laboratories have shown that two regulators, CysB and Cbl (CysB-like), mediate homeostatic responses to S limitation (17, 18, 20, 54). These responses allow E. coli to scavenge for traces of cysteine and sulfate, the preferred sources of S, and for alternative S sources, such as the cysteine-containing peptide glutathione and various alkane sulfonates, including taurine (2-aminoethane sulfonate). Like NtrC for N, CysB is the primary regulator of homeostatic responses for S (uppermost in the control cascade) and is required for synthesis of Cbl (17). Both regulators, which are primarily activators, control transcription by the σ70 holoenzyme form of RNA polymerase, and both are responsive to ligands. CysB is positively controlled by N-acetylserine and negatively controlled by sulfide or thiosulfate (20), and Cbl is negatively controlled by APS (4). Interestingly, the cbl gene lies just downstream of nac. Although it is transcribed from its own CysB-controlled promoter under S-limiting conditions, cbl is apparently transcribed from the nac promoter under N-limiting conditions (61). The physiological rationale for expression of Cbl under N-limiting conditions is not yet clear.
Using several means of analyzing glass slide DNA microarray data, here we expanded studies of homeostatic responses to general S and N limitation. We found that S limitation propagates from cysteine downstream to methionine metabolism and apparently to synthesis of FeS clusters. Propagation of transcriptional effects to methionine biosynthetic and scavenging genes apparently occurs largely through the methionine repressor MetJ as a consequence of depletion of the pool of its corepressor, S-adenosylmethionine (SAM) (10). We also found that a change in murein metabolism predicted from microarray studies occurs under N-limiting conditions (61).
MATERIALS AND METHODS
Bacterial strains and growth conditions.
NCM3722, a prototrophic E. coli K-12 strain, does not have the growth defects of MG1655 (44) and was therefore used to analyze global changes in gene expression during N- and S-limited growth. The glnL2302 [glnL(Up)] (5) and glnG::Tn5 (1) alleles were transferred to NCM3722 as described by Zimmer et al. (61) to generate strains NCM3876 and NCM3877, respectively. An ethanolamine-utilizing derivative of NCM3722 (NCM3754) was obtained as described by Soupene et al. (44).
For DNA microarray studies with the glnL(Up) (NCM3876) and glnG::Tn5 (NCM3877) strains, the cells were grown with aeration at 37°C to the mid-exponential phase on N−C− minimal medium (11) with 0.4% glycerol as the carbon source and 10 mM ammonium chloride as the N source. To study global responses to N limitation, NCM3722 was grown with aeration at 37°C to the mid-exponential phase on N−C− minimal medium with 0.4% glycerol as the carbon source and with 10 mM N provided as either ammonium chloride (N excess), ethanolamine hydrochloride (N limited), or arginine (N limited). When ethanolamine was used as the N source, the medium was supplemented with cyanocobalamin (0.2 μM), because vitamin B12 is essential for aerobic utilization of ethanolamine (19). For N downshift, cells were grown on N−C− minimal medium containing 0.4% glycerol and 1 mM NH4Cl plus 2.5 mM arginine as N sources. Based on the growth yield from 1 mM NH4Cl, we estimated that the shift would occur at an optical density at 600 nm (OD600) of ∼0.4, and we harvested cells 10 and 30 min after this point. For N upshift, cells were grown on the same medium but with 2.5 mM arginine as the sole N source. They were shifted up by addition of 10 mM NH4Cl. In each case cells were grown on the preshift medium for at least 10 generations prior to the shift.
For experiments involving S limitation, N−C− medium was modified to remove the sulfur. MgCl2 replaced the MgSO4 at the same concentration. Sulfur was provided in the form of 0.25 mM K2SO4 (S excess), 0.25 mM taurine (S limited), or 0.25 mM glutathione (S limited). For S downshift, cells were grown on S-free N−C− minimal medium containing 0.4% glycerol, 10 mM NH4Cl, and 20 μM K2SO4 plus 0.25 mM glutathione as S sources. Based on the growth yield from 20 μM K2SO4, we estimated that the shift would occur at an OD600 of ∼0.45, and we harvested cells 30 min after this point. For upshift, cells were grown in the same medium but with 0.25 mM glutathione as the sole S source and were shifted up by addition of 0.25 mM K2SO4. As described above for N shifts, cells were grown on the preshift medium for at least 10 generations.
Microarray procedure.
For experiments involving cells adapted to a particular N or S source, cells were harvested at an OD600 of ∼0.4 with 0.1 volume of 5% phenol in ethanol (25). For nutrient shift experiments samples were taken before the shift and at different times after the down- or upshift, as indicated below. RNA extraction, synthesis of cDNAs containing fluorescent nucleotide analogues, hybridization to glass slide DNA microarrays, and fluorescence scanning were done as described previously (44, 56, 61). For each genome print a total of 20 to 30 μg of total RNA was labeled with either Cy3-dUTP (cells grown on ammonium or sulfate) or Cy5-dUTP (cells grown on ethanolamine, arginine, taurine, or glutathione). RNA isolated from cells collected prior to nutrient shifts was labeled with Cy3-dUTP, and RNA isolated from postshift cells was labeled with Cy5-dUTP. To visualize spots of a microarray in genome order, images representing the Cy3 and Cy5 fluorescence intensities of spots were cut from a portable network graphic file and ordered from left to right and from top to bottom according to their b numbers (3) to provide a genome image (60, 61).
Statistical analysis.
Normalization and statistical analysis of the raw GPR data files, generated in the GenePix 3.X software program, were carried out in the R statistical programming environment (15) loaded with the microarray analysis modules sma and com.braju.sma (available at http://www.braju.com/R/). A custom script was written to automate the process and is available at http://nature.berkeley.edu/∼opaliy/papers/NutrientLimitation.html. Our normalization approach adjusted for the presence of systematic nuisance variation in the microarray data. In particular, experience has shown that the red/green intensity ratio varies globally with the magnitude of gene expression on any given cDNA slide, regardless of which genes are truly differentially expressed (58). Furthermore, the specific form of this dependence is unique to each slide; it results from idiosyncrasies of the slide manufacturing process and the hybridization assay. We therefore estimated this effect on a per-slide basis using lowess curves and subtracted it from the intensity ratios before searching for differentially expressed genes. To improve this correction, we estimated the effect separately for each print tip used to fabricate a given slide. This was followed by across-genome-print normalization for all repetitions of a given experiment (e.g., comparison of arginine to ammonium as the N source). These adjustments addressed the major known biases in cDNA microarray data sets so that differential expression could be more meaningfully assessed. Normalizing lowess curves should ideally be computed by using just the nondifferentially expressed genes. Since the goal of the analysis was to establish differential expression, this ideal requirement was circular; an approximate solution was to use all genes, since only a small fraction of the genes were expected to be differentially expressed. In some cases, this approximation broke down. Specifically, in some experiments a large fraction of all highly expressed (high A-value) genes, such as those coding for ribosomal proteins, were expected to be differentially expressed. In these cases we excluded these genes from the calculation of the lowess normalization lines. This was achieved by supplying a user-defined list of genes known to be both highly and differentially expressed under the given experimental conditions or, for experiments in which this was not practicable, by excluding the top 1% of the genes by A-value. Such excluded genes were nevertheless normalized after the lowess function was determined. A number of scatter and box plots were also created to inspect the data distribution and verify the normalization visually. For each gene a classical t-statistic or variance-adjusted mean was computed from the normalized M observations across genome prints. Variance estimates that were less than 0.03 were set to 0.03 to prevent excessively large t values. We did not view this statistic from the standpoint of formally testing a zero-mean null hypothesis; no useful and valid null distribution could be chosen based on the two to six replicate M values obtained for each gene. Instead, the absolute t-statistic values allowed us to rank genes by the magnitude of observed differential expression while also making approximate adjustments for the noisiness of the M observations; the amount of noisiness varied across genes. Subsequent investigation led to the generation of two different gene lists: (i) a list of all genes with |M| ≥ 1 and (ii) a list of all genes with |M| ≥ 0.765 but < 1 and |t| ≥ 3. The genes from both lists combined were considered differentially expressed under the two conditions being compared. Note that the first list included all genes with estimated twofold or greater differential expression under the conditions being compared, regardless of the across-slide variability in the estimate. Ignoring the variability increased the chance of detecting genes that were highly induced or repressed but increased the number of false positives. This less conservative approach was valuable because the next steps in the analysis, which involved clustering of genes that are putatively differentially expressed and visual inspection of genome images, were exploratory.
Clustering analysis.
Clustering analysis and visualization were done in Genesis v1.3.0 (48). The output values obtained after we ran the R-based normalization script for each set of comparisons were used to create the input data matrices. red/green ratios were log2 transformed, and blank values were filled in by the k-nearest-neighbors algorithm (k = 11) in significance analysis of microarrays (SAM) (53). When a comparison of two samples was done with several genome replicas and slides, each genome replica was treated as a separate experiment. Overall, the data matrix consisted of 18 genome prints from nine experiments and 4,184 genes for comparisons of adapted cultures and of 16 genome prints from eight experiments and 4,184 genes for growth transition comparisons. For both agglomerative hierarchical clustering and k-means clustering, which is a divisive method rather than an agglomerative method, the values that constitute the expression profile for a single gene in the experiments being considered are taken as a series of coordinates that define a vector (43). Agglomerative hierarchical clustering was carried out by using the Euclidean distance measure (which measures the absolute distance between two points in n-dimensional space and depends on the magnitude of expression changes); the average linkage method was utilized to connect gene clusters (6). For k-means clustering (7, 43) the same distance measure was used. Briefly, the k-means algorithm partitions the genes into k discrete clusters based on their expression. The number k is preselected by the user. At the outset the reference vector for each cluster is initialized randomly, and all genes are partitioned to their closest reference vector. The reference vector for each resulting cluster of genes is then recalculated as the average for all genes in the cluster. These two steps are repeated until convergence is reached. Our choice of k is discussed below. Additional figures of clustering output together with data matrices are available at http://nature.berkeley.edu/∼opaliy/papers/NutrientLimitation.html.
Murein analysis.
Strain NCM3722 was grown aerobically at 37°C in N−C− minimal medium with 0.4% glycerol as the C source and ammonium chloride (10 mM) or arginine (2.5 mM) as the N source. Strains NCM3285 and NCM3292 were grown on ammonium as the N source. Peptidoglycan was isolated essentially as described previously (9). In each case the final pellet from 9 liters of culture harvested at an OD600 of 0.4 was suspended in a small volume of water. Pellets of NCM3722 (∼700 mg) were suspended in 2.5 ml, and pellets of the other two strains (∼800 mg) were suspended in 2.0 ml. Muropeptides were separated and quantified as described by Glauner (9). They were identified based on the relative elution times, by amino acid analysis, and by matrix-assisted laser desorption ionization mass spectrometry.
RESULTS
Data analysis.
Data were analyzed by visual inspection of genome images (60) (Fig. 1 and 2), numerical analysis (Fig. 3 and 4), k-means clustering (Fig. 5 and 6), and agglomerative hierarchical clustering (http://nature.berkeley.edu/∼opaliy/papers/NutrientLimitation.html) (see Materials and Methods). Clustering was performed separately for cultures adapted to particular N or S availability conditions (18 genome prints from nine experiments) and for cultures subjected to shifts between the two conditions (16 genome prints). Each form of analysis had particular advantages, which we point out below in connection with specific examples.
FIG.1.

Four aligned genome images showing transcriptional responses of strain NCM3722 (or its Eut+ derivative NCM3954) to N or S limitation in adapted batch cultures. Row 1 (NCM3954), cells grown on ethanolamine (Cy5 label, red) versus cells grown on ammonium (Cy3 label, green); row 2, cells grown on arginine (red) versus cells grown on ammonium (green); row 3, cells grown on taurine (red) versus cells grown on sulfate (green); row 4, cells grown on glutathione (red) versus cells grown on sulfate (green). Glass slide DNA microarrays were probed with mixtures of appropriately labeled cDNAs as described in Materials and Methods. Spots from fluorescent scanning images of microarrays were arranged in genome order to generate the genome images (60, 61). The b number groups are indicated on the left. Blanks represent b numbers that either do not correspond to ORFs or no longer exist. Easily visible red spots are discussed in the text, and green spots will be discussed elsewhere. The eut operon extends from b2437 through b2462 but is interrupted by b2442 to b2450 (3, 44). Spots for b2438, b2440, b2455, and b2458 were problematic (44).
FIG. 2.

Four aligned genome images showing transcriptional responses of strain NCM3722 after an S downshift (rows 1 and 2) or upshift (rows 3 and 4). Rows 1 and 2, shift from sulfate (green) to glutathione (red); rows 3 and 4, shift from glutathione (green) to sulfate (red). Samples were taken before the shift and 30 min after the shift and were treated as described in the legend to Fig. 1. In each case two prints from the same slide are shown. Easily visible red and green spots are discussed in the text. Note the opposite responses to the S downshift and upshift.
FIG. 3.

Venn diagram summarizing the numerical analysis of the effects of N and S availability on transcription (mRNA levels) in strain NCM3722 (and Eut+ strain NCM3954 for comparison of ethanolamine to ammonium). The numbers in all panels indicate the numbers of genes with higher expression under nutrient-limiting conditions than under nutrient-excess conditions, and the numbers in panel C also include the numbers of genes with lower expression after a nutrient upshift (determined as described in Materials and Methods). The numbers in yellow ovals are the numbers of genes in Table 1 (S-related genes), the numbers in green ovals are the numbers of NtrC/Nac-regulated genes (61), and the numbers in blue ovals are the numbers of known RpoS-controlled genes (26). (A) Comparison of taurine (Tau) to sulfate (left circle) and comparison of ethanolamine (EtNH2) to ammonium (right circle). (B) Comparison of glutathione (GSH) to sulfate (left circle) and comparison of arginine (Arg) to ammonium (right circle). (C) Comparison of S down- and upshift (S shift) to preshift samples (left circle) and comparison of N down- and upshift to preshift samples (right circle). The large circles and regions of overlap between them are not drawn to scale. The common gene in yellow and green ovals in panel A is cbl (b1987). The common genes in the green oval in panel B are ompF (b0929), yeaG (b1783), and ygiG (b3073). The gene in the green oval for glutathione is cbl, which is also included in the genes in the yellow oval. This gene failed to make the cutoff for a common gene in panel B because the average red/green ratio on arginine versus ammonium was 1.6. The red/green ratio for cbl in the experiment shown in Fig. 1, row D, was 3.2. The common gene in the yellow oval in panel C is cbl; the common genes in the green oval are cbl, nac (b1988), glnH (b0811), oppA (b1243), and yeaG. The gene in the green oval for S shifts is ompF.
FIG. 4.
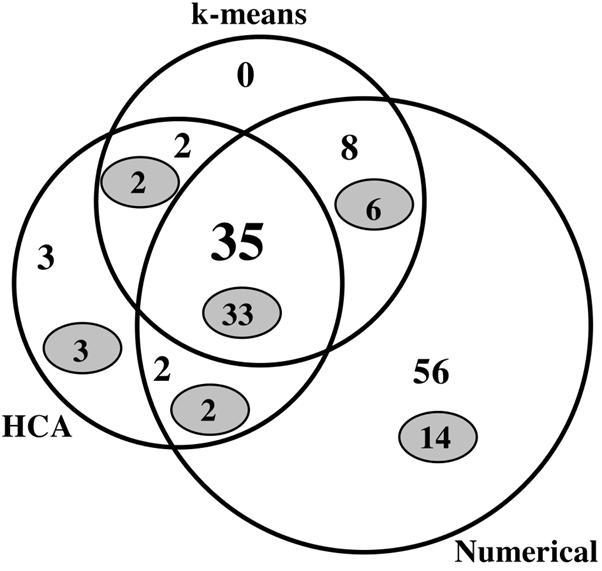
Venn diagram summarizing various means of analysis of S shift experiments. The numbers indicate the numbers of genes with higher expression (mRNA levels) after a downshift and/or lower expression after an upshift. As indicated, these genes were detected numerically (see Materials and Methods), by k-means clustering, or by agglomerative hierarchical clustering (HCA) (see text). The numbers in grey ovals indicate the numbers of genes in Table 1. The circles and regions of overlap are not drawn to scale.
FIG. 5.

k-means clusters containing NtrC/Nac-regulated genes. Clusters were obtained by analysis of data from adapted batch cultures of NCM3722 (18 genome prints) (A and B) or cultures subjected to nutrient shifts (16 genome prints) (C and D). The experiments are indicated on the x axis, and the log ratios of expression are indicated on the y axis. The green lines show data for individual genes, and the pink and black lines show averages. The blue lines in panel B show data for eut genes (see text). In panels A and B, the log ratios are values for a comparison of nutrient-limiting conditions to excess conditions. In panels C and D, the log ratios are values for a comparison of data obtained after the shift with data obtained before the shift. The numbers on the x axis indicate the times (in minutes) after the shift at which the samples were taken.
FIG. 6.

k-means clusters containing S-related genes (see text). For an explanation of the analysis see the legend to Fig. 5. (A) Adapted cultures. (B) Cultures subjected to a shift.
We focused on k-means rather than hierarchical clustering because we believe that it is less familiar to bacterial and archaeal biologists (but see reference 51). By first examining genome images (Fig. 1 and 2), we decided to use about a dozen clusters (k). This number seemed to be sufficient because the average expression patterns were distinct for genes in only about one-half of the clusters (seven clusters for batch culture experiments and six clusters for shift experiments) (Fig. 5 and 6). Moreover, increasing the number of clusters specified for shift experiments to 15 yielded no additional cluster with a new average expression pattern, and doing this for batch culture experiments yielded only one additional cluster with a new average expression pattern, which contained the ethanolamine utilization (eut) genes (see below). We analyzed genes in all clusters with distinct average expression patterns. By contrast, the expression changes for genes in the remaining clusters, which contained ∼3,850 genes for adapted cultures and ∼3,700 genes for cultures subjected to shifts, were very small (http://nature.berkeley.edu/∼opaliy/papers/NutrientLimitation.html). We did not consider these clusters, which contained more than 85% of the total genes, further.
Homeostatic responses to N limitation.
To explore homeostatic responses to N limitation in wild-type strain NCM3722, we performed two sorts of experiments. These experiments were designed to see whether we could identify transcriptional responses that were mediated by NtrC and Nac and to determine whether there were additional responses that did not depend on these primary regulators. First, we compared the gene expression in batch cultures adapted to poor N sources to the gene expression in cultures on ammonium, and then we compared the expression in cultures shifted between the two conditions. Prior to undertaking these studies, we verified that the NtrC regulon was the same in the NCM3722 background as in the MG1655 (CGSC 6300) background. These studies are described in detail below.
To check the NtrC regulon in the NCM3722 background, we introduced into this strain the same glnL(Up) [ntrB(Con)] and glnG::Tn5 (ntrC::Tn5) lesions that we used previously (61). We then compared the gene expression patterns in the resulting mutant strains, NCM3876 and NCM3877, respectively, when each strain was grown on ammonium as the sole N source (data not shown). NCM3876 overexpressed genes under NtrC control, whereas NCM3877 failed to express these genes. With two exceptions (gltIJKL [b0652 to b0655] and glnHPQ [b0809 to b0811]), differences in expression verified that the NtrC regulon was the same in NCM3722 and MG1655 (CGSC 6300). In total, there appeared to be 23 operons in the regulon. Previous studies indicated that 14 of these operons are activated directly by NtrC and nine are activated by Nac. The operons contain a total of 68 genes.
To study the responses of NCM3722 to N limitation in adapted batch cultures, we determined differences in gene expression between cells grown on ethanolamine or arginine as the N source and cells grown on ammonium (Fig. 1 rows 1 and 2). The doubling times on ethanolamine, arginine, and ammonium as N sources were 70, 230, and 60 min, respectively. For a comparison between ethanolamine and ammonium we used a spontaneous ethanolamine-utilizing derivative of NCM3722 which had apparently lost an insertion in the eut operon (44). There were 28 genes whose mRNA levels were >1.7-fold higher on ethanolamine than on ammonium and whose expression levels were not higher on the alternative S source taurine than on sulfate (see below) (Fig. 3A, right circle). Thirteen of these genes (green oval) were in 11 operons previously determined to be activated by NtrC or Nac. Together, the 11 operons (eight operons controlled by NtrC and three operons controlled by Nac) contained 34 genes. Hence, there was statistical support for changes in expression of only a minority of the genes in these operons. Thirteen genes of the ethanolamine utilization operon eut (b2437 to b2462), which is controlled specifically by ethanolamine and vitamin B12 and not by NtrC (19), were also more highly expressed (Fig. 1, row 1) (44). Only two of the genes that were more highly expressed on ethanolamine than on ammonium were not NtrC or Nac controlled or members of the eut operon. One of these genes, asnB (b0674), codes for the glutamine-dependent asparagine synthase that is required for growth under N-limiting conditions (38). The significance of the other gene, asr (b1597), which codes for a periplasmic acid shock protein (42), is not clear. For cells grown on arginine (Fig. 1, row 2), 36 genes had mRNA levels that were>1.7-fold higher than the levels for cells grown on ammonium but not for cells grown on the alternative S source glutathione versus sulfate (Fig. 3B, right circle). Although 21 of these genes were members of the NtrC regulon (green oval), they were distributed over 12 operons. Naively, one might have expected the NtrC-regulated operons detected in the arginine-ammonium comparison to include all of the operons detected in the ethanolamine-ammonium comparison, but this was not the case (Fig. 3E). Of the four operons detected on ethanolamine but not on arginine, three (ompF [b0929], oppABCDF [b1243 to b1247], and fklB-cycA [b4207 and b4208]) were operons whose control could not be reliably assigned to NtrC or Nac in mutant comparisons (61). One of the operons detected only on arginine was the ast operon (b1744 to b1748) (Fig. 1, row 2), which encodes arginine-degradative enzymes. Transcription of this operon is activated jointly by NtrC and the arginine repressor ArgR, bound to arginine (27). Of the other operons detected only on arginine, two whose NtrC or Nac control was reliably established previously encode transporters for polyamines (potFGHI [b0854 to b0857] and ydcSTUVW [b1440 to b1444]).
When data from adapted batch cultures (limiting versus excess N and limiting versus excess S [see below]) were subjected to k-means clustering, many NtrC/Nac-regulated genes were identified in two clusters (Fig. 5A and B). The larger of these clusters also contained all of the eut genes (Fig. 5B). In the small cluster containing only 11 genes (Fig. 5A), about one-half of the genes (six genes in five different operons) were members of the NtrC/Nac regulon. In the cluster of 89 genes (Fig. 5B) about one-third of the genes (35 genes in 15 different operons) were in this class. Thus, NtrC/Nac-regulated genes were interspersed with many other genes and would not have been readily identified if we had not already performed studies with appropriate mutant strains. Below we attempt to assess whether any of the other genes in these clusters are specifically related to N metabolism. The minimum number of k-means clusters that allowed separation of the eut genes from all other genes was 15. Twenty-three NtrC/Nac-regulated genes in 14 operons could be identified in a single hierarchical cluster containing a total of 35 genes (http://nature.berkeley.edu/∼opaliy/papers/NutrientLimitation.html). The eut genes were in a separate hierarchical cluster.
To amplify responses to N limitation, we subjected NCM3722 to a downshift from a low concentration of ammonium (1 mM), which it exhausted at an OD600 of ∼0.4, to 2.5 mM arginine (equivalent to 10 mM N) (growth curves are available at http://nature.berkeley.edu/∼opaliy/papers/NutrientLimitation/NSshifts.pdf). We compared the transcription profiles at 10 and 30 min after the shift to the profiles before the shift (see Materials and Methods). We also subjected the strain to the reverse shift for 10 and 30 min by adding ammonium (to a final concentration of 10 mM) to cells adapted to arginine. We have shown previously that the glutamine pool is markedly elevated in cells subjected to an upshift; at times between 10 and 30 min after the shift, it exceeds its new steady-state value by about four- to fivefold (21). The shifts allowed us to detect more NtrC-controlled genes and operons whose expression increased specifically with an N downshift (but not with an S downshift) and/or decreased specifically with an N upshift (40 genes [green oval in Fig. 3C, right circle] in 19 operons, compared with 21 genes in 12 operons detected in cultures adapted to arginine). However, shift experiments did not facilitate the discrimination of these genes from other genes or facilitate detection of other potential N-specific responses because expression of many more genes apparently responded in a general way to slow growth (see below). When we made k-means clusters for our combined N and S shift experiments, we found that one cluster contained a large proportion and number of NtrC- and Nac-regulated genes (25 genes in 16 operons of the 40 genes in the cluster) (Fig. 5C). The genes in this cluster had a characteristic average expression pattern; expression increased after the N downshift and decreased after the N upshift. Another large cluster of 107 genes (Fig. 5D) contained an additional 20 NtrC/Nac-regulated genes, only 6 of which were in three additional operons. The genes in this cluster had an average expression pattern similar to that of the genes in the smaller cluster described above (Fig. 5C), but the magnitude of the responses was lower. Many of the 14 genes in operons already identified from the smaller cluster (Fig. 5C) encoded membrane components of transport systems. Genes encoding periplasmic binding protein components of the same systems were in the smaller cluster because they showed larger responses. Although the genes coding for ATP-binding cassette transport systems are transcribed coordinately, this was not apparent in DNA microarray experiments. One explanation for this is that the initial transcripts are rapidly processed and the portions of the mRNA encoding periplasmic components are more stable than the portions encoding membrane components (14, 31). A separate hierarchical cluster could be identified that contained 41 NtrC/Nac-regulated genes in a total of 123 genes. These genes, about one-third of the total, were in 18 operons. Expansion to include all genes in the operons detected by k-means or hierarchical clustering allowed identification of 49 NtrC/Nac-regulated genes (including genes in the glnHPQ operon [b0809 to b0811], which were not detected in mutant comparisons in the NCM3722 background). These genes were in 23 operons, which contained a total of 66 genes. Fourteen of the additional 17 genes that were not detected by mathematical analyses of microarray data encode membrane components of ATP-binding cassette transporters. As we have pointed out previously (44, 56, 61), inspection of genome images is particularly useful in detecting expression changes across such operons. We failed to detect genes in the dpp operon (b3540 to b3544) which were detected in mutant comparisons. Apart from glnHPQ and dpp, the results for strain NCM3722 were congruent with mutant comparisons in this background.
Responses of strain NCM3722 to S limitation.
To explore the responses of NCM3722 to S limitation, we began by determining differences in gene expression between cells grown on the alkane sulfonate taurine or the cysteine-containing peptide glutathione (γ-glutamylcysteinylglycine) as the S source and cells grown on sulfate (Fig. 1, rows 3 and 4). The doubling times on taurine, glutathione, and sulfate were 70, 120, and 60 min, respectively. There were 24 genes that were judged numerically to be more highly expressed on taurine than on sulfate and not to be more highly expressed on ethanolamine than on ammonium (Fig. 3A, left circle). Twelve of these genes were members of the CysB-Cbl regulon. These genes were the alkane sulfonate degradative operon genes tauABCD (b0365 to b0368) and ssuEADCB (b0933 to b0937), a gene involved in glutathione utilization (iaaA [b0828] [34]), cysK (b2414), and the sbp gene (b3917), which codes for a periplasmic sulfate binding protein (54) (Fig. 1). Of the remaining 12 genes specifically expressed more highly on taurine than on sulfate, three (nlpA [b3661], which codes for a methionine transport component, metA [b4013], and yciW [b1287]) appeared to be specifically responsive to S availability (referred to as S-related genes below) (Fig. 3A, yellow oval) (see below). For cells grown on glutathione, 48 genes had mRNA levels that were >1.7-fold higher than the levels on sulfate but were not higher on the alternative N source arginine than on ammonium (Fig. 3B, left circle). These genes included all 12 members of the CysB-Cbl regulon detected in the taurine-sulfate comparison (Fig. 3D) and several additional members of this regulon, including a gene encoding a periplasmic cystine binding protein (b1920; misnamed fliY and known to be sulfate starvation induced [18, 37]), the cysteine biosynthetic gene cysI (b2763), and genes coding for glutathione transport components (b0829 to b0830) (34) (Fig. 1, row 4). For genes detected on both taurine and glutathione, the magnitude of expression changes was larger on glutathione, presumably because growth was slower. Likewise, two more operons were detected on glutathione than on taurine.
In addition to genes known to be regulated by CysB/Cbl, the expression of a number of methionine biosynthetic genes and a methionine regulatory gene was increased by >1.7-fold on glutathione compared with the expression on sulfate (and not on arginine compared with ammonium). These genes included metK (b2942), metC (b3008), metR (b3828), metBL (b3939 and b3940), and metA (b4013), and only the metA gene was detected in the taurine-sulfate comparison (Fig. 1, rows 3 and 4). We also noted increases in the expression of other genes that were less obviously S related because such changes were confirmed by other means of data analysis (see below). These genes included genes whose products are involved in one-carbon (1C) metabolism (serA [b2913] and gcvTH [b2904 and b2905]) and a gene involved in responding to oxidative stress (ahpF [b0606]). They also included three genes with unknown functions (ydhD [b1654], yrbL [b3207], and yjdC [b4135]). A single k-means cluster for cultures adapted to different N or S sources (see above) contained 13 genes whose expression was on average increased under S-limiting conditions but was unchanged under N-limiting conditions (Fig. 6A). Eleven of these genes were known to be CysB/Cbl regulated. After further analysis we determined that the remaining two genes were also S-related genes (see Discussion). We identified a separate hierarchical cluster that contained 13 CysB/Cbl-regulated genes in a total of 21 genes (http://nature.berkeley.edu/∼opaliy/papers/NutrientLimitation.html). After further analysis we determined that all genes in this cluster were probably S related.
To amplify responses to S limitation, we subjected NCM3722 to a downshift from a low concentration of sulfate (0.02 mM) to 0.25 mM glutathione (Fig. 2; growth curves available at http://nature.berkeley.edu/∼opaliy/papers/NutrientLimitation/NSshifts.pdf). We compared the transcription profile at 30 min after the shift to the profile before the shift (see Materials and Methods). We also subjected the strain to the reverse shift for 30 min by adding sulfate to a final concentration of 0.25 mM to cells adapted to glutathione. The shifts allowed us to detect more genes (79 genes) whose expression increased by >1.7-fold specifically after an S downshift (but not after an N downshift) and/or decreased specifically after an S upshift (Fig. 3C, left circle). One of the genes that were differentially expressed after shifts but not in adapted batch cultures was the gene coding for the regulatory protein CysB (b1275), and many genes were cysteine biosynthetic genes under its control (cysMAWUP [b2421 to b2425], cysCND [b2750 to b2752], cysH [b2762], and cysJ [b2764]). In general, expression of these genes decreased markedly under S upshift conditions. Also detected were a gene coding for a methionine transport component (metQ [b0197]), genes whose products are required for synthesis of FeS clusters (iscAUS [b2528 to b2530]), and a gene whose product is required for insertion of S into biotin (bioB [b0775]). The gene coding for sulfate starvation-induced protein AhpC (b0605) (37) was also differentially expressed during S shifts. This gene is in an operon with ahpF (see above). A single k-means cluster for cells subjected to N and S shifts (see above) contained 45 genes whose expression was on average increased upon an S downshift and decreased upon an S upshift (Fig. 4 and 6B). Strikingly, these genes showed, on average, the opposite responses, but with lesser magnitude, after the corresponding N shifts. After additional analysis we determined that at least 36 of these genes, including 4 genes that code for unidentified open reading frames (ORFs), were S related (see Discussion). The latter genes were members of four different operons. We identified two hierarchical clusters for shift experiments that contained 40 genes that we determined were S related in a total of 42 genes (Fig. 4) (http://nature.berkeley.edu/∼opaliy/papers/NutrientLimitation.html).
Thirty-five genes that were responsive to S availability were identified by all three methods used to analyze data from shift experiments, and another 12 genes were identified by at least two methods (Fig. 4). (For this comparison we used all 101 genes determined numerically to show increased expression after an S downshift, without excluding the genes whose expression also increased after an N downshift or vice versa for the upshifts.) Based on previously published data, we determined that at least 34 of 47 genes identified by two or more methods were, in fact, S related biologically (Table 1) (see Discussion). Another four genes were the ORFs mentioned above in connection with k-means clustering. Table 1 lists the 35 operons containing genes that were identified by multiple methods of data analysis or, in a few cases, by at least one method. All of these operons were detectable qualitatively by inspection of aligned genome images for S and N shift experiments. The numbers in yellow ovals in Fig. 3 and in grey ovals in Fig. 4 are the numbers of genes in each portion of the Venn diagrams that are listed in Table 1.
TABLE 1.
Operons that are responsive to S availabilitya
| b no. | Coding strand | Name | Description | Control | Reference(s) |
|---|---|---|---|---|---|
| b0197-b0199 | − | metQIN | l- and d-methionine transport | MetJ | 8, 28 |
| b0260-b0261 | + | mmuPM | S-Methylmethionine transport and metabolism | MetJb | 50 |
| b0365-b0368 | + | tauABCD | Taurine transport and metabolism | CysB | 54 |
| Cbl | |||||
| b0605-b0606 | + | ahpCF | Alkyl hydroperoxide reductasec | OxyR | 59 |
| b0775 | + | bioBd | Biotin synthase | BirA | 24 |
| b0801 | + | ybiC | ? | ? | |
| b0828-b0830 | + | iaaA-yliAB | Glutathione transport and metabolisme | CysB | 34 |
| Cbl? | |||||
| b0933-b0937 | − | ssuBCDAE | Alkane sulfonate transport and metabolism | CysBf | 4, 54 |
| Cbl | |||||
| b1275 | + | cysB | Positive regulator for Cys regulon | CysBf | 20 |
| b1287 | − | yciWg | ? | ? | |
| b1654 | − | ydhD | Putative glutaredoxin | ? | |
| b1677 | + | lpph | Murein lipoprotein structural gene | ? | |
| b1729 | + | ydjN | ? | ? | |
| b1823-b1824 | − | cspC-yobF | Cold shock protein that affects rpoS expression and ? | ? | 35 |
| b1919-b1920 | − | dcyD-fliYi | Cystine transport and d-cysteine metabolism | Cbl | 45, 54, 55 |
| b1987 | − | cblj | CysB-like regulator for responses to sulfate availability | CysB | 17, 54 |
| b2012-b2013 | − | yeeDE | ? | ? | |
| b2414 | + | cysK | Cysteine synthase A | CysB | 20, 54 |
| Cbl | |||||
| b2421-b2425 | − | cysMAWUP | Cysteine synthase B and sulfate/thiosulfate permeasek | CysB | 20 |
| b2528-b2530 | − | iscAUSl | Synthesis of FeS clusters | IscR | 39, 40 |
| b2742 | − | nlpDm | Lipoprotein | ? | |
| b2750-b2752 | − | cysCNDn | Cysteine biosynthesis, sulfate reduction | CysB | 20 |
| b2762-b2764 | − | cysHIJ | Cysteine biosynthesis, sulfate reduction | CysB | 20 |
| Cbl? | |||||
| b2903-b2905 | − | gcvPHTo | Glycine cleavage, synthesis of 5, 10-methylene tetrahydrofolate | GcvRAp PurR LRP | 46 |
| b2913 | − | serA | 3-Phosphoglycerate dehydrogenase | Lrp | 57 |
| Crp | |||||
| b2942 | + | metKq | SAM synthase | MetJ | 10 |
| b3008 | + | metC | Synthesis of methionine | MetJ | 10 |
| b3207 | + | yrbLr | ? | ? | |
| b3661 | − | nlpA | Lipoprotein in outer membrane | ? | |
| b3828 | − | metRs | Positive regulator for metE and metH | MetJ | 10 |
| MetRt | |||||
| b3917 | + | sbp | Periplasmic sulfate binding protein | CysB | 20, 54 |
| Cbl | |||||
| b3939-b3940 | + | metBL | Synthesis of methionine | MetJ | 10 |
| b3941 | + | metF | Synthesis of methionine | MetJ | 10 |
| b4013 | + | metA | Synthesis of methionine | MetJ | 10 |
| b4135 | − | yjdCu | ? | ? |
The table contains 35 operons. Thirty-five of the 64 genes in this table were found by all four methods of data assessment (numerical analysis of differentially expressed genes, k-means and hierarchical clustering of S and N shift experiments, and visual inspection of genome images). A single k-means cluster for shift experiments contained 41 of these genes, and 42 genes were present in two clusters of the hierarchical tree. The genes found in the k-means cluster but not in the hierarchical clusters were b2742 (nlpD), b2904 (gcvH), b2905 (gcvT), and b3008 (metC). The genes found in the two hierarchical clusters but not in the k-means cluster were b0261 (mmuM), b1919 (dcyD), b2012 (yeeD), b2423 (cysW), and b2764 (cysJ). The latter genes were in operons identified by k-means clustering. Numerical analysis indicated that most of the genes described were S related (see text). The genes supported numerically but not present in k-means or hierarchical clusters were b0197 (metQ), b0606 (ahpF), b0801 (ybiC), b0829 and b0830 (yliAB), b1654 (ydhD), b1677 (lpp), b1823 (cspC), b1987 (cbl), b2528 and b2529 (iscAU), b2903 (gcvP), b3828 (metR), and b1435 (yjdC). The genes that were not supported numerically were b0198 and b0199 (metIN), b1919 and b1920 (dcyD-fliY), b2012 and b2013 (yeeDE), b2423 (cysW), b2530 (iscS), and b3207 (yrbL). The genes that were identified only by visual inspection of genome images for shift experiments were b0198 and b0199 (metIN) and b2530 (iscS). These genes are members of operons identified by other criteria. See below for difficulties with operon organization and/or detection of all members of operons. Information on the genes was obtained from E. coli Entry Point (http://coli.berkeley.edu/cgi-bin/ecoli/coli_entry.pl), the Ecocyc database (http://ecocyc.org/), the ASAP database (http://asap.ahabs.wisc.edu/annotation/php/ASAP1.htm), and primary references. Many references were obtained from the Ecocyc and Ecogene (http://bmb.med.miami.edu/EcoGene/EcoWeb) databases. The Ecocyc, ASAP, and Ecogene databases are among the databases directly accessible from E. coli Entry Point (60).
MetJ regulation was inferred from methionine regulation but was not demonstrated directly.
The enzyme probably reduces H2O2 physiologically (41).
ASAP and Ecocyc designate bioB a member of the bioBFCD operon, but the other members of this operon do not appear to be S controlled. BioB converts dethiobiotin to biotin and may also be under separate S control.
Ecocyc designates yliABCD an ABC transporter.
CysB is a negative regulator.
ASAP designates yciW a member of a 15-gene operon, but we saw no evidence for S control of the other genes.
ASAP indicates that there is a two-gene operon consisting of b1676 and b1677. We saw no indication of S control for b1676 (pykF), which codes for a pyruvate kinase. Ecocyc designates b1676 a separate operon regulated by FruR.
fliY is now known to be a misnomer (37). ASAP designates fliY, yecS (b1918), and yecC (b1917) components of an ABC transporter and includes yecS and yecC in the operon. ASAP also includes b1921 (fliZ) and b1922 (fliA) in the operon, but these genes are known chemotaxis genes, and this is unlikely to be correct.
Cbl constitutes a separate CysB-controlled operon and apparently also lies in an operon with b1988, which codes for the nitrogen regulator Nac. NtrC and Nac control the larger operon (61).
The periplasmic sulfate binding protein, the product of b3917 (sbp), works with this system.
ASAP includes b2531 (iscR) in the operon. It also includes an additional five genes with related functions (b2523 to b2527) in this operon, but Ecocyc does not. We have no indication that these genes are S regulated.
rpoS (b2741) is in an operon with nlpD and is also transcribed separately (22).
ASAP places b2752 in a separate operon, but Ecocyc does not (20).
gcvPHT may be specific for glutathione (see text).
Increased expression of the gcv operon may be a response to increased pools of glycine released from glutathione. The GcvRA system responds to glycine.
ASAP incorrectly designates metK a member of a 10-gene operon.
ASAP designates yrbL a member of a two-gene operon with b3208 (mtgA), encoding a putative monofunctional peptidoglycan transglycosylase. This gene has the opposite strand orientation, and we had no indication that it was S regulated.
ASAP incorrectly designates metR a member of a two-gene operon with b3827, which has the opposite strand orientation.
Regulation by MetR is negative.
ASAP lists b4135 as a member of a three-gene operon with b4136 (dipZ), encoding a transmembrane protein disulfide reductase, and b4137 (cutA), which is involved in copper sensitivity. Ecocyc shows cutA as a separate operon. It is not clear whether b4136 and b4137 are S controlled.
Genes whose expression was increased with both N and S limitation.
The doubling times on the alternative S and N sources taurine and ethanolamine, respectively, were only about 10 min longer than the doubling times on the optimal sources of S and N (∼70 versus 60 min). There was only one gene whose expression increased by >1.7-fold for both the taurine-sulfate and ethanolamine-ammonium comparisons (the gene was what we call a common gene). This gene was cbl, whose expression was already known to be dually controlled (61). It is the gene indicated in both the yellow and green ovals in the overlapping portion of Fig. 3A. The doubling times on the alternative S and N sources glutathione and arginine were longer (∼120 and ∼230 min, respectively). There were 18 genes whose expression was >1.7-fold higher on both glutathione and arginine than on the optimal S and N sources sulfate and ammonium (Fig. 3B; see the legend to Fig. 3 regarding the failure to detect cbl). One-third of these genes are known to be controlled by the stationary-phase sigma factor RpoS (26), and additional RpoS-dependent genes were highly expressed on glutathione or arginine (Fig. 3B, blue ovals). Although three common genes were determined to be NtrC/Nac regulated in a previous study (61) (green oval in the overlapping portion of Fig. 3B), one of them (ompF [b0929]) is subject to many forms of regulation, and another (yeaG [b1783]), which was also one of the common genes in shift experiments (Fig.3C), may also be subject to multiple forms of regulation because it could not be reliably determined to be either NtrC or Nac controlled in the previous study. There were 23 genes whose expression was upregulated after both S and N downshifts (and/or vice versa after upshifts); this was only a few more genes than in adapted cultures. One-quarter of these common genes were RpoS regulated (26). Many additional RpoS-regulated genes (15) were more highly expressed specifically after an N downshift (and/or vice versa after an N upshift). It is our working hypothesis that these genes, like the common RpoS-regulated genes, respond to slow growth. We think that they have been assigned to the N shift category because the doubling times on arginine are considerably longer than those on glutathione (i.e., growth is slower) and the magnitude of their responses is, on average, smaller than that of other RpoS-regulated genes (see below). The roles of RpoS in cultures adapted to nutrient limitation and cultures making transitions between different levels of nutrient availability will be considered elsewhere. The gene indicated in the yellow oval among the common genes in Fig. 3C is cbl, which is also one of the genes indicated in the green oval. Another gene indicated in the green oval is nac (b1988), which appears to be in an operon with cbl.
Other responses to N and S limitation.
We were particularly interested in determining whether we could learn more about N regulation and metabolism than was determined from the NtrC/Nac regulon. Having observed that NtrC/Nac-regulated genes were interspersed with other genes by all forms of data analysis, we attempted to identify other N-related genes by reclustering. We first combined all of the genes that were determined numerically to be upregulated in batch culture on poor N or S sources with the genes upregulated under nutrient downshift conditions (or vice versa for upshift conditions). We subtracted from these genes the 75 genes previously determined to be NtrC/Nac regulated (61) and the 64 genes which we determined to be S related (Table 1). The remaining 128 genes were then analyzed across all experiments by k-means clustering by specifying three or six subclusters. The 13 eut genes which we detected could be separated from all other genes with six subclusters but not with three subclusters, and hence we examined genes in each of the six subclusters separately (Fig. 7A to F). An examination of the average responses of genes in each subcluster across experiments indicated that the genes represented (i) genes that were fundamentally downregulated in the presence of a limiting nutrient, particularly after nutrient downshifts (12 genes) (subcluster A); (ii) eut genes (13 genes) (subcluster B); (iii) genes that were RpoS regulated or behaved similarly (61 genes) (subclusters C and D); (iv) genes whose expression might be N related (24 genes) (subcluster E); and (v) genes whose expression might be S related (18 genes) (subcluster F). Subclusters A and C through F are discussed below.
FIG. 7.

Reclustering of genes assessed numerically to be upregulated (A to F) or downregulated (G to L) under nutrient-limiting conditions (see text). The y axis indicates log ratios of expression in the same units used for Fig. 5 and 6. The experiments indicated on the x axis are those shown in Fig. 5 followed by those shown in Fig. 6. The thick lines show the average log ratios of expression.
On average, genes in subcluster A made the numerical cutoff by virtue of upregulation after an N upshift and some upregulation on taurine. However, they are fundamentally downregulated genes and will be considered elsewhere. On average, genes in subcluster F showed very small responses to changes in nutrient availability and appeared to have made the numerical cutoff by virtue of increased expression specifically after an S downshift. A cursory examination of the list indicated that two genes might be related to oxidative stress (fldA [b0684], encoding a flavodoxin that is SoxS regulated, and soxS [b4062]). Subclusters C and D (20 and 41 genes, respectively) contained about one-third and one-quarter known RpoS-regulated genes and 17 and 9 common genes, respectively. On average, the patterns of expression of genes in these two clusters across experiments were similar except that the response of genes in the larger cluster was smaller. Strikingly, 28 genes in the larger cluster were originally designated N specific by numerical analysis. Twenty-seven of these genes were detected only in shift experiments, and six are RpoS regulated. Grouping of these genes in subcluster D supports the view that many genes designated N specific may, in fact, be common genes responding to slow growth. They may have been detected more robustly after N shifts than after S shifts because growth on arginine is slower than growth on glutathione. The other interesting thing that we noted by examining genes in these two subclusters was that 28 members were ORFs. The fact that expression of these ORFs is regulated provides evidence that they are, in fact, functional. Finally, subcluster E contained 24 genes that appeared to be N regulated, but the average effects were small. All of theses genes had been classified as N specific by numerical analysis. It is among these genes that one might look productively for N metabolic genes or genes that coordinate slowing of growth specifically under N-limiting conditions. Upon preliminary examination, a few genes stood out. One of these genes is asnB (b0674), encoding the glutamine-dependent asparagine synthetase mentioned above. Another is yhbH (b3203), encoding a probable σ54 modulation protein, which is one of five ORFs in subcluster E and one of seven transcriptional regulators (E. coli Entry Point [http://coli.berkeley.edu/cgi-bin/ecoli/coli_entry.pl]; Ecocyc [http://ecocyc.org/]). The latter regulators accounted for more than one-quarter of the genes in subcluster E, as did enzymes of carbon metabolism. Finally, one of the genes in this cluster was rpoS (b2741), providing additional evidence that the RpoS-regulated genes determined to be N specific in fact respond to slow growth. We noted, however, that the baseline expression of many genes in this cluster was very low (data not shown). This was apparent from visual inspection of genome images, such as those in Fig. 1 and 2.
After removing ribosomal and flagellar genes (discussed elsewhere), we also reclustered genes whose expression was downregulated under nutrient-limiting conditions (and/or upregulated after a nutrient upshift). The total number of genes examined was 228. (Note that this list overlaps the list considered above). In this case only three broad patterns of gene expression emerged whether we specified six subclusters or three subclusters. In parallel with analysis of upregulated genes, we considered the six subclusters separately (http://nature.berkeley.edu/∼opaliy/papers/NutrientLimitation.html). An examination of the average responses of genes in each subcluster across experiments indicated that they represented (i) genes that were downregulated in response to slow growth and will be considered elsewhere (a total of 174 genes) (subclusters G, I, and K); (ii) genes whose expression was, on average, similar to that of S-related genes in shifts but was decreased on glutathione in batch culture (10 genes) (subcluster H); (iii) genes that might be of interest in relation to N metabolism, which are considered below (23 genes) (subcluster J); and (iv) genes that were apparently S related (21 genes) (subcluster L). With the exception of ompF, all genes in subcluster L are shown in Table 1. On average, these genes would have made the numerical cutoff by virtue of being downregulated after an N downshift and/or an S upshift.
The expression of genes in subcluster J was, on average, similar to that of NtrC/Nac-regulated genes after shifts. However, the responses of genes in this cluster to S shifts (which were opposite the responses after the corresponding N shifts) were much larger than the responses to N shifts. Oddly, the average expression of these genes was decreased on both arginine and glutathione in adapted batch cultures, and the response to glutathione was larger. Subcluster J contained four genes regulated by NtrC/Nac (b0652, b0653, b2309, and b2310), three trp biosynthetic genes (b1260, b1261, and b1263), and six arg biosynthetic genes (b2818, b3958 to b3960, b3172, and b3359) (Fig. 2). Regulation of the trp and arg genes is of particular interest to us and will be considered elsewhere (Gyaneshwar, unpublished data).
Changes in murein composition on arginine as an N source.
Studies with appropriate mutant strains indicated that expression of the ddp operon was directly under NtrC control (61). Expression of this operon was increased on both ethanolamine and arginine as N sources, as well as after an N downshift. Hence, we predicted that cells grown on poor N sources should have increased levels of cross-linking between diaminopimelate (A2pm) residues of the murein layer of the cell envelope. It is these normally rare cross-links that release the dipeptide d-Ala-d-Ala rather than the single d-ala residues released when most of the cross-links are made (23, 52). Recovery of the peptide through the Ddp system allows scavenging of more N. To test this prediction, we determined the proportions of A2pm-A2pm cross-links and A2pm-d-Ala cross-links for several strains grown under different conditions.
Although the overall degree of cross-linking was little changed when NCM3722 was grown on arginine as the N source rather than on ammonium, the percentage of A2pm-A2pm cross-links more than doubled (Table 2). However, the percentage was small in both cases. Likewise, the percentage of tripeptides in the murein increased markedly at the expense of tetrapeptides. Both changes should have allowed increased recovery of N in cells grown on arginine, and both might have allowed increased recovery of d-Ala-d-Ala by the Ddp system (13). There was little change in the average length of glycan strands for cells grown on the two N sources. There were no differences in either the percentage of A2pm-A2pm cross-links or the percentage of tripeptides between a glnL(Up) strain (NCM3292) and a glnG::Tn5 strain (NCM3285) grown on ammonium. Hence, changes in murein metabolism do not appear to be NtrC controlled. Rather, we postulate that these changes are responses to slow growth (see Discussion). There were a number of properties of the murein that were slightly different in the mutant strains and wild-type strain NCM3722 grown on ammonium, probably because the mutant strains used for this experiment had the MG1655 background (44).
TABLE 2.
Effect of N source on properties of the murein
| Parameter | Strain and N source
|
|||
|---|---|---|---|---|
| NCM3722 and NH3 | NCM3722 and Arg | NCM3292 [glnL(Up)] and NH3 | NCM3285 (glnG::Tn5) and NH3 | |
| Dipeptides (%)a | 2 | 2 | 2 | 2 |
| Tripeptides (%)a | 15 | 27 | 19 | 18 |
| Tetrapeptides (%)a | 81 | 69 | 77 | 78 |
| Pentapeptides (%)a | 1 | 2 | 2 | 2 |
| Degree of cross-linking (%)a | 36 | 37 | 37 | 36 |
| d-Ala-A2pm cross-links (%)a | 33 | 32 | 33 | 33 |
| A2pm-A2pm cross-links (%)a | 2 | 5 | 4 | 3 |
| Avg glycan chain lengthb | 18 | 16 | 20 | 14 |
The values are percentages of the total peptides.
Number of disaccharide units, calculated by dividing the total number of disaccharide units by the number of 1,6-anhydromuramic acid residues.
DISCUSSION
The homeostatic responses of E. coli to N or S limitation each involve more than 50 genes (Table 1) (44, 61). As described above, gene products mediating homeostatic responses to S limitation in prototrophic E. coli K-12 strain NCM3722 were easier to identify than genes mediating responses to N limitation. Even members of the NtrC/Nac regulon, which were known from studies of appropriate mutant strains, could not be readily identified because their expression patterns caused them to be intermingled with many other genes, including RpoS-regulated genes. In contrast to the data for S metabolism (see below), the effects of N limitation, which is known to be perceived initially as glutamine limitation, did not propagate outward in an obvious way. Specifically, expression of genes involved in synthesis of glutamine-derived end products, such as tryptophan, histidine, and arginine, was not increased. Mechanisms preventing propagation beyond the initial NtrC/Nac-mediated homeostatic responses will be discussed elsewhere (Gyaneshwar, unpublished).
The difference in ease of detection of S- and N-related genes was strikingly apparent from the results of k-means clustering for nutrient shift experiments. Of 45 genes in a single k-means cluster referred to as the S cluster (Fig. 6B), at least 32 were determined from the literature to be S related and another four appeared to be S-related ORFs (Table 1) (see below). Members of this cluster revealed the propagation of S limitation outward to known S-related responses, such as oxidative stress (see below). By contrast, NtrC/Nac-regulated genes constituted only two-thirds and less than one-fifth of the genes present in two different k-means clusters referred to as the N clusters (Fig. 5C and D). In considering what might account for the clear differentiation between S-related genes and other genes, we noted the distinct average expression pattern of genes in the S cluster compared to the patterns for the genes in the N clusters. The mRNA levels for genes in the S cluster not only increased after an S downshift and decreased after an S upshift but also showed the opposite responses after the corresponding N shifts. Although genes in the N clusters responded to N availability analogously, on average they did not show the opposite changes in expression after S shifts. Biologically, we think that this is accounted for by the fact that many of the S-related genes are assimilatory and fewer of them code for products involved in scavenging alternative S sources. The S-assimilatory genes have robust basal levels of expression on sulfate as an S source, and hence their expression can decrease with N limitation (presumably perceived as S excess), as well as increase with S limitation. Such a defined expression pattern presumably increases the reliability with which S-related genes can be grouped by the k-means algorithm. By contrast, most NtrC/Nac-controlled genes encode transporters for scavenging alternative N sources. Few of these genes are assimilatory. Expression of the scavenging genes is very low on the optimal N source, NH4+. Although expression can increase with N limitation, it cannot decrease with S limitation. We think that this contributes to the difficulty in detecting NtrC/Nac-regulated genes by cluster analysis. An apparent lack of coordinate expression changes across ABC transport operons also contributes (61) (see Results). A large fraction of genes that clustered with some NtrC-controlled genes in a more detailed analysis (see Results) code for transcriptional regulatory proteins and/or proteins involved in carbohydrate metabolism. The possible importance of these proteins in coordinating metabolism under N-limiting conditions is not yet clear, particularly because the average magnitude of changes in expression was very low.
Changes in the murein composition of E. coli under N-limiting conditions (Table 2) (see Results) could allow increased recovery of N from murein precursors by the NtrC-controlled Ddp system. The dipeptide d-Ala-d-Ala, which is the substrate for this transport system, may also be available from other organisms or sources under naturally N-limiting conditions. The changes in murein composition noted above are not themselves under NtrC control (Table 2) but probably occur more generally when cells grow slowly. In these circumstances the size of enteric bacteria decreases, and the cells become more spherical and more resistant to various forms of environmental insult (23, 52). Given that N but not S can be recovered from d-Ala-d-Ala, increased expression of the Ddp operon would be valuable under N-limiting conditions but not under S-limiting conditions.
Transcriptional increases specific to S limitation: CysB/Cbl-mediated homeostatic responses.
The studies reported here were particularly revealing with respect to S metabolism. Changes in S availability yielded the expected changes in transcription of all S-assimilatory and scavenging operons identified by Kredich as being under CysB control, including cysB itself (at least eight operons containing more than 15 genes) (20) (Table 1 and Fig. 8A). Reassuringly, changes in S availability caused no changes in transcription of cysE or cysG, the two cysteine biosynthetic genes known not to be under CysB control.
FIG. 8.

Homeostatic responses to S limitation (A) and generation of 1C units from serine and glycine (46) (B). (A) Pathways responding to S limitation are indicated schematically along with the regulators controlling them (ovals). Details of several of the pathways and ligands for the regulators are discussed in the text (also see Table 1). (B) 3-Phosphoglycerate (3PGA) is the central metabolite. The 1C units are transferred to tetrahydrofolate, yielding N5,N10-tetrahydrofolate. The gene products that catalyze the reactions are indicated above the arrows.
The most prominent responses to S limitation were increased transcription of the taurine transport and degradative operon, which is activated by CysB and Cbl, and of the ssu operon for transport and degradation of alkane sulfonates, including taurine. The latter operon is positively regulated by Cbl and negatively regulated by CysB. These responses were expected based on the elegant and extensive work of Hryniewicz, Kertesz, Leisinger, and their colleagues (4, 18, 54, 55). Taurine, a component of bile salts, is abundant in the human intestine (12) and is presumably an S source of choice when sulfate and reduced sources of S are limiting. Likewise, alkane sulfonates are abundant sources of S in soil (18). Transcriptional responses that would allow scavenging of other classes of S-containing compounds (Fig. 1 and 2; Table 1) (e.g., the responses for capture of cystine, thiosulfate, and glutathione) occurred at lower levels. Genes encoding transport and degradative enzymes for cystine, thiosulfate, and glutathione are known to be under control of CysB or CysB and Cbl (54).
From the increased expression of many CysB-dependent genes, one can infer that global S limitation results in a decrease in the internal sulfide pool and probably a concomitant increase in the pool of the non-S-containing cysteine precursor O-acetylserine (20). This, the only precursor unique to cysteine biosynthesis, is nonenzymically converted to the signal molecule N-acetylserine, which acts as a coinducer for CysB. In the absence of the anti-inducer sulfide (or thiosulfate), increased N-acetylserine allows CysB-mediated activation of transcription of the genes indicated above and hence accounts for the effects which we saw. Although there are subtle differences, the roles of N-acetylserine and sulfide can be considered analogous to those of 2-oxoglutarate and glutamine for nitrogen metabolism (16, 32). From the increased Cbl-activated transcription of the ssu operon, one can infer that the pool of APS, the first intermediate in sulfate reduction, was probably decreased in our S-limited cultures (4).
Propagation of S limitation into methionine limitation and other areas of metabolism.
Interestingly, general S limitation propagates from cysteine metabolism to methionine metabolism. Although this process is readily rationalized, it has apparently not been documented. S limitation also propagates into synthesis of FeS clusters, oxidative stress (18, 37), and perhaps synthesis of the S-containing cofactor biotin (Table 1). It also appears to propagate into glycine metabolism and generation of 1C units. Although we cannot exclude the possibility that the latter response occurs with S limitation generally, we suspect that it is a specific response to release of glycine from glutathione. We consider effects on methionine metabolism and other effects below.
Propagation of S limitation from cysteine to methionine can be accounted for largely by a decrease in pools of adomethionine (SAM), the ligand required for MetJ-mediated repression (10). Decreased MetJ repression should, in turn, allow increased expression of methionine biosynthetic genes and genes whose products mediate methionine-related scavenging responses. With the exception of metE and metH, both of which code for methionine synthases, all of the methionine biosynthetic (met) genes were in the S cluster discussed above (Fig. 6B). The metE gene responds differently to nutrient limitations than other met genes. The basis for the difference will be considered elsewhere along with a rationale for why the MetR-mediated subcircuit is superimposed on the more general MetJ circuit (Gyaneshwar, unpublished).
In addition to transcriptional responses directed at synthesis of methionine, there were responses that allowed scavenging for this amino acid and related compounds under S-limiting conditions. These included increased transcription of the metNIQ operon (previously called metD), which encodes a transporter for l- and d-methionine (8, 28), and of the mmu genes, which encode a transporter for methylmethionine and an enzyme for transfer of the methyl group (50). Methylmethionine is an abundant plant product that can donate a methyl group to homocysteine, yielding 2 mol of methionine. Genes coding for methionine and methylmethionine transporters, which have been identified only recently, are under methionine and/or MetJ control. Hence, as is true for met genes, increases in their transcription are parsimoniously accounted for by a decrease in SAM. Although we cannot rule out direct participation of CysB and/or Cbl in these responses (or for that matter in the responses of the met genes themselves), at present we do not need to invoke such participation. Of the alternative S sources discussed here, only the peptide glutathione was present in the medium. Hence, most scavenging responses did not depend upon the presence of specific compounds exogenously.
Like the oxygenase systems for degradation of taurine and other alkane sulfonates (54), cysteine and methionine biosynthetic enzymes have a low content of S-containing amino acids compared to the average content for E. coli (http://nature.berkeley.edu/∼opaliy/papers/NutrientLimitation.html).This minimizes the cost of increasing synthesis of these proteins under S-limiting conditions.
Propagation of S limitation into synthesis of FeS clusters and oxidative stress.
One transcriptional response indicated that S limitation could impede synthesis of FeS clusters, and one transcriptional response confirmed clearly that S limitation could give rise to oxidative stress. Severe S limitation (S downshift) increased transcription of the iscRSUA operon (b2531 to b2528), whose products help facilitate insertion of FeS clusters into proteins (39). IscS, one product of the operon, extracts S from cysteine for this purpose. The isc operon is repressed by IscR containing a 2Fe-2S cluster (40). Repression appears to be established by insertion of the FeS cluster into IscR per se rather than depending on the oxidation state. Hence, the lifting of repression is likely to be due to decreased synthesis of FeS clusters.
Transcription of the ahpCF operon (b0605 and b0606) was increased under S-limiting conditions. AhpC, a subunit of alkyl hydroperoxide reductase, is known to be a sulfate starvation-induced protein (18, 37). Transcription of the ahpCF operon (b0605 and b0606) is activated by OxyR in response to H2O2 (47, 49, 59). Although AhpCF was originally characterized as an alkyl hydroperoxide reductase and indeed has such activity, it now appears that its primary and perhaps only physiological role is to eliminate low concentrations of H2O2 generated endogenously (41). Generation of H2O2 in E. coli appears to occur by fortuitous autoxidation of only a few flavin adenine dinucleotide-containing enzymes when their natural electron acceptors are limiting. Sulfite reductase (the product of cysI and cysJ) is one of the autoxidizable enzymes (29), and sulfite pools are likely to be depleted under S-limiting conditions. Indeed, Messner and Imlay (29), who identified sulfite reductase as a potential source of endogenous H2O2, noted that the concentration of this toxic compound probably varies with growth conditions. S limitation appears to be a condition that increases the concentration of H2O2.
Apparent propagation of S limitation into 1C metabolism.
Expression of the gcv (glycine cleavage) operon was increased under S-limiting conditions. Members of this operon degrade glycine irreversibly to CO2, NH3, and 1C units (to form 5,10-methylene tetrahydrofolate) (Fig. 8B). Transcription of the gcv operon is both activated and repressed by GcvA, the product of an unlinked gene (46). Activation by GcvA depends upon an increase in the pool of glycine and/or a decrease in the pool of inosine. Although one could rationalize increased production of 1C units as a general response to S limitation that would favor conversion of what little homocysteine was made into methionine and SAM, we favor the view that increased expression of the gcv genes occurred specifically on glutathione in response to the glycine released from this peptide. This view is supported by the fact that expression of these genes did not respond to N availability, in contrast to what happened with other S-related genes. The two possibilities could be distinguished by use of another limiting S source and/or studies in S- (and N-) limited chemostats (see below).
Interestingly, increased transcription of serA under S-limiting conditions provided another possible link between S limitation and 1C metabolism. The serA product catalyzes the first step in serine biosynthesis from the glycolytic intermediate 3-phosphoglyceric acid (Fig. 8B). The GlyA protein converts serine to glycine plus a 1C unit, and glycine can, in turn, be cleaved to yield another 1C unit, as discussed above. Regulation of serA expression is complex (46), and it is not apparent how it could be connected to S availability. However, the effect of an S downshift on serA transcription was reversed by an S upshift, and the responses to N shifts were in the opposite directions, reinforcing the view that serA transcription responds to general S availability.
ORFs whose mRNA levels are higher under S-limiting conditions.
There are two groups of genes coding for unknown ORFs whose expression appeared to be specifically increased under S-limiting conditions. The first group, a reliable group, consists of six genes present in the S cluster (Fig. 6B) or predicted to be members of their operons (b1287, b1729, b1823, b1824, b2012, and b2013) (Tables 1 and 3). The pertinence of these genes and operons was confirmed by numerical analysis, hierarchical clustering, and inspection of 12 aligned genome images from shift experiments (Table 3). Expression of the five genes in the second group (b0801, b1654, b3207, b4135, and b4136) was determined to be elevated under S-limiting conditions by inspection of aligned genome images for shift experiments, but the results received additional support only from a numerical analysis.
TABLE 3.
Evidence supporting S-related ORFsa
| b no. | k-means clusteringb | Hierarchical clusteringc | Numerical analysisd |
|---|---|---|---|
| b1287 | √ | √ | √ |
| b1729 | √ | √ | √ |
| b1823 | √ | ||
| b1824 | √ | √ | √ |
| b2012 | √ | ||
| b2013 | √ | √ | |
| b0801 | √ | ||
| b1654 | √ | ||
| b3207 | √ | ||
| b4135 | √ | ||
| b4136 |
All ORFs were readily identified by inspection of aligned genome images for shift experiments.
Present in the single S-related k-means cluster for shift experiments (Fig. 6B).
Present in one of the two hierarchical clusters identified as S related for shift experiments.
Identified by numerical analysis of shift experiments and/or experiments with adapted batch cultures (see Materials and Methods).
Genes for five of the six reliable ORFs remain unnamed. The product of one ORF (b1823), which has been called cold shock protein C, is a transcriptional antiterminator (2) that is a major regulator of rpoS expression. Whether elevation of cspC expression under S-limiting conditions is in some way related to the fact that RpoS appears to be required for optimal growth on poor S sources but not poor N or C sources (33) is not known. This is an intriguing possibility. The other ORFs may have direct roles in S metabolism. Several enzymes postulated to be present under S-limiting conditions remain unidentified (18, 20).
Although genes in the second group of ORFs are not particularly reliable, it is worth noting that one, b1654, codes for a putative glutaredoxin. The other genes in this group appear to have the same general pattern of expression as the genes in the S cluster, but the magnitude of their responses is smaller. This was also true of the isc genes, whose products are needed for FeS synthesis (see above), and for metR and metH, whose responses are particularly informative with respect to metabolic circuitry (Gyaneshwar, unpublished). Hence, these ORFs may also be interesting.
Data analysis and additional biological experiments.
As discussed in Results, using multiple means of data analysis facilitated biological interpretation of microarray data. Visual inspection of genome images (Fig. 1 and 2) was useful for verifying transcriptional changes across operons and determining the baseline values of transcription. Changes were easily detected across ABC transport operons even though the genes in these operons tended to separate from one another when different forms of cluster analysis were used.
Genome images were also useful for observing the behavior of known regulatory or biosynthetic genes whose responses to changes in nutrient availability were aberrant with respect to the responses of related genes in the same class. The cbl gene, which encodes a major regulator of S metabolism, is a notable example. It was not a member of the very reliable k-means S cluster for shift experiments (Fig. 6B) because its expression is dually controlled by N and S. (It was present in one of the k-means clusters containing NtrC/Nac-regulated genes [Fig. 5C].) We detected it as an S-related gene because it has been well studied (17). Other genes missing from the S cluster were metE, which has a different pattern of regulation than the other met genes, and the metJ and metR regulatory genes, whose responses to changes in S availability are small. These few genes play critical roles in S metabolism.
The difficulty in identifying the NtrC/Nac regulon in a wild-type strain of E. coli highlighted the usefulness of also performing microarray experiments with appropriate mutant strains (61). Many of the remaining questions that arose in this study can be approached by using continuous culture experiments. Whereas it is difficult to find alternative sources of a particular nutrient that allow a wide range of growth rates in batch culture (16), this is easily achieved in chemostat cultures by varying the dilution rate with a single optimal nutrient source (e.g., sulfate). Moreover, different nutrient limitations can be imposed without changing the composition of the medium. Continuous culture experiments should be particularly useful for resolving whether the many RpoS-regulated genes determined to be N specific by numerical analysis (see Results) are, in fact, responding to slow growth.
Acknowledgments
We thank Eric Soupene for preparing samples for murein analysis and Eric Soupene, William Inwood, James Imlay, and two anonymous reviewers for critical comments on the manuscript.
This work was supported by National Institutes of Health grant GM38361 and by a grant from the Torrey Mesa Research Institute, Syngenta Research and Technology, La Jolla, Calif., to S.K.
REFERENCES
- 1.Backman, K., Y. M. Chen, and B. Magasanik. 1981. Physical and genetic characterization of the glnA-glnG region of the Escherichia coli chromosome. Proc. Natl. Acad. Sci. USA 78:3743-3747. [DOI] [PMC free article] [PubMed] [Google Scholar]
- 2.Bae, W., B. Xia, M. Inouye, and K. Severinov. 2000. Escherichia coli CspA-family RNA chaperones are transcription antiterminators. Proc. Natl. Acad. Sci. USA 97:7784-7789. [DOI] [PMC free article] [PubMed] [Google Scholar]
- 3.Blattner, F. R., G. Plunkett, C. A. Bloch, N. T. Perna, V. Burland, M. Riley, J. ColladoVides, J. D. Glasner, C. K. Rode, G. F. Mayhew, J. Gregor, N. W. Davis, H. A. Kirkpatrick, M. A. Goeden, D. J. Rose, B. Mau, and Y. Shao. 1997. The complete genome sequence of Escherichia coli K-12. Science 277:1453-1474. [DOI] [PubMed] [Google Scholar]
- 4.Bykowski, T., J. R. van der Ploeg, R. Iwanicka-Nowicka, and M. M. Hryniewicz. 2002. The switch from inorganic to organic sulphur assimilation in Escherichia coli: adenosine 5′-phosphosulphate (APS) as a signalling molecule for sulphate excess. Mol. Microbiol. 43:1347-1358. [DOI] [PubMed] [Google Scholar]
- 5.Chen, Y. M., K. Backman, and B. Magasanik. 1982. Characterization of a gene, glnL, the product of which is involved in the regulation of nitrogen utilization in Escherichia coli. J. Bacteriol. 150:214-220. [DOI] [PMC free article] [PubMed] [Google Scholar]
- 6.Eisen, M. B., P. T. Spellman, P. O. Brown, and D. Botstein. 1998. Cluster analysis and display of genome-wide expression patterns. Proc. Natl. Acad. Sci. USA 95:14863-14868. [DOI] [PMC free article] [PubMed] [Google Scholar]
- 7.Everitt, B. S. 1993. Cluster analysis, 3rd ed. Halsted Press, New York, N.Y.
- 8.Gal, J., A. Szvetnik, R. Schnell, and M. Kalman. 2002. The metD d-methionine transporter locus of Escherichia coli is an ABC transporter gene cluster. J. Bacteriol. 184:4930-4932. [DOI] [PMC free article] [PubMed] [Google Scholar]
- 9.Glauner, B. 1988. Separation and quantification of muropeptides with high-performance liquid chromatography. Anal. Biochem. 172:451-464. [DOI] [PubMed] [Google Scholar]
- 10.Greene, R. C. 1996. Biosynthesis of methionine, p. 542-560. In F. C. Neidhardt, R. Curtiss III, J. L. Ingraham, E. C. C. Lin, K. B. Low, B. Magasanik, W. S. Reznikoff, M. Riley, M. Schaechter, and H. H. Umbarger (ed.), Escherichia coli and Salmonella: cellular and molecular biology, 2nd ed., vol. 1. ASM Press, Washington, D.C.
- 11.Gutnick, D., J. M. Calvo, T. Klopotowski, B. N. Ames, K. Backman, Y. M. Chen, and B. Magasanik. 1969. Compounds which serve as the sole source of carbon or nitrogen for Salmonella typhimurium LT-2. J. Bacteriol. 100:215-219. [DOI] [PMC free article] [PubMed] [Google Scholar]
- 12.Hardikar, W., and F. J. Suchy. 2003. Hepatobiliary function, p. 975-1002. In W. F. Boron and E. L. Boulpaep (ed.), Medical physiology. Saunders, New York, N.Y.
- 13.Heijenoort, J. V. 1996. Murein synthesis, p. 1025-1034. In F. C. Neidhardt, R. Curtiss III, J. L. Ingraham, E. C. C. Lin, K. B. Low, B. Magasanik, W. S. Reznikoff, M. Riley, M. Schaechter, and H. H. Umbarger (ed.), Escherichia coli and Salmonella: cellular and molecular biology, 2nd ed., vol. 1. ASM Press, Washington, D.C.
- 14.Higgins, C. F., R. S. McLaren, and S. F. Newbury. 1988. Repetitive extragenic palindromic sequences, mRNA stability and gene expression: evolution by gene conversion? A review. Gene 72:3-14. [DOI] [PubMed] [Google Scholar]
- 15.Ihaka, R., and R. Gentleman. 1996. R: a language for data analysis and graphics. J. Comput. Graph. Stat. 5:299-314. [Google Scholar]
- 16.Ikeda, T. P., A. E. Shauger, and S. Kustu. 1996. Salmonella typhimurium apparently perceives external nitrogen limitation as internal glutamine limitation. J. Mol. Biol. 259:589-607. [DOI] [PubMed] [Google Scholar]
- 17.Iwanicka-Nowicka, R., and M. M. Hryniewicz. 1995. A new gene, cbl, encoding a member of the LysR family of transcriptional regulators belongs to Escherichia coli cys regulon. Gene 166:11-17. [DOI] [PubMed] [Google Scholar]
- 18.Kertesz, M. A. 2000. Riding the sulfur cycle—metabolism of sulfonates and sulfate esters in gram-negative bacteria. FEMS Microbiol. Rev. 24:135-175. [DOI] [PubMed] [Google Scholar]
- 19.Kofoid, E., C. Rappleye, I. Stojiljkovic, and J. Roth. 1999. The 17-gene ethanolamine (eut) operon of Salmonella typhimurium encodes five homologues of carboxysome shell proteins. J. Bacteriol. 181:5317-5329. [DOI] [PMC free article] [PubMed] [Google Scholar]
- 20.Kredich, N. M. 1996. Biosynthesis of cysteine, p. 514-527. In F. C. Neidhardt, R. Curtiss III, J. L. Ingraham, E. C. C. Lin, K. B. Low, B. Magasanik, W. S. Reznikoff, M. Riley, M. Schaechter, and H. H. Umbarger (ed.), Escherichia coli and Salmonella: cellular and molecular biology, 2nd ed., vol. 1. ASM Press, Washington, D.C.
- 21.Kustu, S., J. Hirschman, D. Burton, J. Jelesko, and J. C. Meeks. 1984. Covalent modification of bacterial glutamine synthetase: physiological significance. Mol. Gen. Genet. 197:309-317. [DOI] [PubMed] [Google Scholar]
- 22.Lange, R., and R. Hengge-Aronis. 1994. The nlpD gene is located in an operon with rpoS on the Escherichia coli chromosome and encodes a novel lipoprotein with a potential function in cell wall formation. Mol. Microbiol. 13:733-743. [DOI] [PubMed] [Google Scholar]
- 23.Lessard, I. A., S. D. Pratt, D. G. McCafferty, D. E. Bussiere, C. Hutchins, B. L. Wanner, L. Katz, and C. T. Walsh. 1998. Homologs of the vancomycin resistance d-Ala-d-Ala dipeptidase VanX in Streptomyces toyocaensis, Escherichia coli and Synechocystis: attributes of catalytic efficiency, stereoselectivity and regulation with implications for function. Chem. Biol. 5:489-504. [DOI] [PubMed] [Google Scholar]
- 24.Lin, K. C., A. Campbell, and D. Shiuan. 1991. Binding characteristics of Escherichia coli biotin repressor-operator complex. Biochim. Biophys. Acta 1090:317-325. [DOI] [PubMed] [Google Scholar]
- 25.Lin-Chao, S., and S. N. Cohen. 1991. The rate of processing and degradation of antisense RNAI regulates the replication of ColE1-type plasmids in vivo. Cell 65:1233-1242. [DOI] [PubMed] [Google Scholar]
- 26.Loewen, P. C., B. Hu, J. Strutinsky, and R. Sparling. 1998. Regulation in the rpoS regulon of Escherichia coli. Can. J. Microbiol. 44:707-717. [DOI] [PubMed] [Google Scholar]
- 27.Lu, C. D., and A. T. Abdelal. 1999. Role of ArgR in activation of the ast operon, encoding enzymes of the arginine succinyltransferase pathway in Salmonella typhimurium. J. Bacteriol. 181:1934-1938. [DOI] [PMC free article] [PubMed] [Google Scholar]
- 28.Merlin, C., G. Gardiner, S. Durand, and M. Masters. 2002. The Escherichia coli metD locus encodes an ABC transporter which includes Abc (MetN), YaeE (MetI), and YaeC (MetQ). J. Bacteriol. 184:5513-5517. [DOI] [PMC free article] [PubMed] [Google Scholar]
- 29.Messner, K. R., and J. A. Imlay. 1999. The identification of primary sites of superoxide and hydrogen peroxide formation in the aerobic respiratory chain and sulfite reductase complex of Escherichia coli. J. Biol. Chem. 274:10119-10128. [DOI] [PubMed] [Google Scholar]
- 30.Muse, W. B., and R. A. Bender. 1998. The nac (nitrogen assimilation control) gene from Escherichia coli. J. Bacteriol. 180:1166-1173. [DOI] [PMC free article] [PubMed] [Google Scholar]
- 31.Newbury, S. F., N. H. Smith, and C. F. Higgins. 1987. Differential mRNA stability controls relative gene expression within a polycistronic operon. Cell 51:1131-1143. [DOI] [PubMed] [Google Scholar]
- 32.Ninfa, A. J., P. Jiang, M. R. Atkinson, and J. A. Peliska. 2000. Integration of antagonistic signals in the regulation of nitrogen assimilation in Escherichia coli. Curr. Top. Cell. Regul. 36:31-75. [DOI] [PubMed] [Google Scholar]
- 33.Notley-McRobb, L., T. King, and T. Ferenci. 2002. rpoS mutations and loss of general stress resistance in Escherichia coli populations as a consequence of conflict between competing stress responses. J. Bacteriol. 184:806-811. [DOI] [PMC free article] [PubMed] [Google Scholar]
- 34.Parry, J., and D. P. Clark. 2002. Identification of a CysB-regulated gene involved in glutathione transport in Escherichia coli. FEMS Microbiol. Lett. 209:81-85. [DOI] [PubMed] [Google Scholar]
- 35.Phadtare, S., and M. Inouye. 2001. Role of CspC and CspE in regulation of expression of RpoS and UspA, the stress response proteins in Escherichia coli. J. Bacteriol. 183:1205-1214. [DOI] [PMC free article] [PubMed] [Google Scholar]
- 36.Pomposiello, P. J., B. K. Janes, and R. A. Bender. 1998. Two roles for the DNA recognition site of the Klebsiella aerogenes nitrogen assimilation control protein. J. Bacteriol. 180:578-585. [DOI] [PMC free article] [PubMed] [Google Scholar]
- 37.Quadroni, M., W. Staudenmann, M. Kertesz, and P. James. 1996. Analysis of global responses by protein and peptide fingerprinting of proteins isolated by two-dimensional gel electrophoresis. Application to the sulfate-starvation response of Escherichia coli. Eur. J. Biochem. 239:773-781. [DOI] [PubMed] [Google Scholar]
- 38.Reitzer, L. J. 1996. Ammonia assimilation and the biosynthesis of glutamine, glutamate, aspartate, asparagine, l-alanine, and d-alanine, p. 391-407. In F. C. Neidhardt, R. Curtiss III, J. L. Ingraham, E. C. C. Lin, K. B. Low, B. Magasanik, W. S. Reznikoff, M. Riley, M. Schaechter, and H. H. Umbarger (ed.), Escherichia coli and Salmonella: cellular and molecular biology, 2nd ed., vol. 1. ASM Press, Washington, D.C.
- 39.Schwartz, C. J., O. Djaman, J. A. Imlay, and P. J. Kiley. 2000. The cysteine desulfurase, IscS, has a major role in in vivo Fe-S cluster formation in Escherichia coli. Proc. Natl. Acad. Sci. USA 97:9009-9014. [DOI] [PMC free article] [PubMed] [Google Scholar]
- 40.Schwartz, C. J., J. L. Giel, T. Patschkowski, C. Luther, F. J. Ruzicka, H. Beinert, and P. J. Kiley. 2001. IscR, an Fe-S cluster-containing transcription factor, represses expression of Escherichia coli genes encoding Fe-S cluster assembly proteins. Proc. Natl. Acad. Sci. USA 98:14895-14900. [DOI] [PMC free article] [PubMed] [Google Scholar]
- 41.Seaver, L. C., and J. A. Imlay. 2001. Alkyl hydroperoxide reductase is the primary scavenger of endogenous hydrogen peroxide in Escherichia coli. J. Bacteriol. 183:7173-7181. [DOI] [PMC free article] [PubMed] [Google Scholar]
- 42.Seputiene, V., D. Motiejunas, K. Suziedelis, H. Tomenius, S. Normark, O. Melefors, and E. Suziedeliene. 2003. Molecular characterization of the acid-inducible asr gene of Escherichia coli and its role in acid stress response. J. Bacteriol. 185:2475-2484. [DOI] [PMC free article] [PubMed] [Google Scholar]
- 43.Sherlock, G., P. T. Spellman, P. O. Brown, and D. Botstein. 2000. Analysis of large-scale gene expression data. Curr. Opin. Immunol. 12:201-205. [DOI] [PubMed] [Google Scholar]
- 44.Soupene, E., W. C. van Heeswijk, J. Plumbridge, V. Stewart, D. Bertenthal, H. Lee, G. Prasad, O. Paliy, P. Charernnoppakul, and S. Kustu. 2003. Physiological studies of Escherichia coli strain MG1655: growth defects and apparent cross-regulation of gene expression. J. Bacteriol. 185:5611-5626. [DOI] [PMC free article] [PubMed] [Google Scholar]
- 45.Soutourina, J., S. Blanquet, and P. Plateau. 2001. Role of d-cysteine desulfhydrase in the adaptation of Escherichia coli to d-cysteine. J. Biol. Chem. 276:40864-40872. [DOI] [PubMed] [Google Scholar]
- 46.Stauffer, G. V. 1996. Biosynthesis of serine, glycine, and one-carbon units, p. 506-513. In F. C. Neidhardt, R. Curtiss III, J. L. Ingraham, E. C. C. Lin, K. B. Low, B. Magasanik, W. S. Reznikoff, M. Riley, M. Schaechter, and H. H. Umbarger (ed.), Escherichia coli and Salmonella: cellular and molecular biology, 2nd ed., vol. 1. ASM Press, Washington, D.C.
- 47.Storz, G., F. S. Jacobson, L. A. Tartaglia, R. W. Morgan, L. A. Silveira, and B. N. Ames. 1989. An alkyl hydroperoxide reductase induced by oxidative stress in Salmonella typhimurium and Escherichia coli: genetic characterization and cloning of ahp. J. Bacteriol. 171:2049-2055. [DOI] [PMC free article] [PubMed] [Google Scholar]
- 48.Sturn, A., J. Quackenbush, and Z. Trajanoski. 2002. Genesis: cluster analysis of microarray data. Bioinformatics 18:207-208. [DOI] [PubMed] [Google Scholar]
- 49.Tartaglia, L. A., G. Storz, and B. N. Ames. 1989. Identification and molecular analysis of oxyR-regulated promoters important for the bacterial adaptation to oxidative stress. J. Mol. Biol. 210:709-719. [DOI] [PubMed] [Google Scholar]
- 50.Thanbichler, M., B. Neuhierl, and A. Bock. 1999. S-methylmethionine metabolism in Escherichia coli. J. Bacteriol. 181:662-665. [DOI] [PMC free article] [PubMed] [Google Scholar]
- 51.Tucker, D. L., N. Tucker, Z. Ma, J. W. Foster, R. L. Miranda, P. S. Cohen, and T. Conway. 2003. Genes of the GadX-GadW regulon in Escherichia coli. J. Bacteriol. 185:3190-3201. [DOI] [PMC free article] [PubMed] [Google Scholar]
- 52.Tuomanen, E., Z. Markiewicz, and A. Tomasz. 1988. Autolysis-resistant peptidoglycan of anomalous composition in amino-acid-starved Escherichia coli. J. Bacteriol. 170:1373-1376. [DOI] [PMC free article] [PubMed] [Google Scholar]
- 53.Tusher, V. G., R. Tibshirani, and G. Chu. 2001. Significance analysis of microarrays applied to the ionizing radiation response. Proc. Natl. Acad. Sci. USA 98:5116-5121. [DOI] [PMC free article] [PubMed] [Google Scholar]
- 54.van der Ploeg, J. R., E. Eichhorn, and T. Leisinger. 2001. Sulfonate-sulfur metabolism and its regulation in Escherichia coli. Arch. Microbiol. 176:1-8. [DOI] [PubMed] [Google Scholar]
- 55.van der Ploeg, J. R., R. Iwanicka-Nowicka, M. A. Kertesz, T. Leisinger, and M. M. Hryniewicz. 1997. Involvement of CysB and Cbl regulatory proteins in expression of the tauABCD operon and other sulfate starvation-inducible genes in Escherichia coli. J. Bacteriol. 179:7671-7678. [DOI] [PMC free article] [PubMed] [Google Scholar]
- 56.Wendisch, V. F., D. P. Zimmer, A. Khodursky, B. Peter, N. Cozzarelli, and S. Kustu. 2001. Isolation of Escherichia coli mRNA and comparison of expression using mRNA and total RNA on DNA microarrays. Anal. Biochem. 290:205-213. [DOI] [PubMed] [Google Scholar]
- 57.Yang, L., R. T. Lin, and E. B. Newman. 2002. Structure of the Lrp-regulated serA promoter of Escherichia coli K-12. Mol. Microbiol. 43:323-333. [DOI] [PubMed] [Google Scholar]
- 58.Yang, Y. H., S. Dudoit, P. Luu, and T. P. Speed. 2001. Normalization for dDNA microarray data, p. 141-152. In M. L. Bittner, Y. Chen, A. N. Dorsel, and E. R. Dougherty (ed.), Microarrays: optical technologies and informatics. SPIE, Society for Optical Engineering, San Jose, Calif.
- 59.Zheng, M., X. Wang, B. Doan, K. A. Lewis, T. D. Schneider, and G. Storz. 2001. Computation-directed identification of OxyR DNA binding sites in Escherichia coli. J. Bacteriol. 183:4571-4579. [DOI] [PMC free article] [PubMed] [Google Scholar]
- 60.Zimmer, D. P., O. Paliy, B. Thomas, P. Gyaneshwar, and S. Kustu. 2004. Genome image programs: visualization and interpretation of Escherichia coli microarray experiments. Genetics 167:2111-2119. [DOI] [PMC free article] [PubMed] [Google Scholar]
- 61.Zimmer, D. P., E. Soupene, H. L. Lee, V. F. Wendisch, A. B. Khodursky, B. J. Peter, R. A. Bender, and S. Kustu. 2000. Nitrogen regulatory protein C-controlled genes of Escherichia coli: scavenging as a defense against nitrogen limitation. Proc. Natl. Acad. Sci. USA 97:14674-14679. [DOI] [PMC free article] [PubMed] [Google Scholar]