

Abstract
Uncovering the genetic and evolutionary basis of local adaptation is a major focus of evolutionary biology. The recent development of cost-effective methods for obtaining high-quality genome-scale data makes it possible to identify some of the loci responsible for adaptive differences among populations. Two basic approaches for identifying putatively locally adaptive loci have been developed and are broadly used: one that identifies loci with unusually high genetic differentiation among populations (differentiation outlier methods) and one that searches for correlations between local population allele frequencies and local environments (genetic-environment association methods). Here, we review the promises and challenges of these genome scan methods, including correcting for the confounding influence of a species’ demographic history, biases caused by missing aspects of the genome, matching scales of environmental data with population structure, and other statistical considerations. In each case, we make suggestions for best practices for maximizing the accuracy and efficiency of genome scans to detect the underlying genetic basis of local adaptation. With attention to their current limitations, genome scan methods can be an important tool in finding the genetic basis of adaptive evolutionary change.
Keywords: local adaptation, genome scans, FST outliers, differentiation outlier, genetic-environment association, genetics of adaptation
Introduction
Local adaptation occurs when organisms have higher average fitness in their local environment compared to individuals from elsewhere (Williams 1966; Kawecki and Ebert 2004; Blanquart et al. 2013; Savolainen et al. 2013). Environments are often variable across space and time, and local conditions determine which traits will be favored by natural selection. As natural selection acts on phenotypic traits, changes in allele frequencies of genetic loci underlying those traits can shift the population toward a local optimum. Over time, natural selection acting in different locations can lead to adaptive divergence of trait means and allele frequencies.
Although much can be learned about adaptive processes without knowledge of the specific loci, in many instances, identifying the genetic features underlying local adaptation is a critical step in addressing fundamental questions in evolutionary biology and natural selection (Rausher and Delph 2015). For example, determining whether natural selection acts primarily on standing variation or on new mutations, discovering whether common genetic solutions evolve in parallel across populations, and identifying the distribution of effect sizes of adaptive loci and their nature (e.g., regulatory, coding, structural) all require knowledge of the specific genetic loci responsible for the traits. In addition, identifying genetic regions involved in local adaptation can also assist breeding programs in agriculture, forestry, and fisheries and can improve management decisions for threatened species by predicting the performance of a genotype in a new en vironment (Funk et al. 2012; Aitken and Whitlock 2013; Li et al. 2014; Yoder et al. 2014; Lasky et al. 2015; Hamilton and Miller 2016). In cases where ecological divergence among populations is driving the evolution of reproductive isolation, identifying the loci underlying local adaptation may help elucidate the process of speciation (Clausen 1951; Coyne and Orr 2004; Rundle and Nosil 2005).
The classic approach for demonstrating local adaptation relies on quantifying fitness or phenotypes in common garden or reciprocal transplant experiments (Anderson et al. 2010; Fournier-Level et al. 2011; Savolainen et al. 2013). Numerous reciprocal transplant experiments over the past 75 years have demonstrated that local adaptation is common (Clausen et al. 1940; Leimu and Fischer 2008; Here-ford 2009). Common garden experiments and provenance trials can also establish that observed phenotypic differences between populations are heritable (and, potentially, adaptive) rather than plastic. However, these experiments require space, time, and resources that may not be feasible for many species.
Several methods have recently been developed to identify the specific genes and alleles that may be responsible for local adaptation (table 1). Each method comes with benefits and liabilities, and deciding which method is most appropriate partly depends on existing knowledge of a given system. For example, if some of the traits responsible for local adaptation are already known, the genetic regions underlying variation in those traits can be identified with linkage mapping or genome-wide association approaches, as reviewed elsewhere (e.g., Savolainen et al. 2013; Vinkhuyzen et al. 2013; Robinson et al. 2014). In cases where selection on new mutations or recently introduced alleles has been rapid, the genomic signatures of selective sweeps can be used to identify genomic regions with population-specific signatures of selection (table 1; selective sweeps reviewed in Hohenlohe et al. 2010).
Table 1.
Approaches to identifying loci involved in local adaptation
| Approach | Data collected/resources required | What analysis reveals | Review articles/programs |
|---|---|---|---|
| Genetic differentiation outlier tests | Genome-wide SNPs from multiple populations | Allele frequencies for a SNP or SNPs that are differentiated across populations above what is expected from neutrality | See table A1 |
| Genetic-environment association | Genome-wide SNPs from multiple populations and environmental data for each population | Alleles at a SNP or SNPs that are associated with environmental variables over space | See table A1 |
| QTL mapping in a reciprocal transplant field experiment | Hybrids (F2s, BCs, RILs, etc.) between locally adapted populations grown and phenotyped for fitness traits in reciprocal transplant common garden experiment | Use of hybrids allows identifying QTLs involved in local adaptation and the effect size of those QTLs on fitness; can resolve whether trade-offs at individual loci underlie local adaptation | Reviewed in Anderson et al. 2011; Savolainen et al. 2013 |
| GWAS | Genome-wide SNPs from hundreds of individuals grown in one or multiple common gardens; phenotypes and/or fitness for each individual | Identifies SNPs that are associated with traits associated with fitness measured under field conditions | Key example study: Fournier-Level et al. 2011; commonly used: TASSEL (Bradbury et al. 2007); EMMA (Kang et al. 2008); GCTA (Yang et al. 2011) |
| Population-specific selective sweeps | Genome-wide SNPs from at least two populations and a recombination map | DNA sequences with longer-than-expected regions of extended haplotype homozygosity, which is consistent with a recent selective sweep in one of the populations | XP-EHH (Sabeti et al. 2007); hapFLK (Fariello et al. 2013) |
Note: SNP = single nucleotide polymorphism; QTL = quantitative trait loci; BC = backcrosses; RIL = recombinant inbreed lines; GWAS = genome-wide association studies; EMMA = efficient mixed-model association; GCTA = genome-wide complex trait analysis.
Here, we focus on two types of genome scan methods that have recently become widely used to test for loci under selection, particularly for nonmodel organisms: genetic-environment association analyses and differentiation outlier methods. While these two methods hold exciting potential, they also suffer from significant challenges.
When studying wild populations, researchers may know (or hypothesize) which environmental axes are important in generating spatial variation in selection that leads to local adaptation. Genetic-environment association methods seek to identify alleles whose frequencies have unusually strong correlations with environmental variable(s), which suggests the loci are involved in local adaptation. Several methods have been developed to look for such associations (table A1; tables A1–A3 available online).
In other situations, researchers may not know which environmental axes or traits are important for local adaptation but may still aim to identify loci that show patterns of local adaptation. Alleles involved in local adaptation should occur at higher frequency where they increase fitness and be at lower frequency where they decrease fitness. Therefore, it may be possible to identify loci involved in local adaptation by screening for alleles that show greater-than-average genetic differentiation among populations (Lewontin and Krakauer 1973; Beaumont 2005). Such methods typically quantify genetic differentiation by a measure such as FST and are commonly referred to as FST outlier approaches (table A1). However, because other measures of genetic differentiation are sometimes employed (e.g., XTX: Günther and Coop 2013; DD: Yant et al. 2013; πXY: Nei and Li 1979: G: Magwene et al. 2011; SPA: Yang et al. 2012), we refer to these approaches as differentiation outlier methods.
These two approaches—genetic-environment associations and differentiation outlier methods—show promise for application to a broad range of species. However, both approaches should be pursued with caution and viewed as a subset of many possible tools used to study adaptive processes. We discuss four major challenges and possible solutions: (1) population structure and demography that can lead to incorrect inference, (2) missing genomic information arising from the genotyping approach or quality-control assumptions, (3) inappropriate or missing environmental information, and (4) other statistical challenges. We conclude with a cautious but hopeful outlook on improving methods, inference, and integration of these approaches into cohesive research programs.
Mixed Signals: Confounding Effects of Demography and Population Structure
Demography and Genetic Differentiation Approaches
Demographic history can cause loci to vary dramatically in their spatial genetic differentiation, even if none experience selection and all are under the same influence of genetic drift and migration. Loci experiencing local selection must be distinguished from the distribution of possible neutral patterns of differentiation (i.e., the null distribution). The difficulty in detecting selection by focusing on departures from neutrality is that random processes affect each locus differently, and the distribution of differentiation measures depends on the focal species’ population structure and demography. This is particularly problematic when the average level of differentiation is high, because even with selective neutrality, the variance in FST values among loci increases with average FST, which makes detection of outlier loci difficult for highly differentiated populations (fig. 1).
Figure 1.
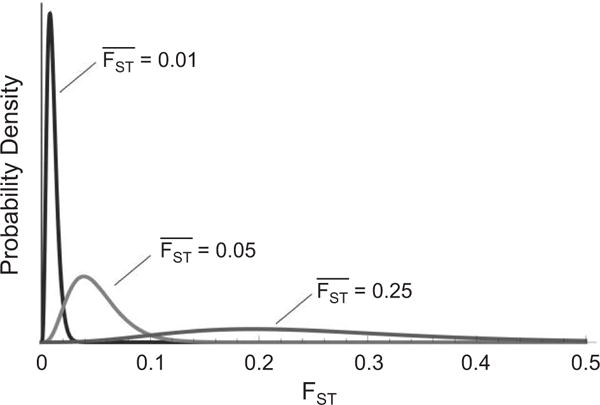
Distributions of FST under an island model with large samples from 10 populations for mean FST equal to 0.01, 0.05, or 0.25, respectively. The variance of the distribution of FST over neutral loci is greater when the mean FST is larger. If the mean FST is large, a locus must have an FST with an extremely large value to be in the tail of the distribution. A color version of this figure is available online.
Even when the average level of differentiation is low, demography can affect the variability of the FST distribution. Figure 2A shows a simulated example, contrasting the distribution of FST of neutral loci under an island model (i.e., a model without spatial autocorrelation of allele frequencies) and a scenario with distance-limited dispersal and population expansion. The average FST is similar in both scenarios; however, the distribution of FST is much narrower for the island model than for the more realistic scenario. Given that the island model is the assumed null model of some differentiation outlier methods (see below), a large number of loci will be falsely identified as under selection by these methods.
Figure 2.
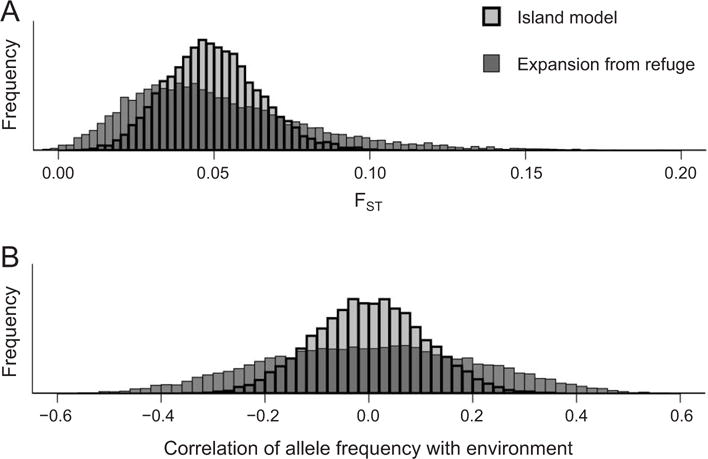
Details of the demographic pattern and history of a population can affect the distribution of signatures of spatially heterogeneous selection. A, The distribution of FST is plotted over replicate loci. B, The distribution of the correlation coefficient between allele frequency and an environmental variable is plotted. In both panels, all loci are truly neutral, and the differences between loci reflect chance deviations caused by biological and statistical sampling. In both panels, results shown with a thick line are from a population whose demography is well described by the island model. The thin line results come from a population that has recently expanded from a refuge with distance-limited dispersal. There are far more loci in the tails of the distributions for the refugia model than the island model, despite the fact that their mean FSTs are nearly identical. Simulated data are from Lotterhos and Whitlock (2015). A color version of this figure is available online.
Some demographic processes can lead to particularly idiosyncratic effects at individual loci. For example, some loci display false signatures of selection as a result of range expansion due to a phenomenon known as allele surfing (Currat et al. 2006; Travis et al. 2007; Excoffier et al. 2009a). Allele surfing occurs when populations on the leading edge of the expansion are small, and individuals from those populations contribute disproportionately to the propagating wave of expansion. This may cause rapid drift of some alleles at the expanding edge and high differentiation in allele frequencies over the landscape for some loci, even in the absence of selection. Another demographic process that can lead to idiosyncratic effects at individual loci is hybridization and introgression from related taxa (e.g., Geraldes et al. 2014; Fraïsse et al. 2016), which could confound genetic-environment associations and differentiation outlier methods focusedononespecies(Kane et al. 2009; Nachman and Payseur 2012; Brandvain et al. 2014; Bragg et al. 2015).
Spatial Autocorrelation and Genetic-Environment Associations
Neutral population genetic and demographic processes can generate correlations between the environment and genotype that are similar to those that arise from local adaptation. For example, northward expansion from a glacial refuge may generate clines in neutral allele frequencies at some loci from south to north, which by chance coincide with an environmental gradient, such as temperature. Even after the population reaches equilibrium, if dispersal is distance limited, the allele frequencies will be spatially autocorrelated— nearby populations will be more genetically similar than distant populations (i.e., isolation by distance [IBD]; Wright 1943). Spatial autocorrelation in environmental variables is also likely because habitats are generally more similar over close distances than long distances. Because nearby locations are not statistically independent, strong correlations between neutral alleles and environmental variables are more likely to occur by chance than expected with some null models. The example in figure 2B shows many more strong correlations between neutral allele frequencies and environmental factors in scenarios where dispersal is spatially limited than in an island model scenario. As with differentiation outlier methods, correlation analyses that assume each population is independent of its neighbors will have high false positive rates.
Locus-Specific Effects: Background Selection and Simultaneous Sweeps
Spatially uniform selection can generate genetic differences among populations that do not result in local adaptation. For example, deleterious alleles reduce fitness of their carriers regardless of local environmental conditions. Neutral alleles linked to those deleterious mutations are affected by stronger genetic drift than genetic markers that are farther from selected sites (background selection; Charlesworth et al. 1993). As a result, neutral sites near loci experiencing purifying selection will have greater variance in their contributions to future generations. This increase in genetic drift may cause stronger differentiation among populations for loci linked to sites experiencing purifying selection (Charlesworth and Charlesworth 1998; Hu and He 2005)—a pattern that can be mistaken for evidence of local adaptation (Cruickshank and Hahn 2014). In addition, such differentiation may by chance be correlated with the distribution of environmental factors over geographic space. Thus, coding regions may show higher FST than inter-genic areas (Cruickshank and Hahn 2014) and may be enriched for genetic-environment associations (as has been observed empirically by Lasky et al. 2012) because deleterious mutations are being selected against in all environments (purifying selection) and not because advantageous mutations are being selected for in some environments (local adaptation).
As a result of background selection, loci in polymorphic inversions may show higher FST than loci without structural rearrangements because inversions suppress meiotic recombination (Hoffmann and Rieseberg 2008). Although some have argued that single nucleotide polymorphism (SNP) correlations with environmental variables within inversions are difficult to explain under a model of background selection (Pyhäjärvi et al. 2013), explicit tests of how much bias is caused by background selection in association tests and differentiation methods have not been conducted. This is an important area for future research, as background selection is increasingly recognized as an important force shaping genomic diversity (James et al. 2016; Renzette et al. 2016), and theory suggests that demographic inference can be biased if background selection is not accounted for properly (Ewing and Jensen 2016).
Another example that can generate genetic differences among populations that resemble local adaptation is spatially uniform positive selection. If an optimal phenotype can be achieved by more than one mutation and migration is sufficiently limiting, different beneficial mutations may arise to solve the same problem in multiple geographic locations (Ralph and Coop 2015). This leads to patchy geographic distribution of alleles despite spatially uniform selection, a pattern that might be mistaken for local adaptation to patchy environments. Moreover, it is also possible for a single selected mutation to arise on different haplotypes in different populations that are experiencing the same selective pressure (soft sweeps; reviewed in Messer and Petrov 2013). This can also generate a patchy geographic distribution of haplotypes that may be mistaken for local adaptation. Recent theoretical work suggests that soft sweeps may be common (Pennings and Hermisson 2006; Ralph and Coop 2010, 2015; but see Jensen 2014).
In both cases—purifying selection and positive selection—linked selection either via background selection or hitchhiking can lead to higher among-population differentiation as measured by FST, because FST is also sensitive to the reduction in within-population variation caused by such selection (Cruickshank and Hahn 2014).
Solutions: Controlling for Demographic History
Approaches to address the confounding effects of demography and drift fall into two major categories (table A1): (1) using null models based on the inferred demographic history of the species and (2) using relatedness among sampled populations to correct for neutral population structure in the data. The former is likely to have high false positives if the true demography does not match the assumed demography, while the latter is more flexible and generally less biased as long as a genome-wide random set of loci accurately captures the covariance or relatedness among samples.
Demographic Null Models
One approach for accounting for the neutral population structure of a sample requires specifying an explicit demographic model and using simulations to generate a null distribution of a test statistic against which the observed data can be compared. Early methods for differentiation outlier detection assumed that the study system followed the island model (assumed by fdist2 [Beaumont and Nichols 1996]; table A1) or a multinomial Dirichlet distribution (e.g., BayeScan [Foll and Gaggiotti 2008]; table A1). These methods have very high false positive rates under IBD or other more complex demographies (de Villemereuil et al. 2014; Lotterhos and Whitlock 2014). A reasonable alternative is to model a specific demography, which can be used as long as the species’ true structure can be accurately captured by the model (e.g., hierarchical island model [Excoffier et al. 2009a; Hofer et al. 2012] or two-refugia model [Eckert et al. 2010]). However, if the modeled demography does not match the study species’ true demographic history, this mismatch may increase both type I and type II error rates (Pérez-Figueroa et al. 2010; Narum and Hess 2011; Vilas et al. 2012; De Mita et al. 2013; Jones et al. 2013; de Villemereuil et al. 2014; Lotterhos and Whitlock 2014). Additionally, demographic null models accounting for introgression, admixture, and other complex processes have not been developed.
Sample Covariance/Relatedness
Some methods use the observed genetic data to estimate a measure of covariance or relatedness among samples (populations or individuals) and use this measure to correct for neutral structure. There are multiple ways to characterize these covariances, such as covariance in allele frequencies among populations (Coop et al. 2010; Günther and Coop 2013; Gautier 2015; table A1), a treelike population history (Bonhomme et al. 2010), and relatedness or other latent factors in a mixed model. These approaches require that most of the data come from loci not subject to strong spatially heterogeneous selection. Having a high proportion of selected loci relative to neutral loci in the data set can affect the results (e.g., >10% in Lotterhos and Whitlock 2014), but this needs to be more thoroughly investigated.
The covariance approach uses a subset of variable loci to estimate the sample covariance in allele frequencies among populations and may use simulations based on the covariance matrix to generate a null distribution (Gautier 2015). The population tree approach uses the data from many SNPs to estimate a tree of genetic divergence among populations (assuming no migration but accounting for shared ancestry of closely related populations) and then simulates data based on these trees to generate a null distribution (Bonhomme et al. 2010). On simulated data sets, these methods have reduced or similar false positive rates compared to methods based on demographic null models but still have somewhat elevated false positive rates under a range expansion scenario (De Mita et al. 2013; Lotterhos and Whitlock 2014).
The linear model approach typically captures patterns of neutral population structure by incorporating relatedness, principal components (Price et al. 2006), or other matrix factorizations (Engelhardt and Stephens 2010) of the genotype matrix as random factors, latent factors, or covariates in a model. Incorporating population structure with latent factors can improve the accuracy of both genetic-environment association and differentiation outlier tests (Frichot et al. 2013; Duforet-Frebourg et al. 2014; Lotterhos and Whitlock 2015).
Covariance and linear model approaches have no explicit underlying population demographic model and, therefore, have great flexibility, albeit at the possible expense of some statistical power because (unknown) selected loci are typically included in the data set used to generate the null model. However, these approaches still make assumptions that may imperfectly describe the true null distribution in cases with idiosyncratic locus effects, such as background selection or allele surfing. To account for this, some authors take careful steps to match SNPs used to calculate the covariance matrix to the SNPs used in the test for adaptation (Berg and Coop 2014). Although a number of simulation studies have compared the power of different approaches (Pérez-Figueroa et al. 2010; Narum and Hess 2011; Vilas et al. 2012; De Mita et al. 2013; Jones et al. 2013; de Villemereuil et al. 2014; Forester et al. 2015), only a few have captured effects of allele surfing (Lotterhos and Whitlock 2014, 2015) and none have included background selection.
Other Models
Newer methods may better capture the effects of neutral but idiosyncratic loci (see table A1). A recent approach uses maximum likelihood to generate parameters of the FST distribution in the absence of selection (Whitlock and Lotterhos 2015). Other alternative approaches include using permutations (Jones et al. 2012) or putatively neutral loci (Akey et al. 2002; Fullerton et al. 2002; Elhaik 2012) to create an empirical null distribution (table A1). In the latter case, if the neutral loci used to generate the null distribution are not subject to selection of any form, they may be less affected by background selection and, therefore, not correct for that alternative hypothesis. These methods have yet to be widely tested by simulations but, along with covariance, population tree, and linear model methods, will likely improve identification of the loci underlying local adaptation.
The Missing Genome: Current Genotyping and Sequencing Approaches May Fail to Identify Key Loci
Genotyping Approaches
All widely used sequencing methods, particularly those that are relatively inexpensive, ascertain reliable sequences for only a fraction of the genome. Consequently, many of the genomic regions that may be involved in local adaptation may be missed in typical sequencing studies. Sparsely distributed fragment-based markers (e.g., microsatellites) are inadequate to identify adaptive loci (reviewed in Tiffin and Ross-Ibarra 2014). Even DNA genotyping chips and reduced representation methods (e.g., restriction site–associated DNA sequencing [RAD-seq]) are often too sparse to detect adaptive loci. As whole genome resequencing becomes accessible to nonmodel systems, there are greater opportunities to identify loci under selection (Cheng et al. 2012; Long et al. 2013). Even with such methods, however, some important genomic regions may be difficult to assess.
Most genomic studies of nonmodel systems currently use reduced-representation methods (defined as anything less than whole genome resequencing; table A2). One set of such methods targets transcribed regions, such as RNA sequencing (RNA-seq; which relies on sequencing transcript pools; no a priori sequences needed) and exome capture (which uses probes designed from known sequences to obtain sequence from exons). Because these approaches focus on coding regions, they may be more successful in identifying putatively adaptive loci. However, unless linkage disequilibrium is high between regulatory and coding regions, these methods may fail to capture variation involved in gene regulation—such as enhancers and copy number variation—that may underlie the majority of adaptive phenotypic variation (Wray et al. 2003; Perry et al. 2007; Rockman 2012; Stern and Orgogozo 2008). Exome capture approaches require a large initial investment in capture probe design (Bamshad et al. 2011; Schlötterer et al. 2014; Jones and Good 2016). RNA-seq may not be representative of the whole exome because experiments may miss genes with low expression levels, expressed in unsampled tissues or not expressed in the measured condition. Additionally, allele frequencies estimated from pooled RNA-seq samples may be biased by allele-specific expression (Schlötterer et al. 2014; Steige et al. 2015). Despite these challenges, RNA-seq methods are a reasonable approach for genotyping to detect local adaptation in at least some loci for a species with a large unassembled genome (Kozak et al. 2014; Schlötterer et al. 2014).
A second set of methods for reduced representation uses restriction enzymes to isolate small pieces of DNA (such as restriction-associated digest sequencing [RAD-seq] or genotyping by sequencing [GBS; reviewed in Puritz et al. 2014b; Andrews et al. 2016]; table A2). These methods are useful for building genetic linkage maps and establishing neutral patterns of population structure (Andolfatto et al. 2011; El-shire et al. 2011). However, these SNPs are only a small proportion of the genome, and any gene that is not closely linked to a marker will be missed. For example, a 6-bp cutter will cut approximately every 4,096 bases with 50% guanine-cytosine contentin the genome (Schweyen et al. 2014; Andrews et al. 2016), and the corresponding RAD-seq library would capture only ∼5% of the genome (a relationship that scales with genome size)—an optimistic estimate because many loci would be lost to low coverage or filtering (fig. 3). Tiffin and Ross-Ibarra (2014) showed that only a small proportion of the strongest selective sweeps will be detected even when SNPs are ascertained every 5,000 bases in humans (linkage disequilibrium [LD] decay ~10 kilobases [kb]) or every 1,000 bases in species with higher recombination rates (LD decay ∼ 1 kb). Thus, restriction enzyme–based methods alone are likely to fail to detect most of the loci involved in local adaptation, except where linkage disequilibrium is extensive, such as in chromosomal inversions (e.g., Twyford and Friedman 2015). In addition, some widely used de novo assembly programs for RAD loci may incorrectly assemble a RAD locus that contains insertions and/or deletions (indels) into different loci (fig. 3; but see Puritz et al. 2014a for a pipeline that can handle indels).
Figure 3.
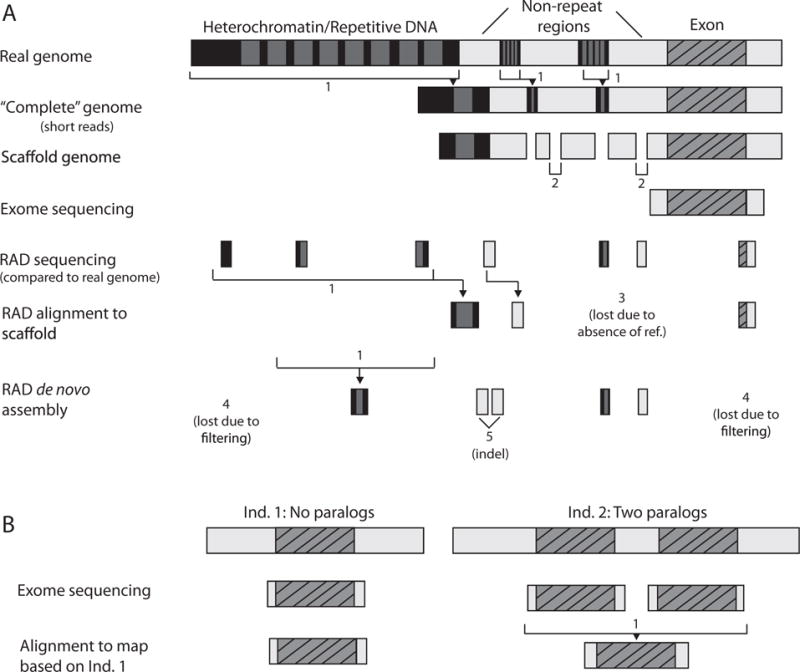
Genomic information can be lost and errors can accumulate during assembly, alignment, and reduced-representation sequencing. A, The complete reference genome largely excludes highly repetitive regions such as heterochromatin and other repeats, due to the difficulty of sequencing and assembling highly repetitive regions (1). The collapse of repetitive elements is a problem across most genome assembly methods, although long reads can help resolve some repetitive regions (not shown). A scaffold genome uses short-paired reads to stitch together contigs into scaffolds by indicating that an unknown chunk of sequence exists between the two known linked pieces (2); however, significant portions of nonrepetitive sequence, along with repetitive regions, will remain unassembled in a scaffold genome. The raw data from exome sequencing will include the exons and flanking regions, while the restriction site–associated DNA sequencing (RAD-seq) method will produce short fragments from throughout the genomes. Exome sequencing will miss potentially functional noncoding polymorphisms that are not in close physical proximity to an exon. RAD-seq can, however, potentially capture noncoding polymorphisms, but the data is sparse. In the alignment of RAD-seq to a scaffold, some tags may be lost in alignment due to missing homologous sequences in the reference genome (3). De novo assemblies of RAD-seq data produce only very short, unordered contigs; some RAD loci may be lost during assembly due to low coverage or filtering (4), while others that contain indels may be incorrectly assembled into different RAD loci (5). B, Variation in the number of gene duplicates can lead to loss of information about the paralogous copies. If individual 1 is used to generate the reference genome, the paralog may be missed and collapsed in individual 2, unless read depth information is used in conjunction with mapping. Divergence among paralogous copies may lead to incorrect identification of heterozygous sites in individual 2. A color version of this figure is available online.
The number and type of markers used in a study will not only affect the proportion of the genome sampled, but it will also influence the calibration of the null distribution. Using a few hundred SNPs may suffice to estimate population structure, but for some methods, it is not enough to create a well-calibrated null distribution for testing selection with genome scans. Conversely, a large number of loci (i.e., millions) are unlikely to be completely independent because of linkage, and the effect of nonindependence of loci in large data sets on the performance of these methods has not been assessed. Furthermore, using a biased set of loci (i.e., a large proportion of candidate genes) will also bias the null distribution and decrease power, because these genes are most likely to have high differentiation or correlations with the environment.
An efficient alternative to reduced representation approaches, which can allow for sequencing whole genomes of moderate size, is to pool individuals from the same population and label them with the same barcode. This pool-seq approach can be a cost-effective means to conduct whole-genome outlier analyses (Cheng et al. 2012; Zhu et al. 2012). Pool-seq can be powerful, provided that a good experimental design is implemented, with a large number of individuals (>100) sequenced per population and high read depth (>100-fold) per pool (Schlötterer et al. 2014). In a pool-seq experiment, it is also important that pooled individuals come from a genetically homogeneous population; cryptic population structure will lead to incorrect population allele frequency estimates. Unbalanced contributions of DNA to the pool could also lead to incorrect allele frequency estimates.
Genome Structural Variation
Genome structural variation involves any change in the length (insertions and deletions) or relative organization (e.g., inversions, translocation, copy-number differences) of a genome. Repetitive regions and transposable elements can increase the rate of mutations causing structural variation (Hardison et al. 2003; Vitte et al. 2014). Structural variants are known to be involved in local adaptation, including copy number variation (Perry et al. 2007; Prasad et al. 2012a), inversions (Lowry and Willis 2010; Kunte et al. 2014), and transposon insertions (González and Petrov 2009; Casacuberta and González 2013). Because reference genomes are usually based on one individual and because most genome assembly methods collapse repetitive elements, reference genomes do not contain all the segregating structural variation present within a species (Tiffin and Ross-Ibarra 2014; Bragg et al. 2015; fig. 3). Also, many structural variants will be missed by standard genotyping programs (fig. 3), although new software for detecting structural variants exists (see Lin et al. 2015 for available approaches and software packages). Accurate ascertainment of structural variants among individuals is a major challenge (McCarroll and Altshuler 2007).
Solutions
No silver bullet exists to solve the challenges involved with genotyping, but various strategies can help minimize their impact. For example, sequencing samples to a reasonable read depth can minimize genotyping error for individuals (>10-fold read depth [Han et al. 2014; although see also Korneliussen et al. 2014]) and for pooled samples (>100-fold read depth [Schlötterer et al. 2014]). Because using different variant caller programs or different settings within a program can affect results (Cantarel et al. 2014; Lin et al. 2015; Nevado and Pérez-Enciso 2015), it is prudent to use stringent filtering of identified variants so that only sites with the greatest confidence are included in analyses.
Developing a reference genome can greatly improve the inference of the genetic basis of local adaptation. An assembled reference genome ensures more accurate genotyping with fewer errors by providing a reference for sequence reads to be mapped, and SNPs called for using a variety of bioinformatic tools (e.g., BWA [Li and Durbin 2009], GATK [McKenna et al. 2010], and SAMTools [Li et al. 2009]). A reference genome also allows for haplotype structure assessment and, in turn, analyses of signatures of selective sweeps (Maynard Smith and Haigh 1974; Gibson et al. 2006; Sabeti et al. 2007; see table 1). An annotated reference genome also allows researchers to identify the location of candidate adaptive variants in relation to genes and regulatory regions, to facilitate interpretation of results and downstream assays to confirm putative function.
A reference genome assembly can be constructed de novo from high-throughput sequence data. However, assembly errors are common, and, even with the same input data, alternative assembly algorithms and assembly parameters can result in different assemblies (Earl et al. 2011). Multiple methods should be implemented in parallel and compared to achieve the best assembly (Earl et al. 2011; Bradnam et al. 2013). In addition, reference genomes based on short-read technologies can be greatly improved by including some data from longer-read platforms to generate a hybrid genome assembly (English et al. 2012; Koren et al. 2012). Genome assembly can also be greatly improved using genetic mapping populations to create a linkage map (Fierst 2015) and/or through optical mapping that places scaffolds on chromosomes (Sharma et al. 2013; Tang et al. 2015a, 2015b; VanBuren et al. 2015).
The use of multiple reference genomes that are representative of the variation in a focal taxon, as well as advances in the alignment of repetitive regions, will help alleviate these problems. Indeed, long reads from the Pacific Biosciences Single Molecule, Real-Time (SMRT) platform currently produce highly connected de novo assemblies with low error rates (Berlin et al. 2015; English et al. 2015; Pendleton et al. 2015; VanBuren et al. 2015). In the near future, the use of multiple reference genomes and de novo assemblies from long reads (>1 kb) will allow for detection of a more complete complement of structural variants (Tiffin and Ross-Ibarra 2014; VanBuren et al. 2015).
Even with a reference genome, repetitive regions and paralogs may be missed, inaccurately assembled, or eliminated by quality-control pipelines because the canonical reference genome is not representative of the population (fig. 3). Reproducibility across studies can be hampered because bioinformatic SNP-calling pipelines applied to the same raw data sets can result in different sets of called SNPs depending on the stringency of filtering parameters (Cantarel et al. 2014; Nevado and Pérez-Enciso 2015). Despite these challenges, having a reference genome can greatly improve inference.
The Missing Landscape: Spatial and Temporal Scales in Environmental Variables
Accurate detection of locally adapted loci using genetic-environment association methods depends on accurate measures of the aspects of the ecological landscape that affect fitness. Low-resolution environmental data may reduce the accuracy of results even if the selective environment is known. Knowing the dispersal ecology of the study organism can guide the optimal spatial scale, resolution, and extent of sampling (Addicott et al. 1987; Wagner and Fortin 2005; Anderson et al. 2010). The resolution of the environmental data must be fine enough to characterize each local population well (Anderson et al. 2010; DeFries and Rosenzweig 2010). Temporal considerations are also important. For example, WorldClim data (http://www.worldclim.org/) include minimum and maximum temperatures, but these are averaged over several months, and the important selective forces for a given organism may actually be the date when temperature crosses a key threshold (e.g., in coral bleaching; Brown 1997). Such brief but critical environmental events might be averaged away over several days or months of data. Specific issues regarding the resolution of the ecological landscape have recently been discussed in a review by Rellstab et al. (2015).
The lack of available geographic information system layers and weather station data can limit the number of putative abiotic agents of selection that can be tested. Moreover, multicollinearity among landscape variables may lead to incorrectly identifying an environmental variable as the true cause of selection when genetic patterns and adaptation are actually caused by a correlated environmental variable. For instance, a locus may be associated with an abiotic factor, when adaptation is actually caused by a biotic factor such as competition, predation, or sexual selection that covaries with the environmental gradient being sampled (Rundle and Nosil 2005).
Solution
A priori natural history knowledge often allows a researcher to formulate specific hypotheses about which environmental gradients are important to local adaptation; these hypotheses should be used to inform the choice of environmental variables used in a study. When there are no specific hypotheses about the nature of local adaptation, researchers can choose explanatory environmental variables and avoid problems with multicollinearity by selecting one environmental variable as a representative of a correlated set (e.g., Trumbo et al. 2013). An alternative strategy is to summarize correlated environmental variables in a dimensionality reduction analysis such as principle components analysis (or others; see Lasky et al. 2012) and correlate allele frequencies with those principal components. As with any regression analysis, care should be taken in interpreting genetic-environment correlations because the causal environmental variables may be unmeasured but correlated with those included in the analysis.
Other Statistical Challenges
The Importance of Sampling Design
Studies of the genomic basis of local adaptation are rarely designed to optimize sampling to maximize power. Optimal design requires considering the geographic scale at which local adaptation occurs in the study system, which can be established using ecological knowledge, reciprocal transplants, natural history, and knowledge from similar systems. Investigators should also consider the geographic coverage of their study: when genetic data cover only a small portion of the species range, it may be inappropriate to extrapolate results to the entire species’ range (Short Bull et al. 2011; Trumbo et al. 2013).
One powerful sampling strategy includes collecting at multiple (replicated) paired locations in the species’ range where there is known or strongly suspected differentiation caused by local adaptation, where gene flow should reduce differentiation of loci not under selection (e.g., Turner et al. 2010 for Arabidopsis lyrata; Jones et al. 2012 for sticklebacks; Foll et al. 2014 for human altitude adaptations). Sampling along transects is not optimal because much of the sampling effort merely describes intermediate populations, which contribute little to the power to detect correlations or genetic differences (Lotterhos and Whitlock 2015). However, for some study questions, transect sampling is appropriate—for example, across a zone of introgression (as in Geraldes et al. 2014) or if the population is hypothesized to be locally adapted to intermediate conditions and maladaptive at the extremes. The power of a paired design will decrease if the genetic basis of adaptation is not shared among sampled populations (Elmer and Meyer 2011; also see “Genetic Architecture of the Trait”). On the other hand, if the genetic basis of adaptation is shared among sampled populations, data from a paired design can, in some cases, greatly increase power to detect convergent evolution (as in human adaptation to high altitude; Foll et al. 2014).
Another challenge of study design is determining the number of locations and the number of individuals per location to sample. In general, the power of an analysis depends on the total number of individuals sampled (Lotterhos and Whitlock 2015). For methods that require local population allele frequencies (e.g., FST), sampling an appreciable number (>10) of diploid individuals from each location is important because small sample sizes will generate inaccurate local allele frequency estimates. Genetic-environment association methods may be more robust to smaller sample sizes per location if many locations that vary in the selective environment are sampled (De Mita et al. 2013; Lotterhos and Whitlock 2015). A noncomprehensive review of articles showed that most empirical studies sample between 100 and 1,000 individuals in total (from 5–40 locations), with anywhere from several hundred to hundreds of thousands of SNPs genotyped (fig. A1, available online; see “The Missing Genome: Current Genotyping and Sequencing Approaches May Fail to Identify Key Loci” for caveats of SNP density). While recent simulation studies encompass this sampling scale (fig. A1), in the near future it will be computationally challenging to simulate and analyze the genome-scale data that will be possible to collect in empirical studies.
Multiple Comparisons
Genome scans inherently involve large numbers of statistical tests, because the same test is applied to each of several thousand or million loci in the data set. The result is a dis tribution of P values or test statistics for that data set, and many of the identified loci will be false positives if multiple testing is not corrected for (Sham and Purcell 2014). The most common approach to deal with multiple comparisons is to use a false discovery rate (FDR; e.g., Benjamini and Hochberg 1995; Storey and Tibshirani 2003). FDR correction methods are based on the observed distribution of P values. This can be problematic because P values are based on an assumed null distribution, which has many assumptions that can be violated by real data. Thus, the stated FDR can deviate significantly from the true underlying FDR, and the FDR should consequently be interpreted carefully in light of the underlying statistical models. In some cases, the FDR can be recalibrated based on genomic inflation methods, which estimate and correct for the degree to which P values are inflated (François et al. 2016). After calibration of the FDR for a single statistical analysis, one may want to compare outliers from multiple statistical analyses. A common approach for combining results from multiple tests is to focus on the loci that are significant by more than one test, but this will likely miss loci under weak selection (Lotterhos and Whitlock 2015) and does not guarantee that the overall false discovery rate is decreased. A recent synthesis by François et al. (2016) shows how P values from different genome scans applied to the same data set may be combined if the test statistics follow a χ2 distribution. Determining guidelines for combining results from different (but correlated) statistical tests (particularly Bayes factors and P values) is a fruitful area for future research.
Sliding Window Scans
Some of the issues in multiple comparisons, particularly that of nonindependence among linked SNPs, may be alleviated by using genome window-based methods (Kelly et al. 2013; Amorim et al. 2015; Wright et al. 2015; Fraïsse et al. 2016). These methods calculate summary statistics, such as FST, across a set of adjacent markers for defined windows across the genome and can greatly improve results of outlier analyses. Window-based methods are implemented for a number of compelling reasons: (1) SNPs at adjacent loci are nonindependent due to linkage, (2) statistical power to identify outliers is increased, and (3) sampling noise caused by spurious genotyping calls and other sampling errors is reduced. Choice of window size will influence the outcome of these studies. Large window sizes tend to create many false positives, while smaller windows tend to increase the number of false negative results (Beissinger et al. 2015). Window size would ideally be informed by genome-wide patterns of LD. However, because assessment of LD is often difficult, window size is commonly defined by physical distance of a genome (e.g., 100-kb windows; Carlson et al. 2005) or by polymorphism in the samples of the study (e.g., 10-SNP windows; Kelly et al. 2013). To guide decisions in implementing window-based methods, Beissinger et al. (2015) recently developed a spline-based method to choose window size. Another major consideration for window-based methods is whether to calculate summary statistics for nonoverlapping distinct windows (which have the advantage of reducing the number of tests but the disadvantage of potentially splitting true outlier regions into two non-significant windows) or for overlapping sliding windows (which have the advantage of smoothing of the data but the disadvantage of highly correlated statistics between overlapping windows). How one corrects for multiple tests in a sliding window analysis will depend on the approach used. Although the field currently lacks clear guidelines for null hypothesis testing in sliding windows, they can be a powerful approach to identify putatively selected loci.
Genetic Architecture of the Trait
Genetic architecture refers to the pattern of genetic effects that underlie the phenotype, including the number of genomic regions, the recombination rates among those regions (i.e., their relative physical positions on chromosomes), the distribution of fitness effects, and the degree of redundancy, as well as patterns of dominance, pleiotropy (multiple traits affected by the same gene), and epistasis (gene interactions; Hansen 2006). Genomic heterogeneity in mutation and recombination rates can complicate tests for selection (Haasl and Payseur 2016). Most simulation studies that have tested genome scans have modeled relatively simple genetic architectures in simple scenarios (from unlinked haploid loci to a phenotype affected by up to 40 loci, usually in an island model or stepping-stone model: e.g., Le Corre and Kremer 2012; de Villemereuil et al. 2014), so we have a poor understanding of how genome scans perform across more complex genetic architectures. All methods to detect local adaptation are known to be biased toward detecting loci with large effects on the phenotype.
It has been argued that most heritable variation for phenotypes is due to small-effect loci (e.g., Rockman 2012) and that the polygenic architectures that underlie quantitative traits (continuously varying phenotypes) are probably elusive to most genome scans (Barton and Keightley 2002; Stephan 2016). For polygenic traits composed of many small-effect loci, evolution at the genomic level does not necessarily follow the expectations of single-locus models (Barton and Bengtsson 1986; Latta 1998; Le Corre and Kremer 2003; Kremer and Le Corre 2012; Yeaman 2015). While single-locus (population genetic) models would predict that small-effect alleles would be swamped by migration (Lenormand 2002), these studies show that considerable phenotypic local adaptation can evolve via covariance among modest changes in allele frequencies and effect sizes. Recent empirical studies have used machine learning algorithms (random forests) to infer groups of covarying loci that associate with environmental variables (Lasky et al. 2012; Fitzpatrick and Keller 2014; Laporte et al. 2016), but these methods have not been widely evaluated using simulations.
For highly polygenic architectures, integrating information from genome-wide association studies (GWAS) into statistical tests can be beneficial. For example, Turchin et al. (2012) showed that frequencies of alleles associated with increased human height were systematically elevated in the taller Northern European population compared with the shorter Southern Europeans. The signature of selection was validated with ancient DNA (Mathieson et al. 2015). A new method by Berg and Coop (2014) that incorporates positive covariance among like-effect alleles into a generalized test for genetic-environment associations could be a powerful approach. However, this method has not yet been systematically evaluated or widely applied.
Functionally redundant architectures may also be elusive to genome scans. A genetic architecture is redundant if different combinations of alleles at different loci can give rise to the same phenotype (Goldstein and Holsinger 1992; Nowak et al. 1997). For example, mutations in more than 25 different genes can produce dark fur in mice (Kingsley et al. 2009). Functional redundancy seems to be widespread (Nowak et al. 1997), but the most well-characterized examples are of genes with large effects on phenotypes. Redundant architectures may confound genome scans because each local bout of adaptation could involve a different genetic change, and genome scan methods assume a shared genetic basis of adaptation across the landscape. A number of studies have found nonparallel adaptation (Tiffin and Ross-Ibarra 2014), including drug resistance in malaria (Anderson and Roper 2005; Pearce et al. 2009), high-elevation adaptation in humans (Bigham et al. 2010), and melanism in deer mice (Kingsley et al. 2009). Furthermore, theory predicts that when loci are weakly selected, redundant architectures may be transient, with different loci contributing at different points in time (Yeaman 2015). Other aspects of realistic genetic architectures, such as pleiotropy and epistasis, are also likely to confound genome scans. Evaluating the performance of genome scans under more realistic scenarios is a rich area for future study.
Discussion
Identifying the number and location of loci involved in local adaptation is a starting point to characterizing the genomic basis of local adaptation (see Bergelson and Roux 2010; Tiffin and Ross-Ibarra 2014; Bragg et al. 2015). Although a correlation of the frequencies of particular alleles with environments may help to answer some questions (e.g., whether common adaptive evolutionary solutions are repeated in independent locations), complementary analyses and experiments are needed to develop a robust understanding of local adaptation. Researchers should consult recent reviews on ecological adaptation (Kawecki 2008; Schoville et al. 2012; Savolainen et al. 2013; Tiffin and Ross-Ibarra 2014), genetic-environment association methods (Rellstab et al. 2015), genomic resource development (Stapley et al. 2010; Ellegren 2014; Bragg et al. 2015; Manel et al. 2016), signatures of selection (Vitti et al. 2013), and mapping variation underlying adaptive phenotypes (Bergelson and Roux 2010; Barrett and Hoekstra 2011).
Differentiation outlier and genetic-environment association analyses often produce lists of hundreds of candidate loci. Each candidate locus represents an independent hypothesis that the locus is involved in local adaptation. However, few hypotheses can be experimentally tested because of the costs of functional validation. It is imperative to carefully choose the most promising variants to focus on for validation, such as variants identified in multiple analyses across data sets, or variants in coding regions or nearby regulatory regions. Other strong signatures of selection, such as locally reduced heterozygosity in the region of the locus (Maynard-Smith and Haigh 1974) or a high dN/dS ratio (Kimura 1977; Nielsen and Yang 2003), may also provide secondary validation that a locus identified in a genome scan is worthy of further scrutiny (Joost et al. 2013; Vitti et al. 2013; e.g., Yoder et al. 2014).
Functional validation involves a quantitative comparison of fitness or a trait in individuals with or without the allele(s) of interest in an appropriate environment (Barrett and Hoekstra 2011; Savolainen et al. 2013). Historically, this has been performed with transgenic techniques or with RNAi (RNA interference; e.g., Van Tyne et al. 2011; Prasad et al. 2012b). With new genome modification methods (e.g., CRISPR/Cas9; reviewed in Bono et al. 2015), allelic function can be tested in a wider range of organisms with a previously unachievable level of precision. Functional validation under field conditions is ideal but is likely impossible for most experimental systems due to logistical, legal, and ethical challenges. In these organisms, multiple independent experiments may be needed to create strong evidence that a particular locus influences a trait and is involved in adaptation.
Future directions
There is an ongoing need for the development of new methods for genome scans for selection and for testing their performance via simulation in various situations (e.g., varying genetic architectures, demographic histories, and selection strengths). Moreover, there is a need to integrate the different approaches (GWAS, genetic differentiation, and phenotype-environment association) into a common statistical framework (Tiffin and Ross-Ibarra 2014; Bragg et al. 2015).
As additional genomes are sequenced, it is vital to develop methods for analyzing structural variation (insertions/deletions, copy number variation, transposable elements) in conjunction with SNP variation. We also need to develop and test multivariate approaches that can detect covarying signals across multiple loci (e.g., Turchin et al. 2012; Berg and Coop 2014; Fitzpatrick and Keller 2014; Forester et al. 2015; Laporte et al. 2016), as it is still not known how frequently signals of local adaptation can be identified and attributed to particular genes (whether few or many). Moreover, in some cases, local adaptation will result from small, potentially undetectable, covarying shifts in frequency at many loci (e.g., from highly polygenic traits).
The approaches that have been used for decades for understanding local adaptation are changing. While the reciprocal transplant experiment continues to be the fundamental standard for demonstrating local adaptation, the promise of genome sequencing has increased the likelihood that investigators will start a local adaptation project with genetic data rather than phenotypic data as their first observation. We emphasized that such investigations require several preliminary steps. First, it is important to understand the demographic history, population structure, and ecology of the study organism(s) to reduce false positives and to inform sampling site locations. Second, developing genomic resources (e.g., an annotated reference genome) or leveraging existing resources (e.g., the genome of a close relative) increases the range of analyses that can be performed and the strength of inferences that can be drawn. Third, environmental variables and sampling design should be chosen with care, and strong a priori hypotheses about the agents of selection should inform the location of sampling sites.
We conclude that the careful use of genome scans can assist in identifying loci under selection but are best used in conjunction with GWAS or linkage-mapping approaches. Concerted approaches are needed to address general questions in ecology and evolutionary biology, such as what forces govern the abundance and distribution of genetic variation, whether natural selection acts on standing variation or new mutations, or what role local adaptation may play in speciation. Together, genomic technologies combined with new methodologies for analyses offer an exciting opportunity to synthesize information across biological levels of organization to address long-standing fundamental questions.
Supplementary Material
Acknowledgments
This work was conducted as a part of the Computational Challenges in Landscape Genomics Working Group at the National Institute for Mathematical and Biological Synthesis, sponsored by the National Science Foundation (NSF) through NSF Award DBI-1300426, with additional support from the University of Tennessee, Knoxville. This grant also supported S.H. as a postdoctoral fellow. This work was supported by the following grants: NSF 1402725 to G.B., NSF DEB-1316549 to A.S., Army Research Office W911NF-15-1-0175 to J.L.K., National Institute of General Medical Sciences R01GM098856 to L.K.R., Natural Sciences and Engineering Research Council Discovery Grant to M.C.W. We would also like to thank A. Hipp, K. Hoke, D. Irwin, J. R. Lasky, A. Strand, and two anonymous reviewers for helpful comments and discussions.
Biography

The authors (NIMBioS working group). Top row, left to right: Michael Antolin, Joanna Kelley, Andrew Storfer, Katie Lotterhos, Sean Hoban, David Lowry, Laura Reed. Bottom row, left to right: Michael Antolin, David Lowry, Gideon Bradburd, Sean Hoban, Mary Poss, Michael Whitlock, Andrew Storfer, Laura Reed. Photo credit: NIMBioS.
Footnotes
ORCIDs: Kelley, http://orcid.org/0000-0002-7731-605X; Antolin, http://orcid.org/0000-0001-6498-617X.
Associate Editor: Charles F. Baer
Editor: Alice A. Winn
Literature Cited
- Addicott JF, Aho JM, Antolin M, Padilla D, Richardson J, Soluk DA. Ecological neighborhoods: scaling environmental patterns. Oikos. 1987;49:340–346. [Google Scholar]
- Aitken SN, Whitlock MC. Assisted gene flow to facilitate local adaptation to climate change. Annual Review of Ecology, Evolution, and Systematics. 2013;44:367–388. [Google Scholar]
- Akey JM, Zhang G, Zhang K, Jin L, Shriver MD. Interrogating a high-density SNP map for signatures of natural selection. Genome Research. 2002;12:1805–1814. doi: 10.1101/gr.631202. [DOI] [PMC free article] [PubMed] [Google Scholar]
- Amorim CEG, Daub JT, Salzano FM, Foll M, Excoffier L. Detection of convergent genome-wide signals of adaptation to tropical forests in humans. PLoS ONE. 2015;10:e0121557. doi: 10.1371/journal.pone.0121557. http://dx.doi.org/10.1371/journal.pone.0121557. [DOI] [PMC free article] [PubMed] [Google Scholar]
- Anderson CD, Epperson BK, Fortin MJ, Holderegger R, James P, Rosenberg MS, Scribner KT, Spear S. Considering spatial and temporal scale in landscape-genetic studies of gene flow. Molecular Ecology. 2010;19:3565–3575. doi: 10.1111/j.1365-294X.2010.04757.x. [DOI] [PubMed] [Google Scholar]
- Anderson JT, Willis JH, Mitchell-Olds T. Evolutionary genetics of plant adaptation. Trends in Genetics. 2011;27:258–266. doi: 10.1016/j.tig.2011.04.001. [DOI] [PMC free article] [PubMed] [Google Scholar]
- Anderson TJC, Roper C. The origins and spread of antimalarial drug resistance: lessons for policy makers. Acta Tropica. 2005;94:269–280. doi: 10.1016/j.actatropica.2005.04.010. [DOI] [PubMed] [Google Scholar]
- Andolfatto P, Davison D, Erezyilmaz D, Hu TT, Mast J, Sunayama-Morita T, Stern DL. Multiplexed shotgun genotyping for rapid and efficient genetic mapping. Genome Research. 2011;21:610–617. doi: 10.1101/gr.115402.110. [DOI] [PMC free article] [PubMed] [Google Scholar]
- Andrews KR, Good JM, Miller MR, Luikart G, Hohenlohe PA. Harnessing the power of RADseq for ecological and evolutionary genomics. Nature Review Genetics. 2016;17:81–92. doi: 10.1038/nrg.2015.28. [DOI] [PMC free article] [PubMed] [Google Scholar]
- Bamshad MJ, Ng SB, Bigham AW, Tabor HK, Emond MJ, Nickerson DA, Shendure J. Exome sequencing as a tool for Mendelian disease gene discovery. Nature Reviews Genetics. 2011;12:745–755. doi: 10.1038/nrg3031. [DOI] [PubMed] [Google Scholar]
- Barrett R, Hoekstra H. Molecular spandrels: tests of adaptation at the genetic level. Nature Reviews Genetics. 2011;12:767–780. doi: 10.1038/nrg3015. [DOI] [PubMed] [Google Scholar]
- Barton NH, Bengtsson BO. The barrier to genetic exchange between hybridising populations. Heredity. 1986;57:357–376. doi: 10.1038/hdy.1986.135. [DOI] [PubMed] [Google Scholar]
- Barton NH, Keightley PD. Understanding quantitative genetic variation. Nature Reviews Genetics. 2002;3:11–21. doi: 10.1038/nrg700. [DOI] [PubMed] [Google Scholar]
- Beaumont MA. Adaptation and speciation: what can FST tell us? Trends in Ecology and Evolution. 2005;20:435–440. doi: 10.1016/j.tree.2005.05.017. [DOI] [PubMed] [Google Scholar]
- Beaumont MA, Nichols RA. Evaluating loci for use in the genetic analysis of population structure. Proceedings of the Royal Society B: Biological Sciences. 1996;263:1619–1626. [Google Scholar]
- Beissinger TM, Rosa GJ, Kaeppler SM, Gianola D, de Leon N. Defining window-boundaries for genomic analyses using smoothing spline techniques. Genetics Selection Evolution. 2015;47:30. doi: 10.1186/s12711-015-0105-9. [DOI] [PMC free article] [PubMed] [Google Scholar]
- Benjamini Y, Hochberg Y. Controlling the false discovery rate: a practical and powerful approach to multiple testing. Journal of the Royal Statistical Society B: Statistical Methodology. 1995;57:289–300. [Google Scholar]
- Berg JJ, Coop G. A population genetic signal of polygenic adaptation. PLoS Genetics. 2014;10:e1004412. doi: 10.1371/journal.pgen.1004412. [DOI] [PMC free article] [PubMed] [Google Scholar]
- Bergelson J, Roux F. Towards identifying genes underlying ecologically relevant traits in Arabidopsis thaliana. Nature Reviews Genetics. 2010;11:867–879. doi: 10.1038/nrg2896. [DOI] [PubMed] [Google Scholar]
- Berlin K, Koren S, Chin CS, Drake JP, Landolin JM, Phillippy AM. Assembling large genomes with single-molecule sequencing and locality-sensitive hashing. Nature Biotechnology. 2015;33:623–630. doi: 10.1038/nbt.3238. [DOI] [PubMed] [Google Scholar]
- Bigham A, Bauchet M, Pinto D, Mao X, Akey JM, Mei R, Scherer SW, et al. Identifying signatures of natural selection in Tibetan and Andean populations using dense genome scan data. PLoS Genetics. 2010;6:e1001116. doi: 10.1371/journal.pgen.1001116. [DOI] [PMC free article] [PubMed] [Google Scholar]
- Blanquart F, Kaltz O, Nuismer SL, Gandon S. A practical guide to measuring local adaptation. Ecology Letters. 2013;16:1195–1205. doi: 10.1111/ele.12150. [DOI] [PubMed] [Google Scholar]
- Bonhomme M, Chevalet C, Servin B, Boitard S, Abdallah J, Blott S, SanCristobal M. Detecting selection in population trees: the Lewontin and Krakauer test extended. Genetics. 2010;186:241–262. doi: 10.1534/genetics.110.117275. [DOI] [PMC free article] [PubMed] [Google Scholar]
- Bono JM, Olesnicky EC, Matzkin LM. Connecting genotypes, phenotypes, and fitness: harnessing the power of CRISPR/Cas9 genome editing. Molecular Ecology. 2015;24:3810–3822. doi: 10.1111/mec.13252. [DOI] [PubMed] [Google Scholar]
- Bradbury PJ, Zhang Z, Kroon DE, Casstevens TM, Ramdoss Y, Buckler ES. TASSEL: software for association mapping of complex traits in diverse samples. Bioinformatics. 2007;23:2633–2635. doi: 10.1093/bioinformatics/btm308. [DOI] [PubMed] [Google Scholar]
- Bradnam KR, Fass JN, Alexandrov A, Baranay P, Bechner M, Birol I, Boisvert S, et al. Assemblathon 2: evaluating de novo methods of genome assembly in three vertebrate species. GigaScience. 2013;2:1–31. doi: 10.1186/2047-217X-2-10. [DOI] [PMC free article] [PubMed] [Google Scholar]
- Bragg JG, Supple MA, Andrew RL, Borevitz JO. Genomic variation across landscapes: insights and applications. New Phytologist. 2015;207:953–967. doi: 10.1111/nph.13410. [DOI] [PubMed] [Google Scholar]
- Brandvain Y, Kenney AM, Flagel L, Coop G, Sweigart AL. Speciation and introgression between Mimulus nasutus and Mimulus guttatus. PLoS ONE. 2014;10:e1004410. doi: 10.1371/journal.pgen.1004410. [DOI] [PMC free article] [PubMed] [Google Scholar]
- Brown BE. Coral bleaching: causes and consequences. Coral Reefs. 1997;16:S129–S138. [Google Scholar]
- Cantarel BL, Weaver D, McNeill N, Zhang J, Mackey A, Reese J. BAYSIC: a Bayesian method for combining sets of genome variants with improved specificity and sensitivity. BMC Bioinformatics. 2014;15:104. doi: 10.1186/1471-2105-15-104. [DOI] [PMC free article] [PubMed] [Google Scholar]
- Carlson CS, Thomas DJ, Eberle MA, Swanson JE, Livingston RJ, Rieder MJ, Nickerson DA. Genomic regions exhibiting positive selection identified from dense genotype data. Genome Research. 2005;15:1553–1565. doi: 10.1101/gr.4326505. [DOI] [PMC free article] [PubMed] [Google Scholar]
- Casacuberta E, González J. The impact of transposable elements in environmental adaptation. Molecular Ecology. 2013;22:1503–1517. doi: 10.1111/mec.12170. [DOI] [PubMed] [Google Scholar]
- Charlesworth B, Charlesworth D. Some evolutionary consequences of deleterious mutations. Genetica. 1998;102:3–19. [PubMed] [Google Scholar]
- Charlesworth B, Morgan MT, Charlesworth D. The effect of deleterious mutations on neutral molecular variation. Genetics. 1993;134:1289–1303. doi: 10.1093/genetics/134.4.1289. [DOI] [PMC free article] [PubMed] [Google Scholar]
- Cheng C, White BJ, Kamdem C, Mockaitis K, Costantini C, Hahn MW, Besansky NJ. Ecological genomics of Anopheles gambiae along a latitudinal cline: a population-resequencing approach. Genetics. 2012;190:1417–1432. doi: 10.1534/genetics.111.137794. [DOI] [PMC free article] [PubMed] [Google Scholar]
- Clausen J. Stages in the evolution of plant species. Cornell University Press; New York: 1951. [Google Scholar]
- Clausen J, Keck DD, Hiesey WM. Effect of varied environments on western North American plants. Carnegie Institution; Washington, DC: 1940. [Google Scholar]
- Coop G, Witonsky D, Rienzo A Di, Pritchard JK. Using environmental correlations to identify loci underlying local adaptation. Genetics. 2010;185:1411–1423. doi: 10.1534/genetics.110.114819. [DOI] [PMC free article] [PubMed] [Google Scholar]
- Coyne J, Orr HA. Speciation. Sinauer; Sunderland, MA: 2004. [Google Scholar]
- Cruickshank TE, Hahn MW. Reanalysis suggests that genomic islands of speciation are due to reduced diversity, not reduced gene flow. Molecular Ecology. 2014;23:3133–3157. doi: 10.1111/mec.12796. [DOI] [PubMed] [Google Scholar]
- Currat M, Excoffier L, Maddison W, Otto SP, Ray N, Whitlock MC, Yeaman S. Comment on “Ongoing adaptive evolution of ASPM, a brain size determinant in Homo sapiens” and “Microcephalin, a gene regulating brain size, continues to evolve adaptively in humans”. Science. 2006;313:172. doi: 10.1126/science.1122822. [DOI] [PubMed] [Google Scholar]
- DeFries R, Rosenzweig C. Toward a whole-landscape approach for sustainable land use in the tropics. Proceedings of the National Academy of Sciences of the USA. 2010;107:19627–19632. doi: 10.1073/pnas.1011163107. [DOI] [PMC free article] [PubMed] [Google Scholar]
- De Mita S, Thuillet AC, Gay L, Ahmadi N, Manel S, Ronfort J, Vigouroux Y. Detecting selection along environmental gradients: analysis of eight methods and their effectiveness for out-breeding and selfing populations. Molecular Ecology. 2013;22:1383–1399. doi: 10.1111/mec.12182. [DOI] [PubMed] [Google Scholar]
- de Villemereuil P, Frichot E, Bazin E, François O, Gaggiotti OE. Genome scan methods against more complex models: when and how much should we trust them? Molecular Ecology. 2014;23:2006–2019. doi: 10.1111/mec.12705. [DOI] [PubMed] [Google Scholar]
- Duforet-Frebourg N, Bazin E, Blum MG. Genome scans for detecting footprints of local adaptation using a Bayesian factor model. Molecular Biology and Evolution. 2014;31:2483–2495. doi: 10.1093/molbev/msu182. [DOI] [PMC free article] [PubMed] [Google Scholar]
- Earl D, Bradnam K, John JS, Darling A, Lin D, Fass J, Ken HO, et al. Assemblathon 1: a competitive assessment of de novo short read assembly methods. Genome Research. 2011;21:2224–2241. doi: 10.1101/gr.126599.111. [DOI] [PMC free article] [PubMed] [Google Scholar]
- Eckert AJ, Heerwaarden J van, Wegrzyn JL, Nelson CD, Ross-Ibarra J, González-Martínez SC, Neale DB. Patterns of population structure and environmental associations to aridity across the range of loblolly pine (Pinus taeda L., Pinaceae) Genetics. 2010;185:969–982. doi: 10.1534/genetics.110.115543. [DOI] [PMC free article] [PubMed] [Google Scholar]
- Elhaik E. Empirical distributions of FST from large-scale human polymorphism data. PLoS ONE. 2012;7:e49837. doi: 10.1371/journal.pone.0049837. [DOI] [PMC free article] [PubMed] [Google Scholar]
- Ellegren H. Genome sequencing and population genomics in non-model organisms. Trends in Ecology and Evolution. 2014;29:51–63. doi: 10.1016/j.tree.2013.09.008. [DOI] [PubMed] [Google Scholar]
- Elmer KR, Meyer A. Adaptation in the age of ecological genomics: insights from parallelism and convergence. Trends in Ecology and Evolution. 2011;26:298–306. doi: 10.1016/j.tree.2011.02.008. [DOI] [PubMed] [Google Scholar]
- Elshire RJ, Glaubitz JC, Sun Q, Poland JA, Kawamoto K, Buckler ES, Mitchell SE. A robust, simple genotyping-by-sequencing (GBS) approach for high diversity species. PloS ONE. 2011;6:e19379. doi: 10.1371/journal.pone.0019379. http://dx.doi.org/10.1371/journal.pone.0019379. [DOI] [PMC free article] [PubMed] [Google Scholar]
- Engelhardt BE, Stephens M. Analysis of population structure: a unifying framework and novel methods based on sparse factor analysis. PLoS Genetics. 2010;6:e1001117. doi: 10.1371/journal.pgen.1001117. [DOI] [PMC free article] [PubMed] [Google Scholar]
- English AC, Richards S, Han Y, Wang M, Vee V, Qu J, Qin X, et al. Mind the gap: upgrading genomes with Pacific Biosciences RS long-read sequencing technology. Plos ONE. 2012;7:e47768. doi: 10.1371/journal.pone.0047768. http://dx.doi.org/10.1371/journal.pone.0047768. [DOI] [PMC free article] [PubMed] [Google Scholar]
- English AC, Salerno WJ, Hampton OA, Gonzaga-Jauregui C, Ambreth S, Ritter DI, Beck CR, et al. Assessing structural variation in a personal genome—towards a human reference diploid genome. BMC Genomics. 2015;16:286. doi: 10.1186/s12864-015-1479-3. [DOI] [PMC free article] [PubMed] [Google Scholar]
- Ewing GB, Jensen JD. The consequences of not accounting for background selection in demographic inference. Molecular Ecology. 2016;25:135–141. doi: 10.1111/mec.13390. [DOI] [PubMed] [Google Scholar]
- Excoffier L, Foll M, Petit RJ. Genetic consequences of range expansions. Annual Review of Ecology, Evolution, and Systematics. 2009a;40:481–501. [Google Scholar]
- Fariello MI, Boitard S, Naya H, SanCristobal M, Servin B. Detecting signatures of selection through haplotype differentiation among hierarchically structured populations. Genetics. 2013;193:929–941. doi: 10.1534/genetics.112.147231. [DOI] [PMC free article] [PubMed] [Google Scholar]
- Fierst JL. Using linkage maps to correct and scaffold de novo genome assemblies: methods, challenges, and computational tools. Frontiers in Genetics. 2015;6:1–8. doi: 10.3389/fgene.2015.00220. [DOI] [PMC free article] [PubMed] [Google Scholar]
- Fitzpatrick MC, Keller SR. Ecological genomics meets community-level modelling of biodiversity: mapping the genomic landscape of current and future environmental adaptation. Ecology Letters. 2014;18:1–16. doi: 10.1111/ele.12376. [DOI] [PubMed] [Google Scholar]
- Foll M, Gaggiotti O. A genome-scan method to identify selected loci appropriate for both dominant and codominant markers: a Bayesian perspective. Genetics. 2008;180:977–993. doi: 10.1534/genetics.108.092221. [DOI] [PMC free article] [PubMed] [Google Scholar]
- Foll M, Gaggiotti OE, Daub JT, Vatsiou A, Excoffier L. Widespread signals of convergent adaptation to high altitude in Asia and America. American Journal of Human Genetics. 2014;95:394–407. doi: 10.1016/j.ajhg.2014.09.002. [DOI] [PMC free article] [PubMed] [Google Scholar]
- Forester BR, Jones MR, Joost S, Landguth EL, Lasky JR. Detecting spatial genetic signatures of local adaptation in heterogeneous landscapes. Molecular Ecology. 2015;25:104–120. doi: 10.1111/mec.13476. [DOI] [PubMed] [Google Scholar]
- Fournier-Level A, Korte A, Cooper MD, Nordborg M, Schmitt J, Wilczek AM. A map of local adaptation in Arabidopsis thaliana. Science. 2011;334:86–89. doi: 10.1126/science.1209271. [DOI] [PubMed] [Google Scholar]
- Fraïsse C, Belkhir K, Welch JJ, Bierne N. Local interspecies introgression is the main cause of extreme levels of intraspecific differentiation in mussels. Molecular Ecology. 2016;25:269–286. doi: 10.1111/mec.13299. [DOI] [PubMed] [Google Scholar]
- François O, Martins H, Caye K, Schoville S. Controlling false discoveries in genome scans for selection. Molecular Ecology. 2016;25:454–469. doi: 10.1111/mec.13513. [DOI] [PubMed] [Google Scholar]
- Frichot E, Schoville SD, Bouchard G, François O. Testing for associations between loci and environmental gradients using latent factor mixed models. Molecular Biology and Evolution. 2013;30:1687–1699. doi: 10.1093/molbev/mst063. [DOI] [PMC free article] [PubMed] [Google Scholar]
- Fullerton SM, Bartoszewicz A, Ybazeta G, Horikawa Y, Bell GI, Kidd KK, Cox NJ, Hudson RR, Di Rienzo A. Geographic and haplotype structure of candidate type 2 diabetes-susceptibility variants at the calpain-10 locus. American Journal of Human Genetics. 2002;70:1096–1106. doi: 10.1086/339930. [DOI] [PMC free article] [PubMed] [Google Scholar]
- Funk WC, McKay JK, Hohenlohe PA, Allendorf FW. Harnessing genomics for delineating conservation units. Trends in Ecology and Evolution. 2012;27:48–496. doi: 10.1016/j.tree.2012.05.012. [DOI] [PMC free article] [PubMed] [Google Scholar]
- Gautier M. Genome-wide scan for adaptive divergence and association with population-specific covariates. Genetics. 2015;1:1555–1579. doi: 10.1534/genetics.115.181453. [DOI] [PMC free article] [PubMed] [Google Scholar]
- Geraldes A, Farzaneh N, Grassa CJ, McKown AD, Guy RD, Mansfield SD, Douglas CJ, Cronk QCB. Landscape genomics of Populus trichocarpa: the role of hybridization, limited gene flow, and natural selection in shaping patterns of population structure. Evolution. 2014;68:3260–3280. doi: 10.1111/evo.12497. [DOI] [PubMed] [Google Scholar]
- Gibson J, Morton NE, Collins A. Extended tracts of homozygosity in outbred human populations. Human Molecular Genetics. 2006;15:789–795. doi: 10.1093/hmg/ddi493. [DOI] [PubMed] [Google Scholar]
- Goldstein DB, Holsinger KE. Maintenance of polygenic variation in spatially structured populations: roles for local mating and genetic redundancy. Evolution. 1992;46:412–429. doi: 10.1111/j.1558-5646.1992.tb02048.x. [DOI] [PubMed] [Google Scholar]
- González J, Petrov DA. The adaptive role of transposable elements in the Drosophila genome. Gene. 2009;448:124–133. doi: 10.1016/j.gene.2009.06.008. [DOI] [PMC free article] [PubMed] [Google Scholar]
- Günther T, Coop G. Robust identification of local adaptation from allele frequencies. Genetics. 2013;195:205–220. doi: 10.1534/genetics.113.152462. [DOI] [PMC free article] [PubMed] [Google Scholar]
- Haasl RJ, Payseur BA. Fifteen years of genomewide scans for selection: trends, lessons and unaddressed genetic sources of complication. Molecular Ecology. 2016;25:5–23. doi: 10.1111/mec.13339. [DOI] [PMC free article] [PubMed] [Google Scholar]
- Hamilton JA, Miller JM. Adaptive introgression as a resource for management and genetic conservation in a changing climate. Conservation Biology. 2016;30:33–41. doi: 10.1111/cobi.12574. [DOI] [PubMed] [Google Scholar]
- Han E, Sinsheimer JS, Novembre J. Characterizing bias in population genetic inferences from low-coverage sequencing data. Molecular Biology and Evolution. 2014;31:723–735. doi: 10.1093/molbev/mst229. [DOI] [PMC free article] [PubMed] [Google Scholar]
- Hansen TF. The evolution of genetic architecture. Annual Review of Ecology, Evolution, and Systematics. 2006;37:123–157. [Google Scholar]
- Hardison RC, Roskin KM, Yang S, Diekhans M, Kent WJ, Weber R, Elnitski L, et al. Co-variation in frequencies of substitution, deletion, transposition and recombination during eutherian evolution. Genome Research. 2003;13:13–26. doi: 10.1101/gr.844103. [DOI] [PMC free article] [PubMed] [Google Scholar]
- Hereford J. A quantitative survey of local adaptation and fitness trade-offs. American Naturalist. 2009;173:579–588. doi: 10.1086/597611. [DOI] [PubMed] [Google Scholar]
- Hofer T, Foll M, Excoffier L. Evolutionary forces shaping genomic islands of population differentiation in humans. BMC Genomics. 2012;13:107. doi: 10.1186/1471-2164-13-107. [DOI] [PMC free article] [PubMed] [Google Scholar]
- Hoffmann AA, Rieseberg LH. Revisiting the impact of inversions in evolution: from population genetic markers to drivers of adaptive shifts and speciation? Annual Review of Ecology, Evolution, and Systematics. 2008;39:21–42. doi: 10.1146/annurev.ecolsys.39.110707.173532. [DOI] [PMC free article] [PubMed] [Google Scholar]
- Hohenlohe PA, Phillips PC, Cresko WA. Using population genomics to detect selection in natural populations: key concepts and methodological considerations. International Journal of Plant Sciences. 2010;171:1059–1071. doi: 10.1086/656306. [DOI] [PMC free article] [PubMed] [Google Scholar]
- Hu X, He F. Background selection and population differentiation. Journal of Theoretical Biology. 2005;235:207–219. doi: 10.1016/j.jtbi.2005.01.004. [DOI] [PubMed] [Google Scholar]
- James JE, Piganeau G, Eyre-Walker A. The rate of adaptive evolution in animal mitochondria. Molecular Ecology. 2016;25:67–78. doi: 10.1111/mec.13475. [DOI] [PMC free article] [PubMed] [Google Scholar]
- Jensen JD. On the unfounded enthusiasm for soft selective sweeps. Nature Communications. 2014;5:5281. doi: 10.1038/ncomms6281. [DOI] [PubMed] [Google Scholar]
- Jones FC, Grabherr MG, Chan YF, Russell P, Mauceli E, Johnson J, Swofford R, et al. The genomic basis of adaptive evolution in threespine sticklebacks. Nature. 2012;484:55–61. doi: 10.1038/nature10944. [DOI] [PMC free article] [PubMed] [Google Scholar]
- Jones MR, Forester BR, Teufel AI, Adams RV, Anstett DN, Goodrich BA, Landguth EL, Joost S, Manel S. Integrating landscape genomics and spatially explicit approaches to detect loci under selection in clinal populations. Evolution. 2013;67:3455–3468. doi: 10.1111/evo.12237. [DOI] [PubMed] [Google Scholar]
- Jones MR, Good JM. Targeted capture in evolutionary and ecological genomics. Molecular Ecology. 2016;25:185–202. doi: 10.1111/mec.13304. [DOI] [PMC free article] [PubMed] [Google Scholar]
- Joost S, Vuilleumier S, Jensen JD, Schoville S, Leempoel K, Stucki S, Lima C Melo de, Rolland J, Manel S. Uncovering the genetic basis of adaptive change: on the intersection of landscape genomics and theoretical population genetics. Molecular Ecology. 2013;22:3659–3665. doi: 10.1111/mec.12352. [DOI] [PubMed] [Google Scholar]
- Kane NC, King MG, Barker MS, Raduski A, Karrenberg S, Yatabe Y, Knapp SJ, Rieseberg LH. Comparative genomic and population genetic analyses indicate highly porous genomes and high levels of gene flow between divergent Helianthus species. Evolution. 2009;63:2061–2075. doi: 10.1111/j.1558-5646.2009.00703.x. [DOI] [PMC free article] [PubMed] [Google Scholar]
- Kang HM, Zaitlen NA, Wade CM, Kirby A, Heckerman D, Daly MJ, Eskin E. Efficient control of population structure in model organism association mapping. Genetics. 2008;178:1709–1723. doi: 10.1534/genetics.107.080101. [DOI] [PMC free article] [PubMed] [Google Scholar]
- Kawecki TJ. Adaptation to marginal habitats. Annual Review of Ecology, Evolution, and Systematics. 2008;39:321–342. [Google Scholar]
- Kawecki TJ, Ebert D. Conceptual issues in local adaptation. Ecology Letters. 2004;7:1225–1241. [Google Scholar]
- Kelly JK, Koseva B, Mojica JP. The genomic signal of partial sweeps in Mimulus guttatus. Genome Biology and Evolution. 2013;5:1457–1469. doi: 10.1093/gbe/evt100. [DOI] [PMC free article] [PubMed] [Google Scholar]
- Kimura M. Preponderance of synonymous changes as evidence for the neutral theory of molecular evolution. Nature. 1977;267:275–276. doi: 10.1038/267275a0. [DOI] [PubMed] [Google Scholar]
- Kingsley EP, Manceau M, Wiley CD, Hoekstra H. Melanism in Peromyscus is caused by independent mutations in Agouti. PLoS ONE. 2009;4:e6435. doi: 10.1371/journal.pone.0006435. [DOI] [PMC free article] [PubMed] [Google Scholar]
- Koren S, Schatz MC, Walenz BP, Martin J, Howard JT, Ganapathy G, Wang Z, et al. Hybrid error correction and de novo assembly of single-molecule sequencing reads. Nature Biotechnology. 2012;30:693–700. doi: 10.1038/nbt.2280. [DOI] [PMC free article] [PubMed] [Google Scholar]
- Korneliussen TS, Albrechtsen A, Nielsen R. ANGSD: analysis of next generation sequencing data. BMC Bioinformatics. 2014;15:356. doi: 10.1186/s12859-014-0356-4. http://dx.doi.org/10.1186/s12859-014-0356-4. [DOI] [PMC free article] [PubMed] [Google Scholar]
- Kozak GM, Brennan RS, Berdan EL, Fuller RC, Whitehead A. Functional and population genomic divergence within and between two species of killifish adapted to different osmotic niches. Evolution. 2014;68:63–80. doi: 10.1111/evo.12265. [DOI] [PubMed] [Google Scholar]
- Kremer A, Le Corre V. Decoupling of differentiation between traits and their underlying genes in response to divergent selection. Heredity. 2012;108:375–385. doi: 10.1038/hdy.2011.81. [DOI] [PMC free article] [PubMed] [Google Scholar]
- Kunte K, Zhang W, Tenger-Trolander A, Palmer DH, Martin A, Reed RD, Mullen SP, Kronforst MR. doublesex is a mimicry supergene. Nature. 2014;507:229–232. doi: 10.1038/nature13112. [DOI] [PubMed] [Google Scholar]
- Laporte M, Pavey SA, Rougeux C, Pierron F, Lauzent M, Budzinski H, Labadie P, et al. RAD sequencing reveals within-generation polygenic selection in response to anthropogenic organic and metal contamination in North Atlantic eels. Molecular Ecology. 2016;25:219–237. doi: 10.1111/mec.13466. [DOI] [PubMed] [Google Scholar]
- Lasky JR, Des Marais DL, McKay J, Richards JH, Juenger TE, Keitt TH. Characterizing genomic variation of Arabidopsis thaliana: the roles of geography and climate. Molecular Ecology. 2012;21:5512–5529. doi: 10.1111/j.1365-294X.2012.05709.x. [DOI] [PubMed] [Google Scholar]
- Lasky JR, Upadhyaya HD, Ramu P, Deshpande S, Hash CT, Bonnette J, Juenger TE, et al. Genome-environment associations in sorghum landraces predict adaptive traits. Science Advances. 2015;1:e1400218. doi: 10.1126/sciadv.1400218. [DOI] [PMC free article] [PubMed] [Google Scholar]
- Latta RG. Differentiation of allelic frequencies at quantitative trait loci affecting locally adaptive traits. American Naturalist. 1998;151:283–292. doi: 10.1086/286119. [DOI] [PubMed] [Google Scholar]
- Le Corre V, Kremer A. Dynamics of genetic variability at neutral markers, QTLs and adaptive traits in a subdivided population under stabilizing and diversifying selection. Genetics. 2003;164:1205–1219. doi: 10.1093/genetics/164.3.1205. [DOI] [PMC free article] [PubMed] [Google Scholar]
- Le Corre V, Kremer A. The genetic differentiation at quantitative trait loci under local adaptation. Molecular Ecology. 2012;21:1548–1566. doi: 10.1111/j.1365-294X.2012.05479.x. [DOI] [PubMed] [Google Scholar]
- Leimu R, Fischer M. A meta-analysis of local adaptation in plants. PLoS ONE. 2008;3:e4010–e4010. doi: 10.1371/journal.pone.0004010. [DOI] [PMC free article] [PubMed] [Google Scholar]
- Lenormand T. Gene flow and the limits to natural selection. Trends in Ecology and Evolution. 2002;17:183–189. [Google Scholar]
- Lewontin RC, Krakauer J. Distribution of gene frequency as a test of theory of selective neutrality of polymorphisms. Genetics. 1973;74:175–195. doi: 10.1093/genetics/74.1.175. [DOI] [PMC free article] [PubMed] [Google Scholar]
- Li H, Durbin R. Fast and accurate short read alignment with Burrows-Wheeler transform. Bioinformatics. 2009;25:1754–1760. doi: 10.1093/bioinformatics/btp324. [DOI] [PMC free article] [PubMed] [Google Scholar]
- Li H, Handsaker B, Wysoker A, Fennell T, Ruan J, Homer N, Marth G, et al. The Sequence Alignment/Map format and SAMtools. Bioinformatics. 2009;25:2078–2079. doi: 10.1093/bioinformatics/btp352. [DOI] [PMC free article] [PubMed] [Google Scholar]
- Li Y, Cheng R, Spokas KA, Palmer AA, Borevitz JO. Genetic variation for life history sensitivity to seasonal warming in Arabidopsis thaliana. Genetics. 2014;196:569–577. doi: 10.1534/genetics.113.157628. [DOI] [PMC free article] [PubMed] [Google Scholar]
- Lin K, Smit S, Bonnema G, Sanchez-Perez G, de Ridder D. Making the difference: integrating structural variation detection tools. Briefings in Bioinformatics. 2015;16:852–864. doi: 10.1093/bib/bbu047. [DOI] [PubMed] [Google Scholar]
- Long Q, Rabanal FA, Meng D, Huber CD, Farlow A, Platzer A, Zhang Q, et al. Massive genomic variation and strong selection in Arabidopsis thaliana lines from Sweden. Nature Genetics. 2013;45:884–890. doi: 10.1038/ng.2678. [DOI] [PMC free article] [PubMed] [Google Scholar]
- Lotterhos KE, Whitlock MC. Evaluation of demographic history and neutral parameterization on the performance of FST outlier tests. Molecular Ecology. 2014;23:2178–2192. doi: 10.1111/mec.12725. [DOI] [PMC free article] [PubMed] [Google Scholar]
- Lotterhos KE, Whitlock MC. The relative power of genome scans to detect local adaptation depends on sampling design and statistical method. Molecular Ecology. 2015;24:1031–1046. doi: 10.1111/mec.13100. [DOI] [PubMed] [Google Scholar]
- Lowry DB, Willis JH. A widespread chromosomal inversion polymorphism contributes to a major life-history transition, local adaptation, and reproductive isolation. PLoS Biology. 2010;8:2227. doi: 10.1371/journal.pbio.1000500. [DOI] [PMC free article] [PubMed] [Google Scholar]
- Magwene PM, Willis JH, Kelly JK. The statistics of bulk segregant analysis using next generation sequencing. PLoS Computational Biology. 2011;7:e1002255. doi: 10.1371/journal.pcbi.1002255. [DOI] [PMC free article] [PubMed] [Google Scholar]
- Manel S, Perrier C, Pratlong M, Abi-Rached L, Paganini J, Pontarotti P, Aurelle D. Genomic resources and their influence on the detection of the signal of positive selection in genome scans. Molecular Ecology. 2016;25:170–184. doi: 10.1111/mec.13468. [DOI] [PubMed] [Google Scholar]
- Mathieson I, Lazaridis I, Rohland N, Mallick S, Patterson N, Roodenberg S, et al. Genome-wide patterns of selection in 230 ancient Eurasians. Nature. 2015;528:499–503. doi: 10.1038/nature16152. [DOI] [PMC free article] [PubMed] [Google Scholar]
- Maynard-Smith J, Haigh J. The hitch-hiking effect of a favourable gene. Genetical Research. 1974;23:23–35. [PubMed] [Google Scholar]
- McCarroll SA, Altshuler DM. Copy-number variation and association studies of human disease. Nature Genetics. 2007;39:S37–S42. doi: 10.1038/ng2080. [DOI] [PubMed] [Google Scholar]
- McKenna A, Hanna M, Banks E, Sivachenko A, Cibulskis K, Kernytsky A, Garimella K, et al. The Genome Analysis Toolkit: a MapReduce framework for analyzing next-generation DNA sequencing data. Genome Research. 2010;20:1297–1303. doi: 10.1101/gr.107524.110. [DOI] [PMC free article] [PubMed] [Google Scholar]
- Messer PW, Petrov DA. Population genomics of rapid adaptation by soft selective sweeps. Trends in Ecology and Evolution. 2013;28:659–669. doi: 10.1016/j.tree.2013.08.003. [DOI] [PMC free article] [PubMed] [Google Scholar]
- Nachman MW, Payseur BA. Recombination rate variation and speciation: theoretical predictions and empirical results from rabbits and mice. Philosophical Transactions of the Royal Society B: Biological Sciences. 2012;367:409–421. doi: 10.1098/rstb.2011.0249. [DOI] [PMC free article] [PubMed] [Google Scholar]
- Narum S, Hess J. Comparison of FST outlier tests for SNP loci under selection. Molecular Ecology Resources. 2011;11:184–194. doi: 10.1111/j.1755-0998.2011.02987.x. [DOI] [PubMed] [Google Scholar]
- Nei M, Li W-H. Mathematical model for studying genetic variation in terms of restriction endonucleases. Proceedings of the National Academy of Sciences of the USA. 1979;76:5269–5273. doi: 10.1073/pnas.76.10.5269. [DOI] [PMC free article] [PubMed] [Google Scholar]
- Nevado B, Pérez-Enciso M. Pipeliner: software to evaluate the performance of bioinformatics pipelines for next-generation resequencing. Molecular Ecology Resources. 2015;15:99–106. doi: 10.1111/1755-0998.12286. [DOI] [PubMed] [Google Scholar]
- Nielsen R, Yang Z. Estimating the distribution of selection coefficients from phylogenetic data with applications to mitochondrial and viral DNA. Molecular Biology and Evolution. 2003;20:1231–1239. doi: 10.1093/molbev/msg147. [DOI] [PubMed] [Google Scholar]
- Nowak MA, Boerlijst MC, Cooke J, Smith JM. Evolution of genetic redundancy. Nature. 1997;388:167–171. doi: 10.1038/40618. [DOI] [PubMed] [Google Scholar]
- Pearce RJ, Pota H, Evehe M, Bâ E, Mombo-Ngoma G, Malisa A, Ord R, et al. Multiple origins and regional dispersal of resistant dhps in African Plasmodium falciparum malaria. PLoS Medicine. 2009;6:407. doi: 10.1371/journal.pmed.1000055. [DOI] [PMC free article] [PubMed] [Google Scholar]
- Pendleton M, Sebra R, Pang A, Ummat A, Franzen O, Rausch T, Stutz A, et al. Assembly and diploid architecture of an individual human genome via single-molecule technologies. Nature Methods. 2015;12:780–786. doi: 10.1038/nmeth.3454. [DOI] [PMC free article] [PubMed] [Google Scholar]
- Pennings PS, Hermisson J. Soft sweeps II—molecular population genetics of adaptation from recurrent mutation or migration. Molecular Biology and Evolution. 2006;23:1076–1084. doi: 10.1093/molbev/msj117. [DOI] [PubMed] [Google Scholar]
- Pérez-Figueroa A, Garcia-Pereira M, Saura M, Rolan-Alvarez E, Caballero A. Comparing three different methods to detect selective loci using dominant markers. Journal of Evolutionary Biology. 2010;23:2267–2276. doi: 10.1111/j.1420-9101.2010.02093.x. [DOI] [PubMed] [Google Scholar]
- Perry GH, Dominy NJ, Claw KG, Lee AS, Fiegler H, Redon R, Werner J, et al. Diet and the evolution of human amylase gene copy number variation. Nature Genetics. 2007;39:1256–1260. doi: 10.1038/ng2123. [DOI] [PMC free article] [PubMed] [Google Scholar]
- Prasad A, Merico D, Thiruvahindrapuram B, Wei J, Lionel AC, Sato D, Rickaby J, et al. A discovery resource of rare copy number variations in individuals with autism spectrum disorder. G3: Genes Genomes Genetics. 2012a;2:1665–1685. doi: 10.1534/g3.112.004689. [DOI] [PMC free article] [PubMed] [Google Scholar]
- Prasad KV, Song BH, Olson-Manning C, Anderson JT, Lee CR, Schranz ME, Windsor AJ, et al. A gain-of-function polymorphism controlling complex traits and fitness in nature. Science. 2012b;337:1081–1084. doi: 10.1126/science.1221636. [DOI] [PMC free article] [PubMed] [Google Scholar]
- Price A, Patterson N, Plenge R, Weinblatt M, Shadick N, Reich D. Principal components analysis corrects for stratification in genome-wide association studies. Nature Genetics. 2006;38:904–909. doi: 10.1038/ng1847. [DOI] [PubMed] [Google Scholar]
- Puritz JB, Hollenbeck CM, Gold JR. dDocent: a RADseq, variant-calling pipeline designed for population genomics of non-model organisms. PeerJ. 2014a;2:e431. doi: 10.7717/peerj.431. [DOI] [PMC free article] [PubMed] [Google Scholar]
- Puritz JB, Matz MV, Toonen RJ, Weber JN, Bolnick DI, Bird CE. Demystifying the RAD fad. Molecular Ecology. 2014b;23:5937–5942. doi: 10.1111/mec.12965. [DOI] [PubMed] [Google Scholar]
- Pyhäjärvi T, Hufford MB, Mezmouk S, Ross-Ibarra J. Complex patterns of local adaptation in teosinte. Genome Biology and Evolution. 2013;5:1594–1609. doi: 10.1093/gbe/evt109. [DOI] [PMC free article] [PubMed] [Google Scholar]
- Ralph PL, Coop GM. Parallel adaptation: one or many waves of advance of an advantageous allele? Genetics. 2010;186:647–668. doi: 10.1534/genetics.110.119594. [DOI] [PMC free article] [PubMed] [Google Scholar]
- Ralph PL, Coop GM. The role of standing variation in geographic convergent adaptation. American Naturalist. 2015;186(suppl):S5–S23. doi: 10.1086/682948. [DOI] [PMC free article] [PubMed] [Google Scholar]
- Rausher MD, Delph LF. Commentary: when does understanding phenotpyic evolution require identification of underlying genes? Evolution. 2015;69:1655–1664. doi: 10.1111/evo.12687. [DOI] [PubMed] [Google Scholar]
- Rellstab C, Gugerli F, Eckert AJ, Hancock AM, Holderegger R. A practical guide to environmental association analysis in landscape genomics. Molecular Ecology. 2015;24:4348–4370. doi: 10.1111/mec.13322. [DOI] [PubMed] [Google Scholar]
- Renzette N, Kowalik TF, Jensen JD. On the relative roles of background selection and genetic hitchhiking in shaping human cytomegalovirus genetic diversity. Molecular Ecology. 2016;25:403–413. doi: 10.1111/mec.13331. [DOI] [PMC free article] [PubMed] [Google Scholar]
- Robinson MR, Wray NR, Visscher PM. Explaining additional genetic variation in complex traits. Trends in Genetics. 2014;30:124–132. doi: 10.1016/j.tig.2014.02.003. [DOI] [PMC free article] [PubMed] [Google Scholar]
- Rockman MV. The QTN program and the alleles that matter for evolution: all that’s gold does not glitter. Evolution. 2012;66:1–17. doi: 10.1111/j.1558-5646.2011.01486.x. [DOI] [PMC free article] [PubMed] [Google Scholar]
- Rundle H, Nosil P. Ecological speciation. Ecology Letters. 2005;8:336–352. [Google Scholar]
- Sabeti PC, Varilly P, Fry B, Lohmueller J, Hostetter E, Cotsapas C, Xie X, et al. Genome-wide detection and characterization of positive selection in human populations. Nature. 2007;449:913–918. doi: 10.1038/nature06250. [DOI] [PMC free article] [PubMed] [Google Scholar]
- Savolainen O, Lascoux M, Merilä J. Ecological genomics of local adaptations. Nature Reviews Genetics. 2013;14:807–820. doi: 10.1038/nrg3522. [DOI] [PubMed] [Google Scholar]
- Schlötterer C, Kofler R, Versace E, Tobler R, Franssen SU. Combining experimental evolution with next-generation sequencing: a powerful tool to study adaptation from standing genetic variation. Heredity. 2014;114:431–440. doi: 10.1038/hdy.2014.86. [DOI] [PMC free article] [PubMed] [Google Scholar]
- Schoville SD, Bonin A, François O, Lobreaux S, Melodelima C, Manel S. Adaptive genetic variation on the landscape: methods and cases. Annual Review of Ecology, Evolution, and Systematics. 2012;43:23–43. [Google Scholar]
- Schweyen H, Rozenberg A, Leese F. Detection and removal of PCR duplicates in population genomic ddRAD studies by addition of a degenerate base region (DBR) in sequencing adapters. Biological Bulletin. 2014;227:146–160. doi: 10.1086/BBLv227n2p146. [DOI] [PubMed] [Google Scholar]
- Sham PC, Purcell SM. Statistical power and significance testing in large-scale genetic studies. Nature Reviews Genetics. 2014;15:335–346. doi: 10.1038/nrg3706. [DOI] [PubMed] [Google Scholar]
- Sharma SK, Bolser D, de Boer J, Sønderkær M, Amoros W, Carboni MF, D’Ambrosio JM, et al. Construction of reference chromosome-scale pseudomolecules for potato: integrating the potato genome with genetic and physical maps. G3: Genes Genomes Genetics. 2013;3:2031–2047. doi: 10.1534/g3.113.007153. [DOI] [PMC free article] [PubMed] [Google Scholar]
- Short Bull RA, Cushman SA, Mace R, Chilton T, Kendall KC, Landguth EL, Schwartz MK, McKelvey K, Allendorf FW, Luikart G. Why replication is important in landscape genetics: American black bear in the Rocky Mountains. Molecular Ecology. 2011;20:1092–1107. doi: 10.1111/j.1365-294X.2010.04944.x. [DOI] [PubMed] [Google Scholar]
- Stapley J, Reger J, Feulner PG, Smadja C, Galindo J, Ekblom R, Bennison C, Ball AD, Beckerman AP, Slate J. Adaptation genomics: the next generation. Trends in Ecology and Evolution. 2010;25:705–712. doi: 10.1016/j.tree.2010.09.002. [DOI] [PubMed] [Google Scholar]
- Steige KA, Reimegård J, Koenig D, Scofield DG, Slotte T. Cisregulatory changes associated with a recent mating system shift and floral adaptation in Capsella. Molecular Biology and Evolution. 2015;32:2501–2514. doi: 10.1093/molbev/msv169. [DOI] [PMC free article] [PubMed] [Google Scholar]
- Stephan W. Signatures of positive selection: from selective sweeps at individual loci to subtle allele frequency changes in poly-genic adaptation. Molecular Ecology. 2016;25:79–88. doi: 10.1111/mec.13288. [DOI] [PubMed] [Google Scholar]
- Stern DL, Orgogozo V. The loci of evolution: how predictable is genetic evolution? Evolution. 2008;62:2155–2177. doi: 10.1111/j.1558-5646.2008.00450.x. [DOI] [PMC free article] [PubMed] [Google Scholar]
- Storey JD, Tibshirani R. SAM thresholding and false discovery rates for detecting differential gene expression in DNA microarrays. In: Parmigiani G, Garett ES, Irizarry RA, Zeger SL, editors. The analysis of gene expression data. Springer; New York: 2003. pp. 272–290. [Google Scholar]
- Tang H, Lyons E, Town CD. Optical mapping in plant comparative genomics. Genome. 2015a;1:8. doi: 10.1186/s13742-015-0044-y. [DOI] [PMC free article] [PubMed] [Google Scholar]
- Tang H, Zhang X, Miao C, Zhang J, Ming R, Schnable JC, Schnable PS, Lyons E, Lu J. ALLMAPS: robust scaffold ordering based on multiple maps. Genome Biology. 2015b;16:3. doi: 10.1186/s13059-014-0573-1. [DOI] [PMC free article] [PubMed] [Google Scholar]
- Tiffin P, Ross-Ibarra J. Advances and limits of using population genetics to understand local adaptation. Trends in Ecology and Evolution. 2014;29:673–680. doi: 10.1016/j.tree.2014.10.004. [DOI] [PubMed] [Google Scholar]
- Travis JM, Münkemüller T, Burton O, Best A, Dytham C, Johst K. Deleterious mutations can surf to high densities on the wave front of an expanding population. Molecular Biology and Evolution. 2007;24:2334–2343. doi: 10.1093/molbev/msm167. [DOI] [PubMed] [Google Scholar]
- Trumbo DR, Spear SF, Baumsteiger J, Storfer A. Rangewide landscape genetics of an endemic Pacific northwestern salamander. Molecular Ecology. 2013;22:1250–1266. doi: 10.1111/mec.12168. [DOI] [PubMed] [Google Scholar]
- Turchin MC, Chiang CW, Palmer CD, Sankararaman S, Reich D, GIANT Consortium. Hirschhorn JN. Evidence of widespread selection on standing variation in Europe at height-associated SNPs. Nature Genetics. 2012;44:1015–1019. doi: 10.1038/ng.2368. [DOI] [PMC free article] [PubMed] [Google Scholar]
- Turner TL, Bourne EC, Von Wettberg EJ, Hu TT, Nuzhdin SV. Population resequencing reveals local adaptation of Arabidopsis lyrata to serpentine soils. Nature Genetics. 2010;42:260–263. doi: 10.1038/ng.515. [DOI] [PubMed] [Google Scholar]
- Twyford AD, Friedman J. Adaptive divergence in the monkey flower Mimulus guttatus is maintained by a chromosomal inversion. Evolution. 2015;69:1476–1486. doi: 10.1111/evo.12663. [DOI] [PMC free article] [PubMed] [Google Scholar]
- VanBuren R, Bryant D, Edger PP, Tang H, Burgess D, Challabathula D, Spittle K, et al. Single-molecule sequencing of the desiccation-tolerant grass Oropetium thomaeum. Nature. 2015;527:508–511. doi: 10.1038/nature15714. [DOI] [PubMed] [Google Scholar]
- Van Tyne D, Park DJ, Schaffner SF, Neafsey DE, Angelino E, Cortese JF, Barnes KG, et al. Identification and functional validation of the novel antimalarial resistance locus PF10_0355 in Plasmodium falciparum. PLoS Genetics. 2011;7:e1001383. doi: 10.1371/journal.pgen.1001383. [DOI] [PMC free article] [PubMed] [Google Scholar]
- Vilas A, Pérez-Figueroa A, Caballero A. A simulation study on the performance of differentiation-based methods to detect selected loci using linked neutral markers. Journal of Evolutionary Biology. 2012;25:1364–1376. doi: 10.1111/j.1420-9101.2012.02526.x. [DOI] [PubMed] [Google Scholar]
- Vinkhuyzen AAE, Wray NR, Yang J, Goddard ME, Visscher PM. Estimation and partition of heritability in human populations using whole-genome analysis methods. Annual Review of Genetics. 2013;47:75–95. doi: 10.1146/annurev-genet-111212-133258. [DOI] [PMC free article] [PubMed] [Google Scholar]
- Vitte C, Fustier M, Alix K, Tenaillon MI. The bright side of transposons in crop evolution. Briefings in Functional Genomics. 2014;13:276–295. doi: 10.1093/bfgp/elu002. [DOI] [PubMed] [Google Scholar]
- Vitti J, Grossman SR, Sabeti PC. Detecting natural selection in genomic data. Annual Review of Genetics. 2013;47:97–120. doi: 10.1146/annurev-genet-111212-133526. [DOI] [PubMed] [Google Scholar]
- Wagner HH, Fortin MJ. Spatial analysis of landscapes: concepts and statistics. Ecology. 2005;86:1975–1987. [Google Scholar]
- Whitlock MC, Lotterhos KE. Reliable detection of loci responsible for local adaptation: inference of a null model through trimming the distribution of FST*. American Naturalist. 2015;186(suppl):S24–S36. doi: 10.1086/682949. [DOI] [PubMed] [Google Scholar]
- Williams GC. Adaptation and natural selection. Princeton University Press; Princeton, NJ: 1966. [Google Scholar]
- Wray GA, Hahn MW, Abouheif E, Balhoff JP, Pizer M, Rockman MV, Romano LA. The evolution of transcriptional regulation in eukaryotes. Molecular Biology and Evolution. 2003;20:1377–1419. doi: 10.1093/molbev/msg140. [DOI] [PubMed] [Google Scholar]
- Wright AE, Harrison PW, Zimmer F, Montgomery SH, Pointer MA, Mank JE. Variation in promiscuity and sexual selection drives avian rate of Faster-Z evolution. Molecular Ecology. 2015;24:1218–1235. doi: 10.1111/mec.13113. [DOI] [PMC free article] [PubMed] [Google Scholar]
- Wright S. Isolation by distance. Genetics. 1943;28:114. doi: 10.1093/genetics/28.2.114. [DOI] [PMC free article] [PubMed] [Google Scholar]
- Yang J, Lee SH, Goddard ME, Visscher PM. GCTA: a tool for genome-wide complex trait analysis. American Journal of Human Genetics. 2011;88:76–82. doi: 10.1016/j.ajhg.2010.11.011. [DOI] [PMC free article] [PubMed] [Google Scholar]
- Yang WY, Novembre J, Eskin E, Halperin E. A model-based approach for analysis of spatial structure in genetic data. Nature Genetics. 2012;44:725–731. doi: 10.1038/ng.2285. [DOI] [PMC free article] [PubMed] [Google Scholar]
- Yant L, Hollister JD, Wright KM, Arnold BJ, Higgins JD, Franklin CH, Bomblies K. Meiotic adaptation to genome duplication in Arabidopsis arenosa. Current Biology. 2013;23:2151–2156. doi: 10.1016/j.cub.2013.08.059. [DOI] [PMC free article] [PubMed] [Google Scholar]
- Yeaman S. Local adaptation by alleles of small effect. American Naturalist. 2015;186(suppl):S74–S89. doi: 10.1086/682405. [DOI] [PubMed] [Google Scholar]
- Yoder JB, Stanton-Geddes J, Zhou P, Briskine R, Young N, Tiffin P. Genomic signature of adaptation to climate in Medicago truncatula. Genetics. 2014;196:1263–1275. doi: 10.1534/genetics.113.159319. [DOI] [PMC free article] [PubMed] [Google Scholar]
- Zhu Y, Bergland AO, González J, Petrov DA. Empirical validation of pooled whole genome population re-sequencing in Drosophila melanogaster. PLoS ONE. 2012;7:e41901. doi: 10.1371/journal.pone.0041901. [DOI] [PMC free article] [PubMed] [Google Scholar]
References Cited Only in the Online Appendixes
- Antao T, Lopes A, Lopes RJ, Beja-Pereira A, Luikart G. LOSITAN: a workbench to detect molecular adaptation based on a FST-outlier method. BMC Bioinformatics. 2008;9:323. doi: 10.1186/1471-2105-9-323. [DOI] [PMC free article] [PubMed] [Google Scholar]
- Baird NA, Etter PD, Atwood TS, Currey MC, Shiver AL, Lewis ZA, Selker EU, et al. Rapid SNP discovery and genetic mapping using sequenced RAD markers. PLoS ONE. 2008;3:e3376. doi: 10.1371/journal.pone.0003376. [DOI] [PMC free article] [PubMed] [Google Scholar]
- Berg PR, Jentoft S, Star B, Ring KH, Knutsen K, Lien S, Jakobsen KS, André C. Adaptation to low salinity promotes genomic divergence in Atlantic cod (Gadus morhua L.) Genome Biology and Evolution. 2015;20:1644–1663. doi: 10.1093/gbe/evv093. [DOI] [PMC free article] [PubMed] [Google Scholar]
- Borcard D, Legendre P. All-scale spatial analysis of ecological data by means of principal coordinates of neighbour matrices. Ecological Modelling. 2002;153:51–68. [Google Scholar]
- Caye K, Deist TM, Martins H, Michel O, François O. TESS3: fast inference of spatial population structure and genome scans for selection. Molecular Ecology Resources. 2016;16:540–548. doi: 10.1111/1755-0998.12471. [DOI] [PubMed] [Google Scholar]
- De Kort H, Mergeay J, Vander Mijnsbrugge K, Decocq G, Maccherini S, Kehlet Bruun HH, Honnay O, Vandepitte K. An evaluation of seed zone delineation using phenotypic and population genomic data on black alder Alnus glutinosa. Journal of Applied Ecology. 2014;51:1218–1227. [Google Scholar]
- Dell’Acqua M, Zuccolo A, Tuna M, Gianfranceschi L, Pè ME. Targeting environmental adaptation in the monocot model Brachypodium distachyon: a multi-faceted approach. BMC Genomics. 2014;15:801. doi: 10.1186/1471-2164-15-801. [DOI] [PMC free article] [PubMed] [Google Scholar]
- de Villemereuil P, Gaggiotti OE. A new FST -based method to uncover local adaptation using environmental variables. Methods in Ecology and Evolution. 2015;6:1248–1258. [Google Scholar]
- De Wit P, Pespeni MH, Ladner JT, Barshis DJ, Seneca F, Jaris H, Therkildsen NO, Morikawa M, Palumbi SR. The simple fool’s guide to population genomics via RNA-seq: an introduction to high-throughput sequencing data analysis. Molecular Ecology Resources. 2012;12:1058–1067. doi: 10.1111/1755-0998.12003. [DOI] [PubMed] [Google Scholar]
- Dray S, Legendre P, Peres-Neto PR. Spatial modelling: a comprehensive framework for principal coordinate analysis of neighbour matrices (PCNM) Ecological Modelling. 2006;196:483–493. [Google Scholar]
- Eckert AJ, Maloney PE, Vogler DR, Jensen CE, Mix AD, Neale DB. Local adaptation at fine spatial scales: an example from sugar pine (Pinus lambertiana, Pinaceae) Tree Genetics and Genomes. 2015;11:1–17. [Google Scholar]
- Ellis N, Smith SJ, Pitcher CR. Gradient forests: calculating importance gradients on physical predictors. Ecology. 2012;93:156–168. doi: 10.1890/11-0252.1. [DOI] [PubMed] [Google Scholar]
- Excoffier L, Hofer T, Foll M. Detecting loci under selection in a hierarchically structured population. Heredity. 2009b;103:285–298. doi: 10.1038/hdy.2009.74. [DOI] [PubMed] [Google Scholar]
- Ferrier S, Guisan A. Spatial modelling of biodiversity at the community level. Journal of Applied Ecology. 2006;43:393–404. [Google Scholar]
- Fraser BA, Künstner A, Reznick DN, Dreyer C, Weigel D. Population genomics of natural and experimental populations of guppies (Poecilia reticulata) Molecular Ecology. 2015;24:389–408. doi: 10.1111/mec.13022. [DOI] [PubMed] [Google Scholar]
- Frichot E, François O. LEA: an R package for landscape and ecological association studies. Methods in Ecology and Evolution. 2015;6:925–929. [Google Scholar]
- Gray M, Amand PSt, Bello N, Galliart M, Knapp M, Garrett K, Morgan T, et al. Ecotypes of an ecologically dominant prairie grass (Andropogon gerardii) exhibit genetic divergence across the U.S. Midwest grasslands’ environmental gradient. Molecular Ecology. 2014;23:6011–6028. doi: 10.1111/mec.12993. [DOI] [PubMed] [Google Scholar]
- Guillot G, Vitalis R, le Rouzic A, Gautier M. Detecting correlation between allele frequencies and environmental variables as a signature of selection: a fast computational approach for genome-wide studies. Spatial Statistics. 2014;8:145–155. [Google Scholar]
- Hamilton JA, De La Torre AR, Aitken SN. Fine-scale environmental variation contributes to introgression in a three-species spruce hybrid complex. Tree Genetics and Genomes. 2015;11:1–4. [Google Scholar]
- Joost S, Bonin A, Bruford MW, Després L, Conord C, Erhardt G, Taberlet P. A spatial analysis method (SAM) to detect candidate loci for selection: towards a landscape genomics approach to adaptation. Molecular Ecology. 2007;16:3955–3969. doi: 10.1111/j.1365-294X.2007.03442.x. [DOI] [PubMed] [Google Scholar]
- Joost S, Kalbermatten M, Bonin A. Spatial analysis method (SAM): a software tool combining molecular and environmental data to identify candidate loci for selection. Molecular Ecology Resources. 2008;8:957–960. doi: 10.1111/j.1755-0998.2008.02162.x. [DOI] [PubMed] [Google Scholar]
- Kang HM, Sul JH, Service SK, Zaitlen NA, Kong SY, Freimer NB, Sabatti C, Eskin E. Variance component model to account for sample structure in genome-wide association studies. Nature Genetics. 2010;42:348–354. doi: 10.1038/ng.548. [DOI] [PMC free article] [PubMed] [Google Scholar]
- Peterson BK, Weber JN, Kay EH, Fisher HS, Hoekstra HE. Double digest RADseq: an inexpensive method for de novo SNP discovery and genotyping in model and non-model species. PLoS ONE. 2012;7:e37135. doi: 10.1371/journal.pone.0037135. [DOI] [PMC free article] [PubMed] [Google Scholar]
- Poncet BN, Herrmann D, Gugerli F, Taberlet P, Holderegger R, Gielly L, Rioux D, Thuiller W, Aubert S, Manel S. Tracking genes of ecological relevance using a genome scan in two independent regional population samples of Arabis alpina. Molecular Ecology. 2010;19:2896–2907. doi: 10.1111/j.1365-294X.2010.04696.x. [DOI] [PubMed] [Google Scholar]
- Raj SM, Pagani L, Gallego Romero I, Kivisild T, Amos W. A general linear model-based approach for inferring selection to climate. BMC Genetics. 2013;14:87. doi: 10.1186/1471-2156-14-87. [DOI] [PMC free article] [PubMed] [Google Scholar]
- Rakitsch B, Lippert C, Stegle O, Borgwardt K. A Lasso multi-marker mixed model for association mapping with population structure correction. Bioinformatics. 2013;29:206–214. doi: 10.1093/bioinformatics/bts669. [DOI] [PubMed] [Google Scholar]
- Stucki S, Orozco-terWengel P, Bruford MW, Colli L, Masembe C, Negrini R, Taberlet P, Joost S, the NEXTGEN Consortium High performance computation of landscape genomic models integrating local indices of spatial association. arXiv: 1405.7658. 2014 doi: 10.1111/1755-0998.12629. [DOI] [PubMed] [Google Scholar]
- Vitalis R, Gautier M, Dawson KJ, Beaumont MA. Detecting and measuring selection from gene frequency data. Genetics. 2014;196:799–817. doi: 10.1534/genetics.113.152991. [DOI] [PMC free article] [PubMed] [Google Scholar]
- Wang DG, Fan J-B, Siao C-J, Berno A, Young P, Sapolsky R, Ghandour G, et al. Large-scale identification, mapping, and genotyping of single-nucleotide polymorphisms in the human genome. Science. 1998;280:1077–1082. doi: 10.1126/science.280.5366.1077. [DOI] [PubMed] [Google Scholar]
- Wu TT, Chen YF, Hastie T, Sobel E, Lange K. Genome-wide association analysis by Lasso penalized logistic regression. Bioinformatics. 2009;25:714–721. doi: 10.1093/bioinformatics/btp041. [DOI] [PMC free article] [PubMed] [Google Scholar]
- Zhou Y, Zhang L, Liu J, Wu G, Savolainen O. Climatic adaptation and ecological divergence between two closely related pine species in Southeast China. Molecular Ecology. 2014;23:3504–3522. doi: 10.1111/mec.12830. [DOI] [PubMed] [Google Scholar]
- Zueva KJ, Lumme J, Veselov AE, Kent MP, Lien S, Primmer CR. Footprints of directional selection in wild Atlantic salmon populations: evidence for parasite-driven evolution? PLoS ONE. 2014;9:e91672. doi: 10.1371/journal.pone.0091672. [DOI] [PMC free article] [PubMed] [Google Scholar]
Associated Data
This section collects any data citations, data availability statements, or supplementary materials included in this article.