

Abstract
Hypercholesterolaemia is a major risk factor for cardiovascular disease and it has been found that some probiotic bacteria possess cholesterol-lowering capabilities. In this study, the ability of the Lab4 probiotic consortium to hydrolyse bile salts, assimilate cholesterol and regulate cholesterol transport by polarised Caco-2 enterocytes was demonstrated. Furthermore, in wild-type C57BL/6J mice fed a high fat diet, 2-weeks supplementation with Lab4 probiotic consortium plus Lactobacillus plantarum CUL66 resulted in significant reductions in plasma total cholesterol levels and suppression of diet-induced weight gain. No changes in plasma levels of very low-density lipoprotein/low-density lipoprotein, high-density lipoprotein, triglycerides, cytokines or bile acids were observed. Increased amounts of total and unconjugated bile acids in the faeces of the probiotic-fed mice, together with modulation of hepatic small heterodimer partner and cholesterol-7α-hydroxylase mRNA expression, implicates bile salt hydrolase activity as a potential mechanism of action. In summary, this study demonstrates the cholesterol-lowering efficacy of short-term feeding of the Lab4 probiotic consortium plus L. plantarum CUL66 in wild-type mice and supports further assessment in human trials.
Introduction
Cardiovascular disease (CVD) is the cause of death in one in three people in the United Kingdom1 and is the leading cause of global mortality2. Hypercholesterolaemia is a major risk factor for the disease and statins are widely used to normalise elevated circulating cholesterol levels and can reduce CVD-related events by approximately 25%3–7 and are often associated with adverse side effects8. Primary and secondary care of CVD imparts a heavy economic burden on society1. Management of modifiable lifestyle risk factors, such as diet, body weight and physical activity, represent preventative measures and are advocated by healthcare providers7, 9. However, the high mortality rates associated with CVD suggest these measures are not sufficiently effective and further options are required10–12.
Probiotics are defined as “live microorganisms that, when administered in adequate amounts, confer a health benefit on the host”13, 14 and there is growing evidence that some probiotic organisms possess a cholesterol lowering capability and could be considered as a potential supplemental tool in combatting CVD and associated conditions15. The cholesterol-lowering efficacy of a diversity of microbial species and strains has been observed16–21. There are multiple mechanisms by which these effects are thought to occur including the assimilation of cholesterol22 and/or the deconjugation of bile salts by bile salt hydrolase (BSH) positive probiotic bacteria that put increased demand on de novo bile synthesis (from circulating cholesterol) to replace that which is lost in faeces23, 24. Probiotic bacteria have also been shown to modulate key intestinal cholesterol transport pathways by regulating gene expression patterns of Niemann-Pick C1-like 1 (NPC1L1), ATP-binding cassette sub-family G member (ABCG)-5, ABCG-8 or ATP-binding cassette transporter-1 (ABCA-1) in intestinal epithelial cells25–29.
L. plantarum CUL66 (NCIMB 30280) has been found to have a cholesterol-lowering capability29 and the effects of the Lab4 consortium of probiotics (Lab4, composed of Lactobacillus acidophilus CUL21 (NCIMB 30156) and CUL60 (NCIMB 30157), Bifidobacterium bifidum CUL20 (NCIMB 30153) and Bifidobacterium animalis subsp. lactis CUL34 (NCIMB 30172) during other conditions are documented30–33. In the present study, assessment of the cholesterol lowering capabilities of Lab4 was made in vitro prior to its inclusion, in combination with L. plantarum CUL66, in a short-term feeding study with C57BL/6J mice on a high fat diet.
Results
Evidence for cholesterol lowering ability by Lab4 in vitro
BSH activity in Lab4 was indicated by the formation of a white precipitate and agar-clouding in the presence of 0.5% TDCA (Fig. 1a; right-sided panels) that was absent on control agar (Fig. 1a; left-sided panels). Growing cultures of Lab4 removed 26.54% (p = 0.076) of cholesterol from MRS broth (Fig. 1b) equating to 4.84 ± 5.27 mg of cholesterol per gram of dry weight bacteria.
Figure 1.
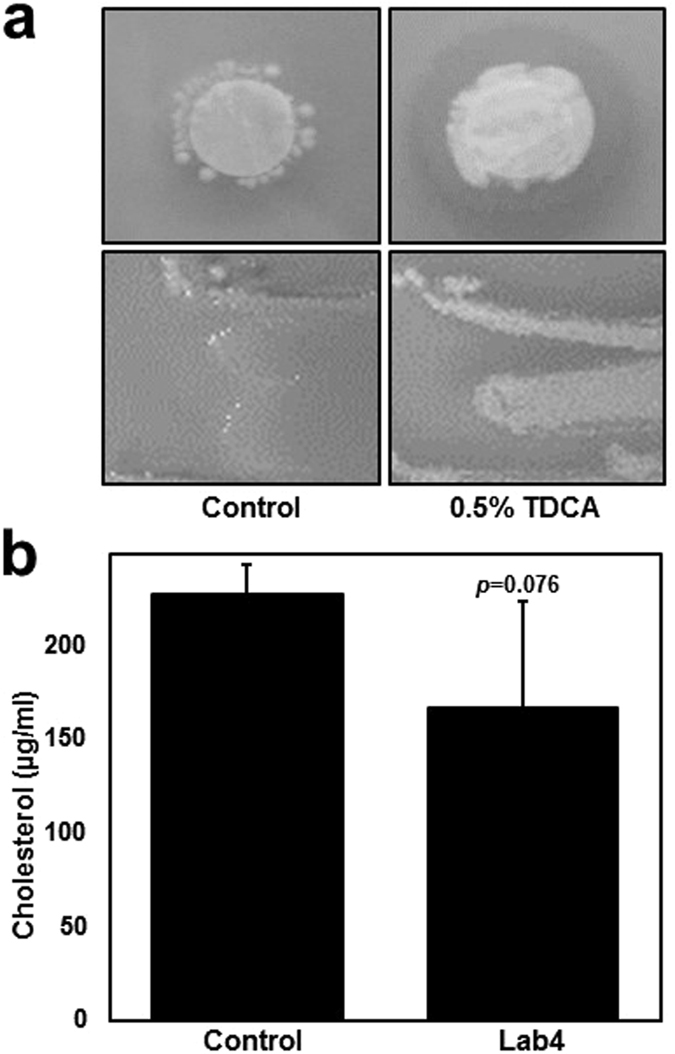
BSH activity and cholesterol assimilation by Lab4. (a) De Man, Rogosa and Sharpe (MRS) agar plates (control, top and bottom left-sided panels) or MRS agar plates containing 0.05% taurodeoxycholic acid (TDCA, top and bottom right-sided panels) that were inoculated with Lab4 on filter discs (top panels) or as bacterial streaks (bottom panels, n = 1) for 48 hours under anaerobic conditions. (b) Cholesterol concentration in MRS broth containing 0.3% (w/v) ox-bile and 200 µg/ml cholesterol (control) or in MRS broth containing 0.3% (w/v) ox-bile and 200 µg/ml cholesterol that were inoculated with Lab4 for 18 hours under anaerobic conditions. The data are presented as a representative image from 3 identical experiments (unless stated, Fig. 1a) or the mean ± SD from three independent experiments (Fig. 1b). Statistical analysis was performed using Student’s t-test and values of p are stated where appropriate.
As seen in Fig. 2a, when incubated with 21-day polarised Caco-2 cells and cholesterol (70 µg/ml), live cultures of Lab4 reduced NPC1L1 and ABCA-1 gene expression by 33% (p = 0.00002) and 37% (p = 0.001) respectively and increased 3-hydroxy-3-methylglutaryl-CoA reductase (HMGCR) gene expression by 35% (p = 0.012) when compared to cells treated with cholesterol alone (Control). No significant changes in ABCG-5 or ABCG-8 gene expression were observed. The viability of both Caco-2 cells and Lab4 was maintained throughout the experiment (Supplementary Figure S1).
Figure 2.
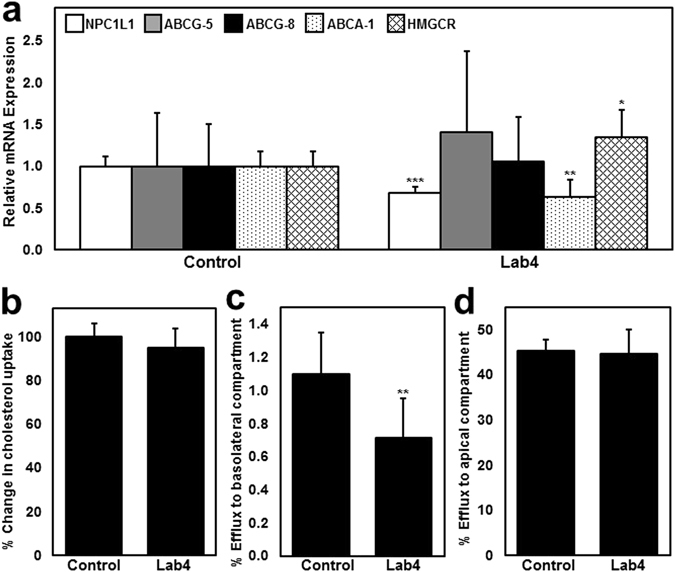
The effect of Lab4 on cholesterol homeostasis in Caco-2 enterocytes. (a) Gene transcript levels of NPC1L1, ABCG-5, ABCG-8, ABCA-1 and HMGCR in Caco-2 cells that were treated with 70 µg/ml cholesterol (Control) or cholesterol (70 µg/ml) and Lab4 (1 × 10⁸ cfu/ml) for 6 hours. Gene transcript levels were calculated using the comparative cycle threshold (Ct) method and normalised to β-actin levels with the control given an arbitrary value of 1.0. (b) Cholesterol uptake by untreated (control) Caco-2 cells or those incubated with Lab4 (1 × 10⁸ cfu/ml) for 5 hours prior to the addition of radiolabelled cholesterol for an additional hour. Intracellular radioactivity (disintegrations per minute) was normalised to total protein content and presented as a percentage of the control that has been arbitrarily assigned as 100%. Efflux of intracellular radiolabelled cholesterol to apolipoprotein-AI (Apo-AI, 10 μg/ml) in the basolateral compartment (c) or TDCA micelles (1 nM) in the apical compartment (d) by untreated (control) Caco-2 cells or those treated with Lab4 (1 × 10⁸ cfu/ml) for 6 hours. The percentage of intracellular cholesterol effluxed from the cells was determined by dividing the radioactivity of the apical media or basolateral media by the combined radioactivity in the apical media, basolateral media and cell fraction. The data are presented as the mean ± SD from at least three independent experiments. Statistical analysis was performed using Student’s t-test where *p < 0.05, **p < 0.01 and ***p < 0.001.
No substantial changes in the uptake of extracellular radiolabelled cholesterol were observed in response to Lab4 (Fig. 2b) despite reduced expression of NPC1L1 (Fig. 2a) and the ability of Lab4 to assimilate cholesterol (Fig. 1b). Reduced gene expression of ABCA-1 (Fig. 2a) was also observed in response to Lab4 suggesting a possible impact on cholesterol transport. As seen in Fig. 2c, the apical application of viable Lab4 cultures to Caco-2 cells housed in a dual compartment trans-well system significantly reduced the basolateral efflux of intracellular radiolabelled cholesterol compared to the control (35%, p = 0.004). The magnitude of this reduction is in line with the 37% reduction in ABCA-1 gene expression (Fig. 2a). No changes in the efflux of intracellular radiolabelled cholesterol into the extracellular apical compartment were observed (Fig. 2d).
Short-term feeding of mice with Lab4 and L. plantarum CUL66 reduces plasma total cholesterol (TC) and diet-induced weight gain but has no effect on plasma very low-density lipoprotein (VLDL)/low-density lipoprotein (LDL), high-density lipoprotein (HDL), triglycerides (TG) or cytokines
As expected, mice in the high fat diet (HFD) group presented elevated plasma levels of TC (2.89 mM vs 3.64 mM, p = 0.001), VLDL/LDL (0.41 mM vs 0.79 mM, p = 0.000003) and HDL (1.73 mM vs 2.04 mM, p = 0.054) compared to baseline (BL) values although TG levels remained unchanged (Table 1). Between group comparison showed that plasma TC was significantly reduced by 14% (3.64 mM vs 3.15 mM, p = 0.029) in the high fat diet plus probiotic (HFD + P) group compared to the HFD group to a level similar to BL levels. Plasma cytokines were not changed in response to the high fat diet (BL vs HFD) or probiotic feeding (HFD vs HFD + P) although significantly elevated levels of keratinocyte chemoattractant/growth-regulated oncogene were observed in the HFD + P group compared to BL levels (63.19 pg/ml vs 89.62 pg/ml, 42%, p = 0.045). Mice in the HFD + P group showed significantly less weight gain after 14 days feeding compared to the HFD group (10.92% vs 15.33% respectively, p = 0.025, Fig. 3). No residual food was found during daily cage checks.
Table 1.
Plasma lipid and cytokine concentrations.
| BL | HFD | HFD + P | |
|---|---|---|---|
| Plasma Lipids (mM) | |||
| Total cholesterol | 2.89 ± 0.09 | 3.64 ± 0.33** | 3.15 ± 0.38# |
| Very low-density lipoprotein/low-density lipoprotein | 0.41 ± 0.10 | 0.79 ± 0.07*** | 0.69 ± 0.09*** |
| High-density lipoprotein | 1.73 ± 0.14 | 2.04 ± 0.23p=0.054 | 1.79 ± 0.26 |
| Triglycerides | 0.76 ± 0.14 | 0.80 ± 0.15 | 0.71 ± 0.12 |
| Plasma Cytokines (pg/ml) | |||
| Interferon-γ | 0.59 ± 0.26 | 0.61 ± 0.39 | 0.97 ± 0.41 |
| Interleukin-10 | 14.23 ± 4.26 | 12.83 ± 2.56 | 15.18 ± 3.83 |
| Interleukin-12p70 | 51.11 ± 54.01 | 30.05 ± 32.06 | 19.80 ± 12.17 |
| Interleukin-1β | 0.84 ± 0.59 | 0.74 ± 0.49 | 0.60 ± 0.24 |
| Interleukin-2 | 3.24 ± 1.46 | 2.84 ± 1.41 | 2.14 ± 0.60 |
| Interleukin-4 | 0.72 ± 0.57 | 0.43 ± 0.37 | 0.37 ± 0.13 |
| Interleukin-5 | 2.95 ± 0.64 | 3.14 ± 1.20 | 3.18 ± 0.34 |
| Interleukin-6 | 6.37 ± 2.13 | 10.22 ± 8.47 | 10.39 ± 3.80 |
| Keratinocyte chemoattractant/growth-regulated oncogene | 63.19 ± 15.62 | 75.36 ± 14.15 | 89.62 ± 21.26* |
| Tumor Necrosis Factor-α | 10.7 1 ± 1.27 | 11.47 ± 2.59 | 15.34 ± 5.16 |
Data represent the means ± standard deviation of 6 mice per group. Values of p were determined using one-way ANOVA with Tukey’s (equal variance) or Dunnett’s T3 (unequal variance) post-hoc analysis where ∗ p < 0.05, ∗∗ p < 0.01, and ∗∗∗ p < 0.001 versus the BL group; # p < 0.05 versus the HFD group. Values of p compared to the BL group are stated where appropriate.
Figure 3.

Effect of probiotics on body weight. Body weights of mice in the HFD and HFD + P groups were recorded throughout the intervention period at the indicated time points and the percentage change in body weight since day 0 was calculated for each mouse. Data is presented as the mean ± SD for 6 mice in each group. Statistical analysis was performed using Student’s t-test where *p < 0.05.
Short-term feeding with Lab4 plus L. plantarum CUL66 has no effect on plasma bile acids, but increases faecal bile acid excretion
Analysis of bile acids did not identify any differences between groups in the levels present in the plasma (Fig. 4a and b). In contrast, mice fed HFD and HFD + P have different faecal bile acid profiles to the BL group (Fig. 4c and d) and the faecal bile acid profile of HFD + P fed mice is more variable than those fed HFD alone (Fig. 4c). Plasma and faecal bile acid profiles (as relative intensities from UPLC-MS) are shown in Supplementary Table S1 and Supplementary Figure S2. Unlike plasma levels that remained unchanged, total and unconjugated bile acid levels were significantly increased in the faeces of both groups during the study compared to BL and significantly higher levels of total (34% increase, p = 0.047) and unconjugated bile acids (33% increase, p = 0.047) were present in the faeces of HFD + P mice compared to the HFD group (Table 2). Increased relative levels of ursodeoxycholic acid (46% increase, p = 0.003), hyodeoxycholic acid (96% increase, p = 0.028), taurochenodeoxycholic acid (180% increase, p = 0.026) and a trend towards an increase in deoxycholic/chenodeoxycholic acid (30%, p = 0.052) were observed in the faeces of HFD + P mice compared to the HFD group (Table 2).
Figure 4.

Principle component analysis (PCA) and heatmap analysis of plasma and faecal bile acid profiles. PCA score plots of bile acid signatures from the (a) plasma or (c) faeces of BL, HFD and HFD + P mice. Heatmaps of the bile acid relative intensity from (b) plasma or (d) faeces of each mouse.
Table 2.
Ratio of plasma and faecal bile acid content in relation to BL group.
| PLASMA | FAECES | |||
|---|---|---|---|---|
| HFD | HFD + P | HFD | HFD + P | |
| Total bile acids | 1.39 ± 0.56 | 1.07 ± 1.20 | 1.72 ± 0.34* | 2.30 ± 0.49***# |
| Conjugated bile acids | 1.56 ± 1.13 | 0.90 ± 0.57 | 2.07 ± 1.21 | 3.62 ± 2.96* |
| Unconjugated bile acids | 1.35 ± 0.48 | 1.11 ± 1.46 | 1.71 ± 0.33* | 2.27 ± 0.46***# |
| Individual bile acids | ||||
| Ursocholanic Acid | ND | ND | 1.16 ± 0.44 | 1.32 ± 0.47 |
| 3-Ketocholanic Acid | ND | ND | 1.12 ± 0.51 | 1.39 ± 0.70 |
| Lithocholic acid | ND | ND | 1.11 ± 0.33 | 1.25 ± 0.46 |
| Allolithocholic Acid | ND | ND | 1.38 ± 0.65 | 1.98 ± 1.08 |
| Isolithocholic Acid | ND | ND | 1.11 ± 0.55 | 1.22 ± 0.55 |
| 3,6/12-Diketocholanic Acid | ND | ND | 0.94 ± 0.80 | 1.58 ± 1.04 |
| 3α-Hydroxy-12 Ketolithocholic Acid | ND | ND | 1.74 ± 0.61 | 2.47 ± 0.87* |
| Deoxycholic Acid/Chenodeoxycholic | ND | ND | 1.29 ± 0.17 | 1.68 ± 0.28*p=0.052 |
| 5β-Cholanic Acid-3β, 12α-diol | ND | ND | 0.94 ± 0.23 | 1.17 ± 0.37 |
| Murocholic Acid | ND | ND | 3.07 ± 1.77** | 4.83 ± 2.54*** |
| Ursodeoxycholic acid | ND | ND | 1.58 ± 0.11* | 2.31 ± 0.36**## |
| Hyodeoxycholic acid | ND | ND | 2.26 ± 0.91** | 4.42 ± 1.91***# |
| 12-Dehydrocholic Acid | 0.59 ± 0.27 | 0.59 ± 0.78 | 2.41 ± 1.09* | 2.58 ± 1.29* |
| ω-Muricholic Acid | 0.93 ± 0.32 | 0.59 ± 0.77 | 1.87 ± 0.39** | 2.22 ± 0.46** |
| α/β-Muricholic acid | 2.41 ± 0.99 | 1.94 ± 2.49 | 2.98 ± 1.19*** | 4.28 ± 1.29*** |
| Hyocholic acid | ND | ND | 1.20 ± 0.38 | 1.67 ± 0.43 |
| Cholic acid | 1.49 ± 0.63 | 1.35 ± 1.82 | 17.00 ± 16.70 | 18.82 ± 15.33*** |
| Taurochenodeoxycholic Acid | 9.18 ± 9.09* | 4.36 ± 3.04 | 2.99 ± 1.32* | 8.40 ± 5.75***# |
| Taurodeoxycholic Acid | 1.08 ± 0.88 | 0.86 ± 0.53 | 6.12 ± 4.21** | 13.75 ± 13.81*** |
| Tauro-ursodeoxycholic Acid | 1.50 ± 0.26 | 1.16 ± 0.66 | 3.88 ± 2.51* | 6.25 ± 4.50** |
| Taurohyodeoxycholic Acid | ND | ND | 2.73 ± 1.50* | 7.25 ± 5.46** |
| Taurocholic Acid | 0.88 ± 0.82 | 0.50 ± 0.43 | 0.60 ± 0.22 | 1.29 ± 1.08 |
| Tauro-ω,α,β Muricholic Acid | 1.99 ± 1.27 | 1.04 ± 0.62 | 2.70 ± 1.76 | 3.64 ± 2.64** |
Data represent the means ± SD of 4 (plasma) or 6 (faeces) mice per group. Values of p were determined using one-way ANOVA with Tukey’s (equal variance) or Dunnett’s T3 (unequal variance) post-hoc analysis where ∗ p < 0.05, ∗∗ p < 0.01, and ∗∗∗ p < 0.001 versus the BL group; # p < 0.05, ## p < 0.01, and ### p < 0.001 versus the HFD group. Values of p compared to the HFD group are stated where appropriate. ND, not detected.
Short-term feeding with Lab4 plus L. plantarum CUL66 modulates the expression of genes associated with hepatic bile metabolism, but has no effect on those associated with cholesterol metabolism/transport in the duodenum, colon or liver
Significantly reduced mRNA levels of small heterodimer partner (SHP, 42%, p = 0.010) and significantly elevated mRNA levels of cholesterol-7α-hydroxylase (CYP7A1, 84%, p = 0.047) were observed in the livers of the HFD + P mice when compared to those fed HFD alone (Table 3). A trend towards an increase in hepatic ABCG-8 mRNA (23%, p = 0.067) was observed in HFD + P when compared to those fed HFD alone (Table 3). No significant differences between groups in the expression of farnesoid X receptor (FXR), NPC1L1, ABCG-5, ABCG-8, ABCA-1 and HMGCR were observed in duodenal, colonic or liver tissues (Table 3). Fibroblast growth factor 15 (FGF15) mRNA could not be detected in the duodenum or colon (Table 3).
Table 3.
Ratio of expression of key genes involved in bile acid and cholesterol metabolism in the HFD+P group in relation to the HFD group.
| DUODENUM | COLON | LIVER | |
|---|---|---|---|
| FXR | 1.26 ± 1.20 | 1.78 ± 1.09 | 1.27 ± 0.25 |
| FGF15 | ND | ND | NT |
| SHP | NT | NT | 0.58 ± 0.18* |
| CYP7A1 | NT | NT | 1.84 ± 0.69* |
| HMGCR | 0.87 ± 0.72 | 2.16 ± 1.56 | 0.95 ± 0.19 |
| NPC1L1 | 0.91 ± 0.56 | 0.89 ± 0.61 | 1.37 ± 0.35 |
| ABCG5 | 1.14 ± 0.31 | 0.92 ± 0.68 | 1.03 ± 0.17 |
| ABCG8 | 1.00 ± 1.20 | 0.78 ± 0.47 | 1.23 ± 0.20p=0.067 |
| ABCA1 | 0.60 ± 0.66 | 0.75 ± 0.55 | 0.96 ± 0.31 |
Data represent the means ± SD of 6 mice per group values of p were determined using Student’s t-test where ∗ p < 0.05. Values of p compared to the HFD group are stated where appropriate. NT, not tested; ND, not detected.
Discussion
In this short-term feeding study, daily probiotic supplementation resulted in lower plasma cholesterol levels and suppression of diet-induced weight gain in mice fed a high fat diet. High circulating levels of TC and obesity are associated with increased risk of CVD and reductions in cholesterol levels and body weight can have a beneficial impact on this disease2. The cholesterol-lowering and anti-obesity effects observed for Lab4 plus L. plantarum CUL66 support the findings of longer term feeding studies in C57BL/6J mice with other probiotics34–40 and further implicate probiotic supplementation as a potential strategy for the prevention of metabolic disease.
The deconjugation of bile acids by bacterial BSH activity is considered a key probiotic cholesterol-lowering mechanism22, 26, 41–44 and can increase faecal bile acid excretion in C57BL/6J mice35, 45 by repressing the enterohepatic FXR-FGF15 axis45 and increasing hepatic bile acid synthesis35, 45. In this study, we propose that reduced plasma cholesterol levels (Table 1) are the consequence of increased bile synthesis de novo by the host in response to probiotic-mediated bile acid deconjugation in the intestines. This view is supported by numerous obsevations: firstly, the ability of Lab4 (Fig. 1a) and L. plantarum CUL6629 to deconjugate bile acids in vitro. Secondly, increased levels of total and unconjugated bile acids in the faeces of probiotic fed mice (Table 2). Thirdly, a reduction in hepatic gene expression of SHP; a transcriptional repressor of CYP7A1; the rate limiting enzyme in the synthesis of bile salts from cholesterol46. Finally, the concomitant increase in hepatic mRNA CYP7A1 levels (Table 3) that has consistently shown direct correlation with increased hepatic CYP7A1 protein levels in numerous other studies47–49. It should also be noted that these changes were not accompanied with changes in plasma bile acids (Table 2) or intestinal FXR mRNA expression (Table 3) in accordance with observations made elsewhere45, although gene expression levels in the ileum; the key site of FXR-FGF15 activation50, 51, were not assessed in our study due to non-availability of tissue.
Probiotics have also been shown to lower cholesterol levels by regulating cholesterol transport and metabolism25–27, 29 and both Lab4 (Fig. 2a) and L. plantarum CUL6629 have been shown to inhibit the expression of the cholesterol uptake transporter NPC1L1 in human intestinal epithelial cells. For L. plantarum CUL66, decreased expression was associated with decreased extracellular cholesterol uptake together with increased expression of apical cholesterol efflux proteins ABCG-5 and ABCG-829, but was not associated with any changes in cholesterol export into the apical compartment29. Lab4 and L. plantarum CUL66 have been shown to reduce the expression of the cholesterol efflux transporter ABCA-1 which may be linked to the observed reductions of ApoAI-mediated basolateral cholesterol efflux (Fig. 2c)29. Interestingly, transcript levels of the de novo cholesterol synthesis enzyme HMGCR were increased and this change could represent a compensatory mechanism used to maintain cellular cholesterol levels29, 52–54. The changes in gene expression that had been observed in cultured human Caco-2 enterocytes in vitro may represent a species-specific effect as similar changes were not detected in the duodenal or colonic tissue analysed on completion of the murine feeding study (Table 3).
Assimilation of cholesterol is thought to be another mechanism by which probiotic bacteria can influence plasma cholesterol levels55 although the impact of cholesterol assimilation by Lab4 (Fig. 1b) and L. plantarum 29 seen in vitro could not be assessed in vivo due a limited availability of faecal sample. Likewise, it was not possible to assess the impact of other potential probiotic cholesterol-lowering mechanisms such as the conversion of cholesterol to coprostanol, short chain fatty acid production55 and the assimilation of bile acids56, 57. Probiotics have also been shown to reduce blood TG levels37, 38 or impart anti-inflammatory effects34, 40 in HFD fed C57BL/6J mice but these responses were not seen in our study (Table 1) possibly as a result of the short intervention period.
In summary, this preliminary 2 week study in mice on a high fat diet demonstrated the cholesterol-lowering capability of a combination of Lab4 and L. plantarum CUL66 probiotic bacteria. The probiotic group presented lower plasma TC levels and reduced weight gain together with changes in faecal bile acid content which implicates the deconjugation of bile salts as a potential mechanism of action. These findings provide a meaningful basis for the design of follow-up studies to assess cholesterol lowering efficacy of these probiotic bacteria in humans.
Methods
Reagents
All chemicals were purchased from Sigma-Aldrich (Poole, UK) unless otherwise stated.
Studies in vitro
Lab4 was assessed for its ability to deconjugate bile salts, assimilate cholesterol and regulate Caco-2 cell cholesterol transport as previously described29. Overnight cultures of Lab4 grown in MRS broth (Oxoid, Hampshire, UK) were centrifuged (1,000 × g, 10 min), washed with phosphate buffered saline and re-suspended to 1 × 10⁸ cfu/ml in antibiotic free Dulbecco’s Modified Eagle’s medium supplemented with 4.5 g/l glucose, 1% (v/v) non-essential amino acids and 10 mM HEPES.
Studies in vivo
Maintenance of animals and feeding of probiotics
Eighteen 8-week-old male C57BL/6 J mice were obtained from Harlan Laboratories (Oxfordshire, UK) and housed in pathogen-free scantainer ventilated cages (3 mice per cage) in a light- and temperature-controlled facility (lights on 7 a.m. −7 p.m., 22 °C). After one week acclimatisation on standard chow diet, 6 mice were sacrificed for baseline analysis and the remaining 12 mice were randomly assigned into 2 groups; one group on high fat diet containing 21% (w/w) pork lard supplemented with 0.15% (w/w) cholesterol (Special Diets Services, Witham, U.K; product code: 821424) and the other on high fat diet supplemented with 5 × 10⁸ cfu/mouse/day of Lab4 plus L. plantarum CUL66. The mice were fed 10 g/cage/day (44.50 kcal/cage/day) for 14 days and cages were checked daily for surplus food. Body weights were recorded throughout the feeding period and faecal samples collected at the beginning and end of the study and were stored under anaerobic conditions at −80 °C for further analysis. At the end of the feeding period, all mice were terminally exsanguinated under anaesthesia by cardiac puncture and death confirmed by cervical dislocation. All studies and protocols were approved by the Cardiff University institutional ethics review committee and the United Kingdom Home Office and experiments were performed in accordance with the Guide for the Care and Use of Laboratory Animals (NIH Publication No. 85–23, revised 1996).
Blood and tissue sampling
Blood obtained from cardiac puncture was collected into EDTA (10 mM final concentration) and the plasma separated by centrifugation (12,000 × g, 5 mins). Liver and intestinal tissue was snap frozen in liquid nitrogen. All samples were stored at −80 °C.
Plasma lipid and cytokine analysis
TC, HDL and TG concentrations were measured at the Clinical Biochemistry Service, Cardiff University, on an Aeroset automated analyzer (Abbott Diagnostics, Berkshire, UK). Plasma VLDL/LDL concentrations were measured using the VLDL/LDL cholesterol assay kit (ABCAM, Cambridge, UK) in accordance with the manufacturer’s instructions. Plasma cytokine concentrations were measured by the Central Biotechnology Service (Cardiff University, UK) using the VPLEX pro-inflammatory panel 1 mouse kit (Meso Scale Discovery, Maryland, USA).
UPLC-MS profiling of plasma and faecal bile acids
Plasma samples were prepared for analysis using a previously described method58. Faecal pellets were lyophilised for 48 hours using a VirTis Benchtop BTP 8ZL freeze dryer (BPS FUK). The dried pellets were weighed and then homogenised in a mixture of water, acetonitrile and 2-propanol (2:1:1 vol.) using a Biospec bead beater with 1.0 mm Zirconia beads to extract bile acids. After centrifugation (16,000 × g, 20 mins) the supernatant was passed through 0.45 μm microcentrifuge filters (Costar, Corning). Equal parts of the plasma and faecal filtrates were used for the preparation of quality control (QC) samples that are required to monitor the stability of the assay. QC samples were also spiked with mixtures of bile acid standards (55 bile acid standards including 36 non-conjugated, 12 conjugated with taurine, 7 conjugated with glycine (Steraloids, Newport, RI)) to determine the chromatographic retention times of bile acids. The filtrate was transferred in LCMS vials and used for the subsequent analysis. Plasma and faecal bile acid analysis was performed by ACQUITY UPLC (Waters Ltd, Elstree, UK) coupled to a Xevo G2 Q-ToF mass spectrometer equipped with an electrospray ionization source operating in negative ion mode (ESI-), using the method described by Sarafian et al.58. Waters raw data files were converted to NetCDF format and data were extracted via XCMS (v1.50) package with R (v3.1.1) software. MassLynx software 4.1 was used respectively for data acquisition and validation for this high throughput semi-targeted method for relative quantification of bile acids. Relative faecal bile acid intensities were corrected to the faecal pellet dry weight. PCA was carried out on the integrated mass spectrometric data using pareto scaling and logarithmic transformation using SIMCA v14.1.0.2047 (MKS Umetrics, Umeå, Sweden). The heatmaps were generated in R using package NMF using the scale command for the columns to create Z-scores.
Gene expression analysis
Approximately 50 mg of liver or intestinal scrapings were transferred into prefilled Lysis Matrix D micro-centrifuge tubes (MP Biomedicals, UK) containing 500 µl of Ribozol (Amresco LLC, Ohio, USA). The tissue was homogenized for 60 seconds at 6.0 m/s on a Fastprep-24TM homogenizer (MP Biomedicals, UK) and total RNA was isolated in accordance with the manufacturer’s instructions (Ribozol, Amresco LLC, Ohio, USA). Total RNA (1 µg) was reverse transcribed into cDNA using the High Capacity cDNA reverse transcription Kit (Life Technologies, Paisley, UK) in accordance with the manufacturer’s instructions and real-time quantitative polymerase chain reaction (RT-qPCR) was performed on 10 ng cDNA using the iTag Universal SYBR Green SuperMix (Bio-Rad, Hertfordshire, UK) and 50 nM of each gene-specific oligonucleotide primer (See Supplementary Table S2): Initial melting (95 °C for 5 minutes) followed by 40 cycles of melting (94 °C for 15 seconds), annealing (60 °C for 15 seconds) and extension (72 °C for 30 seconds) was performed using a CFX ConnectTM Real-Time Instrument (Bio-Rad). Transcript levels in the HFD + P group were determined using 2−(ΔCt1–ΔCt2), where ΔCt represents the difference between the Ct for each target gene and β-Actin mRNA transcript levels and are expressed as a ratio of expression relative to the HFD group.
Statistical analysis
All data are presented as the mean ± standard deviation (SD) of the assigned number of independent experiments or number of mice. Prior to significance testing, the normality of the data and the equality of group variance were confirmed using the Shapiro-Wilk and Levene’s tests respectively. Where necessary, normality was achieved using logarithmic transformation. For single comparisons, values of p were determined using Student’s t-test. For multiple comparisons, values of p were determined using one-way analysis of variance (ANOVA) with Tukey’s (equal variance) or Dunnett’s T3 (unequal variance) post-hoc analysis. Statistical analysis was performed using SPSS statistical software package version 22 (IBM, New York, USA). Significance was defined when p < 0.05.
Data availability statement
The datasets generated during and/or analysed during the current study are available from the corresponding author on reasonable request.
Electronic supplementary material
Acknowledgements
The authors would like to acknowledge Martyn Allen, Kathryn A. Turner and Hedda L. Köhling of Cultech Limited for their technical assistance during the study.
Author Contributions
T.R.H., D.P.R., D.R.M. and S.F.P. were responsible for the design of the study. Experiments were performed by T.R.H., T.S.D., D.R.M., J.W.E.M., D.L.C. and A.P. Data analysis was performed by D.R.M., T.S.D., J.R.M. and A.P., D.R.M. prepared the manuscript and all authors contributed to the review of the manuscript.
Competing Interests
This study was supported by Cultech Ltd, Port Talbot, UK. DRM, TSD, DLC and SFP are or were employees of Cultech Ltd. JWEM is a PhD student funded by a joint studentship from the School of Biosciences, Cardiff University and Cultech Ltd.
Footnotes
Electronic supplementary material
Supplementary information accompanies this paper at doi:10.1038/s41598-017-02889-5
Publisher's note: Springer Nature remains neutral with regard to jurisdictional claims in published maps and institutional affiliations.
References
- 1.Bhatnagar P, Wickramasinghe K, Williams J, Rayner M, Townsend N. The epidemiology of cardiovascular disease in the UK 2014. Heart. 2015;101:1182–1189. doi: 10.1136/heartjnl-2015-307516. [DOI] [PMC free article] [PubMed] [Google Scholar]
- 2.WHO. World Health Organisation, Fact Sheet 317 (2015).
- 3.McLaren, J. E., Michael, D. R., Ashlin, T. G. & Ramji, D. P. Cytokines, macrophage lipid metabolism and foam cells: Implications for cardiovascular disease therapy. Prog Lipid Res50, 331-347, doi:1016/j.plipres.2011.04.002 (2011). [DOI] [PubMed]
- 4.Taylor F, et al. Statins for the primary prevention of cardiovascular disease. Cochrane Database Syst Rev. 2013;1:CD004816. doi: 10.1002/14651858.CD004816.pub5. [DOI] [PMC free article] [PubMed] [Google Scholar]
- 5.Buckley ML, Ramji DP. The influence of dysfunctional signaling and lipid homeostasis in mediating the inflammatory responses during atherosclerosis. Biochim Biophys Acta. 2015;1852:1498–1510. doi: 10.1016/j.bbadis.2015.04.011. [DOI] [PubMed] [Google Scholar]
- 6.Michael DR, Ashlin TG, Buckley ML, Ramji DP. Macrophages, lipid metabolism and gene expression in atherogenesis: a therapeutic target of the future? Clinical Lipidology. 2012;7:37–48. doi: 10.2217/clp.11.73. [DOI] [Google Scholar]
- 7.Moss JW, Ramji DP. Nutraceutical therapies for atherosclerosis. Nat Rev Cardiol. 2016;13:513–532. doi: 10.1038/nrcardio.2016.103. [DOI] [PMC free article] [PubMed] [Google Scholar]
- 8.Banach M, et al. Statin intolerance - an attempt at a unified definition. Position paper from an International Lipid Expert Panel. Arch Med Sci. 2015;11:1–23. doi: 10.5114/aoms.2015.49807. [DOI] [PMC free article] [PubMed] [Google Scholar]
- 9.Lichtenstein AH, et al. Summary of American Heart Association Diet and Lifestyle Recommendations revision 2006. Arterioscler Thromb Vasc Biol. 2006;26:2186–2191. doi: 10.1161/01.ATV.0000238352.25222.5e. [DOI] [PubMed] [Google Scholar]
- 10.Christie C. Proposed Dietary Guidelines 2015 and Implications for Cardiovascular Disease and Diabetes. J Cardiovasc Nurs. 2015;30:375–378. doi: 10.1097/JCN.0000000000000286. [DOI] [PubMed] [Google Scholar]
- 11.Ramsay LE, Yeo WW, Jackson PR. Dietary reduction of serum cholesterol concentration: time to think again. BMJ. 1991;303:953–957. doi: 10.1136/bmj.303.6808.953. [DOI] [PMC free article] [PubMed] [Google Scholar]
- 12.Berger S, Raman G, Vishwanathan R, Jacques PF, Johnson EJ. Dietary cholesterol and cardiovascular disease: a systematic review and meta-analysis. Am J Clin Nutr. 2015;102:276–294. doi: 10.3945/ajcn.114.100305. [DOI] [PubMed] [Google Scholar]
- 13.Hill C, et al. Expert consensus document. The International Scientific Association for Probiotics and Prebiotics consensus statement on the scope and appropriate use of the term probiotic. Nat Rev Gastroenterol Hepatol. 2014;11:506–514. doi: 10.1038/nrgastro.2014.66. [DOI] [PubMed] [Google Scholar]
- 14.FAO/WHO. Probiotics in food: health and nutritional properties and guidelines for evaluation: report of a Joint FAO/WHO Expert Consultation on Evaluation of Health and Nutritional Properties of Probiotics in Food, including powder milk with live lactic acid bacteria: Cordoba, Argentina, 1–4 October 2001: report of a Joint FAO/WHO Working Group on Drafting Guidelines for the Evaluation of Probiotics in Food (Food and Agriculture Organization of the United Nations, 2006).
- 15.DiRienzo, D. B. Effect of probiotics on biomarkers of cardiovascular disease: implications for heart-healthy diets. Nutr Rev72, 18–29, doi:10.1111/nure.12084 (2014). [DOI] [PubMed]
- 16.Sun, J. & Buys, N. Effects of probiotics consumption on lowering lipids and CVD risk factors: A systematic review and meta-analysis of randomized controlled trials. Ann Med47, 430–440, doi:10.3109/07853890.2015.1071872 (2015). [DOI] [PubMed]
- 17.Guo Z, et al. Influence of consumption of probiotics on the plasma lipid profile: a meta-analysis of randomised controlled trials. Nutr Metab Cardiovasc Dis. 2011;21:844–850. doi: 10.1016/j.numecd.2011.04.008. [DOI] [PubMed] [Google Scholar]
- 18.Fuentes MC, Lajo T, Carrión JM, Cuñé J. Cholesterol-lowering efficacy of Lactobacillus plantarum CECT 7527, 7528 and 7529 in hypercholesterolaemic adults. Br J Nutr. 2013;109:1866–1872. doi: 10.1017/S000711451200373X. [DOI] [PubMed] [Google Scholar]
- 19.Madjd A, et al. Comparison of the effect of daily consumption of probiotic compared with low-fat conventional yogurt on weight loss in healthy obese women following an energy-restricted diet: a randomized controlled trial. Am J Clin Nutr. 2016;103:323–329. doi: 10.3945/ajcn.115.120170. [DOI] [PubMed] [Google Scholar]
- 20.Rajkumar H, et al. Effect of Probiotic Lactobacillus salivarius UBL S22 and Prebiotic Fructo-oligosaccharide on Serum Lipids, Inflammatory Markers, Insulin Sensitivity, and Gut Bacteria in Healthy Young Volunteers: A Randomized Controlled Single-Blind Pilot Study. J Cardiovasc Pharmacol Ther. 2015;20:289–298. doi: 10.1177/1074248414555004. [DOI] [PubMed] [Google Scholar]
- 21.Shimizu M, Hashiguchi M, Shiga T, Tamura HO, Mochizuki M. Meta-Analysis: Effects of Probiotic Supplementation on Lipid Profiles in Normal to Mildly Hypercholesterolemic Individuals. PLoS One. 2015;10:e013979. doi: 10.1371/journal.pone.0139795. [DOI] [PMC free article] [PubMed] [Google Scholar]
- 22.Pereira DI, Gibson GR. Cholesterol assimilation by lactic acid bacteria and bifidobacteria isolated from the human gut. Appl Environ Microbiol. 2002;68:4689–4693. doi: 10.1128/AEM.68.9.4689-4693.2002. [DOI] [PMC free article] [PubMed] [Google Scholar]
- 23.Kumar M, et al. Cholesterol-lowering probiotics as potential biotherapeutics for metabolic diseases. Exp Diabetes Res. 2012;2012:902917. doi: 10.1155/2012/902917. [DOI] [PMC free article] [PubMed] [Google Scholar]
- 24.Begley M, Hill C, Gahan CG. Bile salt hydrolase activity in probiotics. Appl Environ Microbiol. 2006;72:1729–1738. doi: 10.1128/AEM.72.3.1729-1738.2006. [DOI] [PMC free article] [PubMed] [Google Scholar]
- 25.Yoon HS, et al. Reduction in cholesterol absorption in Caco-2 cells through the down-regulation of Niemann-Pick C1-like 1 by the putative probiotic strains Lactobacillus rhamnosus BFE5264 and Lactobacillus plantarum NR74 from fermented foods. Int J Food Sci Nutr. 2013;64:44–52. doi: 10.3109/09637486.2012.706598. [DOI] [PubMed] [Google Scholar]
- 26.Gorenjak M, et al. Improvement of lipid profile by probiotic/protective cultures: study in a non-carcinogenic small intestinal cell model. New Microbiol. 2014;37:51–64. [PubMed] [Google Scholar]
- 27.Huang Y, Zheng Y. The probiotic Lactobacillus acidophilus reduces cholesterol absorption through the down-regulation of Niemann-Pick C1-like 1 in Caco-2 cells. Br J Nutr. 2010;103:473–478. doi: 10.1017/S0007114509991991. [DOI] [PubMed] [Google Scholar]
- 28.Huang Y, et al. Characterization of Lactobacillus plantarum Lp27 isolated from Tibetan kefir grains: a potential probiotic bacterium with cholesterol-lowering effects. J Dairy Sci. 2013;96:2816–2825. doi: 10.3168/jds.2012-6371. [DOI] [PubMed] [Google Scholar]
- 29.Michael, D. R. et al. Lactobacillus plantarum CUL66 can impact cholesterol homeostasis in Caco-2 enterocytes. Benef Microbes 1–10, doi:10.3920/BM2015.0146 (2016). [DOI] [PubMed]
- 30.Williams EA, et al. Clinical trial: a multistrain probiotic preparation significantly reduces symptoms of irritable bowel syndrome in a double-blind placebo-controlled study. Aliment Pharmacol Ther. 2009;29:97–103. doi: 10.1111/j.1365-2036.2008.03848.x. [DOI] [PubMed] [Google Scholar]
- 31.Garaiova I, et al. Probiotics and vitamin C for the prevention of respiratory tract infections in children attending preschool: a randomised controlled pilot study. Eur J Clin Nutr. 2015;69:373–379. doi: 10.1038/ejcn.2014.174. [DOI] [PMC free article] [PubMed] [Google Scholar]
- 32.Allen SJ, et al. Lactobacilli and bifidobacteria in the prevention of antibiotic-associated diarrhoea and Clostridium difficile diarrhoea in older inpatients (PLACIDE): a randomised, double-blind, placebo-controlled, multicentre trial. Lancet. 2013;382:1249–1257. doi: 10.1016/S0140-6736(13)61218-0. [DOI] [PubMed] [Google Scholar]
- 33.Allen SJ, et al. Probiotics in the prevention of eczema: a randomised controlled trial. Arch Dis Child. 2014;99:1014–1019. doi: 10.1136/archdischild-2013-305799. [DOI] [PMC free article] [PubMed] [Google Scholar]
- 34.Cano PG, Santacruz A, Trejo FM, Sanz Y. Bifidobacterium CECT 7765 improves metabolic and immunological alterations associated with obesity in high-fat diet-fed mice. Obesity (Silver Spring) 2013;21:2310–2321. doi: 10.1002/oby.20330. [DOI] [PubMed] [Google Scholar]
- 35.Damodharan K, Lee YS, Palaniyandi SA, Yang SH, Suh JW. Preliminary probiotic and technological characterization of Pediococcus pentosaceus strain KID7 and in vivo assessment of its cholesterol-lowering activity. Front Microbiol. 2015;6:768. doi: 10.3389/fmicb.2015.00768. [DOI] [PMC free article] [PubMed] [Google Scholar]
- 36.Kondo S, et al. Antiobesity effects of Bifidobacterium breve strain B-3 supplementation in a mouse model with high-fat diet-induced obesity. Biosci Biotechnol Biochem. 2010;74:1656–1661. doi: 10.1271/bbb.100267. [DOI] [PubMed] [Google Scholar]
- 37.Song M, et al. Effect of Lactobacillus acidophilus NS1 on plasma cholesterol levels in diet-induced obese mice. J Dairy Sci. 2015;98:1492–1501. doi: 10.3168/jds.2014-8586. [DOI] [PubMed] [Google Scholar]
- 38.Wu CC, et al. Effect of Lactobacillus plantarum Strain K21 on High-Fat Diet-Fed Obese Mice. Evid Based Complement Alternat Med. 2015;2015:391767. doi: 10.1155/2015/391767. [DOI] [PMC free article] [PubMed] [Google Scholar]
- 39.Park DY, et al. Supplementation of Lactobacillus curvatus HY7601 and Lactobacillus plantarum KY1032 in diet-induced obese mice is associated with gut microbial changes and reduction in obesity. PLoS One. 2013;8:e59470. doi: 10.1371/journal.pone.0059470. [DOI] [PMC free article] [PubMed] [Google Scholar]
- 40.Yoo SR, et al. Probiotics L. plantarum and L. curvatus in combination alter hepatic lipid metabolism and suppress diet-induced obesity. Obesity (Silver Spring) 2013;21:2571–2578. doi: 10.1002/oby.20428. [DOI] [PubMed] [Google Scholar]
- 41.Tanaka H, Doesburg K, Iwasaki T, Mierau I. Screening of lactic acid bacteria for bile salt hydrolase activity. J Dairy Sci. 1999;82:2530–2535. doi: 10.3168/jds.S0022-0302(99)75506-2. [DOI] [PubMed] [Google Scholar]
- 42.Tomaro-Duchesneau C, et al. Cholesterol assimilation by Lactobacillus probiotic bacteria: an in vitro investigation. Biomed Res Int. 2014;2014:380316. doi: 10.1155/2014/380316. [DOI] [PMC free article] [PubMed] [Google Scholar]
- 43.Shehata MG, El Sohaimy SA, El-Sahn MA, Youssef MM. Screening of isolated potential probiotic lactic acid bacteria for cholesterol lowering property and bile salt hydrolase activity. Annals of Agricultural Sciences. 2016;61:65–75. doi: 10.1016/j.aoas.2016.03.001. [DOI] [Google Scholar]
- 44.Pavlovic N, Stankov K, Mikov M. Probiotics–interactions with bile acids and impact on cholesterol metabolism. Appl Biochem Biotechnol. 2012;168:1880–1895. doi: 10.1007/s12010-012-9904-4. [DOI] [PubMed] [Google Scholar]
- 45.Degirolamo C, Rainaldi S, Bovenga F, Murzilli S, Moschetta A. Microbiota modification with probiotics induces hepatic bile acid synthesis via downregulation of the Fxr-Fgf15 axis in mice. Cell Rep. 2014;7:12–18. doi: 10.1016/j.celrep.2014.02.032. [DOI] [PubMed] [Google Scholar]
- 46.Goodwin B, et al. A regulatory cascade of the nuclear receptors FXR, SHP-1, and LRH-1 represses bile acid biosynthesis. Mol Cell. 2000;6:517–526. doi: 10.1016/S1097-2765(00)00051-4. [DOI] [PubMed] [Google Scholar]
- 47.Chen Q, Wang E, Ma L, Zhai P. Dietary resveratrol increases the expression of hepatic 7alpha-hydroxylase and ameliorates hypercholesterolemia in high-fat fed C57BL/6J mice. Lipids Health Dis. 2012;11:56. doi: 10.1186/1476-511X-11-56. [DOI] [PMC free article] [PubMed] [Google Scholar]
- 48.Chen ML, et al. Resveratrol Attenuates Trimethylamine-N-Oxide (TMAO)-Induced Atherosclerosis by Regulating TMAO Synthesis and Bile Acid Metabolism via Remodeling of the Gut Microbiota. MBio. 2016;7:e02210–02215. doi: 10.1128/mBio.02210-15. [DOI] [PMC free article] [PubMed] [Google Scholar]
- 49.Jeun J, et al. Hypocholesterolemic effects of Lactobacillus plantarum KCTC3928 by increased bile acid excretion in C57BL/6 mice. Nutrition. 2010;26:321–330. doi: 10.1016/j.nut.2009.04.011. [DOI] [PubMed] [Google Scholar]
- 50.Stroeve JH, et al. Intestinal FXR-mediated FGF15 production contributes to diurnal control of hepatic bile acid synthesis in mice. Lab Invest. 2010;90:1457–1467. doi: 10.1038/labinvest.2010.107. [DOI] [PMC free article] [PubMed] [Google Scholar]
- 51.Inagaki T, et al. Fibroblast growth factor 15 functions as an enterohepatic signal to regulate bile acid homeostasis. Cell Metab. 2005;2:217–225. doi: 10.1016/j.cmet.2005.09.001. [DOI] [PubMed] [Google Scholar]
- 52.Engelking LJ, McFarlane MR, Li CK, Liang G. Blockade of cholesterol absorption by ezetimibe reveals a complex homeostatic network in enterocytes. J Lipid Res. 2012;53:1359–1368. doi: 10.1194/jlr.M027599. [DOI] [PMC free article] [PubMed] [Google Scholar]
- 53.Catry E, et al. Ezetimibe and simvastatin modulate gut microbiota and expression of genes related to cholesterol metabolism. Life Sci. 2015;132:77–84. doi: 10.1016/j.lfs.2015.04.004. [DOI] [PubMed] [Google Scholar]
- 54.Telford DE, et al. The molecular mechanisms underlying the reduction of LDL apoB-100 by ezetimibe plus simvastatin. J Lipid Res. 2007;48:699–708. doi: 10.1194/jlr.M600439-JLR200. [DOI] [PubMed] [Google Scholar]
- 55.Ooi LG, Liong MT. Cholesterol-lowering effects of probiotics and prebiotics: a review of in vivo and in vitro findings. Int J Mol Sci. 2010;11:2499–2522. doi: 10.3390/ijms11062499. [DOI] [PMC free article] [PubMed] [Google Scholar]
- 56.Kurdi P, et al. Cholic acid accumulation and its diminution by short-chain fatty acids in bifidobacteria. Microbiology. 2003;149:2031–2037. doi: 10.1099/mic.0.26376-0. [DOI] [PubMed] [Google Scholar]
- 57.Kurdi P, et al. Cholic acid is accumulated spontaneously, driven by membrane deltapH, in many lactobacilli. J Bacteriol. 2000;182:6525–6528. doi: 10.1128/JB.182.22.6525-6528.2000. [DOI] [PMC free article] [PubMed] [Google Scholar]
- 58.Sarafian MH, et al. Bile acid profiling and quantification in biofluids using ultra-performance liquid chromatography tandem mass spectrometry. Anal Chem. 2015;87:9662–9670. doi: 10.1021/acs.analchem.5b01556. [DOI] [PubMed] [Google Scholar]
Associated Data
This section collects any data citations, data availability statements, or supplementary materials included in this article.
Supplementary Materials
Data Availability Statement
The datasets generated during and/or analysed during the current study are available from the corresponding author on reasonable request.