Abstract
Nanoparticles (NPs) size, surface functionalization, and concentration were claimed to contribute to distribution and toxicity outcomes of NPs in vivo. However, intrinsic chemical compositions of NPs caused inconsistent biodistribution and toxic profiles which attracted little attention. In this study, silver nanoparticles (AgNPs) and gold nanoparticles (AuNPs) were used to determine the biodistribution, toxickinetic, and genotoxicity variances in murine animals. The results demonstrated AgNPs and AuNPs were primarily deposited in the mononuclear phagocyte system (MPS) such as the liver and spleen. In particular, AuNPs seemed to be prominently stored in the liver, whereas AgNPs preferentially accumulated in more organs such as the heart, lung, kidney, etc. Also, the circulation in the blood and fecal excretions showed higher AgNPs contents in comparison with the AuNPs. Measurements of the mouse body and organ mass, hematology and biochemistry evaluation, and histopathological examinations indicated slight toxic difference between the AgNPs and AuNPs over a period of two months. RT-qPCR data revealed that AgNPs induced greater changes in gene expression with relevance to oxidative stress, apoptosis, and ion transport. Our observations proved that the NPs chemical composition played a critical role in their in vivo biodistribution and toxicity.
Introduction
Inorganic nanoparticles (NPs) have attracted increasing attention and are used in many fields, such as biomedicine, various industries, and electronics due to their excellent physicochemical properties1, 2. Currently, silver nanoparticles (AgNPs) are one of the most widely used NPs in commercial products (e.g. wound dressings, contraceptive devices, and packaging materials) because of their strong antimicrobial and anti-inflammatory properties2, 3. Gold nanoparticles (AuNPs) offer a wide range of applications including cosmetics, chemical sensing, drug carriers, bioimaging, and gene therapy4, 5. The extended use of these inorganic NPs can lead to frequent human exposure via various routes (e.g. ingestion, inhalation and dermal contact) during manufacture, use and disposal. Moreover, compared with their bulk counterparts, AgNPs and AuNPs hold greater surface area to volume ratio, higher particle reactivity, and can undergo surface modifications which could result in greater side effects once these are absorbed into the body6. It is therefore imperative to understand the potential biological responses to AgNPs and AuNPs in vivo.
Indeed, previous in vitro studies demonstrated that inorganic NPs can induce the production of reactive oxygen species (ROS), DNA damage, and apoptosis7–10. These observations resulted in a number of in vivo rodent studies that were focused on the toxicity or biokinetics of inorganic NPs following various administration routes6, 11–33. Table S1 summarized the biodistribution and/or toxicity profile of various types of AgNPs and AuNPs in rodents following oral, instillation, inhalation, and intraperitoneal exposures. Prolonged inhalational exposure to AgNPs induced lung function changes and inflammatory responses12. Major organs of accumulation for AgNPs have been shown to be the lungs and liver in a 90-day inhalation toxicity study23, and liver in several long term oral exposure studies20, 22, 24. Also, intratracheal injection showed that the majority of AuNPs were found in the lungs regardless of PEG surface modification25. Of note, during oral and inhalation exposures, or dermal contact, a few NPs were able to pass through the gastrointestinal tract (GIT), lung barriers, and dermis into the blood, resulted in extremely low amount of NPs translocated to the secondary organs and thus difficult to detect and compare the accumulation profile of the NPs in the whole body22, 28. To avoid limited systemic exposure due to the cellular barriers present in the GIT, lung, and skin, the present study was used to repeated intravenous administration of two inorganic NPs to compare their toxicity and distribution profiles in mice.
The classical in vivo studies in rodents through intravenous injection, which examined the distribution and/or toxicity of various types of AgNPs and AuNPs with sizes ranging from 1.4 nm to 250 nm were enumerated in Table 1. These studies showed that the NPs size, shape, dose, and surface modifications are responsible for the difference in toxicity and/or accumulation of NPs. Dose-dependent toxicity was observed following exposure to four different concentrations (4, 10, 20, 40 mg/kg) of intravenously administered AgNPs19. Meanwhile, they also exhibited that the major accumulation organs were observed in the liver and spleen, and the smaller NPs had a more widespread organ distribution13, 26, 27. More specifically, 10 nm AuNPs were found in various organs including the liver, spleen, kidney, heart, lungs, testis, brain, and thymus, whereas 250 nm AuNPs were restricted to the liver and spleen26. These studies have reported strong influences of exposure routes, animal gender, size, shape, concentration, surface coating, aggregation, stability, or purities of nanomaterials on the biodistribution of AgNPs and AuNPs10, 13, 14, 20–22.
Table 1.
Summary of biodistribution or toxicity of AuNPs/AgNPs in rodents via exposure of intravenous injection.
| NPs | Size (nm) | Dose | Model | Exposure duration | Tissue accumulation (in order of quantity) | Conclusions | References |
|---|---|---|---|---|---|---|---|
| AgNPs | 20, 200 | 5 mg kg−1 | Rats | 1, 7, 28 d | Li, Sp, Ki, Lu, Br, Ur, Fe | Higher tissue burden in 20 nm AgNPs group compared with 200 nm NPs group | 2 |
| AuNPs | 20 | 0.01 mg kg−1 | Rats | 1, 7 d, 1, 2 m | Li, Sp, Lu, Ki, He, Ur, Fe (Over 25 organs) | AuNPs widely deposited in the body over 2 months and caused gene expression changes after a single exposure | 6 |
| AgNPs | 7.2 ± 3.3 | 45, 5, 10 mg kg−1 | Rats | 1, 3 d | NM | Body weight and locomotor activity were decreased | 11 |
| AuNPs | 1.4, 5, 18, 80, 200, 2.8 | 1.6 ± 0.2–43.7 ± 5.3 μg/rat | Rats | 1 d | Li, Sp, Ki, Ca, Lu, Bl, GIT, Ut, He, Br, | Size and surface charge dependent distribution of NPs, e.g. most NPs accumulated in the liver increased from 50% of 1.4 nm NPs to >99% of 200 nm NPs | 13 |
| Au nanorods | NM | 0.56 mg kg−1 | Mice | 4 h, 1 d | Li, Sp, Lu, Ki, He, Tu | Gold nanorods reached to tumor tissue and had low toxicity, which was related to the surface modifications of NPs | 17 |
| AgNPs | 15–40 | 4, 10, 20, 40 mg kg−1 | Rats | 32 d | Li, Ki | AgNPs with dose <10 mg kg−1 is safe, while it is toxic when a dose over 20 mg kg−1 | 19 |
| AgNPs | 21.8 | 7.5, 30, 120 mg kg−1 | Mice | 1, 7, 14 d | Sp, Li, Lu, Ki | AgNPs could be deposited primarily in liver and spleen as well as other tissues. The circulation and elimination of NPs showed gender-related difference | 21 |
| AuNPs (PEGylated) | 11, 21, 31 | 0.07–0.30 mg kg−1 | Rats | 1 h, 1 d | Li, Sp, Ca, Bl, GIT + Fe, Lu, Ki, He, Ur, Br | 10 kDa PEG modified NPs showed prolonged blood circulation time, compared to non-PEGylated and 750 Da PEGylated AuNPs | 25 |
| AuNPs | 10, 50, 100, 250 | 0.077–0.108 mg kg−1 | Rats | 1 d | Li, Sp, Bl, Lu, Ki, He, Thy, Br, Te | Size-dependent tissue distribution of AuNPs with the smallest 10 nm showing the most widespread organ distribution | 26 |
| AuNPs | 15, 50, 100, 200 | 1000 mg kg−1 | Mice | 1 d | Li, Lu, Ki, Sp, He, Br, Bl, St, Pa | Size-dependent biodistribution of AuNPs with only smaller NPs (15 and 50 nm) crossing the blood-brain barrier | 27 |
| AgNPs | 20, 100 | 0.07–6 mg kg−1 | Rats | 28 d | NM | Immune system is the most sensitive parameter that could be affected by AgNPs, e. g. a dose of 0.01 mg kg−1 NPs decreased thymus weight | 28 |
| AgNPs | 35.3 ± 8.2 | 0.5 mg kg−1 | Rats | 1, 3, 5 d | Li, Sp, Lu, Ki, Br, Bl | Toxicity of AgNPs is mainly due to its intact nanostructure with minor contributions from its released silver ions | 30 |
| AuNPs | 13 ± 1 | 0.004–0.04 mg kg−1 | Rats | 1 h, 1 d | Li, Sp, Ca, Bl, Ki, GIT + Fe, Lu, Ut, He, Ur, Br | Polymer coated AuNPs with high colloidal stability can be degraded in vivo that caused by proteolytic enzymes | 31 |
| AuNPs | 16.1 | 0.7 mg kg−1 | Rats | 0.5 h, 28 d | Li, Sp, He, Ta, Lu, Bo, Bl, Ki, In, Te, Thy, Br, Mu | Surface coating showed greater effects on toxicity instead of on biodistribution of the AuNPs | 32 |
| AuNPs | 1.4, 80 | 0.011, 0.11 mg kg−1 | Rats | 1 d | Li, Ca, Ur, Sk, Ki, GIT + Fe, Bl, Sp, Lu, Ut, He, Br | The accumulation of 18 nm in spleen and liver is significantly higher compared with the 1.4 nm AuNPs | 33 |
| AgNPs, AuNPs | 3 ± 1.57, 6 | 11.4–13.3 mg kg−1 | Mice | 28, 56 d | Li, Sp, Ki, He, Lu, Te, Fe, Bl, In, St, Br, SV | AuNPs were mainly stored in the liver, whereas AgNPs were widely stored in more organs including the lung, brain, testis, etc | This study |
The abbreviations are used in the Table: NM – not mentioned, h – hour, d – day, w – week, m – month, Br – brain, He – heart, Li – liver, Lu – lung, Ki – kidney, In – intestine, Sk – skin, Sp – spleen, GIT – gastro-intestinal tract, Fe – feces, St – stomach, Te – testes, Thy – thymus, Tu – tumor, Ut – uterus, Ur – urine, Ca – carcass, Bl – blood, Bo – bones, SV – seminal vesicle, Mu – muscle, Pa –pancreas, Ta – tail.
However, it is still unclear whether distribution, translocation, and elimination of AgNPs and AuNPs would mainly result from the NPs size effects or NPs chemical composition (such as released the free ions). In a 28-day oral exposure study, silver acetate (Ag ions) showed higher organ distribution throughout the rat body compared with AgNPs29. Also, it was demonstrated that the silver concentration in organs was closely related with the Ag+ concentration in the AgNPs suspension which could be used to deduce that only silver ions passed through the GIT causing accumulation in the liver and spleen3. Both studies exhibited that the released silver ions and not the “nano-size” affected the NPs distribution and toxicity after oral exposure. Additionally, AgNPs and AuNPs were used to study whether the toxicity induced by NPs size or NPs chemical composition in a zebrafish model34, because both NPs possess similar chemical characteristics (water insoluble, stable, and rarely present in biological tissues). Nevertheless, no rodent toxicity studies have shown possible biodistribution and/or toxicity profiles among NPs with different chemical compositions and identical surface coating such as AgNPs and AuNPs after intravenous administration, even though the NPs chemical composition, as well as particle size, exposure route, and surface chemistry, is an important parameter that contributed to the toxicological responses.
The aim of the present study was to determine the differential accumulation, distribution, toxicity, and potential genotoxicity of AgNPs and AuNPs in mice following repeated intravenous injection for 4 weeks, at a dose with limited systemic toxicity as reported in a relevant study19. Both carboxylic acid coated AgNPs and AuNPs in this study can be conjugated to peptide, protein, and other amine containing molecules for various biomedicine applications. Herein, as a function of chemical composition, the effects of AgNPs and AuNPs on toxicokinetic and toxicity were evaluated to understand their nanotoxicity.
Results
Characterization of AgNPs and AuNPs
As shown in Fig. 1, the AuNPs exhibited uniform spherical and monodisperse state with core size of 6 nm, while the AgNPs showed uniform spherical but less monodisperse state with core size of 3 ± 1.57 nm (n = 4). The hydrodynamic diameter (HD) distribution of the inorganic NPs (shown in Fig. 1) were 12.22 ± 6.05 and 15.07 ± 6.68 nm, which were larger than the corresponding sizes from the transmission electron microscopy (TEM) measurements. Dynamic light scattering (DLS) measurements of inorganic NPs showed bigger diameter due to different surface states, water of hydration and agglomeration3, 35.
Figure 1.
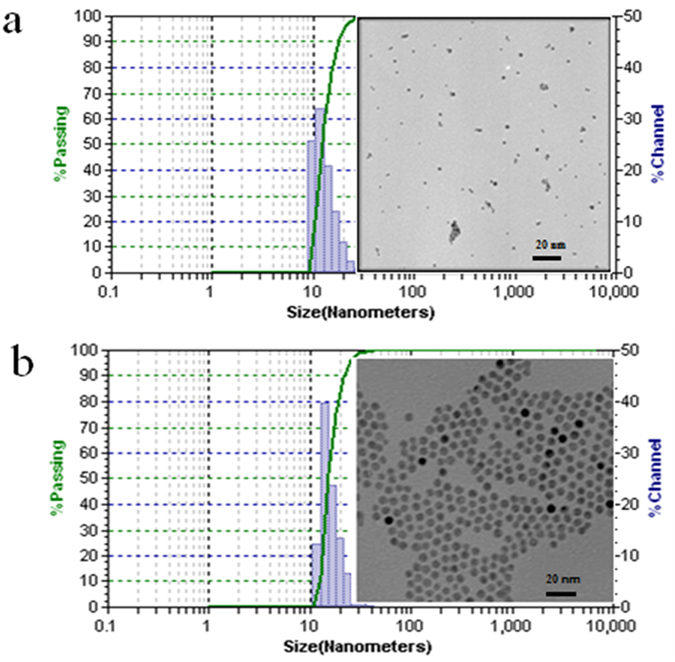
Characterizations of amphiphilic polymers coated AgNPs (a) and AuNPs (b) (TEM and DLS).
Effects on body weight and organ index
The food consumption, body weight, and organ index of each animal during the entire experimental period were evaluated as previously reported11, 20, 23, 28, 35–37. No significant changes in food consumption and body weight were observed in either of the animal groups treated with AgNPs or AuNPs. As shown in Fig. 2a, the mouse body weight of two experimental groups and the control group displayed similar increasing trends. Also, the liver, kidney, heart, and lungs showed no significant differences in mass in comparison with the control. However, weights of spleen and seminal vesicle in both NPs groups were significantly lower than controls at 28 d post the last injection (dpi). Additionally, the brain exhibited significant weight decrease at 28 dpi in the AgNPs group, while the testis had significant weight decrease at both time points for both NPs (Fig. 2b and Table S2).
Figure 2.
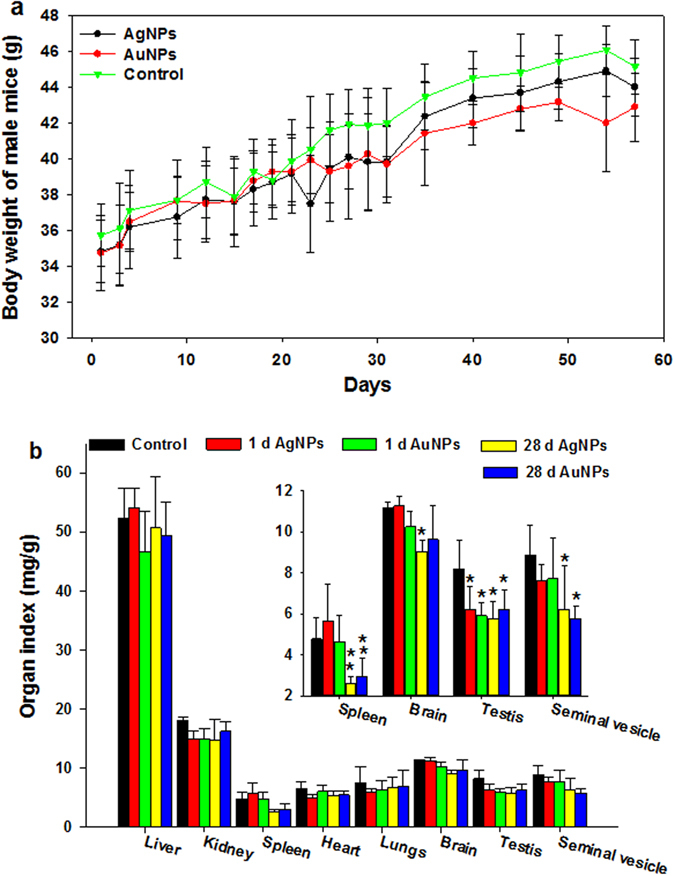
Body weight (a) and organ index (b) of Kunming mice following intravenous injection of AgNPs and/or AuNPs. All the administration doses were 11.4–13.3 mg/kg. n = 5.
Biodistribution and elimination of AgNPs and/or AuNPs
As shown in Fig. 3, AgNPs and AuNPs were both accumulated in the liver and spleen, followed by the kidney, heart, lungs and testis, and the least accumulation was found in the stomach, intestine, and seminal vesicle at 1 dpi. Note that the AuNPs concentrations (61.39 ± 19.99, 47 ± 10.62 μg/g) were significantly higher than the AgNPs concentrations (35.06 ± 4.78, 29.69 ± 4.50 μg/g) in the liver at both time points after same dose exposure (Fig. 3a). However, the concentrations of AgNPs showed higher levels in the spleen at both time points compared with AuNPs (Fig. 3a). Furthermore, concentrations of AgNPs were approximately 4–5.5 times higher than the concentrations of AuNPs in the kidney, lung, heart, and testis (Fig. 3b,c and Table S3). For instance, in the kidney, the concentration of AgNPs was 3.44 ± 1.15 μg/g, which was about 4.14 times compared with the concentration of AuNPs (0.83 ± 0.14 μg/g) at 1 dpi.
Figure 3.
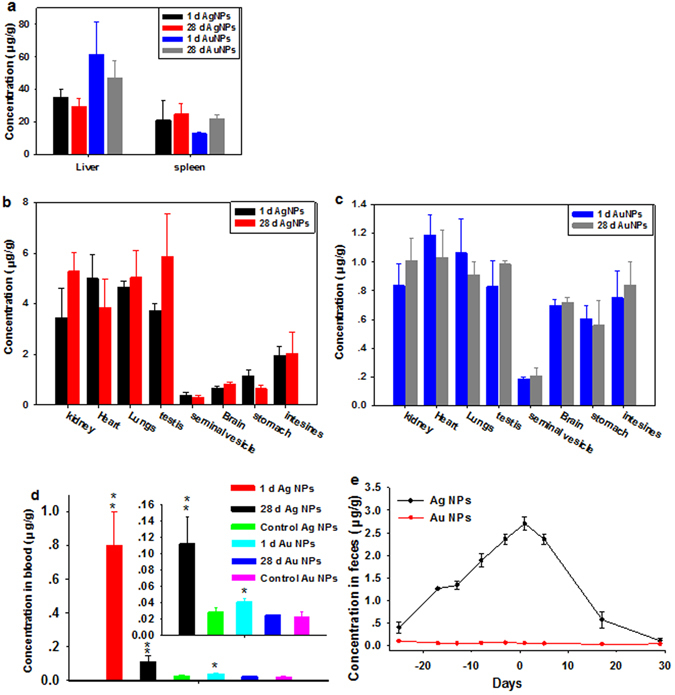
AgNPs or AuNPs levels in animal tissues (a–c), blood (d) and feces (e) as indicators of inorganic NPs biodistribution, circulation and elimination at serial time points. These results show mean and standard deviation, n = 5. a Exhibits the contents of AgNPs or AuNPs in the liver and spleen at both time points, b and c exhibit the contents of AgNPs or AuNPs in the other organs at both time points, respectively. Day −25 to day 0 are the time interval during which the NPs were administered.
The kinetics of AgNPs and/or AuNPs in the blood and feces was determined by measuring the AgNPs or AuNPs concentrations in successively collected samples. Figure 3d showed undetectable gold contents in blood at both time points, suggesting that AuNPs was rapidly cleared from the blood and effectively uptaken by MPS. By contrast, the concentration of AgNPs (0.80 ± 0.19 μg/g) in the blood exhibited higher concentration compared with the AuNPs (0.041 ± 0.004 μg/g) at 1 dpi, and then decreased over time. Figure 3e showed that the elimination rate of the AgNPs (12.22 ± 6.05 nm) in the feces of mice gradually increased after injection and reached a maximum value (2.70 ± 0.15 μg/g) at 1 dpi, and then decreased over time. But the AuNPs concentration in the feces could not be detected during the entire experimental period. Additionally, the total recovery ratios of applied AgNPs and/or AuNPs were 35.87 ± 9.94%, 31.17 ± 9.67%, and 42.54 ± 18.87%, 27.78 ± 6.13% at 1 dpi and 28 dpi, respectively (Table S4).
Biochemistry and hematology results
The inorganic NPs used here were similar in sizes to proteins or viruses which could induce inflammatory response, immune response, and alter related hematological factors in the blood such as white blood cell count38. As a result, we determined the standard inflammatory biochemical parameters such as alanine aminotransferase (ALT), aspartate aminotransferase (AST), total bilirubin (TBIL), albumin (ALB), the ratio of albumin to globulin (A/G), gamma glutamyl transaminase (GGT), alkaline phosphatase (ALP), blood urea nitrogen (BUN), and urea (UA). These biochemical markers, except the GGT, ALP, and UA, in either AgNPs or AuNPs treated groups were not statistically different from the control groups as shown in Fig. 4. The mice treated with AuNPs showed significantly increased level of GGT and decreased level of ALP (P < 0.05) but remained within the normal range at 1 dpi and 28 dpi, which may due to the highest uptake of AuNPs in the liver. In particular, UA as an indicator of renal function exhibited significantly reduced levels of AuNPs and AgNPs in all the groups, which need further investigation. Several important hematology markers including the white blood cell count (WBC), red blood cell count (RBC), hemoglobin (HB), mean corpuscular hemoglobin (MCH), polymorph multinuclear neutrophil granulocyte (PMN), lymphocyte (LY), platelet count (PLT), and hematocrit were selected for further toxicity assessment of inorganic NPs in vivo and presented in Fig. 5. No obvious signs of inflammatory responses or toxic reactions that could be attributed to the inorganic NPs were found. Moreover, there were no distinct differences in hematological parameters for inorganic NPs with different intrinsic chemical compositions. Some minor changes in PLT were observed in the NPs treated groups, which was in agreement with recent studies using nanosilicas39 and ZnS and ZnO QDs40 and CdSe/ZnS QDs41; however, they were within the normal range that had been reported in the literature. Other biochemical and hematology data were included in the Supplementary information (Figs S1 and S2).
Figure 4.
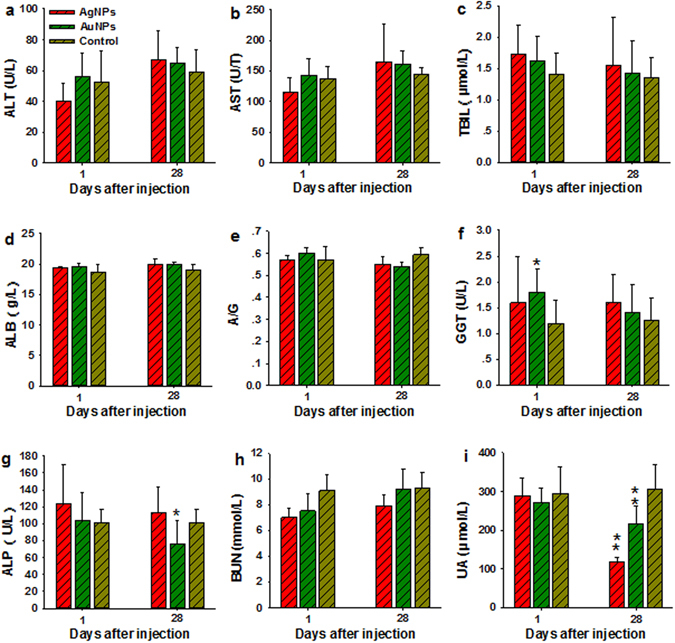
Serum biochemical analysis from animals treated with AgNPs and/or AuNPs and control. (a–i) Results exhibit mean and standard deviation of ALT (a), AST (b), TBIL (c), ALB (d), A/G (e), GGT (f), ALP (g), BUN (h), and UA (i). Abbreviations: alanine aminotransferase, ALT; aspartate aminotransferase, AST; total bilirubin, TBIL; albumin, ALB; the ratio of albumin to globulin, A/G; gamma glutamyl transaminase, GGT; alkaline phosphatase, ALP; blood urea nitrogen, BUN; and urea, UA, n = 5.
Figure 5.
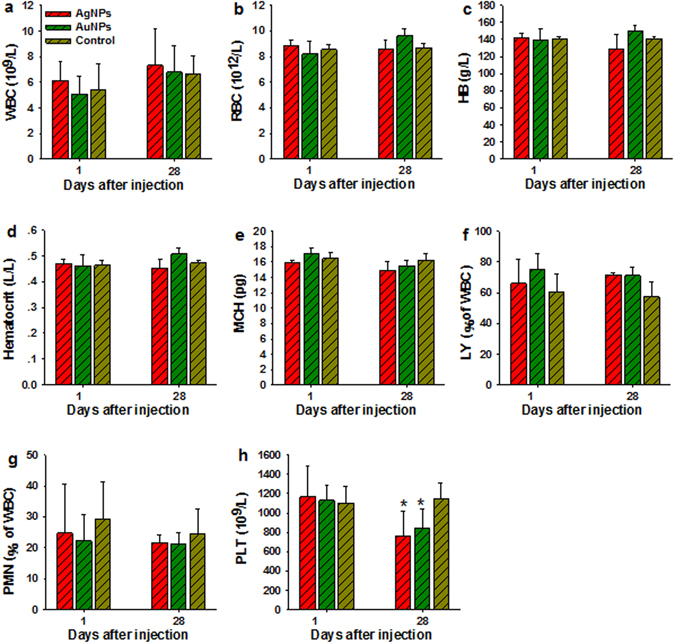
Whole blood analysis from animals treated with AgNPs and/or AuNPs and control. (a–h) Results exhibit mean and standard deviation of white blood cells count, WBC (a); red blood cells count, RBC (b); hemoglobin, HB (c); hematocrit (d); mean corpuscular hemoglobin, MCH (e), lymphocyte, LY (f); polymorphomultinuclear neutrophil granulocyte PMN (g), and platelet count, PLT (h), n = 5.
Histology results
Histopathological examination of organs to determine potential NPs-induced tissue damage, inflammation, or lesions from exposure were performed. As shown in Fig. 6 and S3, no apparent histopathological abnormalities or lesions were observed from the animals treated with the AgNPs and/or AuNPs in comparison with the control. These findings demonstrated that AgNPs and/or AuNPs at dosage of 11.4–13.3 mg/kg revealed insignificant pathological changes.
Figure 6.
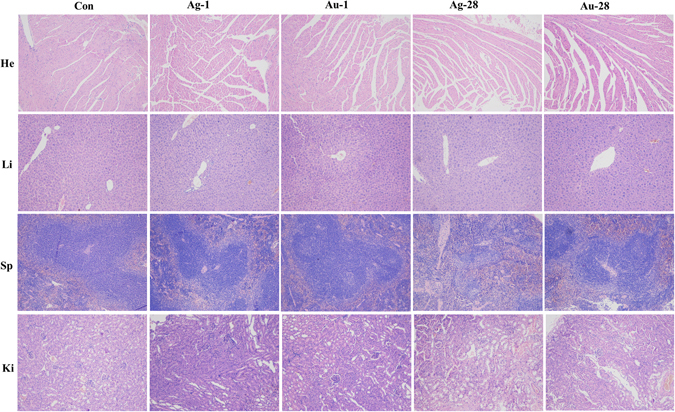
Histological images in treated animals exhibit no signs of toxicity. Heart (He), liver (Li), spleen (Sp), and kidney (Ki), from animals treated with AgNPs or AuNPs and control. Ag-1, Ag-28, Au-1, Au-28 represent the organs were collected from mice at 1 and 28 dpi, respectively. n = 5.
Gene expression profiles
The transcriptional levels of genes with functions associated to cell apoptosis, ion transport, and oxidative stress were further determined to understand the subtle differential damages of AgNPs and AuNPs in liver deposited highest amount of NPs in this study. As presented in Fig. 7, exposure to AgNPs and AuNPs induced mild and similar gene expression changes with downregulation of 3 genes expression such as Caspase-9, V-fos FBJ murine osteosarcoma viral oncogene homolog (Fos), and Zrt- and Irt-related protein 14 (Zip14) and upregulation of 7 genes expression including p53, superoxide dismutase 2 (Sod2), Heme oxygenase 1 (Hmox1), Caspase-3, Caspase-8, transferrin (Trf), and Bcl-2 in total 14 genes investigated in this study. In particular, Fos was down-regulated to 1.17–3.25 fold changes, whereas Homx1 and Caspase-3 were up-regulated from 0.73 to 1.64 times in the both NPs groups. Additionally, the residual genes used here had an opposite gene expression. For instance, mRNA levels of Metallothionein 1 (Mt1) and Metallothionein 2 (Mt2) were increased to approximately 0.48 fold change in AuNPs group, while their levels were declined to 2.17–2.64 times in AgNPs normalized to that in control group. Of note, the AgNPs treatment group exhibited the greater effect in most of gene expression compared to that in AuNPs group.
Figure 7.
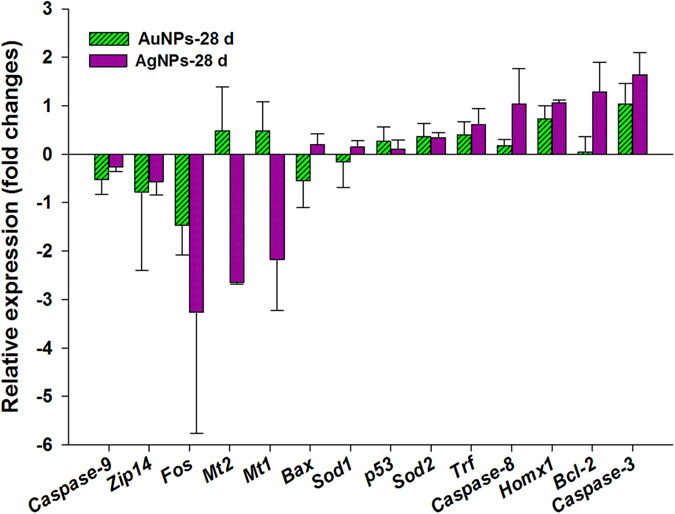
Gene expression changes in the liver of mice treated with AgNPs, AuNPs, and vehicle group on 28 dpi. The relative expression ratio refers to fold changes in the histogram which a ratio greater than zero such as 0.5 indicated gene expression increased by 0.5 time, whereas a ratio below zero indicated downregulation.
Discussion
We aimed to distinguish the biodistribution and toxicity differences between AgNPs and AuNPs by examining the body weight, organ index, organ distribution, hematology and biochemistry, histology, and gene expression profiles. First, we observed a mass decrease in spleen, brain and testis but no reduction of body weight after intravenous administration of 11.4–13.3 mg/kg AgNPs and/or AuNPs in mice. The body and organ weight proved to be susceptible to inorganic NPs intravenous exposure11, 28, 40. Zhang et al.11 demonstrated that 5, 10 and 45 mg/kg AgNPs caused a decrease in the body weight. Also, the liver and spleen mass increased while the thymus showed weight decrease with exposure to low doses of AgNPs (<6 mg/kg)28. However, the body weight and organ index were insignificantly affected by oral and inhalation exposures to both NPs3, 12, 23, 42. Increases in brain weight and in liver weight were observed only at doses up to 300 mg/kg per day in a 28 d oral toxicity study20.
The majority of AuNPs and AgNPs were accumulated in the liver and spleen, which could due to uptake by the resident phagocytes e.g. Kupffer cells in the liver and the macrophages and B cells in the spleen that are part of the MPS13, 21, 27. A relatively small amount of AuNPs or AgNPs were accumulated in the kidney, lungs, heart, stomach and intestines. AgNPs and AuNPs levels showed lower levels in the liver and small increments in the kidney and spleen at 28 dpi, indicating possible translocation of AgNPs and AuNPs in vivo. Of note, this translocation led to more accumulations in the testis and brain over time, implying that 3 ± 1.57 nm AgNPs and 6 nm AuNPs could effectively cross the blood-testis barrier (BTB) and the blood-brain barrier (BBB). The AgNPs with 28 oral administration was not cleared out of the brain and testis during a 4-month recovery period, which was consistent with our results, albeit over a shorter period of time14. Nevertheless, the total recovery ratios of administrated NPs were less than 50% in all groups, indicating that the residual amount of both NPs could be mainly stored in the carcass. Previous studies showed that AgNPs concentrations in the urine were extremely low compared with the concentrations in the feces37, 43. NPs with sizes <5.5 nm exhibited rapid and efficient urinary excretion, while 10–20 nm NPs were trapped in the liver and eliminated in the feces44. Renal excretion of AgNPs and AuNPs with sizes of 12.22 ± 6.05 and 15.07 ± 6.68 nm respectively could not be the primary route of elimination. Furthermore, a small number of AgNPs and even fewer AuNPs were detected in the feces, suggesting that the AgNPs but not the AuNPs were excreted through the biliary pathway from the liver to the bile duct, intestine, and feces37.
The difference in HD of the AgNPs and AuNPs (12.22 ± 6.05 and 15.07 ± 6.68 nm) could show minimal effects on the distribution and toxicity of NPs because AuNPs with HD of 11 nm and 21 nm showed no significant differences in terms of accumulations in the liver, spleen, lung, and kidney as well as in terms of body clearance from feces and urine at 24 h after administration25; and also NPs with approximate HD of 10–20 nm had a similar elimination behavior in vivo 44. Previous studies suggested that a complex protein corona is formed immediately when NPs were incubated in a biological fluid, and the surface coating controlled the composition and structure of the protein corona which was relevant to the pathophysiology in vivo 45–47. In this study, the identical surface coating (amphiphilic polymer coating with a reactive group of carboxylic acid) used for both NPs was selected to exclude the impact of surface physicochemical properties during the formation of the dynamic protein corona. The difference in distribution and circulation of AgNPs and AuNPs in vivo, therefore, could be attributed to the intrinsic properties of the NPs that lead to the formation of diverse protein coronas on the surface of AgNPs and AuNPs, rather than the size of the NPs. Additionally, in model zebrafish embryos, Bar-Ilan et al.34 demonstrated that AgNPs induced more severe lethal and sub-lethal effects than AuNPs at the same concentrations and sizes, implying that the NPs chemical compositions play a vital role in toxicity induction. The intravenously administered AgNPs were stored primarily in the liver and spleen, which then released silver ions that migrated and accumulated in the kidney, lung, and brain30. More widely accumulated AgNPs in mice that were observed in our study were therefore probably due to the released silver ions that easily translocated into organs.
Evaluation of genotoxicity is an ideal tool to assess the biosafety at molecular level for metal NPs without induction of apparent histologic lesions. The hypothesis was that susceptive genes related to oxidative stress and apoptosis could be affected as proved in previous studies10, 20, though no obvious injuries occurred in organs of present study. Caspase 8 and Caspase 9 as initiator caspases are activated by death-inducing tumor necrosis family receptors and cytochrome c, respectively, which are involved in immune and apoptosis signaling. Caspase-3 mediates mitochondrial targeted apoptotic signaling pathways which is an executor of apoptosis48, 49. Activation of p53 is associated with apoptosis through regulation of Bcl-2 and Bax gene expression. Bcl-2 is a type of apoptosis inhibiting factor while Bax regulates the apoptosis activation factors such as cytochrome C, ratio of their expression level reflects the state of cell apoptosis. The transcription levels of these apoptosis markers revealed that gene expression was moderate regulated in both groups, while more effectively changed was observed in liver of mice treated with AgNPs. ROS is also considered to be a mechanism of genotoxicity for metal NPs, which could promote oxidative DNA damage8, 22. Proteins of Sod1 and Sod2 are capable of scavenging free superoxide radicals and Homx1 is an ROS sensor which exhibited excellent anti-inflammatory and antioxidant properties49. Stable gene expression of Sod1 and Sod2 and small enhancement of Hmox1 expression indicated inefficient oxidative stress was induced in the liver of mice exposure to both NPs. Moreover, degradation of metal NPs in vivo could influence the ion transport of essential trace metal elements36. Trf is an iron transporter and Zip-14 is an iron and zinc transporter showed minimal effects in expression when mice exposure to NPs. However, Metallothionein (MT) is considered to be the essential indicator of toxicity caused by heavy metals and/or metal NPs as facilitating detoxification of metal and protection from oxygen free radicals49. Mt1 and Mt2 were significantly down-regulated in liver of mice treated with AgNPs as our previous study for iron oxide magnetic NPs36 referred to free silver ions could be released from AgNPs. Their expressions in AuNPs group showed an opposite trend with negligible upregulation manifested that AuNPs should be more inert in vivo.
In conclusion, the present study demonstrated that the AuNPs were mainly stored in the liver, whereas the AgNPs were widely stored in more organs including the heart, lungs, kidney, etc. The circulation of the NPs in the blood and excretions in the feces were also found to differ between the AgNPs and the AuNPs. The transcription levels of biomarkers of apoptosis, oxidative stress, and ion transport were not significantly altered except Mt1, Mt2, Fos, and Caspase-3 (but still less than 3.5 fold changes normalized to control group) in livers of mice treated with both NPs on 28 dpi, while more effectively changed was observed in AgNPs group. As shown on Fig. 8, these findings suggested that NPs chemical compositions (AgNPs and AuNPs) were individually responsible for their distribution and toxic profiles. No definite signs of toxicity in mice treated with AgNPs and/or AuNPs were observed over the period of two months as indicated by observing the body weight, hematology, biochemistry, histopathology and genotoxicity. Further studies involving several apoptotic signaling pathways and other biomarkers based on transcriptomics and proteomics during long term exposure in vivo should be conducted to distinguish the toxicity differences caused by the chemical composition of the NPs to gather valuable information for safety.
Figure 8.
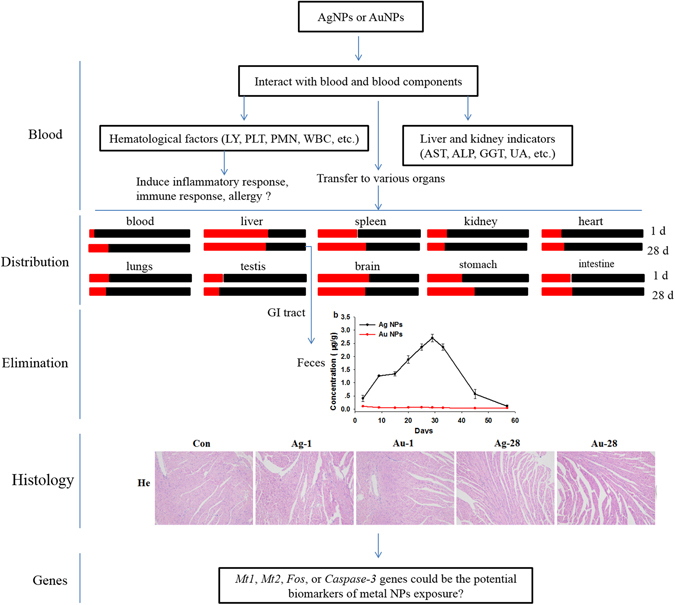
The proposed toxic and distribution difference of AgNPs and AuNPs based on this study data. The red and black boxes represent AuNPs and AgNPs treated group, respectively.  Means the ratio of the gold content over silver content in various organ.
Methods
Materials
Water soluble AgNPs and/or AuNPs with amphiphilic polymer coating and carboxylic acid as the reactive group used here were obtained from Ocean NanoTech, LLC (San Diego, CA). Two NPs sizes were confirmed with TEM prior to use. Briefly, NPs samples were prepared by dropping a sample onto an agar carbon-coated copper grid (400 meshes) and the solvent was evaporated. The TEM images were obtained at 50–100 K magnifications with a JEOL transmission electron microscope (JEOL USA, Inc. Peabody, MA) operating at 100 kV as previously described36. The HD distributions of the AgNPs and AuNPs (n = 4) and zeta potential were measured by DLS using a Zetatrac Ultra 151 (Microtrac Inc., Montgomeryville, PA).
Experimental design
Healthy, 10–12 week old, adult male KunMing mice (30–35 g each) were purchased from the experimental animal center of Nanchang University, China. The animals were raised in an animal facility at 25 °C with a 12 h light/dark cycle; the animals were supplemented with food and water ad libitum. All procedures involving animals were approved by the Animal Care Review Committee (approval number 0064257), Nanchang University, Jiangxi, China, and were performed in accordance with the relevant guidelines and regulations of institutional animal care committee.
Thirty male mice were randomly divided into three groups (the AgNPs group, AuNPs group, and control group). Exposures were carried out via tail-vein injection with 0.1 mL of 0.5 mg/mL AgNPs or AuNPs suspension or physiological saline (control) each time, 2 times a week, for 4 weeks. The injected dosage was approximately 11.4–13.3 mg NPs/kg body weight in total, which was similar with the doses used in relevant intravenous exposure studies19, 28 and much less than the doses used in several oral exposure studies3, 14, 20, 29. The weight of the mice and food consumption were recorded throughout the entire experimental period. Collection of the blood samples and isolation of various organs were as described in our earlier study36. In brief, blood samples were harvested from the five mice in each group on day 1 and 28 dpi and then the mice were sacrificed. The organ samples were collected and weighed for visceral index measurement. Two samples of the organs were isolated and a small portion of tissue was immediately fixed in 10% neutral buffered formalin for histological examination. The remaining portion from each organ (0.1–0.5 g) was stored at −20 °C for elemental analysis. The organ indexes were calculated using the following eq. (1) based on a recent study40:
| 1 |
Quantitative analysis of AgNPs and AuNPs in tissues
The subsamples of approximately 0.1–0.5 g tissue (including liver, spleen, kidneys, heart, lungs, brain, intestine, stomach, testis, seminal vesicle, and feces, individually) and approximately 0.3 mL whole blood were evaluated for concentrations of AgNPs or AuNPs. The subsamples were dissolved in 12 mL digestion solution (HNO3:HClO4 = 5:1) and were heated to 230 °C. The temperature was increased to 280 °C when the reaction reached equilibrium. The digested organ samples were diluted with Milli-Q water to 25 mL after removal from the heating block. For AgNPs treatment group, the digested subsamples were used to determine the silver concentrations with AAS (Thermo Scientific iCE 3500, AAS, 0.05 mg/L minimum detectable) when the concentration of AgNPs was greater than 0.05 mg/L and ICP-MS (Varian 820-MS, ICP-Mass spectrometer) when the concentration of AgNPs was less than 0.05 mg/L. With the AuNPs treatment group, the digested subsamples were used to determine the gold concentrations with ICP-OES (Optima 5300 DV, PerkinElmer) when the concentration of AuNPs was greater than 0.05 mg/L and ICP-MS when the concentration of AuNPs was less than 0.05 mg/L. The concentration of AgNPs and AuNPs in the isolated organs from the control animals was determined using ICP-MS. All sample digestions and measurements were performed by using the standard protocol established by Center of Analysis and Testing of Nanchang University, Nanchang. The contents of AgNPs and AuNPs in the different tissues were calculated using the following eq. (2):
| 2 |
Blood biochemistry and hematology
Before the mice were sacrificed by cervical dislocation, blood were collected through the retro orbital plexus region in potassium EDTA collection tube and drug free tube for hematology and serum biochemistry analysis. A small amount of whole blood (0.3 mL) was collected in potassium EDTA collection tube for hematology, and approximately 0.8 mL blood was centrifuged (4000 rpm, 10 min) to obtain at least 0.25 mL blood plasma for serum biochemistry study. The residual blood of each mouse was used to determine the AgNPs or AuNPs contents. Indicators of liver and kidney functions such as ALT, AST, TBIL, ALB, A/G, GGT, ALP, BUN, and UA were monitored. WBC, RBC, HB, MCH, PMN, LY, and PLT were also determined. The whole blood with anticoagulant and the serum were examined and followed the guidelines and regulations of the First Affiliated Hospital of Nanchang University, Nanchang, China.
Pathological examinations
A small portion of each organ was fixed in 10% neutral buffered formalin. Subsequently, isolated tissues were embedded in paraffin blocks (previously melted at 58 °C) and frozen at 4 °C before 3–5 µm sections were cut and stained with hematoxylin and eosin (H&E) for histological examination. An Olympus optical microscope (Tokyo, Japan) was used to observe the stained slices.
RT-qPCR analysis
Since highest deposition of both NPs in the liver which was selected to the representative organ to determine the sensitive gene expression. The total RNA extraction, cDNA synthesis, and Quantitative PCR analysis were performed as our previously study36. In brief, RNA was extracted and cDNA was synthesized using the AxyPrepTM Multisource Total RNA Miniprep Kit (Lot#03415KD1, Case#161) and the Takara PrimeScriptTM RT reagent kit (Cat#RR047A, Lot#AK2802), respectively, according to the manufacturer’s protocol. The isolated total RNA was examined by agarose gel electrophoresis and quantified by using the NanoDrop 1000 spectrophotometer (Thermo scientific Inc.) with total RNA (1000 ng) for cDNA synthesis. Table S5 lists the qPCR primers synthesized by Invitrogen China (Shanghai, China). QPCR was carried out using SYBR® Premix Ex Taq™ II (TakaRa Code: DRR820A). The reaction mixture was prepared by mixing aliquots of cDNA, 0.8 μL (10 μM) of each primer, 5 μL SYBR® Premix Ex Taq™ II (2×) and 0.2 μL ROX Reference Dye II (50×) in a final volume of 10 μL. Amplification was performed on a 7900HT Fast Real-Time System (Applied Biosystems, Foster city, CA) with the following two-step thermal cycling program: 1 cycle at 95 °C for 30 s, then 40 cycles at 95 °C for 5 s, and then 60 °C for 1 min. Relative gene expression levels were determined by the critical threshold (Ct) number and calculated using the 2−ΔΔCt method, with GADPH utilized as the reference gene for whole groups.
Statistical analysis
All the data were expressed as means ± standard deviations (n = 5). Comparison of results among the groups were carried out by one-way analysis of variance (ANOVA) and L.S.D. test using SPSS v16.0 (SPSS, Inc., Chicago, IL); *P < 0.05 and **P < 0.01 were considered significant statistically and extremely significant statistically, respectively.
Electronic supplementary material
Acknowledgements
This work was supported by Natural Science Foundation of China (81560537), Training Plan for the Young Scientist (Jinggang Star) of Jiangxi Province (20142BCB23004), Major Program of Natural Science Foundation of Jiangxi Province (20143ACB21003) and Ganpo Talent 555 Engineering Project. The authors would like to thank Dr. Andrew Wang and Dr. Hong Xu for providing valuable information and the materials of nanoparticles, as well as special thanks to Dr. Wolfgang G. Kreyling for the discussion and great comments and Dr. Tobias Stoeger and Dr. Otmar Schmid for the discussion regarding histological images.
Author Contributions
L.Y. carried out the experiments, analyzed data, performed the statistical analysis and drafted the manuscript. H.K. and W.Z. participated in all experimental procedures and carried out data analysis. Z.P.A. made substantial contribution to interpret the data and modify the manuscript. H.X. and H.W. designed the entire project, supervised all experiments, and coordinated the research activities. All authors participated in the preparation of the manuscript and approved the final manuscript.
Competing Interests
The authors declare that they have no competing interests.
Footnotes
Electronic supplementary material
Supplementary information accompanies this paper at doi:10.1038/s41598-017-03015-1
Publisher's note: Springer Nature remains neutral with regard to jurisdictional claims in published maps and institutional affiliations.
References
- 1.Sau TK, Rogach AL, Jäckel F, Klar TA, Feldmann J. Properties and applications of colloidal nonspherical noble metal nanoparticles. Adv. Mater. 2010;22:1805–25. doi: 10.1002/adma.200902557. [DOI] [PubMed] [Google Scholar]
- 2.Dziendzikowska K, et al. Time-dependent biodistribution and excretion of silver nanoparticles in male Wistar rats. J. Appl. Toxicol. 2012;32:920–928. doi: 10.1002/jat.2758. [DOI] [PubMed] [Google Scholar]
- 3.Zande M, et al. Distribution, elimination, and toxicity of silver nanoparticles and silver ions. ACS Nano. 2012;6:7427–7442. doi: 10.1021/nn302649p. [DOI] [PubMed] [Google Scholar]
- 4.Boisselier E, Astruc D. Gold nanoparticles in nanomedicine: preparations, imaging, diagnostics, therapies and toxicity. Chem. Soc. Rev. 2009;38:1759–82. doi: 10.1039/b806051g. [DOI] [PubMed] [Google Scholar]
- 5.Ghosh P, Han G, De M, Kim CK, Rotello VM. Gold nanoparticles in delivery applications. Adv. Drug Deliver. Rev. 2008;60:1307–15. doi: 10.1016/j.addr.2008.03.016. [DOI] [PubMed] [Google Scholar]
- 6.Balasubramanian SK, et al. Biodistribution of gold nanoparticles and gene expression changes in the liver and spleen after intravenous administration in rat. Biomaterials. 2010;31:2034–42. doi: 10.1016/j.biomaterials.2009.11.079. [DOI] [PubMed] [Google Scholar]
- 7.Lankoff A, et al. The effect of agglomeration state of silver and titanium dioxide nanoparticles on cellular response of HepG2, A549 and THP-1 cells. Toxicol. Lett. 2012;208:197–213. doi: 10.1016/j.toxlet.2011.11.006. [DOI] [PubMed] [Google Scholar]
- 8.Li JJ, et al. Gold nanoparticles induce oxidative damage in lung fibroblasts in vitro. Adv. Mater. 2008;20:138–42. doi: 10.1002/adma.200701853. [DOI] [Google Scholar]
- 9.Chueha PJ, Lianga RY, Leea YH, Zenga Z, Chuang SM. Differential cytotoxic effects of gold nanoparticles in different mammalian cell lines. J. Hazard. Mater. 2014;264:303–312. doi: 10.1016/j.jhazmat.2013.11.031. [DOI] [PubMed] [Google Scholar]
- 10.Kovács, D. et al. Silver nanoparticles defeat p53-positive and p53-negative osteosarcoma cells by triggering mitochondrial stress and apoptosis. Sci. Rep. 6, doi:10.1038/srep27902 (2016). [DOI] [PMC free article] [PubMed]
- 11.Zhang Y, et al. Silver nanoparticles decrease body weight and locomotor activity in adult male rats. Small. 2013;9:1715–20. doi: 10.1002/smll.201201548. [DOI] [PubMed] [Google Scholar]
- 12.Sung JH, et al. Lung function changes in Sprague-Dawley rats after prolonged inhalation exposure to silver nanoparticles. Inhal. Toxicol. 2008;20:567–74. doi: 10.1080/08958370701874671. [DOI] [PubMed] [Google Scholar]
- 13.Hirn S, et al. Particle size-dependent and surface charge-dependent biodistribution of gold nanoparticles after intravenous administration. Eur. J. Pharm. Biopharm. 2011;77:407–16. doi: 10.1016/j.ejpb.2010.12.029. [DOI] [PMC free article] [PubMed] [Google Scholar]
- 14.Lee JH, et al. Biopersistence of silver nanoparticles in tissues from Sprague –Dawley rats. Part. Fibre Toxicol. 2013;10:36. doi: 10.1186/1743-8977-10-36. [DOI] [PMC free article] [PubMed] [Google Scholar]
- 15.Lasagna-Reeves C, et al. Bioaccumulation and toxicity of gold nanoparticles after repeated administration in mice. Biochem. Bioph. Res. Co. 2010;393:649–55. doi: 10.1016/j.bbrc.2010.02.046. [DOI] [PubMed] [Google Scholar]
- 16.Knudsen KB, et al. Differential toxicological response to positively and negatively charged nanoparticles in the rat brain. Nanotoxicology. 2014;8:764–74. doi: 10.3109/17435390.2013.829589. [DOI] [PubMed] [Google Scholar]
- 17.Wan, J. et al. Surface chemistry but not aspect ratio mediates the biological toxicity of gold nanorods in vitro and in vivo. Sci. Rep. 5, doi:10.1038/srep11398 (2015). [DOI] [PMC free article] [PubMed]
- 18.Tak, Y. K., Pal, S., Naoghare, P. K., Rangasamy, S. & Song, J. M. Shape-dependent skin penetration of silver nanoparticles: does it really matter? Sci. Rep. 5, doi:10.1038/srep16908 (2015). [DOI] [PMC free article] [PubMed]
- 19.Tiwari DK, Jin T, Behari J. Dose-dependent in-vivo toxicity assessment of silver nanoparticle in Wistar Rats. Toxicol. Mech. Method. 2011;21:13–24. doi: 10.3109/15376516.2010.529184. [DOI] [PubMed] [Google Scholar]
- 20.Kim YS, et al. Twenty-eight-day oral toxicity, genotoxicity, and gender-related tissue distribution of silver nanoparticles in Sprague-Dawley rats. Inhal. Toxicol. 2008;20:575–83. doi: 10.1080/08958370701874663. [DOI] [PubMed] [Google Scholar]
- 21.Xue Y, et al. Acute toxic effects and gender-related biokinetics of silver nanoparticles following an intravenous injection in mice. J. Appl. Toxicol. 2012;32:890–99. doi: 10.1002/jat.2742. [DOI] [PubMed] [Google Scholar]
- 22.Johnston HJ, et al. A review of the in vivo and in vitro toxicity of silver and gold particulates: particle attributes and biological mechanisms responsible for the observed toxicity. Crit. Rev. Toxicol. 2010;403:28–46. doi: 10.3109/10408440903453074. [DOI] [PubMed] [Google Scholar]
- 23.Sung JH, et al. Subchronic inhalation toxicity of silver nanoparticles. Toxicol. Sci. 2009;108:452–61. doi: 10.1093/toxsci/kfn246. [DOI] [PubMed] [Google Scholar]
- 24.Sung JH, et al. Subacute oral toxicity investigation of nanoparticulate and ionic silver in rats. Arch. Toxicol. 2012;86:543–51. doi: 10.1007/s00204-011-0759-1. [DOI] [PubMed] [Google Scholar]
- 25.Lipka J, et al. Biodistribution of PEG-modified gold nanoparticles following intratracheal instillation and intravenous injection. Biomaterials. 2010;31:6574–81. doi: 10.1016/j.biomaterials.2010.05.009. [DOI] [PubMed] [Google Scholar]
- 26.De Jong WH, et al. Particle size-dependent organ distribution of gold nanoparticles after intravenous administration. Biomaterials. 2008;29:1912–19. doi: 10.1016/j.biomaterials.2007.12.037. [DOI] [PubMed] [Google Scholar]
- 27.Sonavane G, Tomoda K, Makino K. Biodistribution of colloidal gold nanoparticles after intravenous administration: effect of particle size. Colloid surface B. 2008;66:274–80. doi: 10.1016/j.colsurfb.2008.07.004. [DOI] [PubMed] [Google Scholar]
- 28.De Jong WH, et al. Systemic and immunotoxicity of silver nanoparticles in an intravenous 28 days repeated dose toxicity study in rats. Biomaterials. 2013;34:8333–43. doi: 10.1016/j.biomaterials.2013.06.048. [DOI] [PubMed] [Google Scholar]
- 29.Loeschner K, et al. Distribution of silver in rats following 28 days of repeated oral exposure to silver nanoparticles or silver acetate. Part. Fibre Toxicol. 2011;8:18. doi: 10.1186/1743-8977-8-18. [DOI] [PMC free article] [PubMed] [Google Scholar]
- 30.Su CK, Liu HT, Hsia SC, Sun YC. Quantitatively profiling the dissolution and redistribution of silver nanoparticles in living rats using a knotted reactor-based differentiation scheme. Anal. Chem. 2014;86:8267–74. doi: 10.1021/ac501691z. [DOI] [PubMed] [Google Scholar]
- 31.Kreyling WG, et al. In vivo integrity of polymer-coated gold nanoparticles. Nat. Nanotechnol. 2015;10:619–623. doi: 10.1038/nnano.2015.111. [DOI] [PubMed] [Google Scholar]
- 32.Fraga S, et al. Short-and long-term distribution and toxicity of gold nanoparticles in the rat after a single-dose intravenous administration. Nanomed.-Nanotechnol. 2014;10:1757–1766. doi: 10.1016/j.nano.2014.06.005. [DOI] [PubMed] [Google Scholar]
- 33.Semmler-Behnke M, et al. Biodistribution of 1.4- and 18- nm gold particles in rats. Small. 2008;4:2108–2111. doi: 10.1002/smll.200800922. [DOI] [PubMed] [Google Scholar]
- 34.Bar-Ilan O, Albrecht RM, Fako VE, Furgeson DY. Toxicity assessments of multisized gold and silver nanoparticles in zebrafish embryos. Small. 2009;5:1897–10. doi: 10.1002/smll.200801716. [DOI] [PubMed] [Google Scholar]
- 35.Su Y, et al. In vivo distribution, pharmacokinetics, and toxicity of aqueous synthesized cadmium-containing quantum dots. Biomaterials. 2011;32:5855–62. doi: 10.1016/j.biomaterials.2011.04.063. [DOI] [PubMed] [Google Scholar]
- 36.Yang L, et al. Size dpendent bodistribution and txicokinetics of ion oide mgnetic nnoparticles in mce. Nanoscale. 2015;7:625–36. doi: 10.1039/C4NR05061D. [DOI] [PubMed] [Google Scholar]
- 37.Zhang Y, et al. Biodistribution, pharmacokinetics and toxicology Ag2S of near-infrared quantum dots in mice. Biomaterials. 2013;34:3639–46. doi: 10.1016/j.biomaterials.2013.01.089. [DOI] [PubMed] [Google Scholar]
- 38.Nel A, Xia T, Mädler L, Li N. Toxic potential of materials at the nanolevel. Science. 2006;311:622–27. doi: 10.1126/science.1114397. [DOI] [PubMed] [Google Scholar]
- 39.Nabeshi H, et al. Amorphous nanosilicas induce consumptive coagulopathy after systemic exposure. Nanotechnology. 2012;23:045101. doi: 10.1088/0957-4484/23/4/045101. [DOI] [PubMed] [Google Scholar]
- 40.Yang Y, et al. Toxicity and biodistribution of aqueous synthesized ZnS and ZnO quantum dots in mice. Nanotoxicology. 2014;8:107–16. doi: 10.3109/17435390.2012.760014. [DOI] [PubMed] [Google Scholar]
- 41.Tang Y, et al. The role of surface chemistry in determining in vivo biodistribution and toxicity of CdSe/ZnS core–shell quantum dots. Biomaterials. 2013;34:8741–55. doi: 10.1016/j.biomaterials.2013.07.087. [DOI] [PubMed] [Google Scholar]
- 42.Ji JH, et al. Twenty-eight-day inhalation toxicity study of silver nanoparticles in Sprague-Dawley rats. Inhal. Toxicol. 2007;19:857–71. doi: 10.1080/08958370701432108. [DOI] [PubMed] [Google Scholar]
- 43.Park K, et al. Bioavailability and toxicokinetics of citrate-coated silver nanoparticles in rats. Arch. Pharm. Res. 2011;34:153–58. doi: 10.1007/s12272-011-0118-z. [DOI] [PubMed] [Google Scholar]
- 44.Choi HS, et al. Renal clearance of quantum dots. Nat. Biotechnol. 2007;25:1165–70. doi: 10.1038/nbt1340. [DOI] [PMC free article] [PubMed] [Google Scholar]
- 45.Tenzer S, et al. Rapid formation of plasma protein corona critically affects nanoparticle pathophysiology. Nat. Nanotechnol. 2013;8:772–781. doi: 10.1038/nnano.2013.181. [DOI] [PubMed] [Google Scholar]
- 46.Jedlovszky-Hajdu A, et al. Surface coatings shape the protein corona of SPIONs with relevance to their application in vivo. Langmuir. 2012;28:14983–14991. doi: 10.1021/la302446h. [DOI] [PubMed] [Google Scholar]
- 47.Sakulkhu U, et al. Protein corona composition of superparamagnetic iron oxide nanoparticles with various physico-chemical properties and coatings. Sci. Rep. 2014;4:5020. doi: 10.1038/srep05020. [DOI] [PMC free article] [PubMed] [Google Scholar]
- 48.Kuang H, et al. Size dependent effect of ZnO nanoparticles on endoplasmic reticulum stress signaling pathway in murine liver. J. Hazard. Mater. 2014;317:119–126. doi: 10.1016/j.jhazmat.2016.05.063. [DOI] [PubMed] [Google Scholar]
- 49.Xu L, et al. Genotoxicity and molecular response of silver nanoparticle (NP)-based hydrogel. J. nanobiotechnol. 2012;10:16. doi: 10.1186/1477-3155-10-16. [DOI] [PMC free article] [PubMed] [Google Scholar]
Associated Data
This section collects any data citations, data availability statements, or supplementary materials included in this article.


