

Abstract
Background and Methods
Evidence shows that both the physical and social environments play a role in the development of cardiovascular disease. The purpose of this systematic review is two-fold: First, we summarize research from the past 12 years from the growing number of studies focused on effect modification of the relationships between air pollution and cardiovascular disease (CVD) outcomes by socioeconomic position (SEP) and; second, we identify research gaps throughout the published literature on this topic and opportunities for addressing these gaps in future study designs.
Results
We identified 30 articles that examined the modifying effects of either material resources or psychosocial stress (both related to SEP) on associations between short and long-term air pollution exposure and CVD endpoints. Although 18 articles identified at least one interaction between an air pollutant and material resource indicator, 11 others did not. Support for susceptibility to air pollution by psychosocial stress was weaker; however, only three articles tested this hypothesis. Further studies are warranted to investigate how air pollution and SEP together may influence CVD.
Conclusions
We recommend that such research include thorough assessment of air pollution and SEP correlations, including spatial correlation; investigate air pollution indices or multi-pollutant models; use standardized metrics of SEP to enhance comparability across studies; and evaluate potentially susceptible populations.
Keywords: Particulate matter, Air pollution, Traffic, Susceptibility, Cardiovascular, Stress, Socioeconomic, Effect modification
Background
Cardiovascular disease (CVD) is the leading cause of mortality in the United States and disparities in CVD are substantial and persistent [1, 2]. Both the physical and social environments play a role in the development of this multifactorial disease [2]. Physical environmental exposures, specifically air pollutants, are a major factor in the global burden of disease [3]. Air pollutants linked to CVD and mortality include particulate matter (PM), nitrogen dioxide (NO2) and ozone [2]. In particular, PM has been associated with CVD mortality and the development of chronic CVD conditions, including hypertension and ischemic heart disease, as well as acute events like myocardial infarction [4]. Ambient PM levels account for 3.1% of disability-adjusted life years lost and household air pollution levels account for 4.3% in recent global burden of disease estimates [3].
To evaluate the influence of the social environment on health outcomes, researchers utilize material resource- and prestige-based measures to represent an individual’s socioeconomic position (SEP) within a social hierarchy [5, 6]. Lower SEP has been linked to adverse outcomes including reduced life expectancy and higher incidence of CVD [7]. Measurements related to SEP include both access to material resources and psychosocial stress, which have been independently associated with adverse CVD outcomes and markers of risk [8–10]. Access to material resources include characteristics such as income, wealth and educational achievement [6]. Psychosocial stress results when external conditions overwhelm an individual’s ability and resources to manage the negative effects of external stressors [11]. The pathophysiological impacts of psychosocial stress are mediated largely via disruption of an individual’s ability to maintain allostasis, the adaptive processes that maintain homeostasis by producing chemical messengers (such as cortisol and adrenalin) as mediators [12]. Specifically, allostatic imbalance has been shown to result in compromised immune function, wear-and-tear on bodily systems and susceptibility to illness [9, 13].
Previous reviews have summarized the literature on material resources or psychosocial stress as effect modifiers of the relationship between air quality and health [8, 14–19]. They have examined associations related to a range of air pollutants, including PM, ozone and NO2, and multiple adverse health outcomes, most frequently general mortality or respiratory effects. Common individual measures of material resource access among these studies include education, household income, and occupation [8, 19]. Education, for example, was found to be a significant effect modifier of the relationship between both sulfate and PM2.5 with CVD mortality in the 2000 reanalysis of the Harvard Six Cities and American Cancer Society (ACS) cohorts [20]. Area-level measures are constructed using analogous information to individual measures, e.g., median household income and median education at the census tract or zip code level, or information on properties of the community or physical environment, such as crime statistics, density and type of grocery stores or restaurants and the like [8, 14–19]. Other reviews examined psychosocial stress utilizing measures such as the perceived stress scale (PSS) or allostatic load [8, 18]. This review contributes new information in two major ways: a focus exclusively on CVD, which is warranted given the significant burden of this disease in the United States and across the globe, and inclusion of studies from multiple countries outside of the U.S., Europe and Canada, which provide a more diverse foundation for understanding population differences.
The first purpose of this systematic review is to evaluate research within the past 12 years concerning interactions between air pollution and SEP, expressed specifically as access to material resources and psychosocial stress, focusing on less well-summarized CVD outcomes, exclusively. The second purpose is to identify research gaps within the published literature on this topic and provide recommendations for addressing these gaps in future research.
Methodology
We identified articles published in peer-reviewed journals within the MEDLINE® database between January 1, 2005 and December 31, 2016. Our systematic review methodology, including a complete list of search terms, is outlined in Table 1 and is based on the PRISMA-P checklist [21]. In addition to restricting publications to the dates above, other eligibility criteria included being written in English, publication in a peer-reviewed journal, a focus on human cardiovascular health effects, and being primary research. In addition, the article must explicitly state, as an aim, the evaluation of the impact of interactions between air pollutants (as the exposure) and indicators of SEP (access to material resources or psychosocial stress) on cardiovascular health. Searches were conducted using PubMed® and included entering an exposure (e.g. particulate matter), a modifier (e.g. education) and an outcome (e.g. inflammation) jointly into the search field.
Table 1.
Systematic review methodology
| Section/Topic | Detail |
|---|---|
| Objectives | Review articles from the past 12 years that explicitly investigate interactions between air pollution and material resources or between air pollution and stress on cardiovascular events/indicators. |
| Eligibility Criteria | 1) Published from 2005 to 2016 |
| 2) Written in English | |
| 3) Published in a peer-reviewed journal. | |
| 4) Study of human effects | |
| 5) Explicitly seek to evaluate the impact of interactions between air pollution and social factors on cardiovascular outcomes | |
| 6) Primary research study, excluding abstracts, reviews, meta-analyses and op-eds | |
| 7) Any study design | |
| Information sources | MEDLINE® database, accessed via PubMed® |
| Search strategy | Searches conducted using all combinations of the following three categories of terms connected with the Boolean operator AND: |
| 1) Exposure to specific pollutants as listed below: “fine particles” (which signify PM less than 2.5 μm in aerodynamic diameter or PM2.5), “PM”, “ultrafine particles” (which signify PM less than 0.1 μm in aerodynamic diameter or UFP), “UFP”, “nitrogen dioxide”, “NO2”, “particle number”, “PNC”, and “ozone”. | |
| 2) Interaction with or effect modification by socioeconomic position as given by the listing of the following terms: “socioeconomic status”, “SES”, “socioeconomic position”, “SEP”, “income”, “education”, “material resources”, “chronic stress”, “psychological stress”, “psychosocial stress” | |
| 3) Human health outcomes related to cardiovascular health including the following terms: “cardiovascular”, “mortality”, “inflammation”, “blood pressure” | |
| Data management | Records were imported and organized using Excel and EndNote™ |
| Selection process | 1) Enter search terms into PubMed |
| 2) Import identified citations into Excel | |
| 3) Review papers for inclusion criteria– Level 1 (Screening) | |
| 4) Save studies for inclusion | |
| 5) Review references of selected articles for additional studies – Level 2 (Reference Review) | |
| 6) Review newly identified studies for inclusion | |
| 7) Read all included studies for results– Level 3 (Full Review) | |
| Data Items | Information collected on the following types of data from the articles: publication year, language, study design, participants, air pollutant exposure, modifier/susceptibility, health outcomes |
| Risk of bias | A qualitative assessment of bias was made based on the study design. In the final manuscript we include a statement potential and implications of bias among all papers. |
| Confidence in cumulative evidence | Qualitative assessment was made based on the number of studies, results, study designs and sample size |
We employed a three step system to select articles for inclusion. Level 1 involved review of the abstract, background and methods section of each article to determine inclusion eligibility per our criteria. In Level 2 we reviewed the references of the selected articles to identify additional papers for consideration. Level 3 was a complete review of the selected papers to note additional details and findings. For each article we examined key information such as the indicator(s) of material resources and/or psychosocial stress, pollutants of interest, study population, and findings, including the statistical significance. An insufficient number of articles of similar scope and methods were found to support a meta-analysis. We have included a qualitative assessment of the risk of bias in this review.
Results
Thirty studies fulfilled the eligibility criteria and are included in this review (Fig. 1). A description of the identified articles is presented in Table 2 and a summary of results is given in Table 3. As part of Level 1 screening, we identified 563 articles for which 23 fit the eligibility criteria. In Level 2, 7 articles were added in reference review. The 30 articles were read and included in Level 3 to identify details for the review.
Fig. 1.
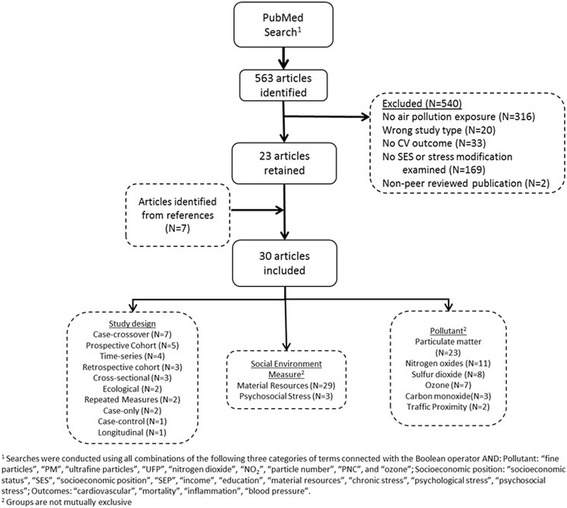
Results of the systematic review
Table 2.
Articles examining interactions between air pollution and socioeconomic position on cardiovascular endpoints identified through systematic review, 2005–2016
| First Author | Design | Population | Air pollutant exposure(s) | Material resource(s) or psychosocial stress measure(s) | Outcome(s) | Result(s) |
|---|---|---|---|---|---|---|
| Barceló, 2009 [49] | Ecological | Residents of Barcelona, Spain | TSP, PM10, NO2, CO, SO2 | Census-tract deprivation index: unemployment, lower educational level, manual workers, temporary workers | Ischemic heart disease mortality | A positive interaction between pollutants and the deprivation index was statistically significant for NO2 and ischemic disease mortality in men. |
| Bravo, 2016 [30] | Case-crossover | Residents of Sau Paulo, Brazil | PM10, NO2, SO2, CO, O3 | Individual education and area-level SEP index | CVD mortality | Significant positive interaction between pollutants and individual education. Significant inverse interaction between pollutants and SEP index. |
| Chi, 2016 [40] | Prospective cohort study | Women’s Health Initiative participants from 40 US sites | PM2.5 | Individual education, family income and occupation. Area-level education, occupation, family income, poverty status, median home value, neighborhood SEP score | CVD event (including MI, stroke, CVD death, cerebrovascular death) | Statistically significant effect modification by neighborhood SEP score. Non-significant higher effect for those with lowest individual income and occupation. |
| Chiusolo, 2011 [44] | Case-crossover | Adults from 10 Italian cities | NO2 | Census block group median income and median SEP indicator | Cause-specific mortality | Neither income nor SEP significantly modified the association between NO2 and mortality. Significant heterogeneity in the stratum-specific estimates among the cities. |
| Dragano, 2009 [22] | Cross-sectional | Adults from 3 German cities | Roadway proximity, traffic volume | Individual education and income; Neighborhood unemployment | Coronary artery calcification | Statistically significant effect modification of main effect by education and unemployment among men and modification by income among women. |
| Finkelstein, 2005 [50] | Prospective cohort | Adults from Hamilton and Burlington, Ontario, Canada | Roadway proximity, TSP and SO2 | Census tract-level deprivation index: income, education and unemployment | Circulatory disease mortality | Non-significant effect modification by neighborhood deprivation index evident in high traffic areas. |
| Haley, 2009 [45] | Case-crossover | Residents of New York State with CVD discharge diagnosis | PM2.5 | Census tract percentage of adults living below poverty level | CVD hospitalizations | No effect modification |
| Henderson, 2011 [46] | Repeated measures | Canadian population in the southeast corner of British Columbia | PM10, smoke | Census tract income quintiles | CVD physician visits and hospitalizations | No main effects of exposures on CVD outcomes (with 2 exceptions). No effect modification |
| Hicken, 2013 [31] | Cross-sectional | Multi-Ethnic Study of Atherosclerosis (MESA) cohort from 6 U.S. cities | PM2.5 | Material Resources: Individual education and income and census tract median household income. Stress: Individual chronic stress, depressive symptoms, trait anger, trait anxiety, lack of emotional support | Blood pressure | Non-significant modification showing higher effects among higher education groups and no effect modification by income. No effect modification by stress indicators. |
| Hicken, 2014 [53] | Repeatedmeasures | Adults in Detroit | PM2.5 | Stress: Individual environmental stress index, life events index | Blood pressure | Higher effect of PM2.5 on blood pressure in people living in Southwest Detroit under high stress. |
| Hicken, 2016 [48] | Cross-sectional | MESA cohort, 6 U.S. cities | PM2.5, NOx | Material Resources: Individual SEP index and census tract racial segregation. Stress: Individual psychosocial adversity | Left ventricular mass index (LVMI), Left ventricular ejection fraction (LVEF) | No effect modification |
| Kan, 2008 [23] | Time series | Residents of Shanghai, China | PM10, SO2, NO2, and O3 | Individual education | CVD mortality | Non-significant interaction shows that residents with lower education had an increased risk of CVD mortality compared to those with higher education for all pollutants except O3. |
| Malig, 2009 [24] | Case-crossover | Residents of 15 California counties | Coarse PM | Individual education | Total and CVD mortality | Significant interaction showing that the effect of coarse PM on CVD mortality was higher in those of lower education. |
| McGuinn, 2016 [42] | Retrospective cohort | CATHGEN Cohort in North Carolina | PM2.5 | Census block group education, urban/rural | CAD index >23 and MI in the previous year | No effect modification |
| Medina-Ramon, 2008 [32] | Case only | Residents of 48 U.S. cities | O3 | Individual education | CVD mortality | No effect modification |
| Ostro, 2008 [26] | Time series | Residents of California | PM2.5 | Individual education | CVD mortality | Statistically significant interaction with lower education increasing the effect of PM2.5 and its components. |
| Ostro, 2014 [25] | Longitudinal cohort | Study of Women’s Health Across the Nation (SWAN) cohort | PM2.5 | Individual education, income, marital status | Continuous CRP; CRP > 3 mg/L; CRP >3 mg/L in high age group | Statistically significant effect modification by income and non-significant effect modification by education. |
| Qiu, 2015 [47] | Case only | Residents of Hong Kong who died of circulatory/respiratory system diseases | PM10, SO2, NO2, O3 | Individual employment status | CVD mortality | Significant interaction in that the unemployed were more susceptible to pollution associated mortality for all pollutants except O3. |
| Raaschou-Nielsen, 2012 [33] | Prospective cohort | Diet, Cancer and Health study participants in Denmark | NO2 | Individual education | Mortality due to ischemic heart disease, cardiac rhythm, heart failure, cerebrovascular and other CVD causes | No effect modification |
| Ren, 2010 [34] | Case-crossover | Population of Eastern Massachusetts | O3 | Individual education and census tract income and poverty | CVD mortality | No effect modification |
| Rosenlund, 2008 [52] | Retrospective cohort | Residents of Rome, Italy | NO2 | Census block group deprivation index | Coronary heart disease mortality and hospitalizations | No effect modification |
| Rosenlund, 2009 [29] | Case-control | Residents of Stockholm County, Sweden | NO2, PM10 | Individual occupation, education, income and marital status | Fatal and non-fatal MI | Higher effects for low white collar workers and higher income, but no statistically significant effect modification |
| Son, 2012 [35] | Case-crossover | Residents of Seoul, Korea | PM, NO2, SO2, CO, O3 | Individual education, marital status and occupation | CVD mortality | Greater effects for lower education as well as manual occupation and unknown occupation. |
| Stafoggia, 2014 [27] | Prospective cohort | European Study of Cohorts for Air Pollution Effects (ESCAPE) multi-city participants | PM2.5 | Individual education and rural/urban residence | Incident stroke | Nonsignificant effect modification by education where the lowest education had highest effect. No effect modification by urban/rural residence. |
| Wilson, 2007 [41] | Ecological | Residents of central, middle and outer Phoenix, Nevada | PM2.5 and PM10 | Zip code-level income and education | CVD mortality | Lower SEP population may be more susceptible to PM associated mortality, but it is difficult to separate spatial effect. |
| Winquist, 2012 [43] | Time series | Hospital patients in greater St. Louis MSA | PM2.5 and O3 | Zip code-level poverty | Emergency department visits and hospital admissions for CVD conditions | Higher effect of poverty on O3-CVD, all outcomes. Also, poverty on O3-CHD, all outcomes. Possible, non-sig differences of poverty on PM2.5-CHF relationship |
| Wong, 2008 [51] | Time series | Residents of Hong Kong, China | PM10, SO2, NO2 | Community planning unit social deprivation index | CVD mortality and hospitalizations | Higher mortality from exposure to SO2 and NO2 for areas with high deprivation index. |
| Zeka, 2006 [28] | Case-crossover | Residents of 20 U.S. cities | PM10 | Individual education | CVD mortality | Statistically significant effect modification by education whereby there was a higher PM10-associated risk comparing lower to higher education. |
| Zhang, 2011 [36] | Retrospective cohort | Residents of selected communities in Shenyang, China | PM10, SO2, NO2 | Individual education, income and marital status | CVD and cerebrovascular mortality | No effect modification |
| Zhou, 2014 [37] | Prospective cohort | Adult men from 25 cities in China | TSP (1990–2000), PM10 (2000–2006) | Individual education | CVD mortality | No effect modification |
Abbreviations: CAD, coronary artery disease; CVD, cardiovascular disease; MI, myocardial infarction; MSA, metropolitan statistical area; SEP, socioeconomic position
Table 3.
Evidence of material resources and psychosocial stress as modifiers* of the association between air pollutants and cardiovascular indicators, 2005–2016
| Potential effect modifiers | Effect modification in the expected direction | Effect modification in the opposite direction | No effect modification | Total discrete articles | |
|---|---|---|---|---|---|
| Material Resources | |||||
| Individual measures | Education | Dragano et al. 2009 [22] | Rosenlund et al. 2009 [29] | Chi et al. 2016 [40] | 18 |
| Kan et al. 2008 [23] | Hicken et al. 2013 [31] | Media-Ramon 2008 [32] | |||
| Malig et al. 2009 [24] | Raaschou-Nielsen et al. 2012 [33] | ||||
| Ostro et al. 2008 [26] | Ren et al. 2010 [34] | ||||
| Ostro et al. 2014 [25] | Rosenlund et al. 2009 [29] | ||||
| Stafoggia et al. 2014 [27] | Zhang et al. 2011 [36] | ||||
| Zeka et al. 2006 [28] | Zhou et al. 2014 [37] | ||||
| Bravo et al. 2016 [30] | |||||
| Son et al. 2012 [35] | |||||
| Income/ Poverty status | Chi et al. 2016 [40] | Rosenlund et al. 2009 [29] | Hicken et al. 2013 [31] | 7 | |
| Dragano et al. 2009 [22] | Ostro et al. 2014 [25] | ||||
| Ostro et al. 2014 [25] | Zhang et al. 2011 [36] | ||||
| Occupation/ Unemployment | Qiu et al. 2015 [47] | Chi et al. 2016 [40] | 4 | ||
| Rosenlund et al. 2009 [29] | |||||
| Son et al. 2012 [35] | |||||
| Deprivation Index | Hicken et al. 2016 [48] | 1 | |||
| Other | Ostro et al. 2014 [25] | Rosenlund et al. 2009 [29] | 5 | ||
| Son et al. 2012 [35] | |||||
| Stafoggia et al. 2014 [27] | |||||
| Zhang et al. 2011 [36] | |||||
| Area measures | Education | Chi et al. 2016 [40] | McGuinn et al. 2016 [42] | 3 | |
| Wilson et al. 2007 [41] | |||||
| Income/ Poverty status | Chi et al. 2016 [40] | Chiusolo et al. 2011 [44] | 8 | ||
| Wilson et al. 2007 [41] | Haley et al. 2009 [45] | ||||
| Winquist et al. 2012 [43] | Henderson et al. 2011 [46] | ||||
| Hicken et al. 2013 [31] | |||||
| Ren et al. 2010 [34] | |||||
| Occupation/ Unemployment | Dragano et al. 2009 [22] | 1 | |||
| Deprivation index | Barcelo et al. 2009 [49] | Bravo et al. 2016 [30] | Chiusolo et al. 2011 [44] | 8 | |
| Chi et al. 2016 [40] | Hicken et al. 2016 [48] | ||||
| Finkelstein et al. 2005 [50] | Rosenlund et al. 2008 [52] | ||||
| Wong et al. 2008 [51] | |||||
| Other | Hicken et al. 2016 [48] | 2 | |||
| McGuinn et al. 2016 [42] | |||||
| Psychosocial Stress | |||||
| Individual measures | chronic stress | Hicken et al. 2013 [31] | 1 | ||
| depressive symptoms | Hicken et al. 2013 [31] | 1 | |||
| trait anger | Hicken et al. 2013 [31] | 1 | |||
| trait anxiety | Hicken et al. 2013 [31] | 1 | |||
| emotional support | Hicken et al. 2013 [31] | 1 | |||
| stress index | Hicken et al. 2014 [53] | Hicken et al. 2016 [48] | 2 | ||
| Total discrete articles | 18 | 4 | 17 |
(*including statistically significant modification and non-significant effect modification)
Multiple study designs were used to examine effect modification (Fig. 2). The largest number were case-crossover studies (N = 7), followed by prospective cohort studies (N = 5) and time-series studies (N = 4). Particulate matter was examined in 23 studies, nitrogen oxides (NOx) or NO2 in 11 studies, SO2 in 8 studies and ozone in 7 studies. The majority of articles (N = 27) evaluated the impact of material resources only, while two evaluated both material resources and psychosocial stress and one examined effect modification by psychosocial stress only. The hypothesis common among the studies was that lower SEP would be associated with an increased effect of air pollution on CVD. Lower SEP would be indicated by reduced access to material resources and higher levels of psychosocial stress. Here, we initially summarize articles including effect modification by material resources (Fig. 2), then focus on articles examining effect modification by psychosocial stress (Fig. 3). We group the findings for each effect modification analysis into one of three categories: statistically significant effect modification (where there is a clear difference in effect sizes that is statistically significant); non-significant effect modification (there is a different in effect sizes between groups, but the differences are not significant); and no effect modification (there is no difference in effect sizes between groups).
Fig. 2.
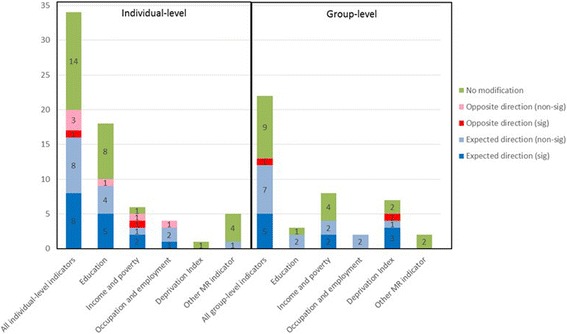
Categorization of material resource indicators among studies (Notes: (1) A single article may examine multiple indicators, (2) Non-sig: not statistically significant effect modification, (3) Sig: statistically significant effect modification)
Fig. 3.
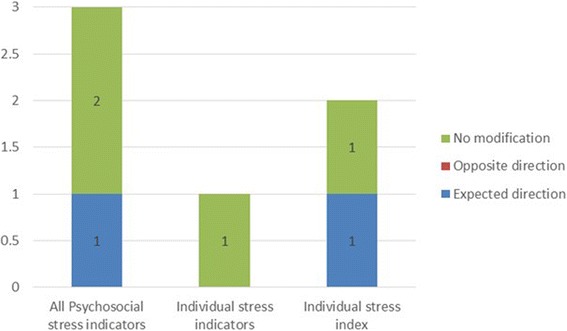
Categorization of psychosocial stress indicators among studies (Note: a single article may examine multiple indicators)
Education
The material resource measure with the largest number of studies was education. A total of 20 studies evaluated effect modification by this measure at the individual (N = 18) or area (N = 3) levels [22–37]. Five of the studies that examined individual education identified statistically significant effect modification while 5 others found non-significant differences in effect estimates by education. In a study of 6 California counties by Ostro et al., an interquartile range increase in PM2.5 was associated with a significant increase in CVD mortality for individuals with lower education (i.e. without a high school (HS) diploma) [26]. Specifically, 0-day and 3-day lags were associated with a 2–6% increased risk of mortality for those without a HS diploma [26]; results for those with a HS diploma were consistent with no effect. Constituents of PM2.5 – including elemental carbon, organic carbon, nitrate and sulfate – also showed similar associations in those with lower education [26].
Zeka et al. conducted a case-crossover study of adults in 20 U.S. cities examining 0- to 3-day lags of PM10 [28]. Individual education was grouped into 3 categories: <8 years (low), 8–12 years (medium) or 12 or more years (high). Effect estimates for heart disease mortality were highest for those within the low education stratum and estimates of myocardial infarction (MI) mortality was highest for those in the medium education stratum. Dragano et al. used individual education to examine, in separate models, effect modification of the relationship between proximity to traffic and coronary artery calcification (CAC) in three German cities [22]. The odds ratio was 1.85 (95% CI: 1.16–2.94) for traffic proximity (distance to a major road ≤100 m) and CAC among individuals with 13 or fewer years of education, compared to 1.39 (95% CI: 0.76–2.55) among individuals with 14 or more years of education. In contrast, no material resources interaction with the high traffic exposure-CAC association among women was observed [22]. The interpretation of individual education and income as measures of access to resources may differ between women and men, in part because of gender roles in society, where, for example, women are often paid less for the working the same job as men who have identical educational attainment [38, 39].
Bravo et al. identified statistically significant effect modification by education on the relationship between PM10 and CVD mortality. Those with no education had a 3.74% (95% CI: 0.04%, 7.3%) higher risk for CVD death [30]. Malig et al. found a positive interaction between short-term exposure to coarse PM and education dichotomized into less than a HS education compared to a HS diploma or more [24]. The increased risk of cardiovascular mortality was 1.3% (95% CI: 0.1%–2.5% for a 2-day lag) for those with lower education compared to those with higher education. These results did not change after adjusting for PM2.5 and restricting to those residing within 10 km of the monitor to reduce exposure misclassification [24]. Investigators conducting a time-series study in Shanghai, China, categorized education into two groups – low, illiterate or primary school and high, middle school or above – and evaluated effect modification of associations between 2-day moving averages of PM10, SO2, NO2, ozone and mortality [23]. Larger, albeit non-statistically significant, CVD mortality estimates were found for short-term exposure to PM10, as well as SO2 and NO2 for those with lower educational attainment compared to those with greater attainment. Associations with ozone were consistent with the null. Ostro et al. estimated a larger effect of PM2.5 on inflammation for women of lower education, compared to women of higher education, but not a statistically significant interaction [25]. Higher effect sizes for participants with no education and ≤12 years education compared to participants with >12 years education were identified by Son et al. [35]. The pollutants of interest included PM10, SO2 and CO and the outcome was CVD mortality.
Chronic exposure to modeled PM2.5 was associated with an increased risk of stroke in cohorts from the European Study of Cohorts for Air Pollution Effects (ESCAPE) study [27]. Individual education was categorized into 3 groups: less than primary school, less than secondary school (or equivalent) and greater than a university degree. The main effect was more pronounced in those of lower education, although the effect was not statistically significant. Rosenlund et al. [29] failed to find effect modification of the effect of NO2 on MI by education dichotomized as < HS diploma compared to ≥ HS diploma. Hicken et al. [31] found that those in the 90th percentile of education in years had higher and statistically significant effects of PM2.5 on systolic blood pressure, pulse pressure and mean arterial pressure. However, being in the 10th percentile showed a lower and non-significant effect. The authors also reported modest correlation between socioeconomic indicators and PM2.5 [31].
Additional articles evaluated interactions between several air pollutants and individual education, but did not find evidence of effect modification or found inconsistent results with CVD mortality [32–34, 36, 37] or first CVD event [40]. Medina-Ramón and Schwartz conducted a case-only study of CVD mortality in 48 U.S. cities with ozone as the exposure of interest [32]. Education, dichotomized into less than HS education or HS graduate or more, did not modify the effects of ozone on CVD mortality. A case-crossover study in eastern Massachusetts by Ren et al. evaluated the impact of ozone exposure on CVD mortality and effect modification by individual education categorized into 4 groups (≤8 years, 9–12 years, 13–16 years and ≥17 years) [34]. Although ozone was significantly associated with excess mortality, no differences were found by individual education. Raaschou-Nielsen et al. did not identify effect modification by education groups (<8 years, 8–10 years and >10 years) on the association between NO2 and CVD mortality [33]. Similar conclusions were made by Zhang using dichotomized education on associations between PM10, SO2, NO2 on CVD mortality and Chou et al. with dichotomized education (<6 years or ≥6 years) on the associations between PM and CVD mortality [36, 37]. Chi et al. divided education into < HS, HS diploma, some college or associate’s degree and bachelor’s degree or higher. No effect modification was found of the PM2.5 and CVD event associations in the cohort of women examined [40].
Only three articles we assessed examined area-level education [40–42]. Chi et al. found higher effect sizes of PM2.5 on CVD events for the lowest 2 quartiles of education (represented by percent of adults over 25 with a HS diploma) compared to the highest 2 quartiles. However, there was no statistically significant interaction [40]. A retrospective study of chronic exposure to PM2.5 and coronary artery disease (CAD) by McGuinn et al. did not find a difference in effect sizes comparing participants from census block groups with higher percentages of residents with higher education versus lower education block groups. However, the effect for individuals with higher education was statistically significant [42]. Wilson et al. evaluated exposure to 0- to 6-day moving averages of PM2.5, PM10 and coarse PM (which the authors abbreviated as PM10–2.5) and CVD mortality, and effect modification by zipcode-level education [41]. Education was estimated by the percent of the population over 25 with less than a HS diploma. Using an ecological design, mortality rates were compared between central, middle, and outer ring zip codes of Phoenix. Their results indicated that populations with lower material resources may be more susceptible to PM-associated mortality, but results varied by exposure period as well as pollutant and were not significant.
Income and poverty status
Income and poverty were also used frequently in studies as markers of material resources, with slightly more studies using area-level metrics (N = 8) compared to individual level (N = 6). We discuss income and poverty in the same section here, but realize that these constructs differ. Dragano et al. evaluated effect modification by individual income as well as education, which we presented previously [22]. A significant interaction was reported only in women, with women in the lowest income stratum having a significantly higher level of CAC associated with pollution exposure compared to women in the highest income stratum. Ostro et al. [25] identified a statistically significant effect of individual income whereby lower-income women had a higher effect of PM2.5 on CRP. Hicken et al. also reported statistically significant effect modification of associations between PM2.5 and blood pressure in MESA participants’ income, although in the opposite direction, showing a greater burden for those of higher income [31]. Chi et al. noted that women earning less than $20,000 per year had a hazard ratio (HR) of 1.3 (95%CI: 1.12, 1.52) relating PM2.5 to CVD events. However, this effect was not significantly different from other groups [40]. Higher effect sizes for higher income participants were also noted by Rosenlund et al.; however, the associations were not statistically significant [29]. The odds ratio (OR) for those of higher income was approximately 3.5 compared to an OR of 2.5 for those of lower income [29]. Another article by Zhang et al. failed to find an interaction between individual income and PM or SO2 or NO2 [36].
Only two of the eight studies examining area-level poverty, income or wealth reported statistically-significant effect modification, while two others noted differences in effect sizes. Chi et al. identified statistically significant modification of the relationship of PM2.5 on CVD events by median home value [40]. Those in the lowest quartile had a HR of 1.4 (95% CI: 1.24, 1.58) compared to 0.87 (95% CI: 0.77, 0.99) in the highest quartile. Percent above poverty was also a statistically significant modifier. Although effect modification was not statistically significant for census tract median income, each decrease in income corresponded to an increase in effect size. [40]. Short-term exposure to PM2.5 and O3 and impacts on emergency department (ED) visits and hospital admissions were evaluated in the St. Louis area by Winquist et al. [43]. Their results show more pronounced effects of O3 on CVD and congestive heart failure (CHF) ED visits and hospitalizations for patients from high poverty areas compared to those from low poverty areas. A case-crossover study conducted in 10 Italian cities by Chiusolo et al. evaluated area-level median income [44]. Analyses of how income modified associations of NO2 with CVD mortality varied greatly between cities and pooled results did not reveal a modifying effect of area-level income. Hospitalizations were the focus of a study of susceptibility to PM2.5 exposure by census-tract level poverty [45]. The investigators, Haley et al., did not find statistically significant effect modification by poverty, but observed a slight increase in effect estimates for risk in low poverty areas.
A case-crossover study in eastern Massachusetts by Ren et al. evaluated the impact of ozone exposure on CVD mortality and modification by census-tract block group household income and poverty [34]. Although ozone was significantly associated with excess mortality, no differences were found by either of the material resources metrics. Wilson et al. evaluated exposure to 0- to 6-day moving averages of PM2.5, PM10 and coarse PM and CVD mortality, and effect modification by zipcode-level poverty level [41]. As with education, their results indicated that populations with lower material resources may be more susceptible to PM-associated mortality, but results varied by exposure period as well as pollutant and were nonsignificant. Hicken et al. and Henderson et al. evaluated effect modification of PM associations by income, neither identifying differences in effect sizes or statistically significant effects [31, 46].
Occupation and unemployment
Five studies evaluated occupation or unemployment, which we grouped together to facilitate discussion. A case-only study by Qiu et al. based in Hong Kong examined all cardiorespiratory deaths over a 10 year period [47]. Occupational status was used to characterize access to material resources, and was dichotomized into “with occupation” or “economically inactive” strata. The authors reported significantly greater effects for “economically inactive” individuals. For this sub-group, a 10 μg/m3increase in pollutant concentration averaged over 0–2 day lags was associated with an increase in cardiorespiratory mortality of 1.7% (95% CI: 1.2%–2.1%) for PM less than 10 μm in aerodynamic diameter (PM10), 2.0% (95% CI: 1.4%–2.5%) for PM2.5, 2.3% (95% CI: 1.7%–2.8%) for NO2, and 6.3% (95% CI: 5.2%–7.5%) for sulfur dioxide (SO2). In contrast, ozone exhibited the opposite effect, showing a decrease in mortality for an increase in ozone [47]. Rosenlund et al. categorized individual occupation into three groups: blue collar worker, lower-level white collar worker and higher-level white collar worker when evaluating the impact of NO2 on fatal MI. In their cohort, effect estimates for lower-level white collar workers were higher than that of higher-white collar workers [29]. Son et al. identified higher effects of most pollutants effects on risk of CVD mortality for manual workers compared to professional workers [35]. The highest effect was a 26.1% increased risk for an IQR increase in NO2 [35]. Chi et al. divided individual occupation into 4 groups: managerial/professional, technical/sales/administrative, service/labor and homemaker only. Effect estimates were slightly higher for the first two groups, but occupation did not significantly modify associations between PM2.5 and CVD events [40]. Census tract-level occupation (percent adults ≥16 years old with managerial/professional/executive occupation) had higher effects for the lowest quartile, but non-significant effect modification [40]. Dragano et al. noted that for men, the OR for CAC associated with traffic proximity (distance to a major road ≤100 m) was 2.12 (95% CI: 1.22–3.88) in areas with high neighborhood unemployment, whereas the corresponding odds ratios in neighborhoods with medium unemployment was 1.59 (95% CI: 0.80–3.16) and for low unemployment, 1.61 (95% CI: 0.83–3.11) [22].
Deprivation and socioeconomic indices
Indices of deprivation or socioeconomic status were estimated at the individual level in one article [48] and by area-level in 7 articles [30, 40, 44, 49–52]. Hicken et al. utilized a deprivation index based on individual education, income, paternal education and wealth, but did not observe interaction of this index with PM2.5 or NOx. Chi et al. built an index of neighborhood SES (NSES) using indicators of education, occupation, family income and poverty. NSES significantly modified associations between PM2.5 and CVD events in the all-female cohort. The HR for the most disadvantaged group was 1.39 (95% CI: 1.21, 1.61), which was higher than the HR of 0.90 (95% CI: 0.72, 1.07) for the least disadvantaged group [40]. A study conducted in Barcelona reported a statistically significant interaction between NO2 and census-level deprivation on ischemic heart disease mortality among men [49]. Deprivation was defined by an index of census-tract level unemployment, percent lower educational level, percent manual workers and percent temporary workers. The authors also identified non-linear correlations between the deprivation index and pollutants, finding higher NO2, CO and SO2 co-located in less deprived areas. Finkelstein et al. conducted a prospective study of circulatory mortality and evaluated effect modification by material resources using a deprivation index built from data on income, education and unemployment [50]. In the Finkelstein study, pollution exposure was estimated by: 1) a pollution index combining the concentrations from modeled SO2 and total suspended particles (TSP); and 2) proximity measures of distance to roadway (50 m and 100 m). Deprivation, pollution index, and the traffic indicator were all significant predictors of CVD mortality. When deprivation was placed in models with pollution metrics, only the traffic indicator remained significant. However, cumulative hazard curves appeared to show a higher hazard for death for traffic-exposed subjects with high neighborhood deprivation compared to those with low neighborhood deprivation. The authors noted a significant trend of higher levels of TSP, SO2, and proximity to roadways in higher deprivation neighborhoods [50]. Wong et al. built a deprivation score for tertiary planning units (TPUs), an administrative unit created for town planning purposes, using six variables including proportion of the population unemployed, a monthly household income below US $250, no schooling, one-person household, never married and subtenancy. The score was divided into tertiles to estimate material resources for the population of Hong Kong [51]. Short-term 0- to 4-day lags of exposure to NO2, SO2, PM10 and ozone were evaluated, and higher effects of NO2 and SO2 on CVD mortality risk were identified for high deprivation TPUs. The greatest effects were a 2.14% (95% CI: 1.07%–3.21%) excess risk of CVD mortality for a 1-day lag in NO2 and a 2.88% (95% CI: 1.35% – 4.43%) excess risk for SO2. Bravo et al. utilized an area-level SES index incorporating population density, median age, family income, and housing characteristics in evaluating interaction with multiple air pollutant measurements [30]. For all pollutants except ozone, a statistically significant higher association with CVD mortality was seen for unknown SES compared to low SES. In addition, risks were generally higher for those with medium or high SES compared to low SES [30]. Group-level SES was not associated with effect modification of NO2exposure and CVD mortality in two other studies by Rosenlund et al. and Chiusolo et al. [44, 52]. Rosenlund’s measure of SES incorporated education, unemployment rate, occupation, family size, home ownership, crowding and immigration, while Chiusolo et al. did not provide a clear definition.
Additional material resource measures
Other measures of material resources utilized in studies included marital status, urban/rural residency and racial segregation. Individual marital status was evaluated by the greatest number (N = 4) and none of the studies identified effect modification between any pollutant and other CVD mortality or biomarkers of CVD risk [25, 29, 35, 36]. Two studies evaluated urban/rural residency [27, 42]. Participants living in rural areas had a higher increase in the incidence of stroke associated with a 5 μg/m3 increase in PM2.5 compared to their urban counterparts across all sites in the ESCAPE study [27]. Although the effect size was higher it was not statistically significant. However, residence in a rural area compared to an urban area at the census-tract level was not associated with any difference in the association between PM2.5 and MI or CAD index [42]. Hicken et al. evaluated census tract level segregation and did not identify interaction with the effect of PM2.5 on left ventricular mass index (LVMI) or left ventricular ejection fraction (LVEF) [48].
Psychosocial stress
Three articles by Hicken et al. [31, 48, 53] evaluated susceptibility by psychosocial stress and material resources (Figure 3). The first examined blood pressure in the Multi-Ethnic Study of Atherosclerosis (MESA) cohort [31]. The exposure of interest was PM2.5 and psychosocial stress was evaluated by measures of chronic stress, depressive symptoms, trait anger, trait anxiety and lack of emotional support. The investigators reported no effect modification by psychosocial stress. The authors also reported modest correlation between psychosocial adversity and PM2.5 [31]. The second article found an effect of stress in one of three Detroit communities. The community characterized by high stress had a larger association between PM2.5 and blood pressure compared to the other two communities. The association corresponded to a 9.05 mmHg (95%CI: 3.29–14.81) increase in systolic blood pressure for a 10 μg/m3 increase in PM2.5 [53]. Psychosocial stress was estimated by a sum of high scores on six different scales. Education and poverty-income ratio were both estimated at the individual level. The authors did not find high correlation between material resources and PM2.5 [53]. A composite index of psychosocial adversity (comprised of 5 measures including depressive symptoms, trait anxiety, trait anger, chronic stress and lack of emotional support) did not modify the effect of PM2.5 on LVMI or LVEF in the MESA study [48].
Discussion
As highlighted in the current review, considerable and growing interest continues in examining whether socioeconomic factors confer cardiovascular susceptibility to air pollution exposures. Although the literature in this area is still relatively small, gaps and inconsistencies can be identified to inform future research studies. Broadly, in our review, several articles provided evidence of effect modification by individual education, income, occupation and urbanicity. In addition, area-level measures of poverty, unemployment and deprivation were also shown to be effect modifiers. Support for psychosocial stress as an effect modifier was weak; however, only three articles tested this hypothesis. Recommendations can be made to address knowledge gaps and enable more definitive conclusions regarding socioeconomic factors as modifiers for air pollution-related cardiovascular endpoints.
Selection of measures of SEP
We reviewed articles that employed a variety of individual and area-based measures, or indices, of material resources such as education, income, poverty, unemployment and urban/rural residence. Psychosocial measures included chronic stress, depression, anxiety and emotional support. The choice of measures representing SEP depends on the hypothesis of how SEP is related to health as well as the availability of the measure in the research dataset [54]. Each measure has an underlying construct and potential mechanism of effect that should be stated explicitly. Notably, individual and area-level SEP may differ, conceptually, in reflecting mechanisms within which effect modification occurs, although both variables capture elements of social condition.
While the majority of studies identified effect modification by material resources in the expected direction, other findings were opposite of the hypothesized direction. This could be a function of the measures themselves and mechanisms by which they have their effect. Observation of statistically significant effect modification may signify that the indicator is a good measure of access to material resources important to health. However, alternative explanations include: less error in a particular measure (i.e., reduced Type I error) thereby making a significant result more likely if an association exists; or, the measure is highly correlated with the true causal modifier and is thereby confounded. An index may better capture area-level access to material resources by incorporating multiple aspects of this construct into one measure. However, an index may also increase error if its components are measured with error. Area-level factors can also affect individual conditions; for example, income inequality can alter the effect of individual income on health outcomes [55]. Most studies do not examine both levels jointly, which precludes assessment of these relationships. However, multilevel studies have the ability to simultaneously evaluate how individual and area-level factors impact individual health status.
Recommendation
Clear, standardized definitions of metrics facilitate comparison across and interpretation of studies. However, using identical measures across studies also has limitations, given the specific context of each study. Measures that capture SEP well for one population may not do so for another, but studies conducted in similar populations could use similar measures. Also, in addition to individual or area-level measures of SEP, proximal and distal factors that accumulate across the life course could modify air pollution associations with health, and should be evaluated to the extent possible [16, 56]. Including metrics at multiple levels in the same model is now possible using new analytical techniques that can help uncover the variance explained by multiple predictors.
Air pollutants of concern
Our review sought to include studies of multiple air pollutants. Results according to pollutant are given in Fig. 4. Only one article examining ozone as the pollutant of interest in our review identified effect modification of associations [43], despite the fact that ozone was a significant predictor of CVD outcomes in some of these articles [32, 34, 35]. By contrast, several articles found that material resources modified associations of CVD health outcomes with other pollutants, including NO2 and PM. A prior review reported that SEP modified the association between ozone and total mortality, respiratory and respiratory hospitalizations [17]. The association between ozone exposures and cardiovascular health may not be as strong as for respiratory outcomes. A recent experimental study did not find associations between low-level ozone exposure and cardiovascular function or systemic inflammation [57].
Fig. 4.
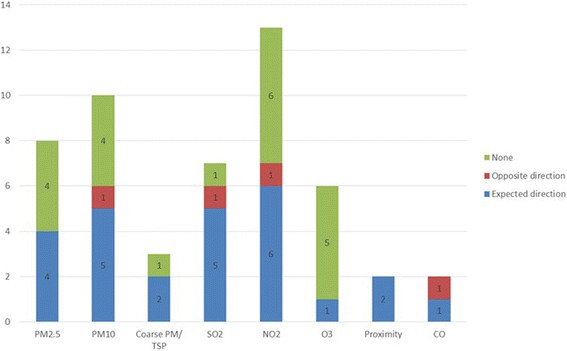
Differences in effect estimates according to pollutant in the reviewed studies (for articles examining material resources only)
Recommendation
Because many air pollutants co-vary, future studies may more fully test for effect modification using multi-pollutant models, pollutant indices or approaches for studying mixtures.
Correlations between air pollution and SEP
A critical barrier to understanding CVD disparities is the interrelated nature of physical and socioeconomic conditions [8]. Correlation between air pollutants and SEP are not typically reported in studies. In this review, only a handful of the identified articles explicitly evaluated spatial correlation between these covariates [22, 27, 31, 49, 50, 53]. Staffogia et al. examined spatial autocorrelation using a “frailty” model, and did not identify any differences in effects [27]. In two articles by Hicken et al., the authors evaluated correlation between PM2.5 and both material resource and psychosocial stress measures using variance inflation factors (VIF). The VIF provides an estimate of multicollinearity between variables in an ordinary least squares regression [58]. The average VIF for the MESA study variables was 4.49 and the maximum VIF factor was 3.42 in the study based in Detroit [31, 53]. A weakness of the VIF is that there is no clear boundary to designate multicollinearity [58]. The threshold to distinguish multicollinearity was 10 in the MESA article and 5 in the Detroit article. For the MESA study, the average VIF comparing SEP and PM2.5 was 4.49 for all cities, suggesting that one or more city-specific VIFs may be above the VIF threshold of 5. Thus, depending on the threshold, multicollinearity may be a source of concern in these articles. Barceló et al. identified moderate correlations between deprivation and SO2 (r = −0.347), NO2 (r = −0.329), CO (r = −0.440) in Barcelona [49]. Contrary to expectation, low deprivation areas were those with the highest reported pollutant concentrations. Finkelstein reported higher levels of TSP and SO2 and closer proximity to roadway in high deprivation neighborhoods, with a significant trend in Hamilton, Ontario [50]. Dragano et al. tabulated traffic pollutant exposure and material resource measures. For males, the highest exposure was shown for lower levels of each material resource metric (i.e. neighborhood unemployment, individual income and individual education) [22]. The trend was the same for individual income and education in women; however, low neighborhood unemployment correlated with high exposure (i.e. distance to roadway ≤100 m or ≤50 m). All articles found some measure of correlation between material resources and pollution, and a conclusion of significant correlation was stated for some articles [49, 50]. In some cases, higher pollutant concentrations were linked to neighborhoods or individuals of higher material resources [22, 49], while the opposite was true for other areas [22, 59]. This may be a function of particular spatial characteristics of residential areas, transportation networks and industrial areas in different urban regions. The picture was even more complex when male and female participants were evaluated separately [22].
Recommendation
Greater attention should be paid to examining correlation due to the possibility for confounding and bias, the impact on interpretation of results, as well as to aid understanding of underlying fundamental causes [18].
Diversity of populations
Another key aspect to explore in depth is the difference within and between various racial/ethnic populations. The largest number of articles, 16, were done in North America; 7 in Europe, 6 in Asia and 1 in South America. Some of the sample populations were racially/ethnically diverse while others were less so. Measures of SEP are known to reflect different access to resources according to racial/ethnic group. For example, the benefits associated with a specific level of education or income have been found to be lower for blacks compared to whites, and perhaps other groups [6]. Although we did not do so, other articles utilize race/ethnicity as an indicator of SEP [24, 25, 48].
Recommendation
To better understand this phenomenon, studies should be done in diverse populations with sufficient numbers of racial/ethnic minorities to evaluate differences.
The scope of our review is narrowly defined to identify papers with a specific focus on examining modification and provide a substantive discussion of effect modification, underlying constructs, measurement tools and comparison with other studies. The review methodology followed the PRISMA-P checklist and we are confident that we have captured relevant papers with a primary aim of exploring effect modification by material resources or stress [21]. We understand that the narrow scope of our review may exclude some articles that examine effect modification as a secondary aim. For example, Miller et al. identified non-significant trends in the Women’s Health Initiative whereby estimated effects of PM2.5 on cardiovascular events increased as education and income decreased [60]. Atkinson et al. noted the opposite effect for small area deprivation which showed non-significant increases in effect between air pollution (PM10, SO2, NO2) and cardiovascular disease based on higher affluence [61]. There was no discernible effect modification by deprivation when ozone was the exposure [61]. Also, several other articles reporting on large studies such as ESCAPE, NIH-AARP and DUELS did not identify effect modification by indicators including education, urban/rural residence, or SEP index [62–66]. Even so, we feel that our narrow scope provides a balanced view of the evidence by including articles with a specific focus on investigating modification and reporting results, whether significant or not. Other limitations of our systematic review include our focus on recent articles. Articles published prior to our cutoff date may have been informative to our assessment. However, prior reviews have included many of those studies. In addition, due to the variety of modifiers utilized by the studies, an insufficient number used similar measures to conduct a meta-analysis. In addition, we did not assess publication bias in this review. Therefore, evidence of effect modification may be more nuanced than what is presented here. Lastly, our review is not confined to studies in the U.S., leading to a broader assessment of evidence from populations across the globe.
Conclusion
This systematic review is the first of its kind to summarize the literature related to air pollution-induced CVD and susceptibility by material resources and psychosocial stress. Interest in understanding these types of interactions is rapidly growing. Broadly, our review identified articles showing that associations between air pollutants including PM and select gases and CVD endpoints were modified by multiple, separate indicators of material resources. Support for CVD susceptibility to air pollution by psychosocial stress was weak, perhaps due to the small number of articles addressing this hypothesis.
Certain considerations can be made to ensure a more focused approach to better assess effect modification both within and between studies. Further, studies with new approaches are needed to develop a more robust and comparable set of evidence regarding how air pollution and SEP may together influence cardiovascular health. Specifically, taking action to establish standardized metrics, incorporate diverse populations and utilize multi-pollutant models or air pollution indices is advisable to strengthen future study designs. In addition, information regarding correlation between air pollutant and socioeconomic indicators is necessary to reduce potential bias. It is also advisable to examine both individual and area-level measures of material resources and psychosocial stress so that independent and joint effects can be evaluated. Future studies can make greater gains in testing associations and mechanisms by enacting some of the changes recommended here.
Acknowledgements
Not applicable.
Funding
Funding for this work was provided by the JPB Environmental Health Fellows Program.
Availability of data and materials
Data sharing not applicable to this article as no datasets were generated or analyzed during the current study.
Authors’ contributions
CHF designed and carried out the systematic review and was the principal writer on the manuscript. KRF assisted in identifying studies for the systematic review and reviewed the manuscript. JAS and MSO helped conceptualize the paper and provided substantive comments and edits on the manuscript. All authors read and approved the final manuscript.
Competing interests
The authors declare that they have no competing interests.
Consent for publication
Not applicable.
Ethics approval and consent to participate
Not applicable.
Publisher’s Note
Springer Nature remains neutral with regard to jurisdictional claims in published maps and institutional affiliations.
Abbreviations
- CAC
Coronary artery calcification
- CAD
Coronary artery disease
- CI
Confidence interval
- CO
Carbon monoxide
- CVD
Cardiovascular disease
- HR
Hazard ratio
- HS
High school
- MI
Myocardial infarction
- NO2
Nitrogen dioxide
- O3
Ozone
- OR
Odds ratio
- PM10
Particulate matter less than 10 μm in aerodynamic diameter
- PM2.5
Particulate matter less than 2.5 μm in aerodynamic diameter
- SEP
Socioeconomic position
- SES
Socioeconomic status
- SO2
Sulfur dioxide
- TPU
Tertiary planning unit
- TSP
Total suspended particles
- VIF
Variance inflation factor
Footnotes
This research was supported by the JPB Environmental Health Fellowship
Contributor Information
Christina H. Fuller, Email: cfuller@gsu.edu
Karla R. Feeser, Email: karlafeeser@gmail.com
Jeremy A. Sarnat, Email: jsarnat@emory.edu
Marie S. O’Neill, Email: marieo@umich.edu
References
- 1.Murphy SL, Xu J, Kochanek KD. Deaths: final data for 2010. Natl Vital Stat Rep. 2013;61(4):1–117. [PubMed] [Google Scholar]
- 2.Brook RD, Franklin B, Cascio W, Hong Y, Howard G, Lipsett M, et al. Air pollution and cardiovascular disease: a statement for healthcare professionals from the Expert Panel on Population and Prevention Science of the American Heart Association. Circulation. 2004;109(21):2655–71. [DOI] [PubMed]
- 3.Lim SS, Vos T, Flaxman AD, Danaei G, Shibuya K, Adair-Rohani H, et al. A comparative risk assessment of burden of disease and injury attributable to 67 risk factors and risk factor clusters in 21 regions, 1990-2010: a systematic analysis for the Global Burden of Disease Study 2010. Lancet. 2012;380(9859):2224–60. [DOI] [PMC free article] [PubMed]
- 4.Brook RD, Rajagopalan S, Pope CA 3rd, Brook JR, Bhatnagar A, Diez-Roux AV, et al. Particulate matter air pollution and cardiovascular disease: An update to the scientific statement from the American Heart Association. Circulation. 2010;121(21):2331–78. [DOI] [PubMed]
- 5.Mendelson T, Thurston RC, Kubzansky LD. Affective and cardiovascular effects of experimentally-induced social status. Health Psychol. 2008;27(4):482–489. doi: 10.1037/0278-6133.27.4.482. [DOI] [PubMed] [Google Scholar]
- 6.Krieger N, Williams DR, Moss NE. Measuring social class in US public health research: concepts, methodologies, and guidelines. Annu Rev Public Health. 1997;18:341–378. doi: 10.1146/annurev.publhealth.18.1.341. [DOI] [PubMed] [Google Scholar]
- 7.Berkman LF, Kawachi I. Social Epidemiology. USA: Oxford University Press; 2000. [Google Scholar]
- 8.Clougherty JE, Shmool JLC, Kubzansky LD. The Role of Non-Chemical Stressors in Mediating Socioeconomic Susceptibility to Environmental Chemicals. Curr Environl Health Rep. 2014;1(4):302–313. doi: 10.1007/s40572-014-0031-y. [DOI] [Google Scholar]
- 9.Cohen S, Janicki-Deverts D, Miller GE. Psychological stress and disease. JAMA. 2007;298(14):1685–1687. doi: 10.1001/jama.298.14.1685. [DOI] [PubMed] [Google Scholar]
- 10.Brunner E. Biology and health inequality. PLoS Biol. 2007;5(11):e267. doi: 10.1371/journal.pbio.0050267. [DOI] [PMC free article] [PubMed] [Google Scholar]
- 11.Cohen S, Kamarck T, Mermelstein R. A global measure of perceived stress. J Health Soc Behav. 1983;24(4):385–396. doi: 10.2307/2136404. [DOI] [PubMed] [Google Scholar]
- 12.McEwen BS. Stressed or stressed out: What is the difference? J Psychiatry Neurosci. 2005;30(5):315–318. [PMC free article] [PubMed] [Google Scholar]
- 13.McEwen BS. Stress, adaptation, and disease. Allostasis and allostatic load. Ann N Y Acad Sci. 1998;840:33–44. doi: 10.1111/j.1749-6632.1998.tb09546.x. [DOI] [PubMed] [Google Scholar]
- 14.Sacks JD, Stanek LW, Luben TJ, Johns DO, Buckley BJ, Brown JS, et al. Particulate matter-induced health effects: who is susceptible? Environ Health Perspect. 2011;119(4):446–54. [DOI] [PMC free article] [PubMed]
- 15.Vinikoor-Imler LC, Owens EO, Nichols JL, Ross M, Brown JS, Sacks JD. Evaluating potential response-modifying factors for associations between ozone and health outcomes: a weight-of-evidence approach. Environ Health Perspect. 2014;122(11):1166–1176. doi: 10.1289/ehp.1307541. [DOI] [PMC free article] [PubMed] [Google Scholar]
- 16.Lewis AS, Sax SN, Wason SC, Campleman SL. Non-chemical stressors and cumulative risk assessment: an overview of current initiatives and potential air pollutant interactions. Int J Environ Res Public Health. 2011;8(6):2020–2073. doi: 10.3390/ijerph8062020. [DOI] [PMC free article] [PubMed] [Google Scholar]
- 17.Bell ML, Zanobetti A, Dominici F. Who is more affected by ozone pollution? A systematic review and meta-analysis. Am J Epidemiol. 2014;180(1):15–28. doi: 10.1093/aje/kwu115. [DOI] [PMC free article] [PubMed] [Google Scholar]
- 18.Clougherty JE, Kubzansky LD. A framework for examining social stress and susceptibility to air pollution in respiratory health. Environ Health Perspect. 2009;117(9):1351–1358. doi: 10.1289/ehp.0900612. [DOI] [PMC free article] [PubMed] [Google Scholar]
- 19.Laurent O, Bard D, Filleul L, Segala C. REVIEW: Effect of socioeconomic status on the relationship between atmospheric pollution and mortality. J Epidemiol Community Health. 2007;61(8):665–675. doi: 10.1136/jech.2006.053611. [DOI] [PMC free article] [PubMed] [Google Scholar]
- 20.Health Effects Institute . Reanalysis of the Harvard Six Cities Study and the American Cancer Society Study of Particulate Air Pollution and Mortality: A Special Report of the Institute's Particle Epidemiology Reanalysis Project. Cambridge, MA: Health Effect Institute; 2000. [Google Scholar]
- 21.Moher D, Shamseer L, Clarke M, Ghersi D, Liberati A, Petticrew M, et al., Group P-P. Preferred reporting items for systematic review and meta-analysis protocols (PRISMA-P) 2015 statement. Syst Rev. 2015;4:1. [DOI] [PMC free article] [PubMed]
- 22.Dragano N, Hoffmann B, Moebus S, Mohlenkamp S, Stang A, Verde PE, et al., Heinz Nixdorf Recall Study Investigative G. Traffic exposure and subclinical cardiovascular disease: is the association modified by socioeconomic characteristics of individuals and neighbourhoods? Results from a multilevel study in an urban region. Occup Environ Med. 2009;66(9):628–35. [DOI] [PubMed]
- 23.Kan H, London SJ, Chen G, Zhang Y, Song G, Zhao N, et al. Season, sex, age, and education as modifiers of the effects of outdoor air pollution on daily mortality in Shanghai, China: The Public Health and Air Pollution in Asia (PAPA) Study. Environ Health Perspect. 2008;116(9):1183–8. [DOI] [PMC free article] [PubMed]
- 24.Malig BJ, Ostro BD. Coarse particles and mortality: evidence from a multi-city study in California. Occup Environ Med. 2009;66(12):832–839. doi: 10.1136/oem.2008.045393. [DOI] [PubMed] [Google Scholar]
- 25.Ostro B, Malig B, Broadwin R, Basu R, Gold EB, Bromberger JT, et al. Chronic PM2.5 exposure and inflammation: determining sensitive subgroups in mid-life women. Environ Res. 2014;132:168–75. [DOI] [PMC free article] [PubMed]
- 26.Ostro BD, Feng WY, Broadwin R, Malig BJ, Green RS, Lipsett MJ. The impact of components of fine particulate matter on cardiovascular mortality in susceptible subpopulations. Occup Environ Med. 2008;65(11):750–756. doi: 10.1136/oem.2007.036673. [DOI] [PubMed] [Google Scholar]
- 27.Stafoggia M, Cesaroni G, Peters A, Andersen ZJ, Badaloni C, Beelen R, et al. Long-term exposure to ambient air pollution and incidence of cerebrovascular events: results from 11 European cohorts within the ESCAPE project. Environ Health Perspect. 2014;122(9):919–25. [DOI] [PMC free article] [PubMed]
- 28.Zeka A, Zanobetti A, Schwartz J. Individual-level modifiers of the effects of particulate matter on daily mortality. Am J Epidemiol. 2006;163(9):849–859. doi: 10.1093/aje/kwj116. [DOI] [PubMed] [Google Scholar]
- 29.Rosenlund M, Bellander T, Nordquist T, Alfredsson L. Traffic-generated air pollution and myocardial infarction. Epidemiology. 2009;20(2):265–271. doi: 10.1097/EDE.0b013e318190ea68. [DOI] [PubMed] [Google Scholar]
- 30.Bravo MA, Son J, de Freitas CU, Gouveia N, Bell ML. Air pollution and mortality in Sao Paulo, Brazil: Effects of multiple pollutants and analysis of susceptible populations. J Expo Sci Environ Epidemiol. 2016;26(2):150–161. doi: 10.1038/jes.2014.90. [DOI] [PubMed] [Google Scholar]
- 31.Hicken MT, Adar SD, Diez Roux AV, O'Neill MS, Magzamen S, Auchincloss AH, et al. Do psychosocial stress and social disadvantage modify the association between air pollution and blood pressure?: the multi-ethnic study of atherosclerosis. Am J Epidemiol. 2013;178(10):1550–62. [DOI] [PMC free article] [PubMed]
- 32.Medina-Ramon M, Schwartz J. Who is more vulnerable to die from ozone air pollution? Epidemiology. 2008;19(5):672–679. doi: 10.1097/EDE.0b013e3181773476. [DOI] [PubMed] [Google Scholar]
- 33.Raaschou-Nielsen O, Andersen ZJ, Jensen SS, Ketzel M, Sorensen M, Hansen J, et al. Traffic air pollution and mortality from cardiovascular disease and all causes: a Danish cohort study. Environ Health. 2012;11:60. [DOI] [PMC free article] [PubMed]
- 34.Ren C, Melly S, Schwartz J. Modifiers of short-term effects of ozone on mortality in eastern Massachusetts--a case-crossover analysis at individual level. Environ Health. 2010;9:3. doi: 10.1186/1476-069X-9-3. [DOI] [PMC free article] [PubMed] [Google Scholar]
- 35.Son JY, Lee JT, Kim H, Yi O, Bell ML. Susceptibility to air pollution effects on mortality in Seoul, Korea: a case-crossover analysis of individual-level effect modifiers. J Expo Sci Environ Epidemiol. 2012;22(3):227–234. doi: 10.1038/jes.2012.6. [DOI] [PMC free article] [PubMed] [Google Scholar]
- 36.Zhang P, Dong G, Sun B, Zhang L, Chen X, Ma N, et al. Long-term exposure to ambient air pollution and mortality due to cardiovascular disease and cerebrovascular disease in Shenyang, China. PLoS One. 2011;6(6):e20827. [DOI] [PMC free article] [PubMed]
- 37.Zhou M, Liu Y, Wang L, Kuang X, Xu X, Kan H. Particulate air pollution and mortality in a cohort of Chinese men. Environ Pollut. 2014;186:1–6. doi: 10.1016/j.envpol.2013.11.010. [DOI] [PubMed] [Google Scholar]
- 38.Ahnquist J, Fredlund P, Wamala SP. Is cumulative exposure to economic hardships more hazardous to women's health than men's? A 16-year follow-up study of the Swedish Survey of Living Conditions. J Epidemiol Community Health. 2007;61(4):331–336. doi: 10.1136/jech.2006.049395. [DOI] [PMC free article] [PubMed] [Google Scholar]
- 39.Clougherty JE. A growing role for gender analysis in air pollution epidemiology. Environ Health Perspect. 2010;118(2):167–176. doi: 10.1289/ehp.0900994. [DOI] [PMC free article] [PubMed] [Google Scholar]
- 40.Chi GC, Hajat A, Bird CE, Cullen MR, Griffin BA, Miller KA, et al. Individual and Neighborhood Socioeconomic Status and the Association between Air Pollution and Cardiovascular Disease. Environ Health Perspect. 2016; [DOI] [PMC free article] [PubMed]
- 41.Wilson WE, Mar TF, Koenig JQ. Influence of exposure error and effect modification by socioeconomic status on the association of acute cardiovascular mortality with particulate matter in Phoenix. J Expo Sci Environ Epidemiol. 2007;17(Suppl 2):S11–S19. doi: 10.1038/sj.jes.7500620. [DOI] [PubMed] [Google Scholar]
- 42.McGuinn LA, Ward-Caviness CK, Neas LM, Schneider A, Diaz-Sanchez D, Cascio WE, et al. Association between satellite-based estimates of long-term PM2.5 exposure and coronary artery disease. Environ Res. 2016;145:9–17. [DOI] [PMC free article] [PubMed]
- 43.Winquist A, Klein M, Tolbert P, Flanders WD, Hess J, Sarnat SE. Comparison of emergency department and hospital admissions data for air pollution time-series studies. Environ Health. 2012;11:70. doi: 10.1186/1476-069X-11-70. [DOI] [PMC free article] [PubMed] [Google Scholar]
- 44.Chiusolo M, Cadum E, Stafoggia M, Galassi C, Berti G, Faustini A, et al. Short-Term Effects of Nitrogen Dioxide on Mortality and Susceptibility Factors in 10 Italian Cities: The EpiAir Study. Environ Health Perspect. 2011;119(9):1233–8. [DOI] [PMC free article] [PubMed]
- 45.Haley VB, Talbot TO. Felton HD. Surveillance of the short-term impact of fine particle air pollution on cardiovascular disease hospitalizations in New York State. Environ Health. 2009;8:42. doi: 10.1186/1476-069X-8-42. [DOI] [PMC free article] [PubMed] [Google Scholar]
- 46.Henderson SB, Brauer M, Macnab YC, Kennedy SM. Three measures of forest fire smoke exposure and their associations with respiratory and cardiovascular health outcomes in a population-based cohort. Environ Health Perspect. 2011;119(9):1266–1271. doi: 10.1289/ehp.1002288. [DOI] [PMC free article] [PubMed] [Google Scholar]
- 47.Qiu H, Tian L, Ho KF, Pun VC, Wang X, Yu IT. Air pollution and mortality: effect modification by personal characteristics and specific cause of death in a case-only study. Environ Pollut. 2015;199:192–197. doi: 10.1016/j.envpol.2015.02.002. [DOI] [PubMed] [Google Scholar]
- 48.Hicken MT, Adar SD, Hajat A, Kershaw KN, Do DP, Barr RG, et al. Air Pollution, Cardiovascular Outcomes, and Social Disadvantage: The Multi-ethnic Study of Atherosclerosis. Epidemiology. 2016;27(1):42–50. [DOI] [PMC free article] [PubMed]
- 49.Barcelo MA, Saez M, Saurina C. Spatial variability in mortality inequalities, socioeconomic deprivation, and air pollution in small areas of the Barcelona Metropolitan Region, Spain. Sci Total Environ. 2009;407(21):5501–5523. doi: 10.1016/j.scitotenv.2009.07.028. [DOI] [PubMed] [Google Scholar]
- 50.Finkelstein MM, Jerrett M, Sears MR. Environmental inequality and circulatory disease mortality gradients. J Epidemiol Community Health. 2005;59(6):481–487. doi: 10.1136/jech.2004.026203. [DOI] [PMC free article] [PubMed] [Google Scholar]
- 51.Wong CM, Ou CQ, Chan KP, Chau YK, Thach TQ, Yang L, et al. The effects of air pollution on mortality in socially deprived urban areas in Hong Kong, China. Environ Health Perspect. 2008;116(9):1189–94. [DOI] [PMC free article] [PubMed]
- 52.Rosenlund M, Picciotto S, Forastiere F, Stafoggia M, Perucci CA. Traffic-related air pollution in relation to incidence and prognosis of coronary heart disease. Epidemiology. 2008;19(1):121–128. doi: 10.1097/EDE.0b013e31815c1921. [DOI] [PubMed] [Google Scholar]
- 53.Hicken MT, Dvonch JT, Schulz AJ, Mentz G, Max P. Fine particulate matter air pollution and blood pressure: the modifying role of psychosocial stress. Environ Res. 2014;133:195–203. doi: 10.1016/j.envres.2014.06.001. [DOI] [PMC free article] [PubMed] [Google Scholar]
- 54.Lynch J, Kaplan G. Socioeconomic Position. In: Berkman LF, Kawachi I, editors. Social Epidemiology. New York: Oxford University Press; 2000. pp. 13–35. [Google Scholar]
- 55.Subramanian SV, Kawachi I. Income inequality and health: what have we learned so far? Epidemiol Rev. 2004;26:78–91. doi: 10.1093/epirev/mxh003. [DOI] [PubMed] [Google Scholar]
- 56.Miller GW, Jones DP. The nature of nurture: refining the definition of the exposome. Toxicol Sci. 2014;137(1):1–2. doi: 10.1093/toxsci/kft251. [DOI] [PMC free article] [PubMed] [Google Scholar]
- 57.Balmes J. Multicenter Ozone Study in Elderly Subjects (MOSES). In: Health Effects Institute 2016 Annual Conference. Denver: Health Effects Institute; 2016.
- 58.Belsey D, Kuh E, Welsch R. Regression diagnostics: Identifying influential data and sources of collinearity (vol. 571). In. Hoboken: Wiley; 2005.
- 59.Finkelstein MM, Jerrett M, Sears MR. Traffic air pollution and mortality rate advancement periods. Am J Epidemiol. 2004;160(2):173–177. doi: 10.1093/aje/kwh181. [DOI] [PubMed] [Google Scholar]
- 60.Miller KA, Siscovick DS, Sheppard L, Shepherd K, Sullivan JH, Anderson GL, et al. Long-term exposure to air pollution and incidence of cardiovascular events in women. N Engl J Med. 2007;356(5):447–58. [DOI] [PubMed]
- 61.Atkinson RW, Carey IM, Kent AJ, van Staa TP, Anderson HR, Cook DG. Long-term exposure to outdoor air pollution and incidence of cardiovascular diseases. Epidemiology. 2013;24(1):44–53. doi: 10.1097/EDE.0b013e318276ccb8. [DOI] [PubMed] [Google Scholar]
- 62.Beelen R, Stafoggia M, Raaschou-Nielsen O, Andersen ZJ, Xun WW, Katsouyanni K, et al. Long-term exposure to air pollution and cardiovascular mortality: an analysis of 22 European cohorts. Epidemiology. 2014;25(3):368–78. [DOI] [PubMed]
- 63.Cesaroni G, Forastiere F, Stafoggia M, Andersen ZJ, Badaloni C, Beelen R, et al. Long term exposure to ambient air pollution and incidence of acute coronary events: prospective cohort study and meta-analysis in 11 European cohorts from the ESCAPE Project. BMJ. 2014;348:f7412. [DOI] [PMC free article] [PubMed]
- 64.Cesaroni G, Badaloni C, Gariazzo C, Stafoggia M, Sozzi R, Davoli M, et al. Long-term exposure to urban air pollution and mortality in a cohort of more than a million adults in Rome. Environ Health Perspect. 2013;121(3):324–31. [DOI] [PMC free article] [PubMed]
- 65.Thurston GD, Ahn J, Cromar KR, Shao Y, Reynolds HR, Jerrett M, et al. Ambient Particulate Matter Air Pollution Exposure and Mortality in the NIH-AARP Diet and Health Cohort. Environ Health Perspect. 2016;124(4):484–90. [DOI] [PMC free article] [PubMed]
- 66.Fischer PH, Marra M, Ameling CB, Hoek G, Beelen R, de Hoogh K, et al. Air Pollution and Mortality in Seven Million Adults: The Dutch Environmental Longitudinal Study (DUELS). Environ Health Perspect. 2015;123(7):697–704. [DOI] [PMC free article] [PubMed]
Associated Data
This section collects any data citations, data availability statements, or supplementary materials included in this article.
Data Availability Statement
Data sharing not applicable to this article as no datasets were generated or analyzed during the current study.