

Abstract
Food restriction (FR) and obesogenic (OB) diets are known to alter brain dopamine transmission and exert opposite modulatory effects on behavioral responsiveness to psychostimulant drugs of abuse. Mechanisms underlying these diet effects are not fully understood. In the present study we examined diet effects on expression and function of the dopamine transporter (DAT) in caudate-putamen (CPu), nucleus accumbens (NAc), and midbrain regions. DA uptake by CPu, NAc or midbrain synapto(neuro)somes was measured in vitro with rotating disk electrode voltammetry or with [3H]DA uptake and was found to correlate with DA transporter (DAT) surface expression, assessed by maximal [3H]CFT binding and surface biotinylation assays. FR and OB diets were both found to decrease DAT activity in CPu with a corresponding decrease in surface expression but had no effects in the NAc and midbrain. Diet treatments also affected sensitivity to insulin-induced enhancement of DA uptake, with FR producing an increase in CPu and NAc, likely mediated by an observed increase in insulin receptor (InsR) expression, and OB producing a decrease in NAc. The increased expression of InsR in NAc of FR rats was accompanied by increased DA D2 receptor (D2R) expression, and the decreased DAT expression and function in CPu of OB rats was accompanied by decreased D2R expression. These results are discussed as partial mechanistic underpinnings of diet-induced adaptations that contribute to altered behavioral sensitivity to psychostimulants that target the DAT.
Keywords: insulin, obesity, food restriction, dopamine uptake, CFT, rotating disk electrode voltammetry
Graphical Abstract
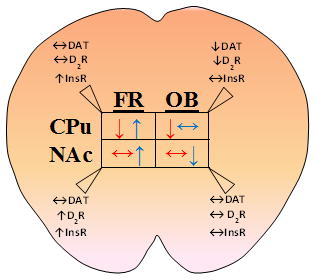
Food restricted (FR) or obesogenic (OB) diets are known to oppositely alter behavioral responses to psychostimulants that target the dopamine transporter (DAT). Here we report the relationship between DAT-mediated DA uptake at baseline (red) and with acute insulin stimulation (blue) in synaptosomes isolated from nucleus accumbens (NAc) and caudate-putamen (CPu) of FR and OB rats compared to ad libitum (AL) fed rats. Regional differences in total expression of DAT, insulin receptor (InsR) and dopamine D2 receptor (D2R) are further observed thereby providing some insights into psychostimulant sensitivity with diet.
Introduction
Evidence obtained from animal models and human neuroimaging indicate that brain dopamine function can be altered by diet and body weight [1–3]. Insofar as brain dopamine regulates such behavioral functions as reward learning [4], incentive motivation [5], and nutritive signaling [6], diet-induced changes can be adaptive, for example when upregulated to promote appetitive behavior during periods of food scarcity and negative energy balance. On the other hand, changes that accompany excessive consumption of energy-dense, highly palatable foods may perpetuate and exacerbate maladaptive behavior, including compulsive eating [7]. One of the specific molecular targets of diet-induced regulation is very likely the dopamine transporter (DAT) which functions to clear extracellular dopamine (DA), thereby contributing to the balance of dopaminergic tone. Evidence that points to DAT regulation by diet includes the many demonstrations that rewarding and locomotor-activating effects of psychostimulant drugs, including cocaine and (meth)amphetamine which target the DAT [8, 9], are modified by underfeeding and overfeeding [10–15]. Generally, the cellular and behavioral responsiveness to these psychostimulants are increased with food restriction [1, 13, 14, 16–18], but decreased with an obesogenic diet [11, 19, 20]. The relationship between diet and DAT-dependent psychostimulant effects may be mediated by changes in insulin exposure. Chronically food-restricted animals are hypoinsulinemic, obese animals are hyperinsulinemic [21, 22], and insulin levels in the brain parallel levels in the periphery [23, 24]. Further, insulin, by acting on insulin receptors (InsR), activates the PI3K/Akt signaling cascade which in turn enhances the surface expression of DAT and hence its overall uptake capacity [19, 25, 26]. Changes in brain insulin level and InsR sensitivity under different dietary conditions may therefore be important factors in determining DAT function, DA signaling, and both adaptive and maladaptive behavior directed toward food and drugs of abuse. While the rationale for presuming DAT as the mediator of diet-related differences in effects of DAT ligands seems well-founded, it is clear that other components of DA neurotransmission can also vary in relation to diet. DA release is one such component, with extracellular DA levels reflecting a balance between impulse-flow induced DA release and DAT-mediated DA clearance [22, 27].
Recently, we found that activation of InsRs by exogenous insulin applied to striatal slices potentiates evoked DA release in both caudate-putamen (CPu) and nucleus accumbens (NAc), with a greater effect in the latter rather than the former [22]. This regional difference may be due to the higher expression levels of InsR in the NAc [28]. Notably, we found that the primary function of insulin under depolarized conditions was to stimulate striatal DA release in spite of a parallel increase in DAT activity (Vmax) as estimated in a computational method applied to the time course of DA clearance as in our previous work [27]. Insulin’s effect on release and uptake was lost at supraphysiological concentrations (100 nM), arguing against insulin-enhanced uptake dominating the balance between release and uptake [22]. While both food restriction and an obesogenic diet decreased evoked DA release at baseline, they induced opposite changes in sensitivity to insulin’s amplifying effect on DA release, with food restriction enhancing and obesogenic diet diminishing [22]. Understanding diet- and insulin-induced changes in DAT function in situ is a necessary part of unraveling the mechanistic basis of diet-induced changes in DA transmission, psychostimulant responsiveness, and feeding behavior. Consequently, the current study was undertaken to experimentally obtain kinetic parameters and functional expression of DAT with intent to complement previous in silico derived Vmax values that required the input of an assumed Km value [22]. We hypothesized that DAT function would change in a corresponding manner to our DA release findings and may further exhibit regional differences. To examine the influence of diet and insulin on DAT functionality we measured DAT-mediated DA transport, functional expression of DAT protein at the plasma membrane via biotinylation assays and [3H]CFT binding, and total expression via Western blotting in striatal subregions and the DA cell body area originating from the midbrain. We also examined the effect of diet on InsR and D2R expression in striatal subregions and midbrain. Here we find that DAT activity in vitro is affected across feeding groups and differs in response to exogenous insulin in a regionally specific manner.
Materials and Methods
Animals
Procedures were in accordance with the NIH Guide for the Care and Use of Laboratory Animals and approved by the NYU School of Medicine Animal Care and Use Committee. In preparing the present work for publication, the guide for ethical behavior in publishing research was followed as described in the COPE Report 2003 (available from the Committee on Publication Ethics (COPE)).
Adult male Sprague-Dawley rats (8–10 weeks; Taconic, New York, NY) were singly housed for all diet comparisons on 12h light:dark cycle (lights on 0600).
Rat diet regimen
Dietary changes were initiated when subjects were between 9 and 12 weeks of age and the duration of the ad libitum, obesity-promoting [29] or food restricted [30] diets was 25–30 days. Ad libitum (AL) fed subjects were given free access to LabDiet 5001 standard rat chow (LabDiet, St. Louis, MO) from which 29.8% of calories are provided by protein, 13.4% from fat, and 56.7% from carbohydrate, 6% of which are from sugars. A typical daily intake was 25 grams with a yield of 84 kcal of physiological fuel value. In food restricted (FR) rats, the daily allotment of rat chow was decreased by 50–60% to 10 grams per day until body weight decreased by 20% (approximately 2–3 weeks). Daily feeding was then titrated to maintain stability of new body weight for the remaining days [30]. Subjects on the obesogenic (OB) diet had ad libitum access to rat chow and Milk Chocolate Ensure (Abbott Laboratories, Lake Forest, IL) [29] from which 23% of calories are provided by fat and 27% from sugar. Within one week of initiating Ensure availability, OB rats consumed negligible amounts of chow and, on average, consumed 135 ml of Ensure per day with a yield of 126 kcal.
The different diet groups were equally represented during the 9-day tissue collection period wherein one rat was sacrificed per day and subjected to brain microdissection so that crude synaptosomes could be freshly prepared on experiment day. Because of time constraints, only midbrain tissue was flash frozen and processed to make synaptoneurosomes within one week in order to perform [3H]DA uptake and [3H]CFT binding assays, and preparation of lysates. Dissection yielded striatal tissue separated into CPu and NAc, and midbrain tissue consisting primarily of the DA cell body areas SNc and VTA.
Chemicals and solutions
Reagents were purchased as follows: [3H]dopamine (34.6 Ci/mmol) and [3H]CFT (76.0 Ci/mmole) were from Perkin-Elmer (St. Louis, MO). Dulbecco’s phosphate buffered saline (DPBS), dopamine (DA), cocaine, insulin (I5523) and (-)-cocaine hydrochloride were from Sigma-Aldrich (St. Louis, MO). Unlabeled β-CFT was from the National Institute of Drug Abuse (Research Triangle Institute, Research Triangle Park, NC). All other chemicals were purchased from Fisher scientific (Fair Lawn, NJ) or Sigma-Aldrich. Synapto(neuro)somal protein concentrations were determined by the DC Protein Assay (Bio-Rad, Hercules, CA) and lysate protein concentrations were determined by the BCA Bradford Assay (Thermo Scientific, Rockford, IL).
Synapto(neuro)some preparation
Rats were briefly exposed to CO2 prior to decapitation and brains were rapidly removed followed by CPu, NAc and midbrain dissection. Midbrain (including VTA and SNc) was flash frozen in 0.32M sucrose. Fresh CPu and NAc synaptosomes were prepared as previously described [31, 32]. Briefly, striatal subregions were homogenized in ice-cold 0.32 M sucrose at a concentration of 100 mg tissue weight/1.5 ml (15 volumes) with a motor-drive Teflon pestle (800 rpm for 10 strokes). Homogenate was centrifuged at 1000 × g for 15 minutes at 4ºC, and the resulting supernatant (S1) was spun at 17,000 × g for 20 minutes at 4ºC. Crude synaptosomal pellet (P2) was washed and resuspended at 0.3–1.0 mg/ml protein in modified Krebs uptake buffer (122 mM NaCl, 5.0 mM KCl, 1.0 mM CaCl2, 1.2 mM MgSO4, 15.0 mM Na2HPO4, 10 mM glucose, pH 7.4) for functional and binding assays or at 1.0 mg in ice cold DPBS containing 1 mM MgCl2 and 0.1 mM CaCl2 (DPBSCM+, pH 7.4) for DAT biotinylation assay.
Crude synaptoneurosomes from frozen midbrain tissue were prepared as previously described [33, 34]. Thawed midbrain tissue was rinsed with ice-cold modified KREBs uptake buffer and then placed in homogenizer containing KREBs buffer at a concentration of 100 mg tissue weight/3.0 ml (30 volumes). Midbrains were carefully homogenized at 300 rpm for 10 strokes using a motor-driven Teflon pestle. Homogenate was passed through a 100 μM filter and then filtered through a 10 μM filter. Resulting homogenate was spun at 1000 × g for 15 minutes. Synaptoneurosomal pellet was washed, spun again and resuspended in modified Krebs uptake buffer for binding and uptake assays. An aliqout of synaptoneurosomes was processed for western blot analysis.
Surface biotinylation of DAT in synaptosomes
Synaptosome preparations (1000 μg) were biotinylated with 0.3 mg/ml SulfoLink NHS-SS-biotin (Thermo Scientific, Rockford, IL) in chilled DPBS-CM2+ for 1 hr at 4°C followed by centrifugation at 8000 × g for 4 min at 4°C. Reaction was terminated by resuspending pellet in ice-cold 100 mM glycine and centrifuged again followed by re-suspension of pellet with glycine and incubating for an additional 15 min at 4°C, end-over-end rotation. Synaptosomes were then washed (3Xs) in cold DPBS. Final pellet of synaptosomes or synaptoneurosomes were sonicated in 1% Triton lysis buffer (10 mM Tris, pH 7.4, 150 mM NaCl, 1 mM EDTA, 1% Triton, 1X protease inhibitors, 1mM PMSF) and incubated for 1 hr at 4°C, end-over-end rotation. Total lysates were spun at 20,000 × g for 20 min at 4°C. Total synaptosomal and synaptoneurosomal preparations were prepared with sample buffer (1X NuPAGE loading buffer and 5% β-mercaptoethanol), heated at 65°C for 10 min and subjected to western blotting procedures. To purify biotinylated surface fraction of synaptosomes, 200 μg of lysate was incubated overnight at 4°C with NeutrAvidin agarose resin (Thermo Scientific). Surface biotinylated proteins were eluted with 100 μl of elution buffer (62.5 mM Tris, pH 6.8, 20% glycerol, 5% β-mercaptoethanol, 2% SDS) and heated for at 65°C for 10 min. Surface biotinylated fraction alongside total synaptosomal samples (5 μg of CPu and 10 μg of NAc) were separated by 7.5% SDS-polyacrylamide gel electrophoresis and transferred to a nitrocellulose membrane. Membranes were probed using goat-anti DAT (Santa Cruz, sc-1433; 1:500) and anti-mouse tubulin antibody (Sigma; 1:5000). Secondary antibodies conjugated to horseradish peroxidase were obtained from Pierce (Rockford, IL; 1:5000). Immunoblots were developed with Supersignal West Pico and Femto Chemiluminescent Substrate (Thermo Scientific) using a film developer. Band densities were quantified using Image Studio Lite Ver 5.0 following software instructions (LI-COR, Lincoln, NE). The amount of DAT surface expression was assessed by determining the relative ratio of biotinylated DAT to total DAT normalized to tubulin levels. Changes in DAT surface or total band densities were expressed as the percentage of AL control for each brain region.
Protein analysis of DATs in synapto(neuro)somes
Total synapto(neuro)somal samples (5 μg, 10 μg, and 45 μg of CPu, NAc and midbrain, respectively) were separated by electrophoresis on precast 4–12% SDS-polyacrylamide gels (Lonza, Rockland, ME) and transferred to a nitrocellulose membrane. Membranes were blocked for 60 min with Odyssey Blocking Buffer (LI-COR Biosciences, Lincoln, NE) and incubated with goat-anti DAT (Santa Cruz, sc-1433; 1:1000) in Odyssey Blocking Buffer with 0.2% Tween-20 overnight at 4°C. Following washing, membranes were incubated at room temperature with IRDye 800CW Rabbit anti-Goat IgG (LI-COR Biosciences; 1:16,000) in Odyssey Blocking Buffer with 0.2% Tween 20. Blots were stripped (LI-COR Biosciences; 1X), cut at 80kDa, and reprobed with mouse anti-IRβ (Cell Signaling, 3020; 1:1500), rabbit anti-D2R (Millipore, AB5084P; 1:500) or mouse anti-α-tubulin (Sigma-Aldrich, T6199; 1:10,000). Blots were incubated with IRDye 680RD Goat anti-Mouse IgG or IRDye 800CW Goat and-Rabbit (LI-COR Biosciences; 1:16,000). Proteins were visualized using an Odyssey CLx infrared imaging system, and bands were quantified using Image Studio Lite Ver 5.0 (LI-COR, Lincoln, NE).
Measurement of [3H]DA uptake and [3H]CFT binding
For both binding and uptake assays, synapto(neuro)somes were resuspended in modified Krebs uptake buffer containing 1 mM ascorbic acid and 0.1 mM tropolone and used within 20 minutes. Assays were conducted in 96-well plates at 25°C, with all determinations performed in triplicate at least four times. [3H]DA uptake was initiated by incubating 20 μl of synaptoneurosomes with varying concentrations of non-radiolabeled DA (3.0 nM-1.0 μM) along with 6–10 nM [3H]DA for 5 minutes at room temperature. Nonspecific uptake was determined using 100 μM cocaine. [3H]CFT binding assay was initiated by addition of 20 μl cell synapto(neuro)some suspension to buffer containing 3–5 nM phenyltropane cocaine analog, [3H]WIN35,428, and varying concentrations of unlabeled β-CFT at a final concentration ranging from 1.0 nM-0.3 μM for a final per-well reaction volume of 200 μl. Nonspecific binding was determined with 100 μM unlabeled CFT.
[3H]CFT binding and [3H]DA uptake assays were terminated by cold, rapid vacuum filtration onto a Wallac B filtermats using a Brandel 96-pin manual harvester [31, 32]. Counts per well were converted to pmol, then corrected to mg of total protein per well and per minute for [3H]DA uptake assays. Kinetic parameters were calculated using Biosoft Kell Radlig software (Cambridge, UK). Tritium accumulation was quantified using a microbeta 1405 liquid scintillation counter. Total radioligand added was assessed using a LS 6500 Multi-Purpose Scintillation Counter, Beckman Coulter, Inc (Fullerton, CA. USA).
Measurement of DA with Rotating Disk Electrode Voltammetry (RDEV)
Briefly, synaptosomes were resuspended in ice cold pre-oxygenated physiological buffer (120 mM NaCl, 1.8 mM KCI, 2.5 mM CaCI2, 2.3 mM MgSO4, 1.2 mM KH2PO4, 26 mM NaHCO3, and 10 mM glucose (pH adjusted to 7.4) [35]. Synaptosomal aliqouts (294 μl) held on ice were added to electrochemical chamber (37°C) with a rotating working electrode (at 4000 rpm) and allowed to equilibrate for 5–10 minutes. The oxidized DA current (+0.4 V vs. Ag/AgCl reference electrode) was recorded every 300 ms by a National Instruments (Austin, TX) PC interface board. After baseline signal reached a steady state, [DA] was added to the suspension at 37°C to initiate uptake measurement. A range of 0.25 μM–5.0 μM DA was added to each suspension in chamber. Protein level in each suspension was determined by the Bio-Rad DC protein method. Initial DA uptake (pmol/sec/mg) was calculated with the Origin Labtalk program at each tested [DA]. Kinetic parameters (Km and Vmax) of uptake were estimated by nonlinear fitting of the initial uptake rate to the initial added [DA] according to the Michaelis-Menten equation for saturation (linearly represented by the Scatchard equation) using the Biosoft Kell Radlig software. All results were expressed as mean ± SEM. For insulin studies, synaptosomes were preincubated for 15 min at 37°C with or without 30 nM Insulin before assessing DAT-mediated uptake at a concentration of 0.25 μM of DA.
Statistical analysis
There was no blinding of experimenter to diets or to samples processed for biochemical analysis. The design of our biochemical comparison groups was as in our previous biochemical studies. Experimental observations of this type have an overall standard deviation (SD) of 12% (please note that data reported here are average ± SEM). We aimed for being able to detect a difference (δ) of at least 25% with p<0.05 (two-sided, i.e. α = 0.05) with an 80% chance (or power, i.e. β = 0.20), which requires a sample size of at least four in our pharmacology and biochemistry experiments. In most experiments we were able to have a larger sample size and therefore detect differences smaller than 25%. Statistical significance was calculated using Prism software version 6.0 (GraphPad, La Jolla, CA). The threshold for significance employed throughout was p<0.05, and significance values were calculated by one-way ANOVA with appropriate post hoc tests, or by two-tailed student’s t-test when applicable. Correlations were assessed with the nonparametric Spearman correlation.
Results
Chronic diet manipulation affects rat body weight
Prior to initiation of chronic diet regimens, the average body weight of rats was 381.4 ± 4.5 g with no significant differences between groups assigned to the three different diets (p>0.05). Following 4 weeks of food restriction (FR) or obesogenic (OB) diets, the final and percent change in body weight were found to differ across feeding groups (F2,57 = 512.5, p<0.001 and F2,57 = 524.4, p<0.001, respectively, Fig. 1a and 1b). The FR group weighed significantly less than the AL group (305.9 ± 4.1 g versus 514.5 ± 6.2 g, p<0.001), with an average weight loss of 25.8 ± 1.3% for FR rats as compared to a 26.1 ± 0.9% weight gain for AL rats. The OB diet resulted in higher body weight than in the AL group (586.7 ± 8.3 g versus 514.5 ± 6.2 g, p<0.001), with an average weight increase of 35.1 ± 1.9%. The average increase in body weight of OB over AL rats was found to be approximately 12.0 ± 1.2% (p<0.001). We have previously shown that these three diets, applied for a similar duration to the present study, lead to markedly different levels of circulating insulin [22].
Fig. 1.

Final body weight (a) and change in body weight over time (b) as a function of chronic FR and an OB diet compared to AL feeding. Data are means ± SEM for 20 rats, **p<0.0001 vs. AL control (one-way ANOVA followed by Dunnett’s post hoc test).
Chronic FR or OB diet reduced basal dopamine uptake Vmax in the CPu whereas NAc and midbrain showed a different pattern of effects
To assess whether diet is linked to changes in DAT function, we examined DAT kinetic parameters (Vmax and Km) in CPu and NAc synaptosomes using rotating disk electrode voltammetry (RDEV), a direct measure of DA uptake in real time. Because DAT in the midbrain resides on somatodendrites of DA cell bodies and is expressed at a much lower level than in the striatum [36–39], the more sensitive classical [3H]DA uptake approach was used for kinetic resolution of DAT function in midbrain synaptoneurosomes.
Consistent with known expression differences of DAT in striatal subregions [40, 41], we found that DA uptake Vmax in AL rats was higher by 55% in the CPu than in the NAc with a similar Km (Fig. 2, Table 1). Although absolute Vmax and Km values cannot be compared between RDEV and [3H]DA uptake assays, the greatly reduced maximal uptake rate observed per mg midbrain tissue relative to that in striatum (Fig. 2) is in accordance with its low DAT expression [36–39].
Fig. 2.

DA uptake studies with CPu or NAc synaptosomes and midbrain synaptoneurosomes from rats on chronic FR or OB diet compared to AL fed rats. Absolute Vmax values of DAT-mediated DA uptake in CPu and NAc were determined over various concentrations of dopamine [DA] as measured by RDEV (left Y axis) or in midbrain as determined by [3H]DA uptake (right Y axis). Data are shown as means ± SEM for 4–10 independent experiments, *p<0.05 vs. AL control (one-way ANOVA followed by Dunnett’s post hoc test).
Table 1.
Km values for DA uptake into CPu and NAc synaptosomes (by RDEV) and midbrain synaptoneurosomes (by [3H]DA) from rats on FR or OB diet
| DA Uptake (RDEV) | [3H]DA uptake | ||
|---|---|---|---|
| CPu | NAc | Midbrain | |
| Km (μM) | Km (μM) | Km (nM) | |
|
| |||
| AL | 3.15±0.15 (7) | 3.83±0.36 (5) | 30.5±0.67 (4) |
| FR | 2.53±0.24 (10) | 4.21±0.19 (6) | 31.8±0.44 (5) |
| OB | 2.32±0.26 (7) | 2.76±0.15 (5)* | 29.9±1.12 (4) |
|
|
|||
Absolute Km values for DA uptake were determined over various concentrations of [DA] as measured by RDEV in freshly prepared CPu or NAc synaptosomes or synaptoneurosomes with [3H]DA prepared from frozen midbrain tissue. Kinetic constants were calculated using Kell Radlig and are presented as means ± SEM for the number of independent experiments indicated between parentheses. Each NAc experiment required tissue pooled from 2 rats (*p<0.05 vs. AL control, one-way ANOVA followed by Dunnett’s post hoc test).
Examination of dieted animals revealed a significant effect on DA uptake in the CPu with little to no effect in the NAc and midbrain. Specifically, rats on either a food restricted (FR) or obesogenic (OB) diet displayed reduced DA uptake (Vmax) in CPu synaptosomes by an average of 25% with no change in Km (Table 1) compared to AL fed rats (Fig. 2) (F2,21 = 12.99, p=0.0002). In contrast, NAc synaptosomes showed a pattern for uptake Vmax trending towards an increase for FR (p=0.16) and a decrease for OB diet (p=0.15). A seemingly similar pattern was observed in midbrain synaptoneurosomes, but analysis did not show statistically significant indicators (FR, p=0.67 and OB, p=0.28). Non-specific binding of [3]DA to synaptoneurosomes was calculated to be less than 30% suggesting viable uptake from frozen midbrain tissue. There were no changes in uptake Km in these regions as a function of diet except for a modest decrease in NAc in OB animals (Table 1). It should be noted that the Km in all diet groups recorded with RDEV is an order of magnitude higher than what is observed by in vivo voltammetry [27, 42] or with in vitro [3H]DA uptake [31], a well-known phenomenon that is typical for RDEV results [43, 44]. Possible theoretical reasons as advanced by McElvain and Schenk [45] and Patterson et al. [43] relating to the trans [DA] model as well as a role for the high-speed rotations of the voltammetry probe [46, 47] will be addressed in a future study. Despite higher Km estimates, RDEV provides a comparative measure of DAT activity in relation to diet by monitoring DA uptake in real-time at a physiological temperature.
Chronic FR or OB diet reduced [3H]CFT binding Bmax in the CPu whereas NAc and midbrain showed a different pattern of effects
High-affinity binding of the phenyltropane cocaine congener [3H]CFT to DAT was studied as a function of diet. As shown in Figure 3, the absolute Bmax values in CPu of AL rats were approximately 2- and 10-fold higher than those in NAc and midbrain, respectively, consonant with previous findings showing regional differences in DAT expression [36–39, 41].
Fig. 3.

Maximal [3H]CFT binding (Bmax) in CPu or NAc synaptosomes and midbrain synaptoneurosomes from rats on chronic FR or OB diet compared to AL fed rats. Synapto(neuro)somes were incubated at 25ºC with 4 nM [3H]CFT for 15 min in modified uptake buffer and kinetic parameters of [3H]CFT binding were calculated using Kell Radlig. Data for each brain (sub)regions is shown as means ± SEM of 4 or more experiments, each performed across triplicate wells, *p<0.05 vs. AL control (one-way ANOVA followed by Dunnett’s post hoc test).
As observed for DA uptake Vmax, the absolute Bmax values in CPu synaptosomes harvested from FR and OB rats were reduced by ~25%, when compared to AL rats (Fig. 3) (F2,14 = 5.079, p=0.022). In NAc synaptosomes and midbrain synaptoneurosomes, Bmax values (Fig. 3) appeared to follow a similar trend as Vmax (Fig. 2) but these effects did not reach significance (FR p=0.34 and OB p=0.34 in NAc; FR p=0.84 and OB p=0.48 in midbrain). It is important to note that in whole cells or synapto(neuro)somes with a high K+ interior, [3H]CFT only binds to DAT in the plasma membrane such that [3H]CFT binding becomes an indicator of surface expression [48].
There was no change in the disassociation constant (Kd) with diet in any of the brain regions (Table 3).
CFT binding Bmax and DA uptake Vmax values in correlation with biotinylated surface DAT findings suggest that diet regulates the number of DATs at the surface in a regionally specific manner
To confirm integrity of synaptosomes during [3H]CFT binding, an indicator of DAT surface expression, we performed surface biotinylation assays in CPu and NAc synaptosomes. Because midbrain synaptoneurosomes inherently express low levels of DAT combined with limited tissue availability, we were unable to isolate biotinylated surface fraction. Consonant with [3H]CFT binding (Bmax), biotinylation studies revealed diet-induced changes in the CPu with no change in NAc (see representative immunoblots of both biotinylated surface and total fractions in Fig. 4). For the latter, surface biotinylated DAT was reduced by ~25% across the FR and OB groups compared to AL (Fig. 4b) in parallel to the ~25% reductions in Bmax of [3H]CFT binding (Fig 3). Although surface DAT showed no significant effects in the NAc, a pattern similar to that displayed by binding Bmax response to diet was observed.
Fig. 4.

DAT surface expression in CPu or NAc synaptosomes from rats on chronic FR or OB diet compared to AL fed rats as assessed by surface biotinylation studies. (a) Shown are representative immunoblots of biotinylated surface and total DAT fractions. (b) Quantification of surface biotinylated DAT normalized to total DAT expressed as percentage of AL control in each striatal subregion. Data are means ± SEM for 5–10 independent experiments, *p<0.05 vs. AL control (one-way ANOVA followed by Dunnett’s post hoc test).
These decreases in CPu Bmax were reminiscent of the 25% reductions in DA uptake Vmax, prompting the question as to whether diet regulates the number of surface DATs rather than the uptake rate of each individual DAT. To this end, we compared Vmax values to matched Bmax values obtained on the same tissues across all diet groups in each (sub)region using Spearman correlation coefficients. As shown in Figure 5, significant linear correlations were obtained between Bmax and Vmax values, indicating that Vmax values fluctuate in accordance with DAT surface expression. As an additional factor, we found no significant correlations between kinetic measures and weight of animals within each diet group at time of sacrifice (data not shown). Taken together, the results indicate that DAT regulation in response to diet occurs at the level of DAT surface expression in CPu, NAc and midbrain.
Fig. 5.

Correlation between the absolute Bmax of DAT binding and the Vmax of DA uptake of matched observations in synapto(neuro)somes prepared from brain regions following chronic diet treatments. The Spearman correlation coefficient and the level of significance (two-tailed non parametric) are shown next to fit line.
Insulin enhances DA uptake as a function of diet in striatal subregions
Chronic insulin manipulation through diet affects DAT density at the cell surface and thus overall DA uptake capacity, and therefore we investigated whether DA uptake would be affected by acute exogenous insulin addition using RDEV. Examination of midbrain synaptoneurosomes was not performed given methodological factors of RDEV and tissue availability. In striatal synaptosomes from dieted rats, we examined the relative change of uptake with and without insulin. Relative changes of 0.25 μM DA uptake in response to 30 nM insulin was compared to baseline. DAT-mediated uptake showed a significant increase in CPu synaptosomes (137±5.0% of baseline in AL, 171±8.7% of baseline in FR, and 121±7.8% in OB) (Fig. 6, left panel). A similar trend was observed in NAc synaptosomes with a loss of insulin’s effect on DA uptake in OB rats (121±3.3% of baseline in AL, 135±5.5% of baseline in FR, and 105±6.6% in OB) (Fig. 6, right panel). Comparison of insulin’s effect on DA uptake revealed that FR significantly enhanced insulin-induced DA uptake in both CPu (71% vs 37% in AL, p<0.05) and NAc (35% vs. 21% in AL, p<0.05) while OB diet attenuated this effect only in the NAc (21% vs. 5% in AL, p<0.05). Moreover, comparison of insulin’s effect on DA uptake between CPu and NAc in AL animals revealed possible regional differences in DA uptake rate changes. This finding is at odds with the fact that InsR expression is higher in the NAc than in the CPu [28] and the general ability of InsRs, when activated, to enhance DAT surface expression and thereby DA uptake capacity. A possible reason is the higher expression of DA D2 receptors (D2Rs) in the CPu.
Fig. 6.

Insulin-induced increases in DAT-mediated DA uptake in CPu and NAc as a function of diet. Freshly prepared CPu or NAc synaptosomes were pre-incubated with or without 30 nM insulin (+Ins) for 15 min at 37ºC before assessing 0.25 μM DA uptake with RDEV. Data are presented as percentage of initial DA uptake rate treated with 30 nM insulin compared to vehicle (PBS) AL control for each striatal subregion (dotted line = 100%). Data reflect means ± SEM from 5–8 independent experiments, *p<0.05 vs. vehicle control, #p<0.05 vs. AL control (one-way ANOVA followed by Dunnett’s post hoc test). δp<0.05 vs. AL of CPu (two-tailed Student’s t-test). N.s. nonsignificant.
Diet regionally affects total DAT, InsR and D2R expression in synapto(neuro)somes
Activation of D2Rs or InsRs can exert a DA uptake enhancing effect by mediating an increase in surface DAT [49–52]. Therefore, we assessed the levels of these two regulatory proteins, as well as DAT itself for possible diet-induced changes in expression. Western blot analysis of CPu synaptosomal lysates from FR rats revealed a significant increase in InsR (118±4.2%) with no change in total DAT or D2R expression while OB rats showed a reduction in total DAT (81±4.2%) and D2R (72±1.6%) with no change in InsR expression compared to AL rats (Fig. 7). The finding that total DAT levels were reduced in CPu synaptosomes from OB rats may account for lowered surface expression compared with AL rats (Fig. 4). A different mechanism is at play in FR rats in which total DAT is unchanged relative to AL rats despite a reduction in surface DAT (Fig. 4). Lysates from NAc synaptosomes of FR rats show elevated InsR (114±3.5%) and D2R (131±12.1%) expression with no significant effect on total DAT density. In contrast, the obesogenic diet had no significant effect on DAT, D2R and InsR expression in the NAc. In the midbrain, diet appeared to influence the expression of these proteins with a pattern similar to that seen in the NAc but the effects were not statistically significant (Fig. 7). Given the heterogeneity of neuron type and D2R localization in the tissue homogenates, it will be important to investigate whether D2R autoreceptors contribute to changes in DAT surface expression and subsequent function with insulin.
Fig. 7.

Effect of FR and OB diets on expression of DAT, insulin receptor (InsR) and dopamine 2 receptor (D2R) in a regionally specific manner. Shown are representative immunoblots depicting synapto(neuro)somal protein levels and corresponding protein band intensities that are normalized to the level of tubulin and expressed as % change relative to AL control in each brain (sub)region (means ± SEM for 4–7 independent experiments, *p<0.05 vs. AL control, one-way ANOVA followed by Dunnett’s post hoc test).
DISCUSSION
Long term changes in DAT would be expected to influence feeding and drug-induced behaviors. It is known that FR and OB diets increase or decrease, respectively, the rewarding and locomotor-activating effects of drugs of abuse that target the DAT [1, 11, 13, 14, 16–20]. We hypothesized that circulating insulin regulates DAT function in the subregions of striatum and midbrain, and therefore sought relationships between DAT expression and function, DAT sensitivity to modulation by insulin, and InsR expression in AL, OB, and FR diet groups. Accordingly, we found altered properties of DAT in the CPu of OB and FR subjects but no significant changes in the NAc or midbrain. Our results indicate that reduced uptake capacity (Vmax) in the CPu can be explained by changes in cell surface expression as determined by biotinylation and Bmax of [3H]CFT binding. These findings, in addition to unchanged DA affinity (Km), support a model whereby diet-induced reduction in DAT activity in the CPu is a result of lowered surface expression rather than a change in transport activity of individual DAT molecules. Moreover, we provide evidence that chronic diet manipulations lead to distinctive adaptations of DAT in the CPu versus NAc or midbrain which support regional variability on DAT regulation [53–56].
The seeming paradox of FR and OB diets both lowering basal activity of DAT in the CPu can potentially be explained by low circulating insulin in the former and high circulating insulin in the latter [22, 23]. Chronic hypoinsulinemia would be associated with understimulation of InsRs and hyperinsulinemia would be associated with a compensatory decrease in InsR sensitivity, as seen in our voltammetry studies [22]. Either way, reduced InsR signaling through the PI3K/Akt pathway would weaken insulin’s normal effect of maintaining DAT surface presence. Here our findings support those of others that showed reduced DAT function in CPu or striatal preparations by food deprivation and restriction [31, 43], streptozotocin treatment [57, 58] or obesogenic diets [19]. Importantly, function in food deprived and streptozotocin-treated subjects was restored by insulin replacement [43, 58]. However, while diet-related changes in insulin exposure and InsR sensitivity are presumably the same in NAc and midbrain as in CPu, there were no observable effects of diet on basal DAT activity in the NAc or midbrain. This would either suggest that insulin is not the regulator of DAT function in CPu or that DAT regulatory mechanisms differ between brain regions. Although previous studies are in accordance with our findings showing unchanged DAT in NAc of FR subjects [31, 43], others have shown that FR with scheduled sucrose access led to DAT increases in the NAc shell but not NAc core [59] and VTA not SNc [60]. With obesogenic diets, Cone et al. [61] reported no change of the mature 80 kDA isoform of DAT in NAc, in agreement with present results, while others showed reduced function [20, 62]. Thus, distinctive adaptations of DAT may occur within striatal and midbrain subregions, based on different regulatory mechanisms and the type and duration of diet.
In regard to the latter, the absence of effect of OB diet on NAc DAT in the present study conflicts with previous reports [20, 61, 62]. It is possible that supplementation of chow feeding with Ensure was not sufficient to induce significant DAT changes in the NAc, due either to the limited duration of Ensure feeding and/or the amount of excess body weight gained. Indeed, the difference in body weight between AL and OB animals (Fig. 1) failed to meet the conventional criteria for obesity (15–20%) [29, 63]. However, we have previously shown that the 4-week diet regimen of Ensure decreased striatal evoked DA release [22] and abolished insulin receptor-mediated signaling in the striatum [64], both of which are associated with obesity [7, 22], and indicate physiologically important adaptations of the DA system in the absence of any change in the DAT.
Changes in DAT function with diet are often directly related to surface expression [65–67]. However, Narayanaswami et al. [62] showed in obese rats that reduction of DA uptake Vmax in NAc was specifically independent from DAT trafficking as there was no accompanying reduction in biotinylated surface DAT. The discrepancy may lie in the high-fat diet used to promote obesity versus the moderate fat and sugar diet conditions used in the present work. It is becoming apparent that diet composition can be crucial, even within high-fat diets [20]. Previous evidence suggests that diet effects and/or insulin action at InsRs in the NAc may also affect catalytic properties of DAT [25, 26, 58] in addition to mediating DAT trafficking to the plasma membrane via PI3K/Akt-mediated signaling [19, 26].
Support for insulin regulation of DAT trafficking and/or function in both CPu and NAc stems from insulin-stimulated potentiation of DAT uptake as a function of diet. The acute effect of 30 nM insulin on DA uptake was measured in CPu and NAc at a concentration of DA below Km for uptake (Fig. 7). Therefore, uptake changes could be due to alterations in Km or Vmax or both. Notably, this functional response to insulin was enhanced in CPu and NAc of FR rats compared to AL rats, consonant with InsR overexpression and/or hypersensitivity with FR diet. With OB diet, insulin’s potentiating effect on DAT activity was blocked in the NAc but not in CPu compared to AL and FR rats, likely as a result of InsR subsensitivity as recently demonstrated to occur in the NAc of OB rats subjected to the same diet [64]. Changes in InsR sensitivity as a consequence of diet contributes, at least partially, to both rapid and long term regulation of DAT function in a regionally dependent manner. As mentioned, the subregional effects of insulin with DAT further support distinct regulatory mechanisms important in modulating DAT function.
Insulin action in the brain contributes to many important processes (see review Dawes et al. [68]) some of which could have a direct or indirect effect on the activity and availability of DAT at the cell surface. One mechanism involves insulin’s role in regulating the release of DA. Our group has demonstrated the effect of InsR signaling in regulating electrically evoked DA release in the CPu and NAc [22]. Results obtained using ex vivo voltammetry included reductions in evoked DA release in striatal subregions of FR and OB rats compared to AL rats (for direct comparison with DA uptake changes in CPu under the same diet conditions see Supplementary Materials). Notably, addition of nM concentrations of insulin increased evoked DA release that was enhanced in FR rats, but blunted in OB rats. Such changes in DA signals could lead to compensatory changes in DAT and its associated D2R autoreceptor. Indeed, we found differential alteration of D2R expression with OB and FR diets (Fig. 7). D2R activation is known to enhance DAT activity [50, 52, 69] and promote increased cell surface DAT, possibly via ERK1/2 activation [50, 70] or direct interaction [51]. Thus, diet-induced changes in total D2Rs are speculated to include changes in the presynaptic D2Rs regulating DAT which may factor into the overall transport capacity of DAT at baseline.
Further evidence for a positive correlation between D2R activity and membrane-associated DAT was shown by Owens et al. [49] wherein repeated stimulation of D2R (by increasing DA levels with amphetamine (AMPH)) led to restoration of DAT function in hypoinsulinemic rats. Thus, the D2R downregulation seen in CPu of OB rats may contribute to the observed decrease in DAT function, though the upregulation of D2R in NAc of FR rats does not easily fit with the unchanged DAT surface expression and kinetics. Yet, it is important to consider that D2R actions also control other aspects of DA transmission by both pre- and postsynaptic pathways [71, 72] thereby presenting a challenge in assigning D2R function. Therefore, future studies should aim to better elucidate the cellular and molecular role of D2Rs in the regulation of DA transmission given that synapto(neuro)somes contain different subpopulations of cells.
Earlier studies agree with our findings and extend the conclusion that diet duration and composition have effects on D2R expression [73], and altered behavioral responses to DA are mediated, in part, by D2R. D2Rs were found to be supersenstitive in NAc of FR rats as evidenced by increased locomotor activation in response to the D2R agonist quinpirole [74], which was confirmed in two later studies reporting on the locomotor effect of pramipexole [75] and binding of spiperone by autoradiography [76]. In obese rats, D2R levels were found to be reduced in the striatal complex [7] including CPu [77], NAc [76] and in the NAc shell [78] along with decreased susceptibility to the behavioral effect of the D2R agonist quinpirole [78, 79]. These findings also fit with the behavioral effects of DAT ligands which are enhanced by FR diet [1, 14, 16, 18] and decreased by OB diet [10, 11, 19, 20]. Given our finding of insulin’s acute effect on DAT function in a diet- and region-dependent manner, it will be of interest to investigate a possible role for this mechanism, in addition to D2R signaling, in mediating the behavioral effects of psychostimulants. This could have implications for other DAT substrates and associated physiological effects since Siciliano et al. [53] reported that maximal uptake rates of DAT (Vmax) are positively correlated with AMPH potency. Interestingly, a recent study by Fordahl et al. [79] found that repeated administration of AMPH to high fat-fed mice led to increased AMPH potency despite reduced DA uptake and unaltered sensitivity of D2R autoreceptors to the release-inhibitory effect of quinpirole, suggesting that other mechanism(s) involving DAT dysregulation are at play.
Taking into account our findings that various components of the DA system are modifiable by diet in a region-specific manner, it is of interest to speculate how this translates into different behavioral outcomes depending on the DA circuit involved. The mesolimbic pathway includes projection of DA neurons from VTA to NAc and is important for mediating the rewarding and reinforcing effects of drugs of abuse [80–82] and palatable foods [22, 83, 84]. Regarding the latter, the results obtained by Stouffer et al. [22] and Woods et al. [64] indicate that insulin in the NAc is important in establishing a memory of a meal’s rewarding qualities and nutrient value complementary to the hypothalamic and VTA satiety signals provided by insulin for ending a meal [28, 85]. In the NAc, our findings that chronic FR causes higher D2R expression but unaltered DAT, together with previous reports of reduced tonic levels of DA [13] and lowered evoked DA release [22], suggest that upregulated D2R could play a presynaptic role in dampening release, and a postsynaptic role in amplifying the response to phasically released DA. This would have the adaptive effect of conserving organismic energy expenditure under basal conditions but could ensure a normal or amplified behavioral response to salient DA-releasing stimuli such as food and associated cues. Drugs of abuse that induce a DA surge would similarly ‘benefit’ from the upregulation of postsynaptic signaling.
The parallel nigrostriatal DA pathway tracks from SNc to the CPu and plays a role in action selection [86], habit-based behaviors [87] and drug craving [88, 89]. The reduced D2R observed in the CPu of OB rats extend previous findings by Narayanaswami et al. [62] and is consistent with the idea that perpetuation of excessive eating may be a response to an acquired “reward deficiency syndrome” [7, 82, 90]. Thus, D2R downregulation seen in OB diets is thought to drive compulsive eating behaviors [7, 82, 90]. Further, it is thought that development of addiction involves a transition in DA control from NAc to CPu [87]. It is conceivable that the lower DA levels, DAT, and D2R observed with OB diet in CPu would make a subject less vulnerable to this maladaptive transition when psychostimulant use is concurrent with OB diet.
Taken together, our present and prior results [22] support a model in which CPu DA adaptations to FR and OB diets include decreased expression and function of the DAT, possibly secondary to a sustained decrease in InsR signaling and/or D2R tone. NAc adaptations to these diets are clearly present, in the form of altered DA release, InsR expression and sensitivity, and postsynaptic signaling, but do not appear to include direct effects on DAT expression or function. The reason(s) for differential modulation of DAT in CPu and NAc by the present dietary treatments is not clear, and we cannot rule out the possibility that DAT changes in CPu and NAc emerge at different latencies and would be similar after a longer duration of maintenance on these same experimental diets. However, with regard to diet-induced changes in the rewarding and reinforcing effects of psychostimulants that target the NAc DAT, current and prior results point away from their primary molecular target, the DAT, and toward DA release and upregulated postsynaptic signaling as mechanistic bases of altered behavioral effects.
Supplementary Material
Table 2.
Kd values for [3H]CFT binding to CPu and NAc synaptosomes, and midbrain synaptoneurosomes from rats on FR or OB diet
| [3H]CFT Binding | |||
|---|---|---|---|
| CPu | NAc | Midbrain | |
| Kd (nM) | Kd (nM) | Kd (nM) | |
|
| |||
| AL | 30.3±1.22 (7) | 29.0±1.80 (9) | 32.1±1.13 (4) |
| FR | 28.6±2.55 (5) | 31.9±2.20 (8) | 29.0±0.83 (5) |
| OB | 26.3±1.07 (5) | 30.0±2.07 (8) | 28.5±1.30 (4) |
|
|
|||
Absolute Kd values for [3H]CFT binding were determined in synapto(neuro)somes. Freshly prepared striatal synaptosomes or synaptoneurosomes prepared from frozen midbrain tissue were incubated at 25ºC with 4 nM [3H]CFT for 15 min in modified uptake buffer. Kinetic parameters of [3H]CFT binding were calculated using Kell Radlig. Values represent means ± SEM of the number of experiments indicated between parentheses, each performed across triplicate wells (*p<0.05 vs. AL control, one-way ANOVA followed by Dunnett’s post hoc test).
Acknowledgments
This work was supported by NIH grants DA0033811, DA019676, and DA003956.
Abbreviations
- DAT
dopamine transporter
- AL
ad libitum
- FR
food restriction
- OB
obesogenic diet
- CPu
caudate-putamen
- NAc
nucleus accumbens
- VTA
ventral tegmental area
- SNc
substantia nigra
- CFT
(−)-2-β-Carbomethoxy-3-β-(4-fluorophenyl)tropane
- RDEV
rotating disk electrode voltammetry
- DA
dopamine
- D2R
DA D2 receptor
- InsR
insulin receptor
Footnotes
Conflict of Interest
The authors confirm that this article has no conflicts of interest.
References
- 1.Carr KD. Food scarcity, neuroadaptations, and the pathogenic potential of dieting in an unnatural ecology: binge eating and drug abuse. Physiol Behav. 2011;104(1):162–7. doi: 10.1016/j.physbeh.2011.04.023. [DOI] [PMC free article] [PubMed] [Google Scholar]
- 2.Val-Laillet D, et al. Neuroimaging and neuromodulation approaches to study eating behavior and prevent and treat eating disorders and obesity. Neuroimage Clin. 2015;8:1–31. doi: 10.1016/j.nicl.2015.03.016. [DOI] [PMC free article] [PubMed] [Google Scholar]
- 3.Décarie-Spain L, Hryhorczuk C, Fulton S. Dopamine signalling adaptations by prolonged high-fat feeding. Current Opinion in Behavioral Sciences. 2016;9:136–143. [Google Scholar]
- 4.Schultz W. Predictive reward signal of dopamine neurons. J Neurophysiol. 1998;80(1):1–27. doi: 10.1152/jn.1998.80.1.1. [DOI] [PubMed] [Google Scholar]
- 5.Berridge KC. The debate over dopamine’s role in reward: the case for incentive salience. Psychopharmacology (Berl) 2007;191(3):391–431. doi: 10.1007/s00213-006-0578-x. [DOI] [PubMed] [Google Scholar]
- 6.Tellez LA, et al. Separate circuitries encode the hedonic and nutritional values of sugar. Nat Neurosci. 2016;19(3):465–70. doi: 10.1038/nn.4224. [DOI] [PMC free article] [PubMed] [Google Scholar]
- 7.Johnson PM, Kenny PJ. Dopamine D2 receptors in addiction-like reward dysfunction and compulsive eating in obese rats. Nat Neurosci. 2010;13(5):635–41. doi: 10.1038/nn.2519. [DOI] [PMC free article] [PubMed] [Google Scholar]
- 8.Rice ME, Cragg SJ. Dopamine spillover after quantal release: rethinking dopamine transmission in the nigrostriatal pathway. Brain Res Rev. 2008;58(2):303–313. doi: 10.1016/j.brainresrev.2008.02.004. [DOI] [PMC free article] [PubMed] [Google Scholar]
- 9.Sulzer D. How addictive drugs disrupt presynaptic dopamine neurotransmission. Neuron. 2011;69(4):628–649. doi: 10.1016/j.neuron.2011.02.010. [DOI] [PMC free article] [PubMed] [Google Scholar]
- 10.Wellman PJ, Nation JR, Davis KW. Impairment of acquisition of cocaine self-administration in rats maintained on a high-fat diet. Pharmacol Biochem Behav. 2007;88(1):89–93. doi: 10.1016/j.pbb.2007.07.008. [DOI] [PMC free article] [PubMed] [Google Scholar]
- 11.Davis JF, et al. Exposure to elevated levels of dietary fat attenuates psychostimulant reward and mesolimbic dopamine turnover in the rat. Behav Neurosci. 2008;122(6):1257–63. doi: 10.1037/a0013111. [DOI] [PMC free article] [PubMed] [Google Scholar]
- 12.Carroll ME, Meisch RA. Increased drug-reinforced behavior due to food deprivation. Adv Behav Pharmacol. 1984;4:47–88. [Google Scholar]
- 13.Pothos EN, Creese I, Hoebel BG. Restricted eating with weight loss selectively decreases extracellular dopamine in the nucleus accumbens and alters dopamine response to amphetamine, morphine, and food intake. J Neurosci. 1995;15(10):6640–6650. doi: 10.1523/JNEUROSCI.15-10-06640.1995. [DOI] [PMC free article] [PubMed] [Google Scholar]
- 14.Zheng D, Cabeza de Vaca S, Carr KD. Food restriction increases acquisition, persistence and drug prime-induced expression of a cocaine-conditioned place preference in rats. Pharmacol Biochem Behav. 2012;100(3):538–44. doi: 10.1016/j.pbb.2011.10.021. [DOI] [PMC free article] [PubMed] [Google Scholar]
- 15.Geiger BM, et al. Deficits of mesolimbic dopamine neurotransmission in rat dietary obesity. Neuroscience. 2009;159(4):1193–9. doi: 10.1016/j.neuroscience.2009.02.007. [DOI] [PMC free article] [PubMed] [Google Scholar]
- 16.Bell SM, et al. Food-deprivation increases cocaine-induced conditioned place preference and locomotor activity in rats. Psychopharmacology (Berl) 1997;131(1):1–8. doi: 10.1007/s002130050258. [DOI] [PubMed] [Google Scholar]
- 17.Carroll ME, France CP, Meisch RA. Intravenous self-administration of etonitazene, cocaine and phencyclidine in rats during food deprivation and satiation. J Pharmacol Exp Ther. 1981;217(2):241–7. [PubMed] [Google Scholar]
- 18.Cabeza dV, Carr KD. Food restriction enhances the central rewarding effect of abused drugs. J Neurosci. 1998;18(18):7502–7510. doi: 10.1523/JNEUROSCI.18-18-07502.1998. [DOI] [PMC free article] [PubMed] [Google Scholar]
- 19.Speed N, et al. Impaired Striatal Akt Signaling Disrupts Dopamine Homeostasis and Increases Feeding. PLoS One. 2011;6(9):e25169. doi: 10.1371/journal.pone.0025169. [DOI] [PMC free article] [PubMed] [Google Scholar]
- 20.Hryhorczuk C, et al. Dampened Mesolimbic Dopamine Function and Signaling by Saturated but not Monounsaturated Dietary Lipids. Neuropsychopharmacology. 2016;41(3):811–21. doi: 10.1038/npp.2015.207. [DOI] [PMC free article] [PubMed] [Google Scholar]
- 21.Banks WA, Owen JB, Erickson MA. Insulin in the brain: there and back again. Pharmacol Ther. 2012;136(1):82–93. doi: 10.1016/j.pharmthera.2012.07.006. [DOI] [PMC free article] [PubMed] [Google Scholar]
- 22.Stouffer MA, et al. Insulin enhances striatal dopamine release by activating cholinergic interneurons and thereby signals reward. Nat Commun. 2015;6:8543. doi: 10.1038/ncomms9543. [DOI] [PMC free article] [PubMed] [Google Scholar]
- 23.Strubbe JH, Porte D, Jr, Woods SC. Insulin responses and glucose levels in plasma and cerebrospinal fluid during fasting and refeeding in the rat. Physiol Behav. 1988;44(2):205–8. doi: 10.1016/0031-9384(88)90139-4. [DOI] [PubMed] [Google Scholar]
- 24.Banks WA. The source of cerebral insulin. Eur J Pharmacol. 2004;490(1–3):5–12. doi: 10.1016/j.ejphar.2004.02.040. [DOI] [PubMed] [Google Scholar]
- 25.Carvelli L, et al. PI 3-kinase regulation of dopamine uptake. J Neurochem. 2002;81(4):859–869. doi: 10.1046/j.1471-4159.2002.00892.x. [DOI] [PubMed] [Google Scholar]
- 26.Garcia BG, et al. Akt is essential for insulin modulation of amphetamine-induced human dopamine transporter cell-surface redistribution. Mol Pharmacol. 2005;68(1):102–109. doi: 10.1124/mol.104.009092. [DOI] [PubMed] [Google Scholar]
- 27.Wu Q, et al. Determination of release and uptake parameters from electrically evoked dopamine dynamics measured by real-time voltammetry. J Neurosci Methods. 2001;112(2):119–133. doi: 10.1016/s0165-0270(01)00459-9. [DOI] [PubMed] [Google Scholar]
- 28.Schulingkamp RJ, et al. Insulin receptors and insulin action in the brain: review and clinical implications. Neurosci Biobehav Rev. 2000;24(8):855–72. doi: 10.1016/s0149-7634(00)00040-3. [DOI] [PubMed] [Google Scholar]
- 29.Levin BE, Keesey RE. Defense of differing body weight set points in diet-induced obese and resistant rats. Am J Physiol. 1998;274(2 Pt 2):R412–9. doi: 10.1152/ajpregu.1998.274.2.R412. [DOI] [PubMed] [Google Scholar]
- 30.Carr KD, Kim GY, Cabeza dV. Rewarding and locomotor-activating effects of direct dopamine receptor agonists are augmented by chronic food restriction in rats. Psychopharmacology (Berl) 2001;154(4):420–428. doi: 10.1007/s002130000674. [DOI] [PubMed] [Google Scholar]
- 31.Zhen J, Reith ME, Carr KD. Chronic food restriction and dopamine transporter function in rat striatum. Brain Res. 2006;1082(1):98–101. doi: 10.1016/j.brainres.2006.01.094. [DOI] [PubMed] [Google Scholar]
- 32.Zhen J, et al. Interaction between a hydroxypiperidine analogue of 4-(2-benzhydryloxy-ethyl)-1-(4-fluorobenzyl)piperidine and Aspartate 68 in the human dopamine transporter. Eur J Pharmacol. 2004;506(1):17–26. doi: 10.1016/j.ejphar.2004.10.028. [DOI] [PubMed] [Google Scholar]
- 33.Hollingsworth EB, et al. Biochemical characterization of a filtered synaptoneurosome preparation from guinea pig cerebral cortex: cyclic adenosine 3’:5’-monophosphate-generating systems, receptors, and enzymes. J Neurosci. 1985;5(8):2240–2253. doi: 10.1523/JNEUROSCI.05-08-02240.1985. [DOI] [PMC free article] [PubMed] [Google Scholar]
- 34.Villasana LE, Klann E, Tejada-Simon MV. Rapid isolation of synaptoneurosomes and postsynaptic densities from adult mouse hippocampus. J Neurosci Methods. 2006;158(1):30–6. doi: 10.1016/j.jneumeth.2006.05.008. [DOI] [PMC free article] [PubMed] [Google Scholar]
- 35.Hagan CE, Neumaier JF, Schenk JO. Rotating disk electrode voltammetric measurements of serotonin transporter kinetics in synaptosomes. J Neurosci Methods. 2010;193(1):29–38. doi: 10.1016/j.jneumeth.2010.08.009. [DOI] [PMC free article] [PubMed] [Google Scholar]
- 36.Cragg S, Rice ME, Greenfield SA. Heterogeneity of electrically evoked dopamine release and reuptake in substantia nigra, ventral tegmental area, and striatum. J Neurophysiol. 1997;77(2):863–873. doi: 10.1152/jn.1997.77.2.863. [DOI] [PubMed] [Google Scholar]
- 37.Keller CM, et al. Biphasic dopamine regulation in mesoaccumbens pathway in response to non-contingent binge and escalating methamphetamine regimens in the Wistar rat. Psychopharmacology (Berl) 2011;215(3):513–26. doi: 10.1007/s00213-011-2301-9. [DOI] [PubMed] [Google Scholar]
- 38.Chen BT, Rice ME. Novel Ca2+ dependence and time course of somatodendritic dopamine release: substantia nigra versus striatum. J Neurosci. 2001;21(19):7841–7847. doi: 10.1523/JNEUROSCI.21-19-07841.2001. [DOI] [PMC free article] [PubMed] [Google Scholar]
- 39.Hoffman AF, Lupica CR, Gerhardt GA. Dopamine transporter activity in the substantia nigra and striatum assessed by high-speed chronoamperometric recordings in brain slices. J Pharmacol Exp Ther. 1998;287(2):487–96. [PubMed] [Google Scholar]
- 40.Marshall JF, et al. Dopamine high-affinity transport site topography in rat brain: major differences between dorsal and ventral striatum. Neuroscience. 1990;37(1):11–21. doi: 10.1016/0306-4522(90)90187-9. [DOI] [PubMed] [Google Scholar]
- 41.Coulter CL, et al. Localization and quantification of the dopamine transporter: comparison of [3H]WIN 35,428 and [125I]RTI-55. Brain Res. 1995;690(2):217–24. doi: 10.1016/0006-8993(95)00614-v. [DOI] [PubMed] [Google Scholar]
- 42.Wightman RM, et al. Real-time characterization of dopamine overflow and uptake in the rat striatum. Neuroscience. 1988;25:513–523. doi: 10.1016/0306-4522(88)90255-2. [DOI] [PubMed] [Google Scholar]
- 43.Patterson TA, et al. Food deprivation decreases mRNA and activity of the rat dopamine transporter. Neuroendocrinology. 1998;68(1):11–20. doi: 10.1159/000054345. [DOI] [PubMed] [Google Scholar]
- 44.Meiergerd SM, Hooks SM, Schenk JO. The striatal transporter for dopamine in the rat may be kinetically up-regulated following 3 weeks of withdrawal from cocaine self-administration. J Neurochem. 1994;63:1277–1281. doi: 10.1046/j.1471-4159.1994.63041277.x. [DOI] [PubMed] [Google Scholar]
- 45.McElvain JS, Schenk JO. A multisubstrate mechanism of striatal dopamine uptake and its inhibition by cocaine. Biochem Pharmacol. 1992;43:2189–2199. doi: 10.1016/0006-2952(92)90178-l. [DOI] [PubMed] [Google Scholar]
- 46.Earles C, Schenk JO. Rotating disk electrode voltammetric measurements of dopamine transporter activity: an analytical evaluation [In Process Citation] Anal Biochem. 1998;264(2):191–198. doi: 10.1006/abio.1998.2850. [DOI] [PubMed] [Google Scholar]
- 47.Chiu VM, et al. Mass transport at rotating disk electrodes: effects of synthetic particles and nerve endings. Anal Biochem. 2011;418(1):58–65. doi: 10.1016/j.ab.2011.07.003. [DOI] [PubMed] [Google Scholar]
- 48.Chen N, Zhen J, Reith MEA. Mutation of Trp84 and Asp313 of the dopamine transporter reveals similar mode of binding interaction for GBR 12909 and benztropine as opposed to cocaine. J Neurochem. 2004;89:853–864. doi: 10.1111/j.1471-4159.2004.02386.x. [DOI] [PubMed] [Google Scholar]
- 49.Owens WA, et al. Rescue of dopamine transporter function in hypoinsulinemic rats by a D2 receptor-ERK-dependent mechanism. J Neurosci. 2012;32(8):2637–47. doi: 10.1523/JNEUROSCI.3759-11.2012. [DOI] [PMC free article] [PubMed] [Google Scholar]
- 50.Bolan EA, et al. D2 receptors regulate dopamine transporter function via an extracellular signal-regulated kinases 1 and 2-dependent and phosphoinositide 3 kinase-independent mechanism. Mol Pharmacol. 2007;71(5):1222–1232. doi: 10.1124/mol.106.027763. [DOI] [PubMed] [Google Scholar]
- 51.Lee FJ, et al. Dopamine transporter cell surface localization facilitated by a direct interaction with the dopamine D2 receptor. Embo j. 2007;26(8):2127–36. doi: 10.1038/sj.emboj.7601656. [DOI] [PMC free article] [PubMed] [Google Scholar]
- 52.Mayfield RD, Zahniser NR. Dopamine D2 receptor regulation of the dopamine transporter expressed in Xenopus laevis oocytes is voltage-independent. Mol Pharmacol. 2001;59(1):113–121. doi: 10.1124/mol.59.1.113. [DOI] [PubMed] [Google Scholar]
- 53.Siciliano CA, Calipari ES, Jones SR. Amphetamine potency varies with dopamine uptake rate across striatal subregions. J Neurochem. 2014;131(3):348–55. doi: 10.1111/jnc.12808. [DOI] [PMC free article] [PubMed] [Google Scholar]
- 54.Kokoshka JM, et al. Nature of methamphetamine-induced rapid and reversible changes in dopamine transporters. Eur J Pharmacol. 1998;361(2–3):269–275. doi: 10.1016/s0014-2999(98)00741-9. [DOI] [PubMed] [Google Scholar]
- 55.Gulley JM, Doolen S, Zahniser NR. Brief, repeated exposure to substrates down-regulates dopamine transporter function in Xenopus oocytes in vitro and rat dorsal striatum in vivo. J Neurochem. 2002;83(2):400–411. doi: 10.1046/j.1471-4159.2002.01133.x. [DOI] [PubMed] [Google Scholar]
- 56.Richards TL, Zahniser NR. Rapid substrate-induced down-regulation in function and surface localization of dopamine transporters: rat dorsal striatum versus nucleus accumbens. J Neurochem. 2009;108(6):1575–84. doi: 10.1111/j.1471-4159.2009.05910.x. [DOI] [PMC free article] [PubMed] [Google Scholar]
- 57.Owens WA, et al. Deficits in dopamine clearance and locomotion in hypoinsulinemic rats unmask novel modulation of dopamine transporters by amphetamine. J Neurochem. 2005;94(5):1402–1410. doi: 10.1111/j.1471-4159.2005.03289.x. [DOI] [PubMed] [Google Scholar]
- 58.Williams JM, et al. Hypoinsulinemia regulates amphetamine-induced reverse transport of dopamine. PLoS Biol. 2007;5(10):e274. doi: 10.1371/journal.pbio.0050274. [DOI] [PMC free article] [PubMed] [Google Scholar]
- 59.Lindblom J, et al. Increased mRNA levels of tyrosine hydroxylase and dopamine transporter in the VTA of male rats after chronic food restriction. Eur J Neurosci. 2006;23(1):180–186. doi: 10.1111/j.1460-9568.2005.04531.x. [DOI] [PubMed] [Google Scholar]
- 60.Bello NT, et al. Restricted feeding with scheduled sucrose access results in an upregulation of the rat dopamine transporter. Am J Physiol Regul Integr Comp Physiol. 2003;284(5):R1260–R1268. doi: 10.1152/ajpregu.00716.2002. [DOI] [PubMed] [Google Scholar]
- 61.Cone JJ, et al. Prolonged high fat diet reduces dopamine reuptake without altering DAT gene expression. PLoS One. 2013;8(3):e58251. doi: 10.1371/journal.pone.0058251. [DOI] [PMC free article] [PubMed] [Google Scholar]
- 62.Narayanaswami V, et al. Diet-induced obesity: dopamine transporter function, impulsivity and motivation. Int J Obes (Lond) 2013;37(8):1095–103. doi: 10.1038/ijo.2012.178. [DOI] [PMC free article] [PubMed] [Google Scholar]
- 63.Madsen AN, et al. Long-term characterization of the diet-induced obese and diet-resistant rat model: a polygenetic rat model mimicking the human obesity syndrome. J Endocrinol. 2010;206(3):287–96. doi: 10.1677/JOE-10-0004. [DOI] [PubMed] [Google Scholar]
- 64.Woods CA, et al. Insulin receptor activation in the nucleus accumbens reflects nutritive value of a recently ingested meal. Physiol Behav. 2016;159:52–63. doi: 10.1016/j.physbeh.2016.03.013. [DOI] [PMC free article] [PubMed] [Google Scholar]
- 65.Zahniser NR, Sorkin A. Rapid regulation of the dopamine transporter: role in stimulant addiction? Neuropharmacology. 2004;47(Suppl 1):80–91. doi: 10.1016/j.neuropharm.2004.07.010. [DOI] [PubMed] [Google Scholar]
- 66.Kahlig KM, Javitch JA, Galli A. Amphetamine regulation of dopamine transport: Combined measurements of transporter currents and transporter imaging support the endocytosis of an active carrier. J Biol Chem. 2003 doi: 10.1074/jbc.M303976200. [DOI] [PubMed] [Google Scholar]
- 67.Melikian HE. Neurotransmitter transporter trafficking: endocytosis, recycling, and regulation. Pharmacol Ther. 2004;104(1):17–27. doi: 10.1016/j.pharmthera.2004.07.006. [DOI] [PubMed] [Google Scholar]
- 68.Daws LC, et al. Insulin signaling and addiction. Neuropharmacology. 2011;61(7):1123–8. doi: 10.1016/j.neuropharm.2011.02.028. [DOI] [PMC free article] [PubMed] [Google Scholar]
- 69.Meiergerd SM, Patterson TA, Schenk JO. D2 receptors may modulate the function of the striatal transporter for dopamine: kinetic evidence from studies in vitro and in vivo. J Neurochem. 1993;61:764–767. doi: 10.1111/j.1471-4159.1993.tb02185.x. [DOI] [PubMed] [Google Scholar]
- 70.Moron JA, et al. Mitogen-activated protein kinase regulates dopamine transporter surface expression and dopamine transport capacity. J Neurosci. 2003;23(24):8480–8488. doi: 10.1523/JNEUROSCI.23-24-08480.2003. [DOI] [PMC free article] [PubMed] [Google Scholar]
- 71.Ford CP. The role of D2-autoreceptors in regulating dopamine neuron activity and transmission. Neuroscience. 2014;282:13–22. doi: 10.1016/j.neuroscience.2014.01.025. [DOI] [PMC free article] [PubMed] [Google Scholar]
- 72.Baik JH. Dopamine signaling in food addiction: role of dopamine D2 receptors. BMB Rep. 2013;46(11):519–26. doi: 10.5483/BMBRep.2013.46.11.207. [DOI] [PMC free article] [PubMed] [Google Scholar]
- 73.Naef L, Pitman KA, Borgland SL. Mesolimbic dopamine and its neuromodulators in obesity and binge eating. CNS Spectr. 2015;20(6):574–83. doi: 10.1017/S1092852915000693. [DOI] [PubMed] [Google Scholar]
- 74.Carr KD, et al. Evidence of increased dopamine receptor signaling in food-restricted rats. Neuroscience. 2003;119(4):1157–1167. doi: 10.1016/s0306-4522(03)00227-6. [DOI] [PubMed] [Google Scholar]
- 75.Collins GT, et al. Food restriction alters N’-propyl-4,5,6,7-tetrahydrobenzothiazole-2,6-diamine dihydrochloride (pramipexole)-induced yawning, hypothermia, and locomotor activity in rats: evidence for sensitization of dopamine D2 receptor-mediated effects. J Pharmacol Exp Ther. 2008;325(2):691–7. doi: 10.1124/jpet.107.133181. [DOI] [PMC free article] [PubMed] [Google Scholar]
- 76.Thanos PK, et al. Food restriction markedly increases dopamine D2 receptor (D2R) in a rat model of obesity as assessed with in-vivo muPET imaging ([11C] raclopride) and in-vitro ([3H] spiperone) autoradiography. Synapse. 2008;62(1):50–61. doi: 10.1002/syn.20468. [DOI] [PubMed] [Google Scholar]
- 77.Colantuoni C, et al. Excessive sugar intake alters binding to dopamine and mu-opioid receptors in the brain. NeuroReport. 2001;12(16):3549–3552. doi: 10.1097/00001756-200111160-00035. [DOI] [PubMed] [Google Scholar]
- 78.Hajnal A, Margas WM, Covasa M. Altered dopamine D2 receptor function and binding in obese OLETF rat. Brain Res Bull. 2008;75(1):70–6. doi: 10.1016/j.brainresbull.2007.07.019. [DOI] [PMC free article] [PubMed] [Google Scholar]
- 79.Fordahl SC, Locke JL, Jones SR. High fat diet augments amphetamine sensitization in mice: Role of feeding pattern, obesity, and dopamine terminal changes. Neuropharmacology. 2016;109:170–82. doi: 10.1016/j.neuropharm.2016.06.006. [DOI] [PMC free article] [PubMed] [Google Scholar]
- 80.Di Chiara G, Imperato A. Drugs abused by humans preferentially increase synaptic dopamine concentrations in the mesolimbic system of freely moving rats. Proc Natl Acad Sci U S A. 1988;85(14):5274–8. doi: 10.1073/pnas.85.14.5274. [DOI] [PMC free article] [PubMed] [Google Scholar]
- 81.Kelley AE, Berridge KC. The neuroscience of natural rewards: relevance to addictive drugs. J Neurosci. 2002;22(9):3306–3311. doi: 10.1523/JNEUROSCI.22-09-03306.2002. [DOI] [PMC free article] [PubMed] [Google Scholar]
- 82.Volkow ND, Wise RA. How can drug addiction help us understand obesity? Nature neuroscience. 2005;8(5):555–560. doi: 10.1038/nn1452. [DOI] [PubMed] [Google Scholar]
- 83.Roitman MF, et al. Dopamine operates as a subsecond modulator of food seeking. J Neurosci. 2004;24(6):1265–1271. doi: 10.1523/JNEUROSCI.3823-03.2004. [DOI] [PMC free article] [PubMed] [Google Scholar]
- 84.Kelley AE. Ventral striatal control of appetitive motivation: role in ingestive behavior and reward-related learning. Neurosci Biobehav Rev. 2004;27(8):765–76. doi: 10.1016/j.neubiorev.2003.11.015. [DOI] [PubMed] [Google Scholar]
- 85.Vogt MC, Bruning JC. CNS insulin signaling in the control of energy homeostasis and glucose metabolism - from embryo to old age. Trends Endocrinol Metab. 2013;24(2):76–84. doi: 10.1016/j.tem.2012.11.004. [DOI] [PubMed] [Google Scholar]
- 86.Grillner S, Robertson B, Stephenson-Jones M. The evolutionary origin of the vertebrate basal ganglia and its role in action selection. J Physiol. 2013;591(22):5425–31. doi: 10.1113/jphysiol.2012.246660. [DOI] [PMC free article] [PubMed] [Google Scholar]
- 87.Everitt BJ, Robbins TW. Neural systems of reinforcement for drug addiction: from actions to habits to compulsion. Nat Neurosci. 2005;8(11):1481–9. doi: 10.1038/nn1579. [DOI] [PubMed] [Google Scholar]
- 88.Koob GF, Volkow ND. Neurocircuitry of addiction. Neuropsychopharmacology. 2010;35(1):217–38. doi: 10.1038/npp.2009.110. [DOI] [PMC free article] [PubMed] [Google Scholar]
- 89.Volkow ND, et al. Cocaine cues and dopamine in dorsal striatum: mechanism of craving in cocaine addiction. J Neurosci. 2006;26(24):6583–8. doi: 10.1523/JNEUROSCI.1544-06.2006. [DOI] [PMC free article] [PubMed] [Google Scholar]
- 90.wang GJ, et al. Brain dopamine and obesity. Lancet. 2001;357(9253):354–357. doi: 10.1016/s0140-6736(00)03643-6. [DOI] [PubMed] [Google Scholar]
Associated Data
This section collects any data citations, data availability statements, or supplementary materials included in this article.