Abstract
In the phase 3 LYM-3002 study comparing intravenous VR-CAP with R-CHOP in patients with newly-diagnosed, measurable stage II-IV mantle cell lymphoma, not considered or ineligible for transplant, the median progression-free survival was significantly improved with VR-CAP (24.7 versus 14.4 months with R-CHOP; P<0.001). This post-hoc analysis evaluated the association between the improved outcomes and quality of responses achieved with VR-CAP versus R-CHOP in LYM-3002. Patients were randomized to six to eight 21-day cycles of VR-CAP or R-CHOP. Outcomes included progression-free survival, duration of response (both assessed by an independent review committee), and time to next anti-lymphoma treatment, evaluated by response (complete response/unconfirmed complete response and partial response), MIPI risk status, and maximum reduction of lymph-node measurements expressed as the sum of the product of the diameters. Within each response category, the median progression-free survival was longer for patients given VR-CAP than for those given R-CHOP (complete response/unconfirmed complete response: 40.9 versus 19.8 months; partial response: 17.1 versus 11.7 months, respectively); similarly, the median time to next anti-lymphoma treatment was longer among the patients given VR-CAP than among those treated with R-CHOP (complete response/unconfirmed complete response: not evaluable versus 26.6 months; partial response: 35.3 versus 24.3 months). Within the complete/unconfirmed complete and partial response categories, improvements in progression-free survival, duration of response and time to next anti-lymphoma treatment were more pronounced in patients with low-and intermediate-risk MIPI treated with VR-CAP than with R-CHOP. In each response category, more VR-CAP than R-CHOP patients had a sum of the product of the diameters nadir of 0 during serial radiological assessments. Results of this post-hoc analysis suggest a greater duration and quality of response in patients treated with VR-CAP in comparison with those treated with R-CHOP, with the improvements being more evident in patients with low- and intermediate-risk MIPI. LYM-3002 ClinicalTrials.gov: NCT00722137.
Introduction
Mantle cell lymphoma (MCL) is an aggressive and generally incurable form of non-Hodgkin lymphoma that is responsible for approximately 4.3–5% of new cases of non-Hodgkin lymphoma.1–3 Prognosis is poor for patients with MCL, with 5-year relative survival rates of about 30%.2 Rituximab plus cyclophosphamide, doxorubicin, vincristine, and prednisone (R-CHOP) represents a standard of care for the treatment of newly-diagnosed patients with MCL who are considered ineligible for intensive therapy and stem cell transplantation.4 Complete response/unconfirmed complete response (CR/CRu) rates of up to 48% have been demonstrated with R-CHOP in this population of patients.5 However, progression-free survival (PFS) in the study achieving this result was limited (median 16.6 months).6
VR-CAP (bortezomib, rituximab, cyclophosphamide, doxorubicin, and prednisone), which substitutes bortezomib for vincristine in R-CHOP, has been approved by regulatory agencies in the USA, European Union and Japan for the treatment of MCL.7–9 This recommendation is based on findings from the randomized, phase 3 LYM-3002 study (NCT00722137), which evaluated the efficacy and safety of VR-CAP compared with R-CHOP in patients with newly diagnosed, measurable stage II, III or IV MCL who were ineligible or not considered for stem cell transplantation.
Results from the primary analysis of LYM-3002 demonstrated a 59% improvement in median independent radiology review committee-assessed PFS with VR-CAP compared with R-CHOP [24.7 versus 14.4 months, respectively; hazard ratio (HR) 0.63; 95% confidence interval (CI): 0.50–0.79; P<0.001], and a 96% improvement in investigator-assessed PFS (median 30.7 versus 16.1 months, respectively; HR 0.51; 95% CI: 0.41–0.65; P<0.001).10 Significant and clinically important improvements in secondary efficacy endpoints were also demonstrated with VR-CAP compared with R-CHOP, including higher CR/CRu rate (53% versus 42%; P=0.007), longer median time to next anti-lymphoma therapy (TTNT; 44.5 versus 24.8 months; P<0.001; HR 0.50), longer median duration of CR/Cru (42.1 versus 18.0 months), and longer median duration of overall response (DOR; 36.5 versus 15.1 months). Overall response rates were high and were similar with the two regimens (92% versus 89% for VR-CAP versus R-CHOP, respectively). Patients receiving VR-CAP experienced higher rates of toxic effects than those receiving R-CHOP, including increased frequencies of grade ≥3 thrombocytopenia (57% versus 6%), neutropenia (85% versus 67%), leukopenia (44% versus 29%), lymphocytopenia (28% versus 9%), and infections/infestations (21% versus 14%). However, there were no significant effects on the number of completed cycles, median dose intensity for drugs common to both regimens, or rates of discontinuations or deaths related to adverse events.10
These results suggest that the difference between the two regimens in terms of response quality (i.e. DOR, PFS, and TTNT) was more pronounced than the difference in response rates. We hypothesized that the improved outcomes seen with VR-CAP were more closely related to response quality (duration, depth) than simply CR/CRu rates. We therefore conducted a post-hoc analysis of the LYM-3002 study10 to evaluate the association between response, response quality and outcomes for VR-CAP compared with R-CHOP.
Methods
The details of the design of the LYM-3002 study have been described previously;10 a brief overview is given in the Online Supplementary Material. The trial protocol was approved by local ethics committees/institutional review boards. All patients provided written informed consent prior to the commencement of the study.
Procedures
Computed tomography (CT) scans were performed every 6 weeks during treatment, and every 6–8 weeks during follow-up, until disease progression, study discontinuation, initiation of alternative therapy, or death. By central radiology acquisition guidelines, slide thicknesses for helical and conventional CT scans were 5 mm and 7–10 mm for the chest, abdomen, and pelvis, and 3 mm and 5 mm for the neck, respectively. All CT results were assessed by a blinded independent radiology review committee and by investigators, using modified International Workshop to Standardize Response Criteria (IWRC) for Non-Hodgkin Lymphoma.11 For each patient, up to ten measurable sites of disease at baseline (clearly measurable in 2 perpendicular dimensions, >1.5 cm in the long axis, >1.0 cm in the short axis) were tracked. At each follow-up, the sum of the product of the diameters (SPD) was calculated (i.e., the sum of the long axis and short axis of all measureable sites). Lesions that became smaller than 5 mm × 5 mm were recorded as ‘too small to measure’, and given a default value of 0 mm × 0 mm (SPD nadir of 0). All other sites of disease were considered assessable (including objective evidence of disease identified by radiological imaging, physical examination, or other procedures as necessary) but were not measurable. Adverse events were graded using the National Cancer Institute’s Common Terminology Criteria for Adverse Events (NCI-CTCAE) version 3.0.
Outcomes
Endpoints assessed in this post-hoc analysis were PFS, DOR, and TTNT. Outcomes were stratified by response category [CR/CRu and partial response (PR); defined in the Online Supplementary Material and MCL International Prognostic Index (MIPI) risk status.12,13 Overall response rate was defined as CR plus CRu plus PR. Depth of response was evaluated by measuring the maximum reduction in measurable lymph nodes from baseline, as assessed by CT, expressed as the SPD, and provided by the independent radiology review committee. Of note, achievement of an SPD nadir of 0 was not a prerequisite for achievement of CR or CRu, thus patients could meet the criteria for CR/CRu yet not achieve an SPD of 0. Equally, a patient with an SPD of 0 who did not otherwise meet the criteria for CR/CRu, or those with CR/CRu who did not have bone marrow/lactate dehydrogenase confirmation, would be classified as having a PR. An additional analysis was conducted investigating CR and CRu as individual categories. For this post-hoc analysis, response, DOR, and PFS were based on assessment by the independent review committee. At the time of analysis, overall survival data were immature (the median overall survival in the VR-CAP arm was not estimable) and thus are not included.
Statistical analysis
All efficacy analyses were performed on the intention-to-treat population, except for response endpoints (analyzed in the response-evaluable population). Time-to-event distributions were estimated using Kaplan-Meier methodology, with log-rank tests and Cox models (alpha=0.05, 2-sided) used for inter-arm comparisons of time-to-event endpoints. A stratified Cochran-Mantel-Haenszel chi-square test with International Prognostic Index and disease stage as stratification factors was used to assess between-group differences.
Results
Patients
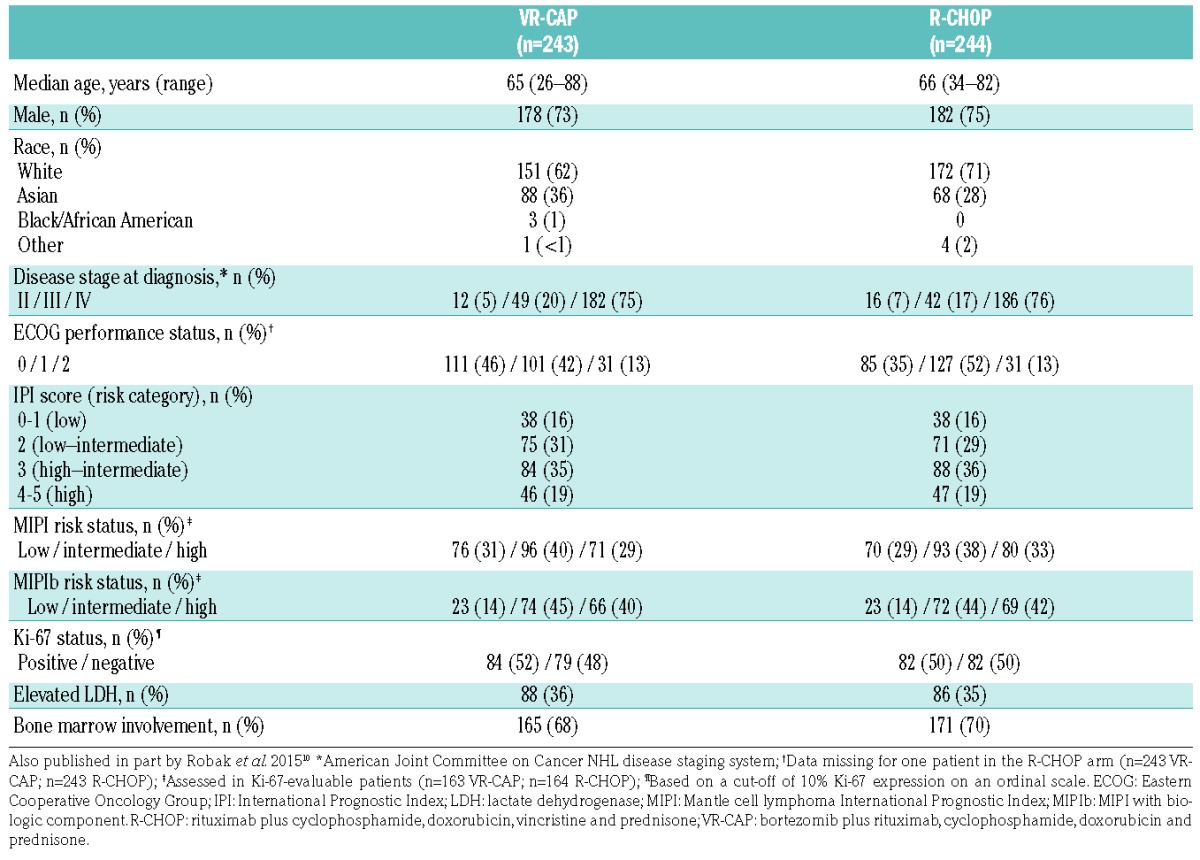
Between May 2008 and December 2011, 487 patients (243 treated with VR-CAP; 244 treated with R-CHOP) from 128 centers in 28 countries were randomized into LYM-3002, with 457 patients (229 VR-CAP; 228 R-CHOP) evaluable for response. In the overall population, the demographic and baseline characteristics of the patients were generally well balanced between the two arms (Table 1).
Table 1.
Patients’ demographics and baseline characteristics.
Outcomes stratified by response category
When time-to-event outcomes were stratified according to response category (CR/CRu and PR), PFS was longer with VR-CAP than with R-CHOP in patients achieving CR/CRu (median 40.9 versus 19.8 months, respectively) and in those achieving PR (median 17.1 versus 11.7 months, respectively) (Figure 1A). Similarly, TTNT was longer with VR-CAP versus R-CHOP in patients achieving CR/CRu (median not evaluable versus 26.6 months, respectively) and PR (median 35.3 versus 24.3 months, respectively) (Figure 1B). DOR was also prolonged with VR-CAP compared with R-CHOP in patients achieving CR/CRu (42.1 versus 18.5 months, respectively) and PR (20.2 versus 9.6 months, respectively) (Figure 1C). Across all time-to-event outcomes, outcomes appeared similar between patients receiving VR-CAP who achieved PR and those seen in patients receiving R-CHOP who achieved CR/CRu.
Figure 1.
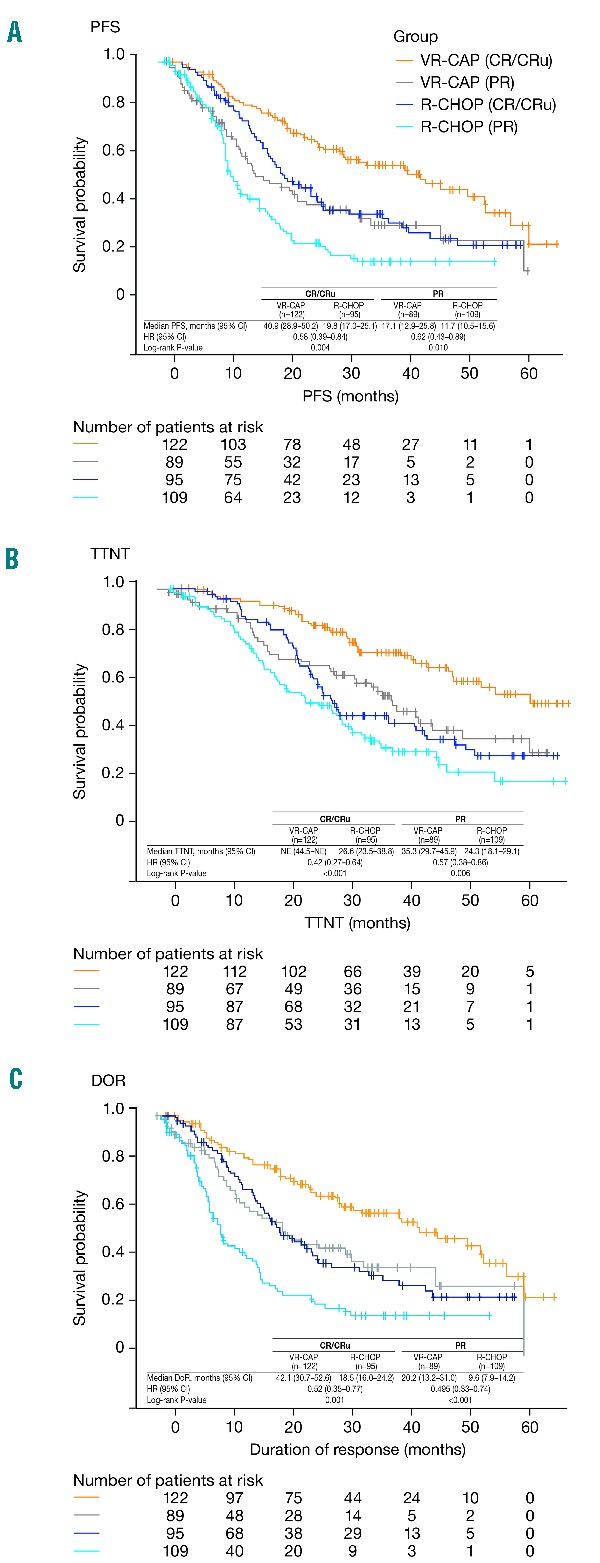
Time-to-event outcomes for VR-CAP and R-CHOP by response category. (A) PFS assessed by the independent radiology review committee, (B) TTNT, and (C) DOR.
Median times to first evidence of ≥PR (VR-CAP: 42 days, R-CHOP: 47 days) in patients who achieved a response, and median times to CR/CRu (VR-CAP: 82 days, R-CHOP: 84 days) in patients who achieved CR/CRu appeared similar in the VR-CAP and R-CHOP arms.
Within the CR/CRu and PR response categories, prolongation of time-to-event outcomes – PFS (Figure 2), TTNT (Online Supplementary Figure S1) and DOR (Online Supplementary Figure S2) – with VR-CAP compared with R-CHOP were more pronounced in low- and intermediate-risk MIPI patients. In contrast, the treatment effect was less apparent in patients with high-risk MIPI scores.
Figure 2.
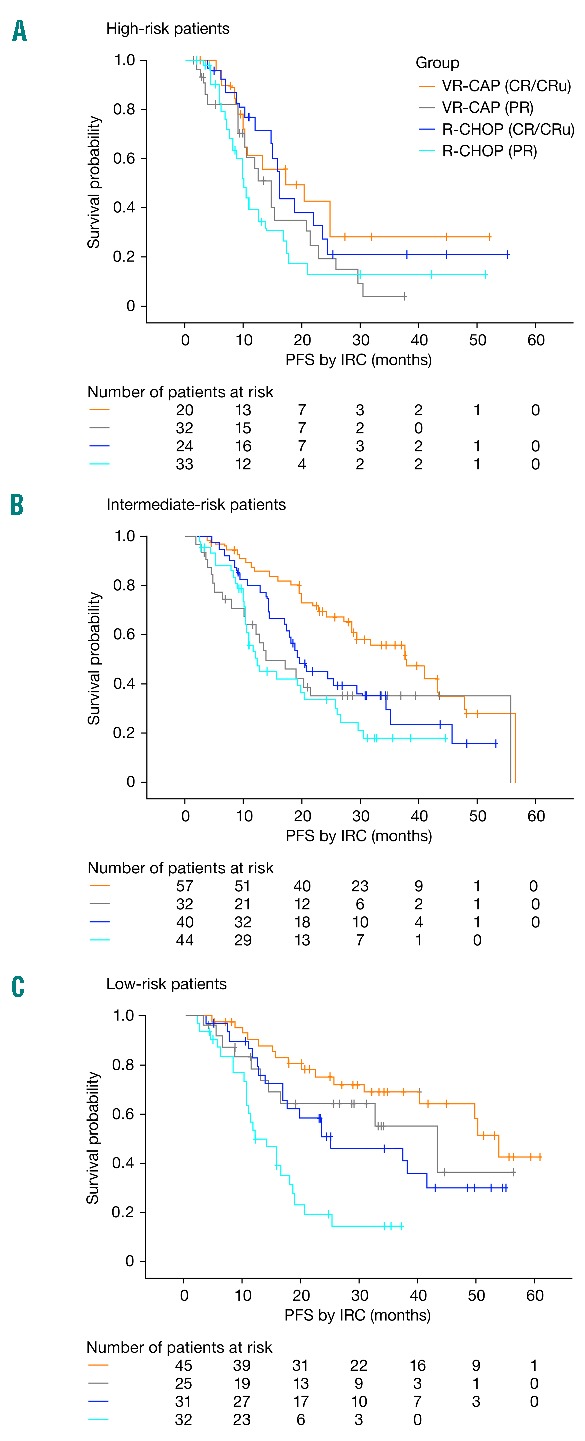
Progression-free survival according to MIPI risk status. (A) High-risk patients, (B) intermediate-risk patients, (C) low-risk patients.
An analysis of response in which CR, CRu and PR were considered separately was also performed. This analysis indicated that results in patients achieving CRu were closer to those reported in patients achieving PR than to those in patients achieving CR (Figure 3A). Excluding patients who achieved CRu from the combined CR/CRu category resulted in a longer median DOR (CR: 48.6 versus 23.1 months for VR-CAP and R-CHOP patients, respectively). When considering CRu and PR patients together, their median DOR was shorter than that of PR patients alone (CRu/PR: 18.8 versus 9.5 months for VR-CAP and R-CHOP patients, respectively) (Figure 3B).
Figure 3.
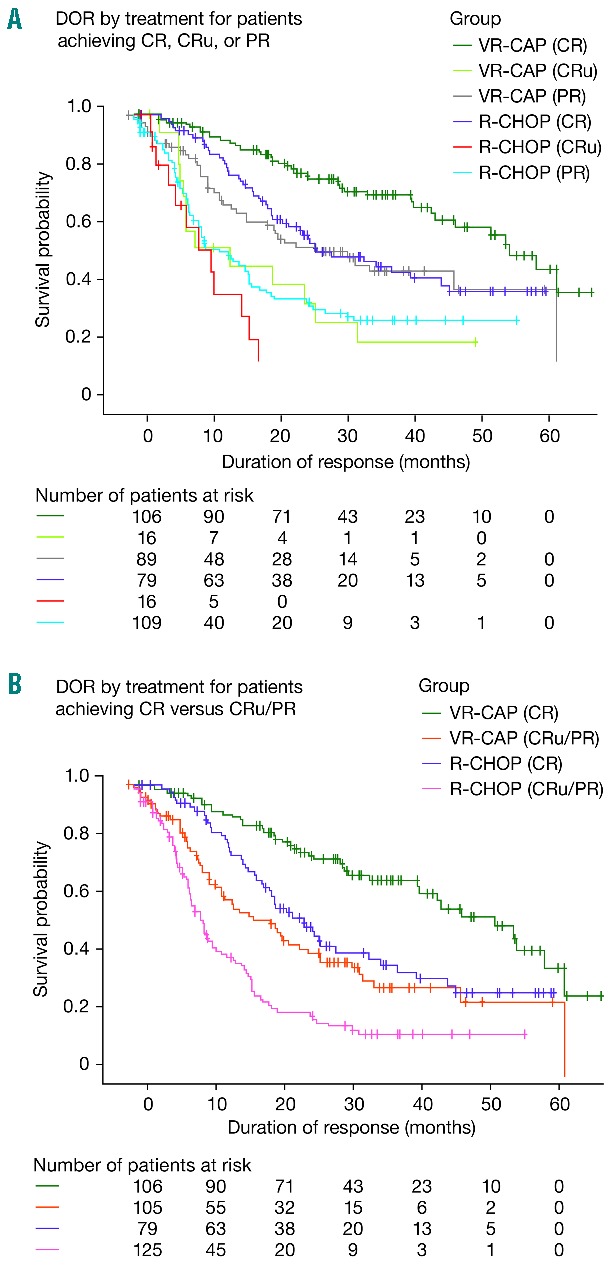
Duration of response according to type of response. (A) CR, CRu or PR, (B) CR versus CRu/PR.
Depth of response: change in nadir of the sum of the product of the diameters
To further elucidate factors within each response category that could contribute to the ‘quality of response’ potentially driving differences in long-term outcomes between the VR-CAP and R-CHOP treatment groups, we investigated the maximum reduction, measured by CT scan, of the size of the measurable lymph node lesions chosen at baseline. Based on the default value for lesions recorded as ‘too small to measure’ being set as 0 mm × 0 mm, patients in whom all measurable lesions became ‘too small to measure’ were also referred to as having a SPD nadir of 0.
Within each response category (CR, CRu and PR), the reduction in lymph node measurements was more pronounced in patients who received VR-CAP compared with that in patients who received R-CHOP (Table 2, Figure 4). The percentage of patients with CR in whom all measurable baseline lesions became ‘too small to measure’ was 79% for VR-CAP and 68% for R-CHOP, with similar observations made for the CR/CRu category (72% and 59%, respectively). Among the patients who achieved a PR, all measurable baseline lesions became ‘too small to measure’ in 48% of those treated with VR-CAP and 28% of those treated with R-CHOP.
Table 2.
Patients achieving a sum of the product of the diameters nadir of 0 (lesions absent or ‘too small to measure’ by computed tomograpy scan).

Figure 4.
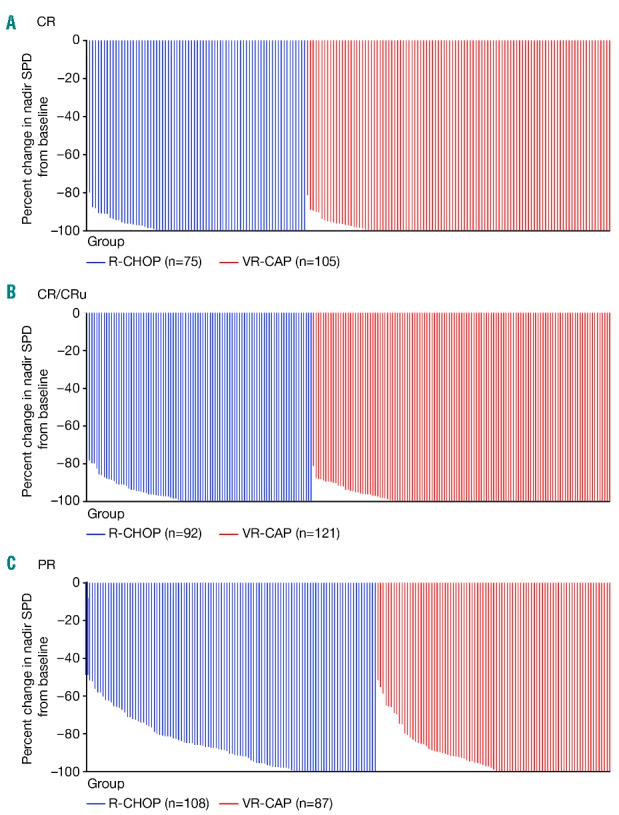
Percentage change in sum of the product of the diameters nadir from baseline by response category. The default value for lesions ‘too small to measure’ was 0 mm × 0 mm. (A) Patients with CR, (B) patients with CR/CRu, (C) patients with PR.
Patients with a CR in whom all measurable lesions became ‘too small to measure’ had a longer PFS than those in whom at least one measurable lesion could still be determined (e.g. lymph nodes had regressed to normal size but were still measurable, while all other criteria for CR were met) (Figure 5A). Similar patterns were observed for TTNT and DOR (data not shown).
Figure 5.
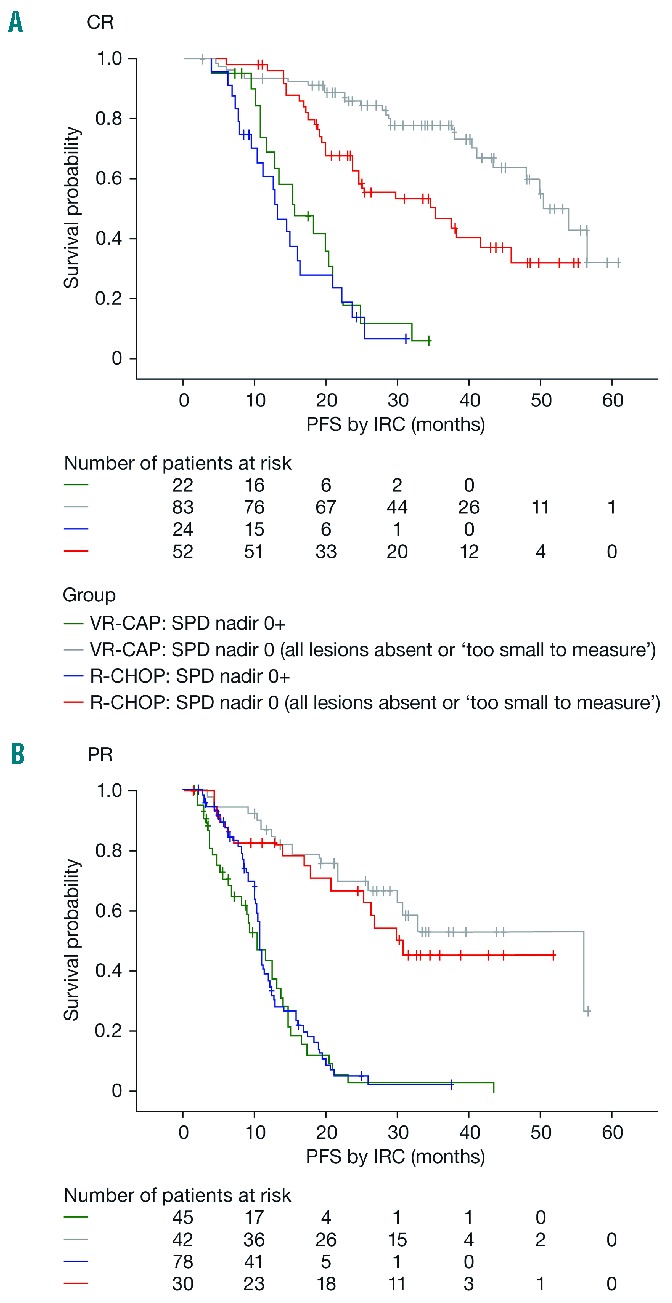
Progression-free survival assessed by the independent radiology review committee. PFS according to reduction in baseline lesions expressed as SPD in patients with (A) CR and (B) PR.
Patients with a PR in whom all measurable lesions became ‘too small to measure’ had a longer PFS than those who had residual measurable lesions (Figure 5B). This observation was equally present in both treatment groups. Similar patterns were observed for TTNT and DOR (data not shown).
We also analyzed the achievement of an SPD nadir of 0 according to MIPI risk status (Online Supplementary Table S1). In patients with low- and intermediate-risk MIPI receiving VR-CAP, 76% and 77% of patients with CR/CRu, respectively, had an SPD nadir of 0; in those receiving R-CHOP, this was 65% and 68%, respectively. In patients with high-risk MIPI, this effect was less evident, with only 47% of CR/CRu patients treated with VR-CAP achieving an SPD nadir of 0 versus 41% of CR/CRu patients who were treated with R-CHOP. For patients who achieved PR, there were very few individuals with an SPD nadir of 0 in each MIPI group. For comparison, response rates across all patients with high-risk MIPI were similar between the VR-CAP and R-CHOP groups (overall response rate: 81% versus 83%; CR: 24% versus 24%; CR+CRu: 34% versus 32%; PR: 47% versus 51%) but the depth of response appeared greater with VR-CAP (patients with SPD=0, CR: 64% versus 53% with R-CHOP; CR/CRu 47% versus 38%).
Discussion
In the LYM3002 study, despite similar overall response rates, VR-CAP resulted in improved outcomes (PFS, TTNT, DOR) compared with R-CHOP in newly-diagnosed patients with MCL.10 The findings of our post-hoc analysis suggest that this may be driven by a longer DOR and more profound disease elimination in those patients who received VR-CAP than in those who received R-CHOP, both overall and when stratified by response category. Within each response category, PFS, TTNT, and DOR were longer in patients receiving VR-CAP than in those receiving R-CHOP, and a greater proportion of patients became lesion-negative (SPD nadir of 0 for all measurable lesions), indicating that responses observed with VR-CAP were both longer and deeper than those observed with R-CHOP. However, these results should be interpreted with caution, because of the small sample sizes (16 patients per arm), the observation that CRu patients had a higher percentage of SPD nadirs of 0 and a longer DOR could be due to random variations. Of particular interest was the finding that results across all time-to-event outcomes in patients receiving VR-CAP who achieved PR were comparable to those seen in patients receiving R-CHOP who achieved CR/CRu.
Our analysis of response depth (based on the diameters of the lymph nodes chosen to be followed as measurable lesions by the independent radiology review committee and for which serial radiological measurements were provided) indicates that VR-CAP produced a deeper response than R-CHOP. In patients with PR, VR-CAP resulted in a higher rate of patients with an SPD of 0 compared with R-CHOP. Achievement of an SPD nadir of 0 suggests a better clearance of residual disease from the lymph nodes – a benefit that is likely to contribute to the observed longer remission duration – and was associated with improved PFS (Figure 5). Thus, although outcomes for lesion-negative PR patients were similar regardless of treatment (as were outcomes for lesion-positive PR patients) the longer PFS with VR-CAP versus R-CHOP in patients with PR is likely being driven by the higher percentage of lesion-negative patients. Although it appears counter-intuitive to have lesion-negative patients categorized as only partial responders, we highlight that the PR grouping here included patients who did not otherwise meet the criteria for CR/CRu. However, within the CR category, although being lesion-negative was again prognostic for improved outcomes versus lesion-positive CR, and although outcomes were similar in lesion-positive CR patients regardless of treatment, outcomes in lesion-negative CR patients were further enhanced in the VR-CAP group versus the R-CHOP group, a finding which suggests there may be other factors at play following treatment with VR-CAP, which could not be quantified here (as discussed further below).
Recalling that achievement of an SPD nadir of 0 was not a prerequisite for CR, these data introduce the concept that not all CR, by standard criteria/CT scanning, are equal. This suggests the need to use additional methodologies beyond radiology to further characterize the depth of complete remissions; however these methodologies were not used in this study. One such example is positron emission tomography CT scanning, which has improved the accuracy of disease staging in lymphoma over CT alone and is now considered the standard for response assessment in most lymphomas.14,15 When the LYM-3002 study was initiated, positron emission tomography CT was not a widely available technique and could not easily be applied to global studies, but may have provided improved methods of characterizing depth of response. Another example is determination of minimal residual disease. In an analysis by Pott et al. of two studies involving transplant-eligible and -ineligible patients with previously untreated MCL, molecular remission, defined as minimal residual disease negativity by quantitative polymerase chain reaction (sensitivity: 10−5) in both peripheral blood and bone marrow, was found to be an independent predictor of clinical outcome after combined immunochemotherapy.16 In the analysis by Pott et al., most patients received R-CHOP induction; other patients received rituximab, fludarabine and cyclophosphamide or alternating R-CHOP/R-DHAP (rituximab, high-dose cytarabine and cisplatin) induction. In contrast, Howard et al. found that the attainment of a molecular remission to R-CHOP was not predictive of PFS in previously untreated patients with MCL,6 noting that the criteria for molecular remission were slightly looser (disappearance of polymerase chain reaction-detectable disease in the peripheral blood or bone marrow). These data, in conjunction with our analysis, indicate the need for further refinement of characterization of response and the importance of incorporating new techniques into studies of this nature.
Since the initiation of the LYM-3002 study, another notable update to the response criteria has been the removal of the CRu category and its replacement in the IWRC11 and in the Lugano classification criteria with updated definitions of CR and PR.14 In acknowledgment of this update, we conducted an additional analysis investigating the DOR in which achievement of CR and CRu were considered separately. Long-term outcomes differed substantially when considering achievement of combined CR/CRu versus achievement of CR alone (Figure 3); thus, our work supports the elimination of CRu as a separate response category. Based on our analysis, grouping these patients under the PR category appeared more appropriate and may have more clinical relevance. This observation is of particular relevance for early clinical phase trials, in which response is often the primary endpoint, designed to characterize treatment effect of novel therapeutic approaches.
In the overall LYM-3002 analysis, the improvement in PFS with VR-CAP versus R-CHOP was seen across each MIPI risk grouping, although in high-risk patients this was not statistically significant.10 In the present analysis, the beneficial effect of VR-CAP in prolonging outcomes within each response category was predominantly seen in low-and intermediate-risk MIPI patients, and was less striking in the high-risk group. This may be driven by the greater proportion of CR/CRu patients receiving VR-CAP across the MIPI groupings who became lesion-negative by SPD assessment. It would be interesting to further investigate the biological drivers behind this observation – what are the differential characteristics of MIPI high-risk disease that result in lower rates of lesion-negative CR and that obviate the improved outcomes seen with VR-CAP versus R-CHOP in these patients in other MIPI categories? For example, is it possible that patients with high-risk MIPI status have more rapidly proliferative disease, and thus the deeper response achieved with VR-CAP versus R-CHOP does not translate into substantially improved outcomes due to rapid disease return? Such findings support the suggestion of Dreyling that future studies should address the goal of personalized medicine.17
Since commencement of our study, maintenance treatment with rituximab has become the standard of care for the treatment of newly-diagnosed, elderly patients with MCL,4,17 and conceivably the use of VR-CAP with rituximab maintenance therapy could further prolong PFS. In addition, newer regimens showing enhanced efficacy relative to R-CHOP have since been introduced;18,19 a further study comparing VR-CAP with these combinations may be warranted, and in reference to the availability of newer and more sensitive methods of detecting disease elimination, should include analysis of depth of response, relationship of response categories and long-term outcomes. Tailoring therapies to different ‘types’ or stages of disease (e.g. patients with high-risk MIPI) could perhaps also be considered.
In conclusion, this post-hoc analysis of the association between the improved outcomes and quality of responses achieved with VR-CAP versus R-CHOP in the LYM-3002 study suggests a longer duration and better quality of response in VR-CAP versus R-CHOP patients, which was more evident in patients with low- and intermediate-risk MIPI. In addition, the results suggest that the extent of disease elimination, rather than the category of achieved response, may be a better predictor of treatment outcomes in patients with newly diagnosed MCL. In an era of an increasing number of regimens being developed in MCL, additional approaches should therefore be incorporated in clinical trial designs to further define the quality of responses.
Supplementary Material
Acknowledgments
The authors would like to acknowledge Olga Samoilova for her contribution to collecting data for the LYM-3002 study. The authors would also like to acknowledge Catherine Crookes of FireKite, an Ashfield company, part of UDG Healthcare plc, for writing assistance during the development of this manuscript, which was funded by Millennium Pharmaceuticals, Inc. and Janssen Global Services, LLC.
Footnotes
Check the online version for the most updated information on this article, online supplements, and information on authorship & disclosures: www.haematologica.org/content/102/5/895
Prior presentation
Some of the data published here were presented in poster form at the 13th International Conference on Malignant Lymphoma, Lugano, Switzerland, June 17–20, 2015: Verhoef G, Robak T, Huang H, et al. Association between quality of response and outcomes in patients with newly diagnosed mantle cell lymphoma receiving VR-CAP versus R-CHOP in the phase 3 LYM-3002 study.
References
- 1.Howlader N, Noone A, Krapcho, et al. SEER Cancer Statistics Review, 1975–2012, National Cancer Institute, Bethesda, MD. Based on November 2014 SEER data submission, posted to the SEER website, April 2015. Available at: http://seer.cancer.gov/csr/1975_2012/ (Accessed July 2015).
- 2.Smith A, Crouch S, Lax S, et al. Lymphoma incidence, survival and prevalence 2004–2014: sub-type analyses from the UK’s Haematological Malignancy Research Network. Br J Cancer. 2015;112(9):1575–1584. [DOI] [PMC free article] [PubMed] [Google Scholar]
- 3.Zhou Y, Wang H, Fang W, et al. Incidence trends of mantle cell lymphoma in the United States between 1992 and 2004. Cancer. 2008;113(4):791–798. [DOI] [PubMed] [Google Scholar]
- 4.Dreyling M, Thieblemont C, Gallamini A, et al. ESMO Consensus Conferences: guidelines on malignant lymphoma. part 2: marginal zone lymphoma, mantle cell lymphoma, peripheral T-cell lymphoma. Ann Oncol. 2013;24(4):857–877. [DOI] [PubMed] [Google Scholar]
- 5.McKay P, Leach M, Jackson R, Cook G, Rule S. Guidelines for the investigation and management of mantle cell lymphoma. Br J Haematol. 2012;159(4):405–426. [DOI] [PubMed] [Google Scholar]
- 6.Howard OM, Gribben JG, Neuberg DS, et al. Rituximab and CHOP induction therapy for newly diagnosed mantle-cell lymphoma: molecular complete responses are not predictive of progression-free survival. J Clin Oncol. 2002;20(5):1288–1294. [DOI] [PubMed] [Google Scholar]
- 7.European Medicines Agency. European Medicines Agency. VELCADE® (bortezomib). Summary of Product Characteristics (updated February 2014). Available at: http://www.ema.europa.eu/docs/en_GB/document_library/EPAR_-_Product_Information/human/000539/WC500048471.pdf (Accessed July 2015). 2014.
- 8.Millennium Pharmaceuticals Inc. VEL-CADE® (bortezomib) for injection: for subcutaneous or intravenous use. Full prescribing information. October 2014, Revision 17. Available at: http://www.velcade.com/files/PDFs/VELCADE_PRESCRIBING_INFORMATION.pdf (Accessed July 2015).
- 9.Japanese Pharmaceuticals and Medical Devices Agency. List of approved products FY 2015. https://www.pmda.go.jp/files/000208993.pdf.
- 10.Robak T, Huang H, Jin J, et al. Bortezomib-based therapy for newly diagnosed mantle-cell lymphoma. N Engl J Med. 2015; 372(10):944–953. [DOI] [PubMed] [Google Scholar]
- 11.Cheson BD, Pfistner B, Juweid ME, et al. Revised response criteria for malignant lymphoma. J Clin Oncol. 2007;25(5):579–586. [DOI] [PubMed] [Google Scholar]
- 12.Hoster E, Dreyling M, Klapper W, et al. A new prognostic index (MIPI) for patients with advanced-stage mantle cell lymphoma. Blood. 2008;111(2):558–565. [DOI] [PubMed] [Google Scholar]
- 13.Hoster E, Klapper W, Hermine O, et al. Confirmation of the mantle-cell lymphoma International Prognostic Index in randomized trials of the European Mantle-Cell Lymphoma Network. J Clin Oncol. 2014;32(13):1338–1346. [DOI] [PubMed] [Google Scholar]
- 14.Cheson BD, Fisher RI, Barrington SF, et al. Recommendations for initial evaluation, staging, and response assessment of Hodgkin and non-Hodgkin lymphoma: the Lugano classification. J Clin Oncol. 2014; 32(27):3059–3068. [DOI] [PMC free article] [PubMed] [Google Scholar]
- 15.Juweid ME, Wiseman GA, Vose JM, et al. Response assessment of aggressive non-Hodgkin’s lymphoma by integrated International Workshop Criteria and fluorine-18-fluorodeoxyglucose positron emission tomography. J Clin Oncol. 2005;23(21):4652–4661. [DOI] [PubMed] [Google Scholar]
- 16.Pott C, Hoster E, Delfau-Larue MH, et al. Molecular remission is an independent predictor of clinical outcome in patients with mantle cell lymphoma after combined immunochemotherapy: a European MCL intergroup study. Blood. 2010; 115(16):3215–3223. [DOI] [PMC free article] [PubMed] [Google Scholar]
- 17.Dreyling M. Haematological cancer: bortezomib in MCL–new standard of care or just another option? Nat Rev Clin Oncol. 2015;12(7):376–378. [DOI] [PubMed] [Google Scholar]
- 18.Frosch Z, Luskin MR, Landsburg DJ, et al. R-CHOP or R-HyperCVAD with or without autologous stem cell transplantation for older patients with mantle cell lymphoma. Clin Lymphoma Myeloma Leuk. 2015;15(2):92–97. [DOI] [PubMed] [Google Scholar]
- 19.Rummel MJ, Niederle N, Maschmeyer G, et al. Bendamustine plus rituximab versus CHOP plus rituximab as first-line treatment for patients with indolent and mantle-cell lymphomas: an open-label, multicentre, randomised, phase 3 non-inferiority trial. Lancet. 2013;381(9873):1203–1210. [DOI] [PubMed] [Google Scholar]
Associated Data
This section collects any data citations, data availability statements, or supplementary materials included in this article.


